GeoSAR (Geographic Synthetic Aperture Radar)
Airborne Sensors
GeoSAR (Geographic Synthetic Aperture Radar)
GeoSAR is an airborne state-of-the-art, dual-band (P-band and X-band), dual-sided, single-pass interferometric mapping radar, designed to efficiently map wide-area, both top vegetation canopies and the terrain beneath the canopy. The U. S. GeoSAR system was developed as a joint effort of NASA/JPL (Jet Propulsion Laboratory) and Fugro EarthData under the sponsorship of DARPA (Defense Advanced Research Projects Agency) and NGA (National Geospatial-Intelligence Agency).
The GeoSAR project started in 1996 by a consortium consisting of NASA/JPL, Fugro EarthData (a commercial company, formerly Calgis of Fresno, CA), and the California Department of Conservation with funding provided by DARPA. The two main objectives of the GeoSAR program are:
1) to develop a state of the art dual frequency interferometric radar mapping instrument capable of mapping the true ground surface height beneath the vegetation canopy
2) to transition this mapping technology to a commercial company. — The GeoSAR system was commercialized in 2002 and is now operated solely by Fugro EarthData Inc. with HQs in Frederick, MD, USA.
The overall mission goals are: 1) 2)
• Develop precision foliage penetrating mapping technology based upon dual-frequency interferometric radar.
• Provide military and civilian users with a significant increase in mapping technology.
• Produce true ground surface elevation models suitable for military and civilian applications.
GeoSAR development: 3)
JPL, the technical lead of GeoSAR, had the following program deliverables at program completion:
• radar design and radar hardware for X-band (3 cm) and P-band (83 cm) radars
• processor software, hardware and documentation
• calibrated X-band radar
Mapping System Requirements
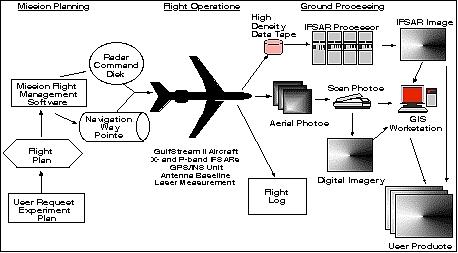
The mapping system consists of:
• Aircraft platform to host data collection hardware (Gulfstream II)
• Flight planning software
• Dual frequency (X-band/P-band ) interferometric SARs
- Single polarization @ X-band
- Dual polarization @ P-band. Note: The P-band is within the UHF range of the spectrum.
- Automated radar control
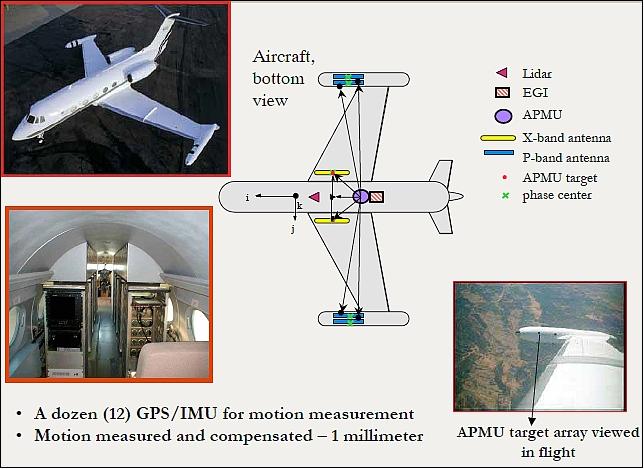
• Laser interferometric baseline measurement system augmented with embedded GPS/INU systems and differential GPS for precision reconstruction of aircraft flight trajectory and attitude history
• SAR processors capable of producing DEMs @ X-band and P-band and a true ground surface DEM (Digital Elevation Model) from combined X-band/P-band analysis.
• A GIS system to analyze digital data.
JPL designed the GeoSAR system and Fugro EarthData integrated it into the aircraft and developed a highly automated production center for processing the data.
Sensor Complement
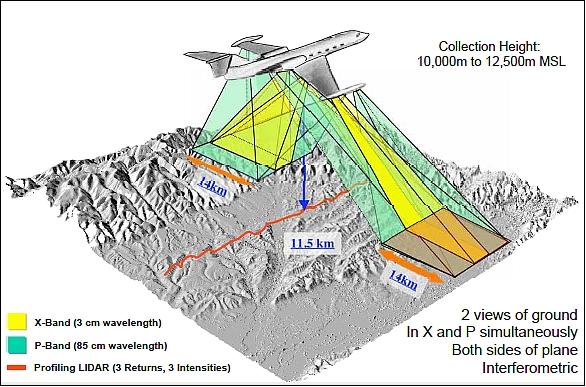
The radar hardware onboard the Gulfstream-II aircraft is supplemented with a LBMS (Laser-Baseline Measurement System) which provides real-time measurements of the antenna baselines in a platform based coordinate system which is tied to onboard EGI (Embedded GPS/INU) units. - At a flight altitude of 11.5 km, GeoSAR maps a 28 km swath by collecting two 14 km swaths on the right and left sides of the plane as shown in Figure 2.
The P-band antenna system is mounted in the port and starboard wingtip pods providing a long antenna-baseline of about 20 m. X-band antennas are mounted in pairs under the fuselage with an antenna-baseline of 2.5 m. Radar operations are controlled by a command disk generated preflight by the Mission Planning Software. Realtime data collection is controlled in-flight via an ARC (Automatic Radar Controller) that sets data collection windows, performs BITs (Built-In Test) before and after each data take, and automatically turns the radar on and off during a data acquisition. Raw radar data is recorded on high-density digital tape recorders for subsequent, post-flight processing. 4)
The onboard data collection via the Automatic Radar Controller also records navigation data from the aircraft’s GPS/INU system, the laser-based antenna-baseline measurement system, and raw signal data from the X-band and P-band radars.
Parameter | X-band | P-band |
Peak transmit power | 8 kW | 4 kW |
Pulse length | 40 µs | 40 µs |
Wavelength at center frequency | 3 cm | 86 cm |
Center frequency | 9.70 GHz | 350 MHz |
Bandwidth | 80/160 MHz | 80/160 MHz |
Antenna gain at boresight | 26.5 dBi | 11 dBi |
Look angle range | 22º to 60º | 22º to 60º |
Polarization | VV | HH & HV or VV & VH |
Antenna baseline length | 2.5 m | 20 m |
Platform altitude range | 5-13.5 km | 5-13.5 km |
GeoSAR product characteristics | ||
DEM height accuracy | 0.5-1.2 m (relative) | 1-3 m (relative) |
Planimetric accuracy (1σ) | 2.5 m (absolute) | 2 m @ 5 km altitude (absolute) |
Ground swath width | 12-14 km on each side | 12-14 km on each side |
Pixel size | 1.25-3 m | 1.25-5 m |
Fugro’s objective in developing the GeoSAR system was to create a cost-effective mapping tool that would give the customer base accurate and detailed geospatial data of areas where using conventional mapping techniques was either impossible or cost-prohibitive.
In the timeframe 2000-2002, Fugro transitioned GeoSAR from research and development into commercial operations when the NOAA's (National Oceanic and Atmospheric Administration’s) Coastal Services Center contracted Fugro EarthData to provide GeoSAR data in Southern California. Since then, several of the world’s premier mapping organizations have relied on Fugro to acquire GeoSAR data throughout the world. 6) 7)
Flown on a Gulfstream-II jet aircraft, GeoSAR maps swaths simultaneously on both sides of the aircraft to generate high quality DEMs and imagery at both X-band and P-band. The system was augmented with a modified Leica ALS40 nadir-pointing LiDAR (Light Detection and Ranging) profiler system to measure highly accurate ground control points that are used during production of large area mosaics and as validation control with a vertical accuracy of better than 30 cm from altitudes up to 13,000 m. 8) 9)
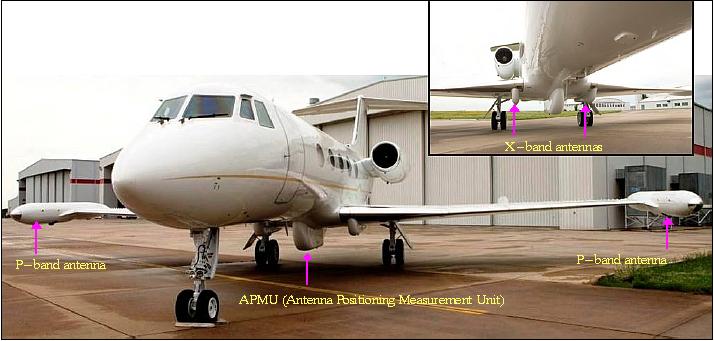
Legend to Figure 3: The P-band antennas are installed in the fairings on each wingtip, while the X-band antennas are in fairings under the wings near the fuselage (insert).
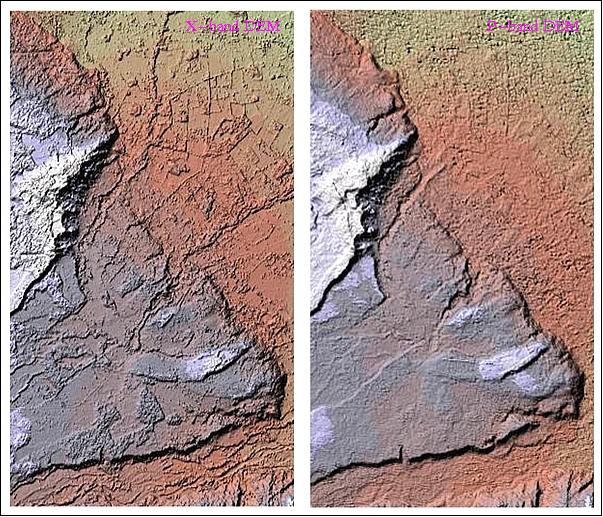
The GeoSAR X-band and P-band data is coregistered, which creates additional geographic information extraction potential. The P-band data has proven to be an excellent source for identifying roads, hidden power lines, obscured fence lines, for mapping slopes and drainage features, and for analyzing other terrain obscured by clouds and foliage. Because of its sensitivity to water, the P-band data provides information on soil moisture or on subsurface features in arid soils.
GeoSAR’s dual-sided configuration enables collection of multiple overlapping swaths of data with opposing looks. As a result, each point on the ground is usually imaged four times, from two GeoSAR’s X-band radar, while providing only a tree top return in forested areas, provides rich textural information in open areas, because of the interaction of the radar signal with the varying roughness and dielectric properties of the different types of land cover (Ref. 9).
In the P-band signal, open fields are often very dark because the scale of the roughness of the fields is smaller than the 85 cm wavelength of the radar. In the case of P-band, the field acts like a mirror, scattering very little energy and thus returning very little energy back to the sensor. For this reason, the P-band DEM in open fields is often very noisy, or absent altogether. As such, for large project areas with mixed land cover, the ideal GeoSAR-derived DEM will combine the X- and P-band data.
The differential penetration of the X-band and P-band is illustrated in Figure 5. The false-color image was created with an RGB combination of the X, P, and P-minus-X images. The forested regions appear green in this false-color image. The red, green, and blue lines are transects through the X-band and P-band digital surface models, which are plotted to the right of the image. The data show a differential penetration of between 5 m and 25 m in various parts of the forest, while the terrain surfaces estimated by the two radar wavelengths track each other more closely in open fields.
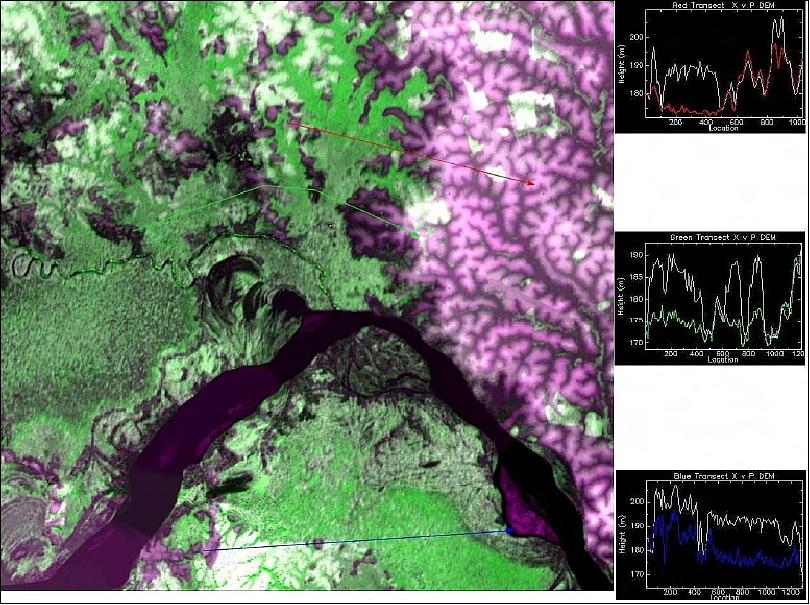
Legend to Figure 5: The forested regions tend to appear as green. The transects marked in red, green, and blue demonstrate the differential penetration through the forest of the X-band radar, which tracks the top of the canopy, and the P-band radar, which penetrates the canopy. 10)
Mission Status
Only a few examples of the GeoSAR campaigns, conducted by Fugro EarthData Inc. during the past decade, are listed here to demonstrate the capabilities of the airborne GeoSAR system. The GeoSAR system has demonstrated the ability to collect and process wide area SAR imagery and digital elevation models for mapping.
GeoSAR, integrated onto a Gulfstream II business jet which is owned by Fugro EarthData, is capable of collecting data from 13 km AGL (Above Ground Level) at an airspeed of over 400 knots, yielding a net collection rate of 288 km2/minute of high resolution imagery. These data are well suited for developing useful GIS (Geographic Information System) tools such as DEMs (Digital Elevation Models), ORIs (Orthorectified Images), and TLMs (Topographic Line Maps).
Overall, the GeoSAR program represents a very successful cooperation between government and commercial interests to produce dual-use mapping capability for both military and civil purposes. The GeoSAR system matured from a one-off experimental system into a production system with commercial throughput and reliability expectations. The avenue chosen by Fugro EarthData was to envelop the unique GeoSAR processing algorithms into the GeoCue enterprise workflow management system. 11)
Latour Test Campaign in Nov. 2000
Latour is a 9000 acre forest owned and operated by the California Department of Forestry and Fire Protection. About half of Latour forest is true fir, meaning 80% of the trees in those stands are red fir or white fir. The remainder is sierra mixed conifer. Of particular interest are several single age stands where all of the trees are of approximately the same age and size. Trees on site are second growth with heights less than 50 m (Ref. 4).
The primary goals of the Latour experiment were to:
• Determine how well the P-band radar system penetrates foliage.
• Conduct phenomenology studies of X-band and P-band interferometry in a coniferous forest canopy and study the use of correlation measurements to correct to the true ground surface height.
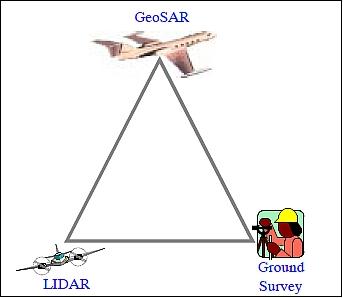
• Cross compare the radar, LIDAR, and ground survey measurements of bare surface elevations and canopy parameters as illustrated in Figure 6.
• Determine if LIDAR measurements over a sparse set of points can be used to refine the radar bare surface elevation estimates.
Radar data at Latour were collected on four consecutive flight days in November, 2000. Each mission collected 12-15 flight lines approximately 60 km in length from a flying altitude of 9750 m.
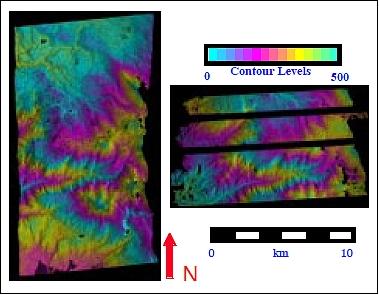
Legend to Figure 7: The data were processed with a 5 m posting and coregistered with the LIDAR and ground truth data for analysis.
The Latour data collection provided the first opportunity to test the GeoSAR P-band radar in a vegetated region. GeoSAR’s ability to transmit notched waveforms and algorithms for removing RFI were key elements for successfully collecting and processing P-band data. Comparison of P-band and X-band height measurements with the extensive ground truth measurements has shown that P-band penetrates approximately 10-15 m deeper into a coniferous forest canopy than X-band and that P-band HH interferometric height measurements do not directly measure the true ground surface. Initial studies using the correlation data from the dual P-band baselines and the X-band show promise for correcting the height measurements to the true ground surface (Ref. 4).
Southern California GeoSAR Campaign
In 2002, NOAA contracted Fugro EathData to obtain GeoSAR products for California's counties of: Santa Barbara, Ventura, Los Angeles, Orange, and San Diego, plus the Channel Islands. NOAA, in collaboration with the Southern California Coastal Water Research Project, needed geospatial data to complete hydrologic modeling, watershed delineation, water quality assessment, and other analyses in their efforts to protect Southern California's coastal environment. 12)
This campaign represented Fugro's first commercial project. A total area of 38,000 km2 (14,844 square miles) of Southern California was imaged. Fugro provided high-accuracy geospatial data in support initiatives to protect the area's coastal environment. GeoSAR's single-pass simultaneous interferometric collection of X- and P-band radar data yielded deliverables that included X-band digital elevation models (DEMs) and magnitude imagery, plus height error layers, void masks, water masks, and 8-bit raster magnitude imagery for use in hydrologic modeling, watershed delineation, water quality assessment, and other analyses. 13) 14)
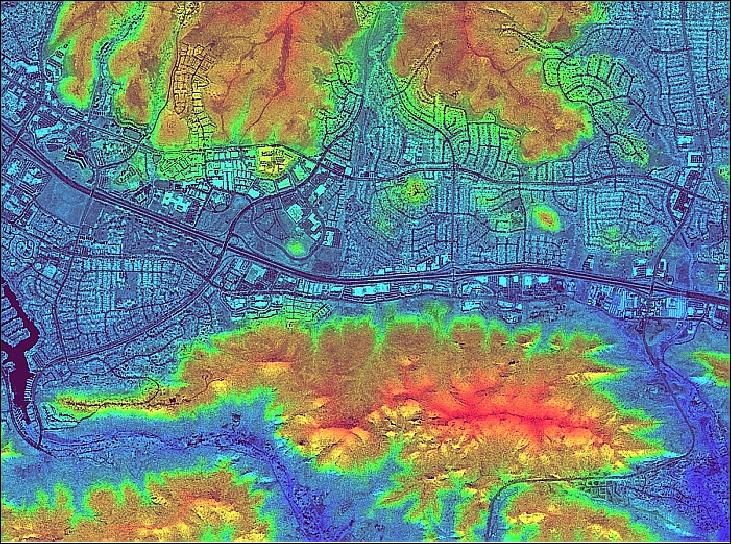
Legend to Figure 8: In this dataset, an X-band magnitude image is merged with an X-band colorized DEM.
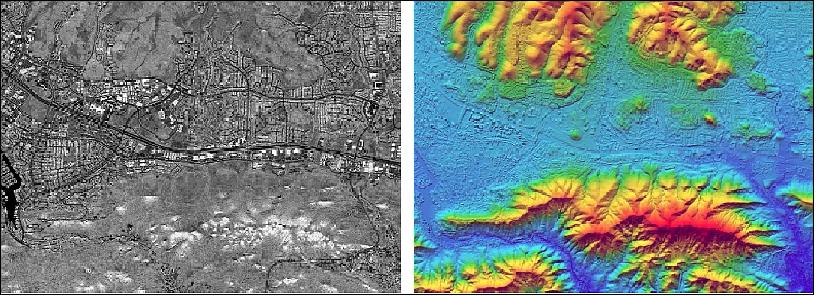
Legend to Figure 9: The X-band magnitude image (left) reveals clearer details for cultural and natural features such as roads, buildings, and vegetation-covered areas; terrain characteristics are not so apparent. The colorized X-band DEM (right) shows terrain details, such as hydrologic features, aspects, and slopes, but less detail for cultural features.
Columbia Missions
Since 2003, several GeoSAR missions in Columbia (South America) produced, in total, more than 250,000 km2 of delivered data for the X-band and the P-band. At a redundant collection rate of at least 4:1 in each band, the acquisition involved more than 1,200,000 km2 of acquired and processed data. 15)
GeoSAR acquired imagery over terrain ranging from the coastal Pacific plains to the Andes Mountain Range and from urban settings to triple-canopy jungle. Ground control for each collection area consisted of one radar reflector near the area and up to two strategically placed GPS base stations, with ancillary photoidentifiable points supplying additional control as needed.
Columbian agencies provided in-country logistical support, while project personnel working with Fugro EarthData completed mission planning, utilizing data of the DRTM (Shuttle Radar Topographic Mission) to support flight planning.
GeoSAR deliverables for the project included X-band (3 m- post spacing) and P-band (5 m post spacing) DEMs and orthirectified radar images. The data supports derivative products that include slant plane imagery (high-resulution single look, ~ 0.65 m) and variations suitable for terrain modeling, imagery analysis, and derived imagery products.
SDMI (Alaska Statewide Digital Mapping Initiative)
Under this USGS (United States Geological Survey) contract, GeoSAR acquired data over an area of Alaska in July 2010 (in 2010, about 10% of the state was collected using airborne IFSAR). 16)
The primary goals are to acquire new and better maps for Alaska and to make existing map products more easily available. The SDMI seeks to make ongoing improvements to Alaska maps on a broad, statewide scale. Alaska is the only state in the nation lacking current, accurate, high-resolution maps. This hampers economic growth and presents risks to public safety. Resource management and economic development require a strong mapping foundation; emergency preparedness and readiness for disaster recovery depend on accurate location information. 17) 18)
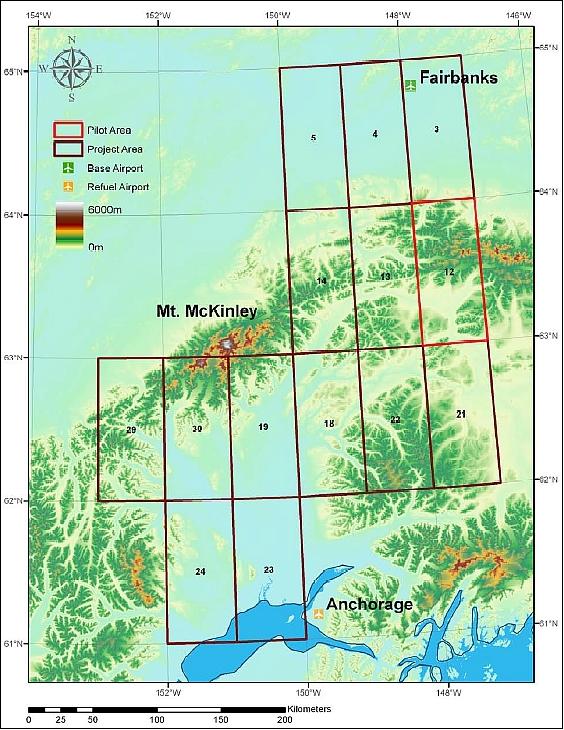
Legend to Figure 11: The numbers refer to the priority of 1 degree cells given by the USGS.
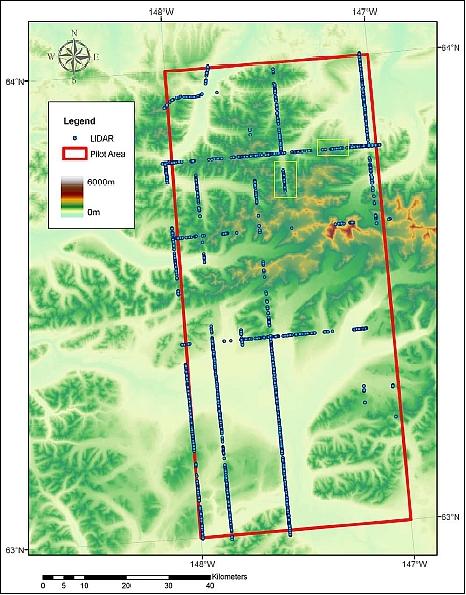
LiDAR points used for product quality assessment. The GeoSAR profiling LiDAR is a powerful tool to assess the horizontal and vertical accuracy of the delivered products. The LiDAR is designed to have a repeat precision of better than 30 cm vertical (1σ). The LiDAR footprint is 3-5 m, depending on height above the terrain, and the sample density is approximately 3 cm, with 3 returns and 3 intensities. The horizontal accuracy (RMSE) of the LiDAR is about half the footprint.
Deliverable products are the DTM (Digital Terrain Model), DSM (Digital Surface Model) and ORI (Orthorectified Radar Imagery). The main product is the DTM with 6 m equivalent contour accuracy, corresponding to RMSEz = 1.85 m and RMSEr = 8.03 m (5.6 m in Northing and Easting) for the vertical and horizontal accuracy, respectively. The data are delivered in Alaska Albers projection with 5 m post spacing, and in HRTe3 (High Resolution Terrain elevation level 3 = 10 m) format in geographic projection. The elevation values are orthometric height, using the NGS Geoid09 model, and hydrologically enforced (rivers monotonically flowing down and lakes flattened, size > 50 m x 150 m). These products will become public domain, when published by the USGS in the NED (National Elevation Dataset).
Product | Description | GeoSAR observations |
DTM (Digital Terrain Model) | - Geoid09 orthometric heights | - P-band and X-band interferometry |
DSM (Digital Surface Model) | - Geoid09 orthometric heights | - Based on X-band interferometry |
ORI (Orthorectified Radar Magnitude Imagery) | - Multiple view directions average | - X-band |
Masks (Quality Masks) | - Hydrology, voids, fills, slope category | - P-band and X-band |
Meta | - Meta information | - FDSC complement |
A point on the ground is typically observed from four different directions (either from the left or right), each in four different interferometric modes (X-band and P-band, in Single-Antenna-Transmit and Ping-Pong mode), leading to 16 possible elevation estimations per pixel. The sketched nadir-looking profiling LiDAR provides independent ground control of the terrain directly below the flight path.

References
1) Scott Hensley, Kevin Wheeler, Andy Berkun, Walt Brown, Elaine Chapin, Adam Freedman, Gary Hamilton, Peter Kroger, Charles Le, Thierry Michel, Delwyn Moller, Joe Okonek, Ernest0 Rodriguez, Paul Siqueira, Robert Somoano, Tommy Thompson, Bob Treuhaft, Jakob Van Zyl, Charles Werner , Muh Yan, “First Results From the GeoSAR Mapping Instrument,” URL: http://trs-new.jpl.nasa.gov/dspace/bitstream/2014/17023/1/99-0442.pdf
2) “GeoSAR: Geographic Synthetic Aperture Radar,” URL: http://southport.jpl.nasa.gov/html/projects/geosar/geosar.html
3) Kevin Wheeler, Scott Hensley, “The GeoSAR Airborne Mapping System,” May 7, 2000, URL: http://trs-new.jpl.nasa.gov/dspace/bitstream/2014/13977/1/00-0356.pdf
4) Scott Hensley, Elaine Chapin, Adam Freedman, Charles Le, Soren Madsen, Thierry Michel, Ernesto Rodriguez, Paul Siqueira, Kevin Wheeler, “First P-Band Results Using the GeoSAR Mapping System,” IGARSS 2001, Sydney, Australia, July 9-13, 2001, URL: http://trs-new.jpl.nasa.gov/dspace/bitstream/2014/12607/1/01-0852.pdf
5) Bill Sharp, “Introduction to the New GeoSAR Interferometric Radar Sensor,” URL: http://www.nps.edu/.../Fugro_GeoSAR.pdf
6) “GeoSAR Mapping: - A New Perspective on the Earth,” Fugro, 2010, URL: [web source no longer available]
7) “Topographic Mapping with GeoSAR,” URL: [web source no longer available]
8) Kevin P. Corbley, “GeoSAR - Making Mapping the ‘Impossible’ Possible,” GEO Informatics, Vol. 13, No 4, June 2010
9) Thomas M. Carson, “Topographic Mapping in the Equatorial Belt using Dual-Frequency Airborne IFSAR (GeoSAR),” PE&RS (Photogrammetric Engineering & Remote Sensing), Vol. 74, August 2008
10) Steven Shaffer, “Using ArcGIS for Radar Analysis and Map Production for USDA NAIP Test Program,” Esri (Environmental Systems Research Institute) International User Conference, San Diego, 2008, URL: http://proceedings.esri.com/library/userconf/feduc08/papers/453.pdf
11) Lewis Graham , Jake Jenkins, “Integrating Large Systems - A Case Study,” URL: http://www.geocue.com/workflow/may08_customproduction.pdf
12) Southern California GeoSAR - Ground-breaking project in support of coastal environment preservation,” URL: [web source no longer available]
13) URL: [web source no longer available]
14) _Marc S. Cheves, “Earth Data International,” The American Surveyor, July-August 2004, URL: http://www.amerisurv.com/PDF/TheAmericanSurveyor_EarthDataPt3_July-August2004.pdf
15) “GeoSAR Mapping in Columbia - Exclusive GeoSAR radar mapping system overcomes multiple obstacles,” URL: [web source no longer available]
16) Bert Kampes, Megan Blaskovich, James. J. Reis, Mark Sanford, Kevin Morgan, “GeoSAR Airborne RADAR Results for the Alaska Statewide DEM Project,” 10th Annual JACIE ( Joint Agency Commercial Imagery Evaluation) Workshop, March 29-31, 2011, Boulder CO, USA, URL: http://calval.cr.usgs.gov/JACIE_files/JACIE11/Posters/11.055_Kampes_JACIE2011_poster_FINAL.pdf
17) “Alaska Mapped and the Statewide Digital Mapping Initiative,” March 10, 2011, URL: http://www.alaskamapped.org/
18) Russ Cowart, Jill Mamini, Selima Siddiqui, “Alaska Statewide Digital Mapping Initiative,” ASP 10-07-075, June 2, 2009, Final Version V.2.3.1, URL: [web source no longer available]
The information compiled and edited in this article was provided by Herbert J. Kramer from his documentation of: "Observation of the Earth and Its Environment: Survey of Missions and Sensors" (Springer Verlag) as well as many other sources after the publication of the 4th edition in 2002. Comments and corrections to this article are always welcome for further updates (eoportal@symbios.space).