Mars Express
Exploration
Mars Express Mission
Mars, our most Earth-like planetary neighbour, beckons. Its pristine and diverse surface, equal in area to Earth’s land surface, displays a long and fascinating history, punctuated by impact events, volcanism, tectonics, and aeolian, fluvial and glacial erosion. A century ago, astronomers believed they were witnessing the last attempts of a dying martian civilisation to cope with the devastating effects of climate change. The notion of an intelligently inhabited Mars was later dispelled, but the expectation that simple life forms could have survived persisted. Today, after sending robotic missions to Mars, our view of the planet retains some striking similarities to those earlier romantic conjectures. 1)
We know from orbiting spacecraft that Mars has undergone dramatic climatic and geologic changes. Water coursing over its surface in the distant past left dramatic evidence in deeply carved channels and fluvial networks. Yet today we find the planet is cold and dry. There is no evidence so far that life exists there now, but primitive life during Mars’ warmer, wetter past is a real possibility. So, mysteries remain: how did our Earth-like neighbour arrive at its present parched, cold and almost airless state? Did life evolve and then die out? Did it leave a fossil record? Last but not least, can the changes experienced by Mars teach us something about the dramatic changes being predicted for our own planet?
These and other questions have spurred scientists and engineers to meet the enormous challenge of sending missions to Mars. A Mars-bound spacecraft must survive journeys of more than 6 months, approach the planet from just the right angle and at the right speed to enter orbit, and then operate successfully to return valuable observations. Some missions have failed, but the successes have more than repaid the effort and risk. Our knowledge about Mars has grown dramatically with every successful visit. Four decades of space-based observations have produced more information and knowledge than earlier astronomers with Earth-bound telescopes could have imagined.
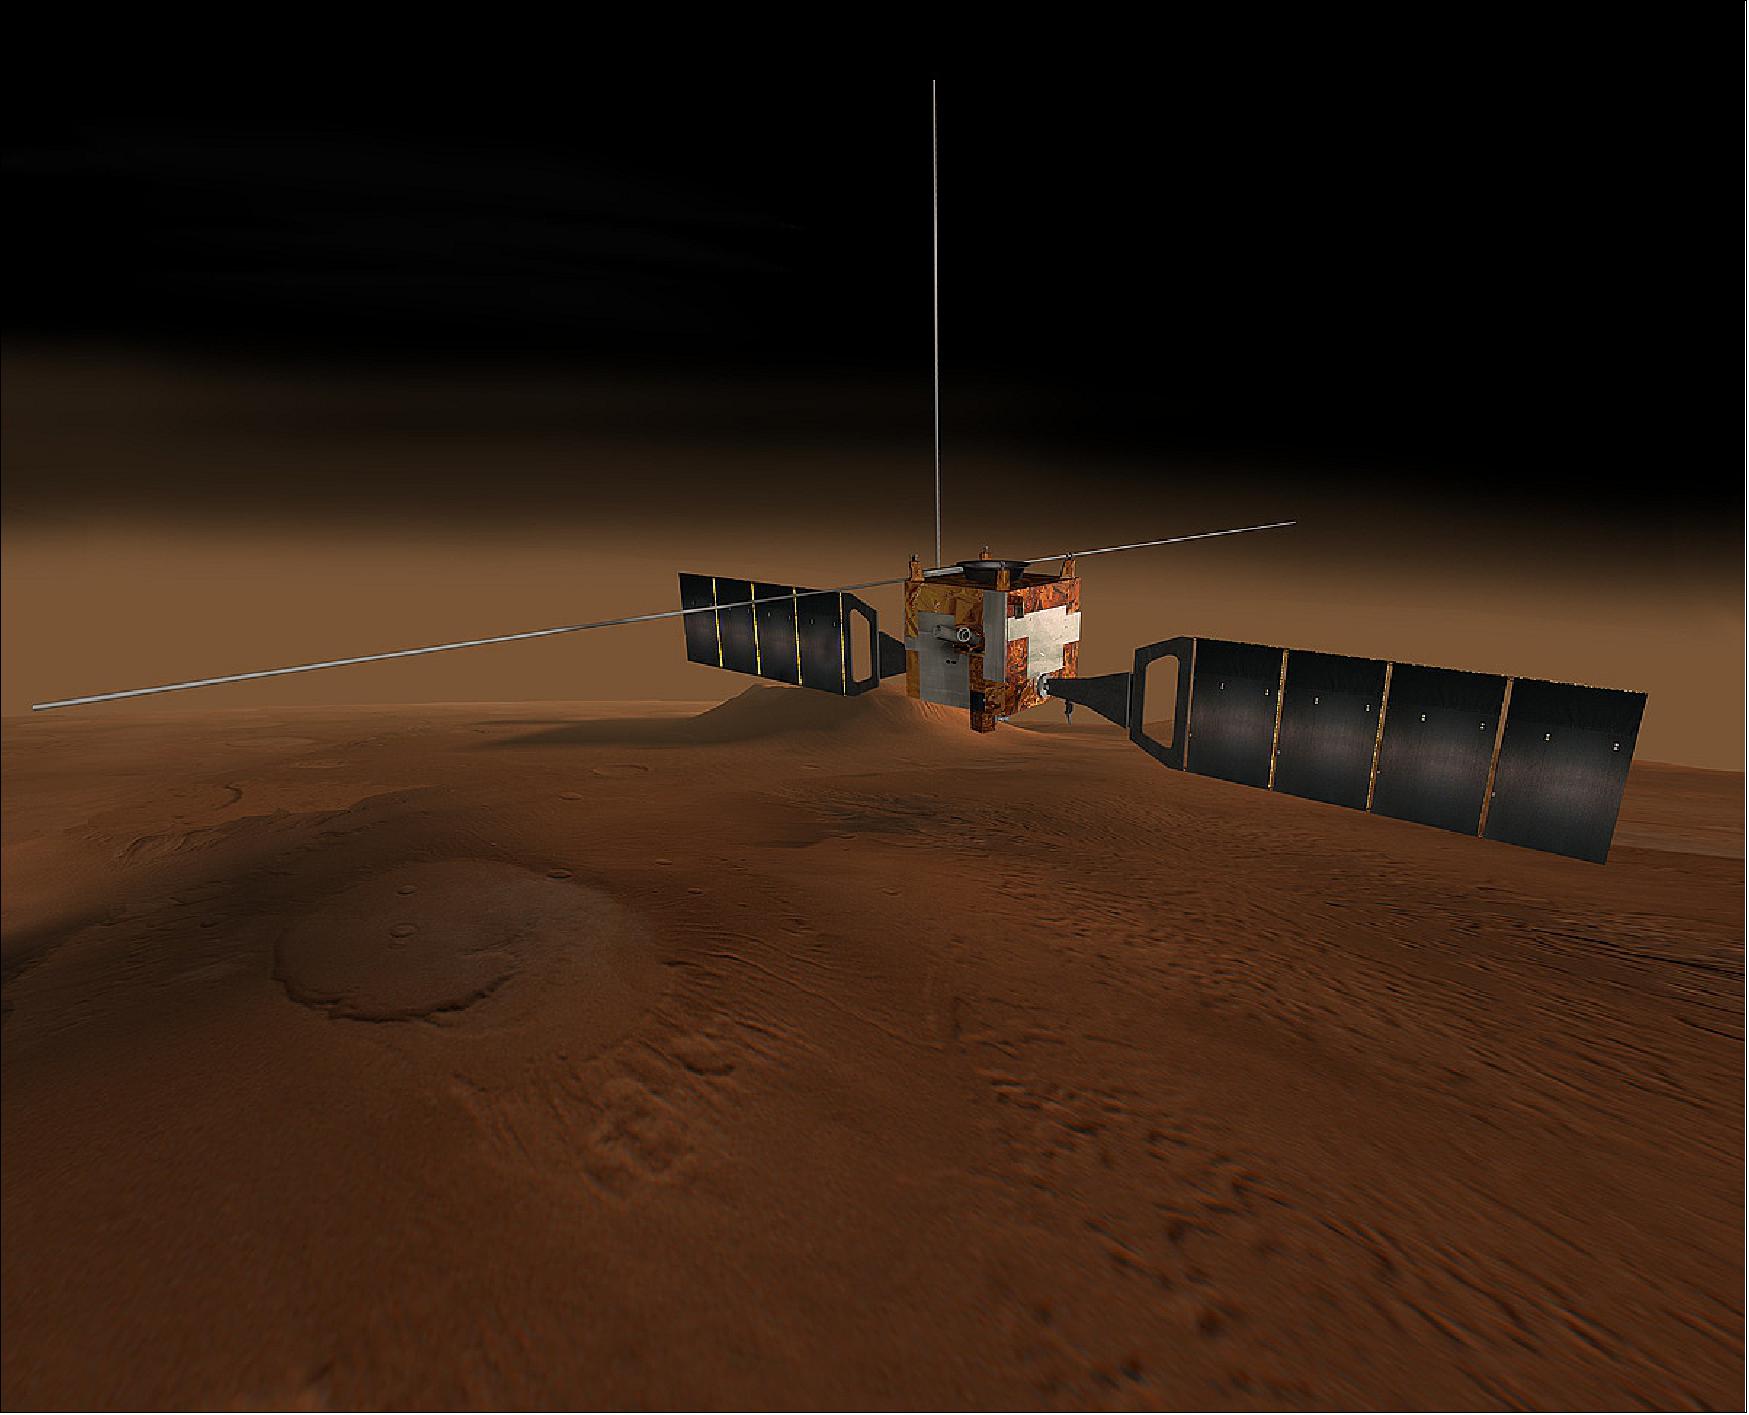
Mars Express is a space exploration mission of ESA (European Space Agency), Europe’s first mission to the Red Planet. Mars Express is so called because it was built more quickly than any other comparable planetary mission. Beagle 2 was named after the ship in which Charles Darwin sailed when formulating his ideas about evolution.
The Mars Express mission is dedicated to the orbital (and originally in-situ) study of the interior, subsurface, surface and atmosphere, and environment of the planet Mars. The scientific objectives of the Mars Express mission represent an attempt to fulfill in part the lost scientific goals of the Russian Mars 96 mission, complemented by exobiology research with Beagle 2. Mars exploration is crucial for a better understanding of the Earth from the perspective of comparative planetology. The mission's main objective is to search for subsurface water and deploy a lander onto the Martian surface.
It carries seven instruments and deployed a lander, Beagle 2. The lander was lost during its attempt to reach the planet’s surface but the orbiter continues its highly successful on-going global investigation of Mars and its two moons, Phobos and Deimos.
ESA provided the launcher, orbiter and operations, while the instruments were provided by scientific institutions through their own funding.
Scientific Objectives
The Mars Express orbiter is the core of the mission, scientifically justified on its own merit by providing unprecedented global coverage of the planet, in particular of the surface, subsurface and atmosphere. Beagle 2 was selected through its innovative scientific goals and very challenging payload. The combination of orbiter and lander was expected to be a powerful tool to focus on two related issues: the current inventory of ice or liquid water in the martian crust, and possible traces of past or present biological activity on the planet. The broad scientific objectives of the orbiter are:
- global color and stereo high-resolution imaging with about 10 m resolution and imaging of selected areas at 2 m pix–1;
- global IR mineralogical mapping of the surface;
- radar sounding of the subsurface structure down to the permafrost;
- global atmospheric circulation and mapping of the atmospheric composition;
- interaction of the atmosphere with the surface and the interplanetary medium;
- radio science to infer critical information on the atmosphere, ionosphere, surface and interior.
The ultimate scientific objective of Beagle 2 was the detection of extinct and/or extant life on Mars, a more attainable goal being the establishment of the conditions at the landing site that were suitable for the emergence and evolution of life. In order to achieve this goal, Beagle 2 was designed to perform in situ geological, mineralogical and geochemical analysis of selected rocks and soils at the landing site. Furthermore, studies of the martian environment were planned via chemical analysis of the atmosphere, local geomorphological studies of the landing site and via the investigation of dynamic environmental processes.
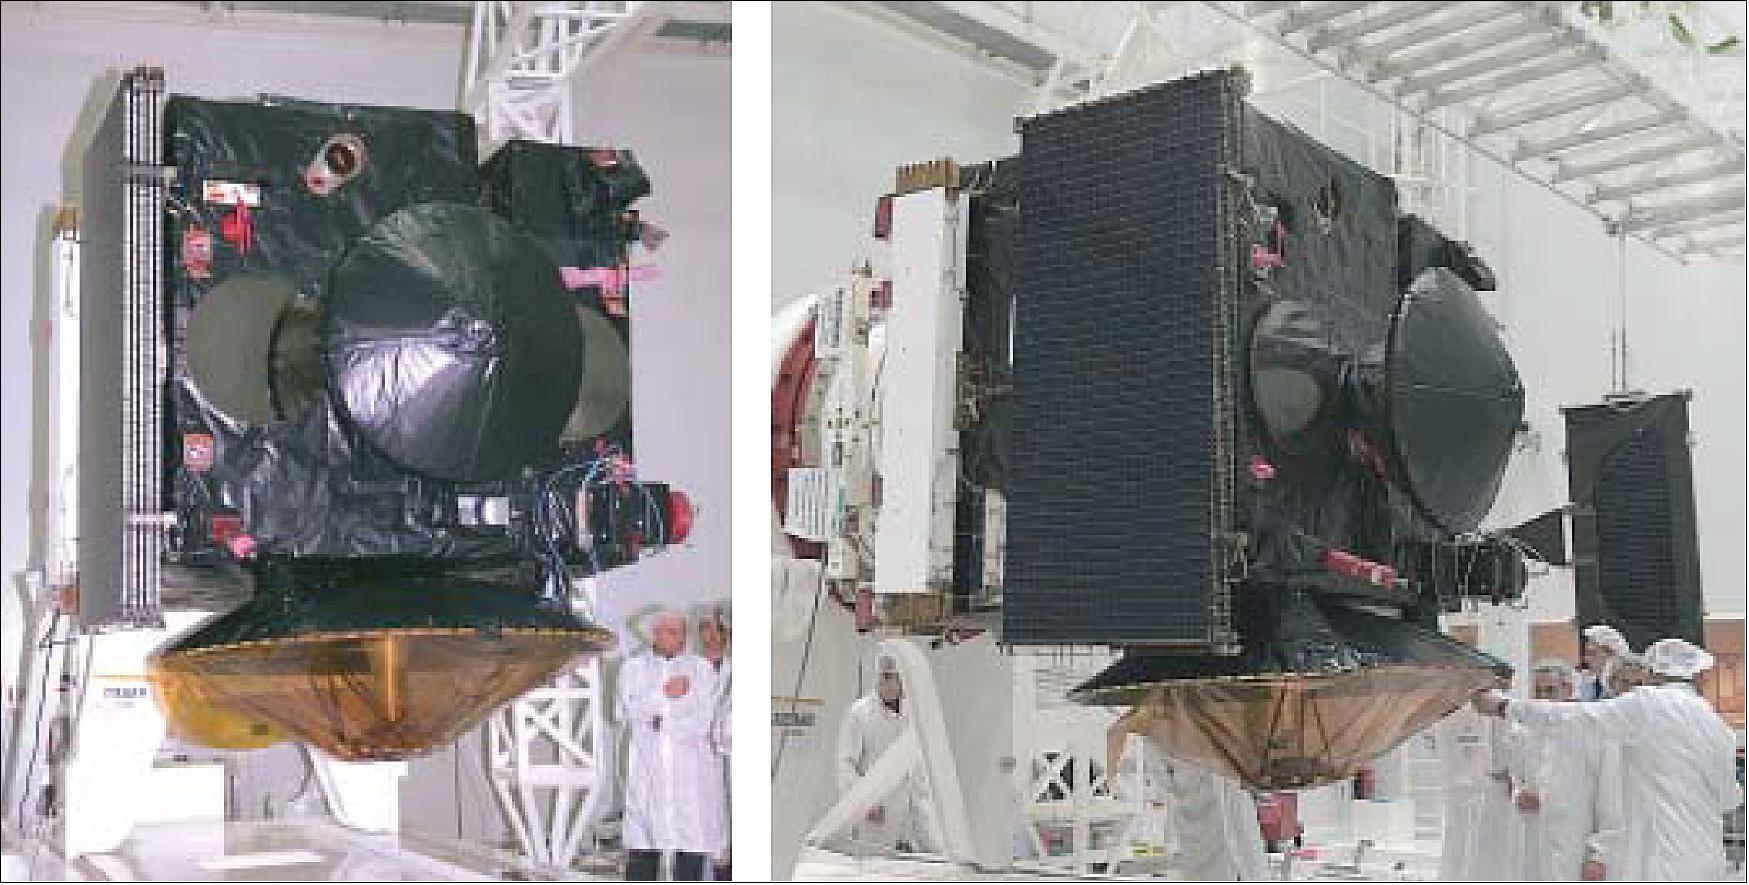
Spacecraft
Mars Express is a pioneer - and not just because it is Europe's first mission to the Red Planet. It is also pioneering more economic ways of building space science missions at ESA. These new working methods have already proved effective and will be applied to future science missions in the agency’s long-term scientific program. 2)
ESA is spending just 150 million Euros (1996 prices) on Mars Express, which is about one third of the cost of previous similar missions. This sum covers for the spacecraft, the launch and the operations. Orbiter instruments and the Beagle 2 lander are provided separately. The mission was also built unusually quickly to meet its narrow launch window in June 2003.
Savings are being made by re-using existing hardware, adopting new project management practices, shortening the time from original concept to launch, and procuring the most cost-effective launcher available.
Mars Express is making maximum use of existing technology that is either 'off-the-shelf' or technology that has already been developed for Rosetta, ESA's mission to a comet. Items not – at least partly - in common with Rosetta constitute only about 35% of the spacecraft.
ESA awarded the main contract to Astrium Toulouse, France, the spacecraft prime contractor, that previously would have been done by the project team at ESTEC. In particular, Astrium is managing the technical interfaces between the spacecraft and science payload and between the spacecraft and launcher. This shift in responsibility is allowing industry to streamline procedures and ESA to reduce the size of its project team to half that of previous equivalent projects. Astrium is leading a consortium of 24 companies from 15 European countries and the US.
"This new scheme is best suited to Mars Express constraints. Industry is more responsible in terms of the interfaces, which means we can have a more efficient decision-making process," says Vincent Poinsignon, Mars Express Project Manager at Astrium.
The time from concept to awarding the design and development contract was cut from about five years to little more than one year. Astrium won the prime contract in March 1999 in competition with two other consortia. The design and development phase will take under four years, compared with up to six years for previous similar missions.
Mars Express is a 3-axis stabilized orbiter with a fixed high-gain antenna and body-mounted instruments, and is dedicated to the orbital and in situ study of the planet’s interior, subsurface, surface and atmosphere.
Spacecraft item | Mass at launch | ||
Spacecraft bus | 439 kg | ||
Lander | 71 kg | ||
Payload | 116 kg | ||
Propellant | 427 kg | ||
Launch mass | 1223 kg | ||
Typical mean power demand | Observation | Maneuver | Communication |
Spacecraft | 270 W | 310 W | 445 W |
Payload | 140 W | 50 W | 55 W |
Total | 410 W | 360 W | 500 W |
Dimensions | Spacecraft bus dimensions | 1.5 x 1.8 x 1.4 m |
Thrust of main spacecraft engine | 400 N | |
Attitude thrusters | 8 at 10 N each | |
Propellant tank volume | 2 x270 = 540 liter | |
Pointing accuracy | Better than 0.05º | |
Power source | Solar array area | 11.42 m2 |
Lithium batteries | 3 at 22.5 Amp hour each (at launch) | |
Thermal specification | Spacecraft bus | 10-20ºC |
PFS, OMEGA | -180ºC | |
Thermal blanket | Gold-plated AISn alloy |
Launch
The Mars Express satellite was launched on 2 June 2003 on a Soyuz-Fregat vehicle from the Baikonur Cosmodrome, Kazakhstan. 4)
Orbit: A HEO (Highly Elliptical Orbit) on Mars (quasi-polar orbit) with a periapsis of 330 km and an apoapsis of 10,530 km, period of 7hrs.
Mars Express was launched from the Fregat upper stage towards Mars with an absolute velocity of 116, 800 km/hr and a velocity relative to the Earth of 10,800 km/hr. On 19 December 2003, 5 days before orbit insertion, the Beagle-2 lander was successfully released towards the surface of the planet. However, no further contact was made with the lander and it was subsequently declared lost (Ref. 3).
In January 2015, the UK space agency announced that the lander has been identified in images from NASA's MRO (Mars Reconnaissance Orbiter). The images appeared to show the lander partially deployed on the surface.
On 25 December 2003 the orbiter underwent a successful orbit insertion maneuver and after slow orbit adjustments it reached the operational orbit.
Nominal Operational Orbit Parameters:
• Orbital inclination - 86.9°
• Apocenter - 10,530 km
• Pericenter - 330 km
• Period - 7 hr 00 m
• Observational phase at pericenter - about 1 hour
• Communications phase - 6.5-7.0 hours minimum
Operations Center: ESOC (European Space Operations Control Center) in Darmstadt communicates with the spacecraft via the ESA New Norcia ground station in Perth, Australia. The spacecraft sends housekeeping data on instrument temperatures, voltages and spacecraft orientation, for example, and science data. The ground station sends control commands to the spacecraft. Scientific data is stored onboard using the 12 Gbit solid state mass memory prior to the downlink to Earth.
The Beagle 2 descent capsule was ejected 5 days before arrival at Mars, while the orbiter was on a Mars collision course; Mars Express was then retargeted for orbit insertion. From its hyperbolic trajectory, Beagle 2 entered and descended through the atmosphere in about 5 min, intending to land at < 40 m s–1 within an error ellipse of 20 x 100 km. The fate of Beagle 2 remains unknown because no signal was ever received from the martian surface, neither by the UK’s Jodrell Bank radio telescope nor by the Mars Express and Mars Odyssey orbiters. All of them made strenuous efforts to listen for the faintest of signals for many weeks following Beagle 2’s arrival at Mars.
ESA set up a commission to investigate the potential causes of the probable accident and issued a number of recommendations for future missions. The selected landing site was in Isidis Planitia (11.6°N, 269.5°W), which is a safe area of high scientific interest – this impact basin was probably flooded by water during part of its early history, leaving layers of sedimentary rocks. The area is surrounded by geological units of a variety of ages and compositions, from densely cratered highlands to volcanic flows to younger smooth plains. The lander’s highly integrated instrument suite was expected to perform a detailed geological, mineralogical and chemical analysis of the site’s rocks and soils, provide site meteorology, and focus on finding traces of past or present biological activity. Data from this combination of instruments could have solved the issue of life on Mars. Beagle 2’s operational lifetime was planned to be up to 180 sols (about 6 months).
Note: As of February 2022, the previously single large MarsExpress file has been split into two files, to make the file handling manageable for all parties concerned, in particular for the user community.
• This article covers the MarsExpress mission and its imagery in the period 2022-2020, in addition to some of the mission milestones.
• MarsExpress imagery in the period 2019-2004
Mission Status
• July 20, 2022: The latest image release from ESA’s Mars Express takes us over two ruptures in the martian crust that form part of the mighty Valles Marineris canyon system. 5)
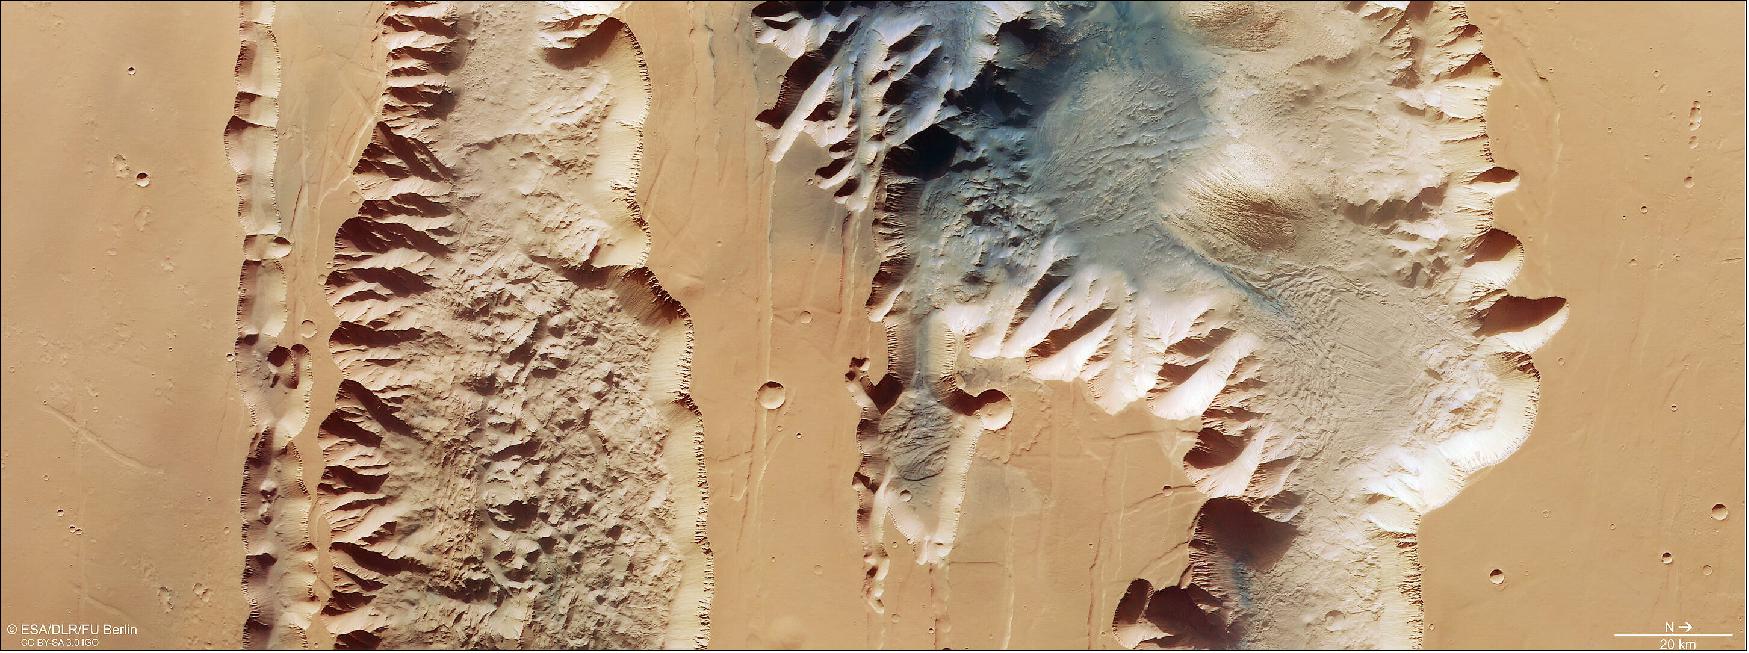
- Valles Marineris cuts across Mars like the Grand Canyon cuts across the United States, except the latter is miniscule in comparison. At 4000 km long, 200 km wide and up to 7 km deep, Valles Marineris is almost ten times longer, 20 times wider and five times deeper than the Grand Canyon. As the largest canyon system in the Solar System, it would span the distance from the northern tip of Norway to the southern tip of Sicily.
- There’s another big difference between the two: whilst the Grand Canyon was formed as the Colorado River eroded away rock, Valles Marineris is thought to have formed through the drifting apart of tectonic plates.
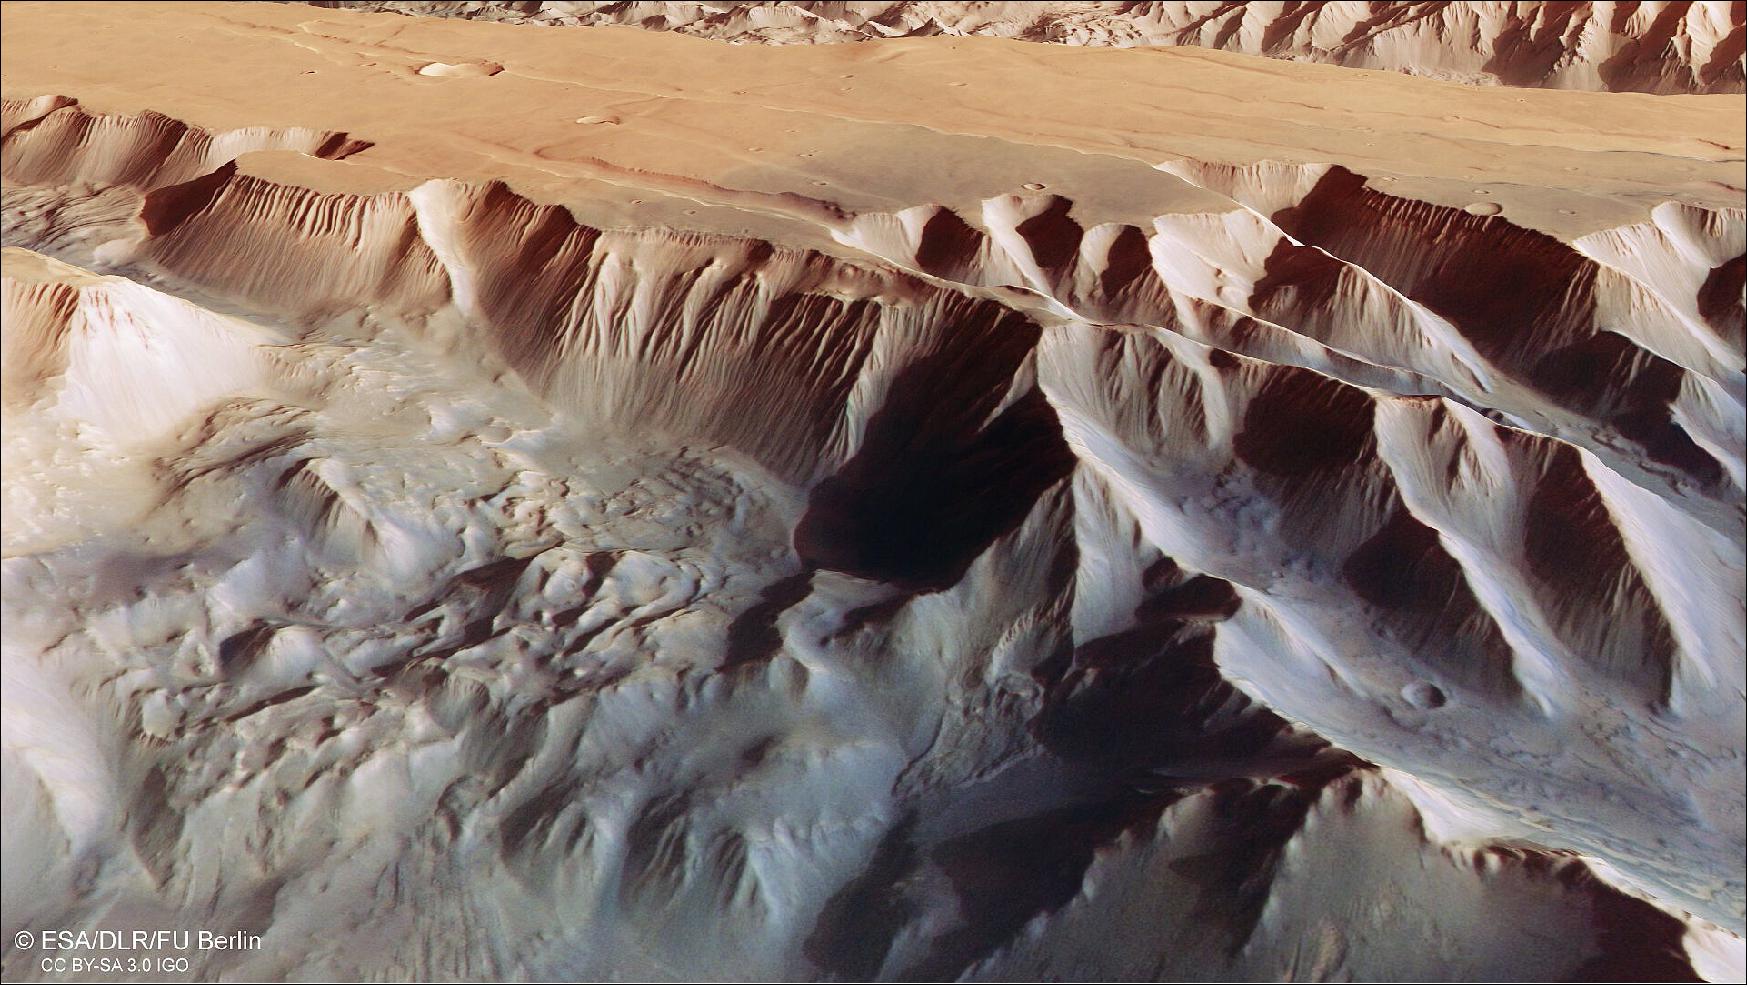
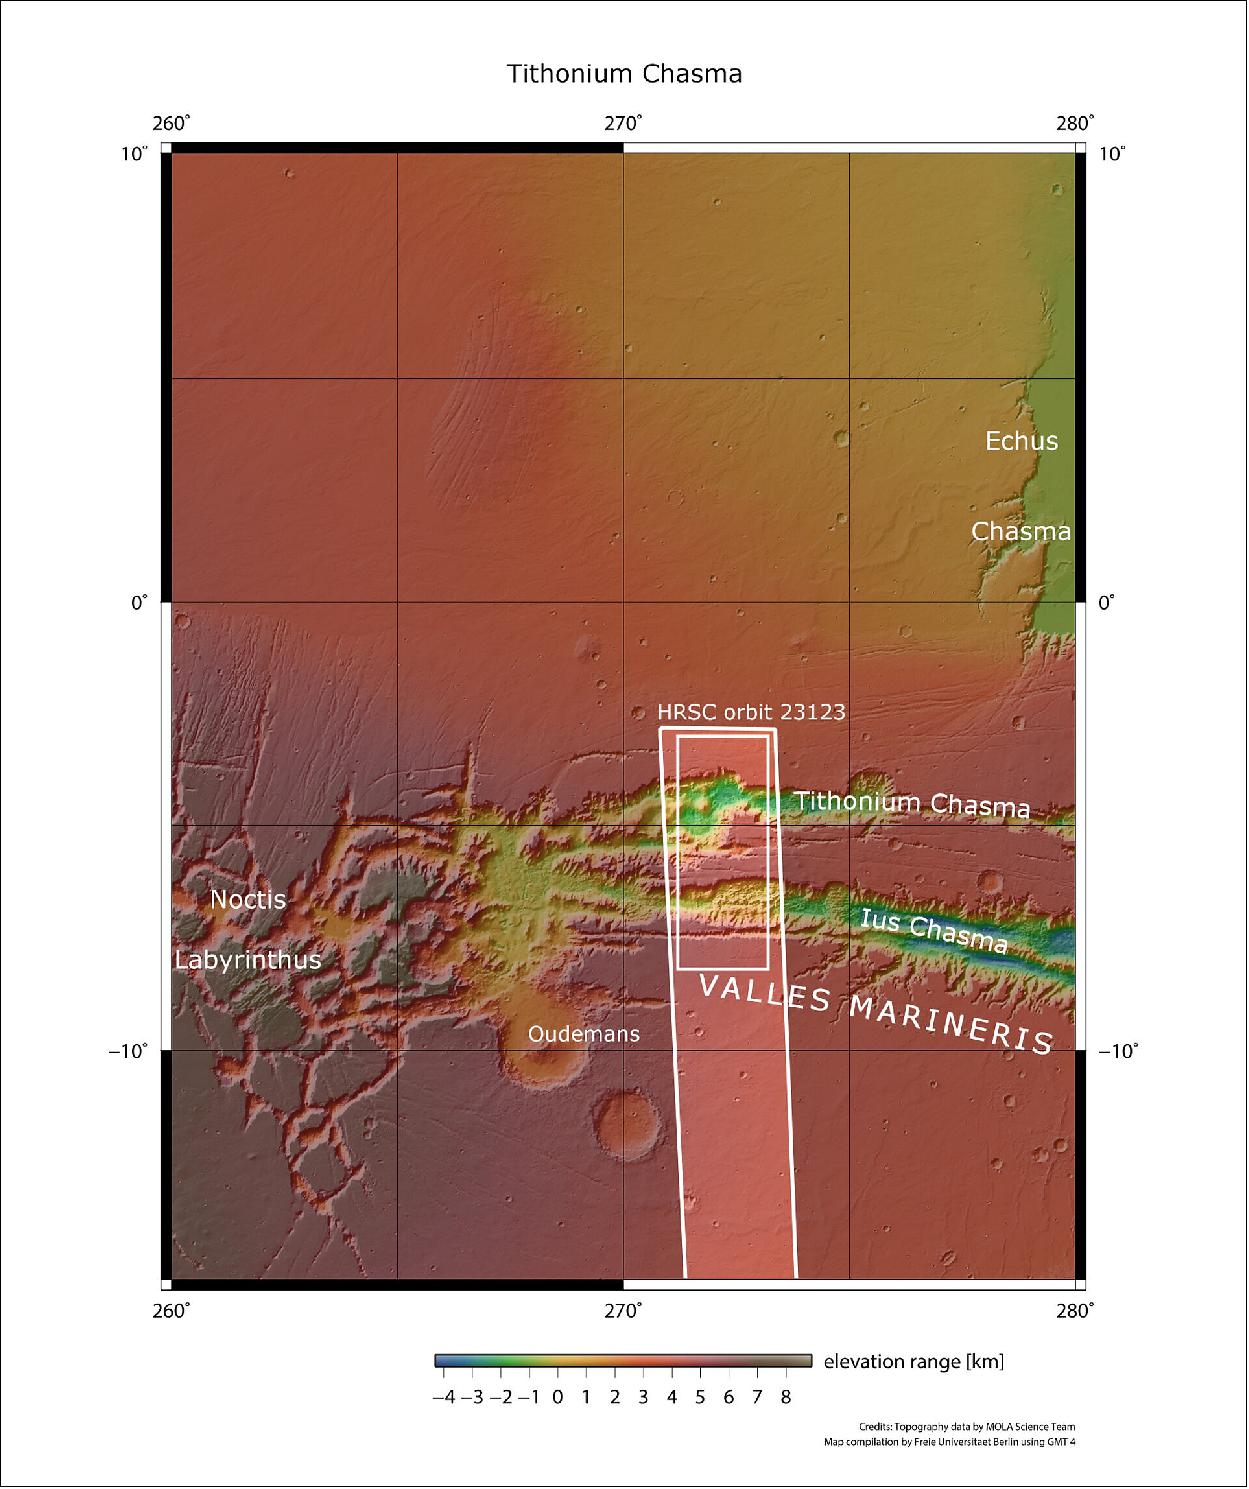
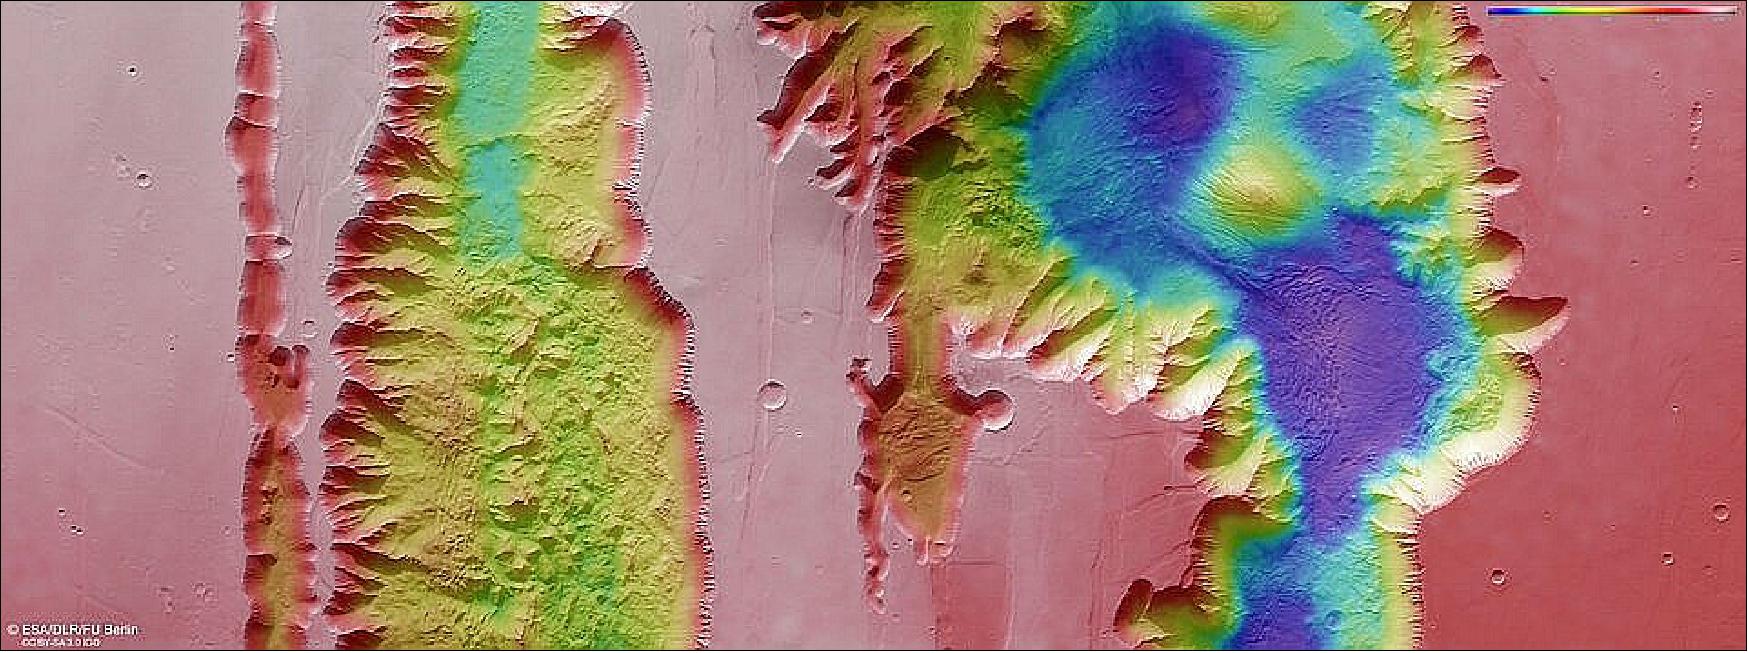
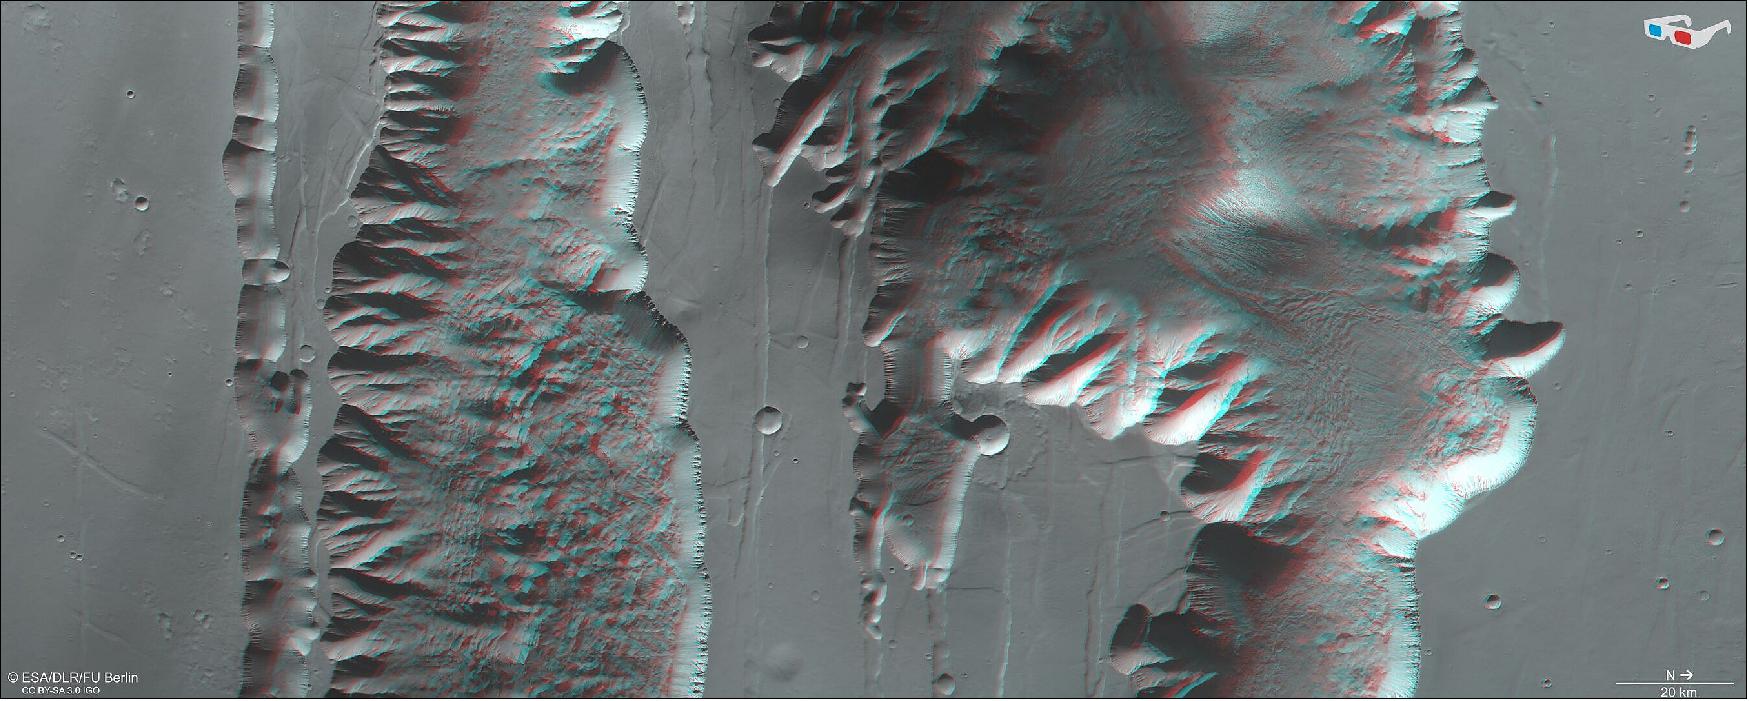
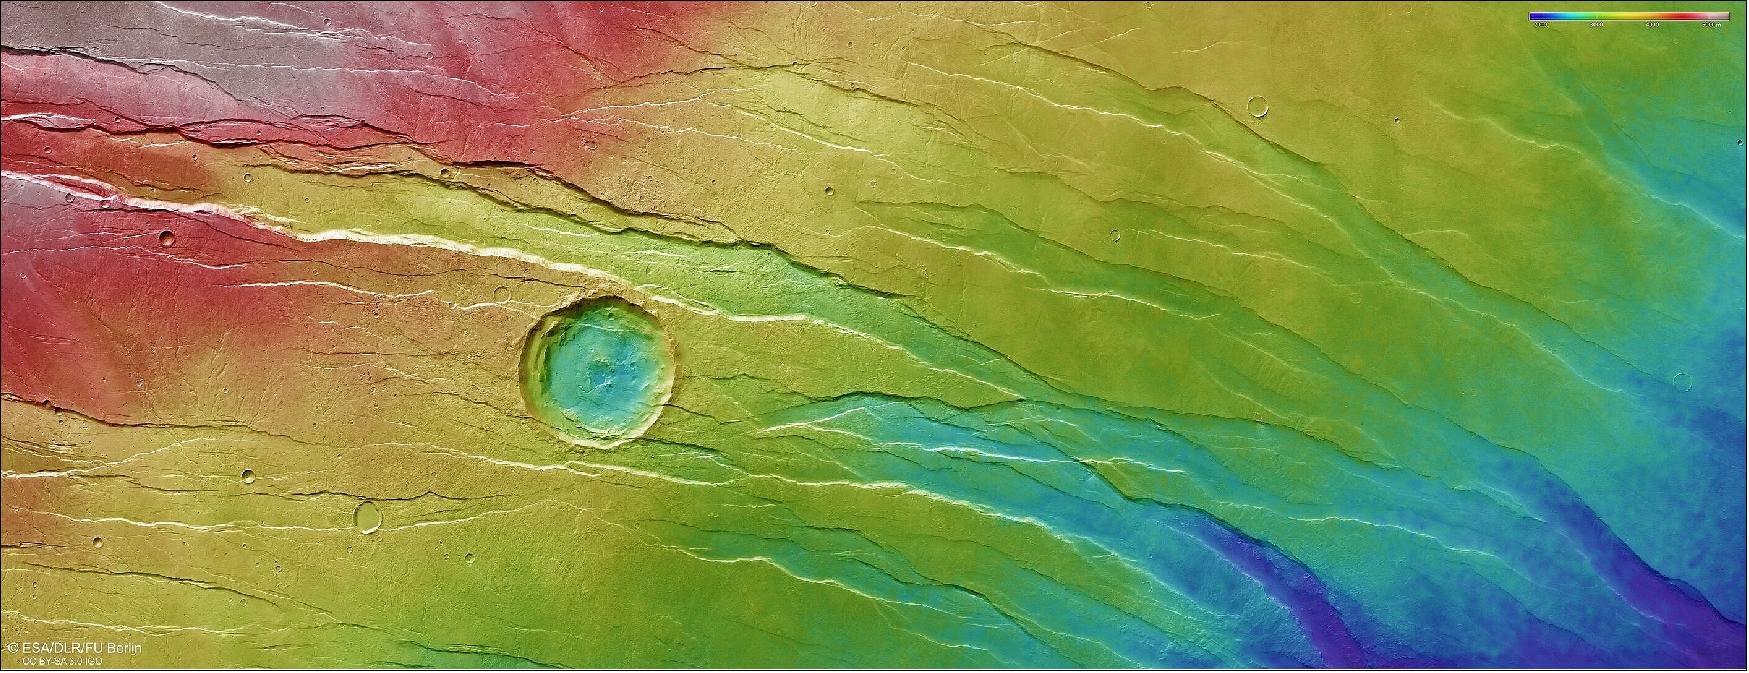
- The image shows two trenches (or chasma) that form part of western Valles Marineris. On the left (south), is the 840 km-long Ius Chasma, and on the right (north) is the 805 km-long Tithonium Chasma. Whilst these high-resolution images show incredible surface detail, it is only when we look at an elevation map (see Figure 6) that we realise how spectacularly deep the chasmata are – up to 7 km! At 4809 m, the Alps’ tallest mountain Mont Blanc would be dwarfed if it was put inside Tithonium Chasma.
- At the top of Tithonium Chasma, a patch of dark sand brings colour contrast to the image. This sand may have come from the nearby Tharsis volcanic region.
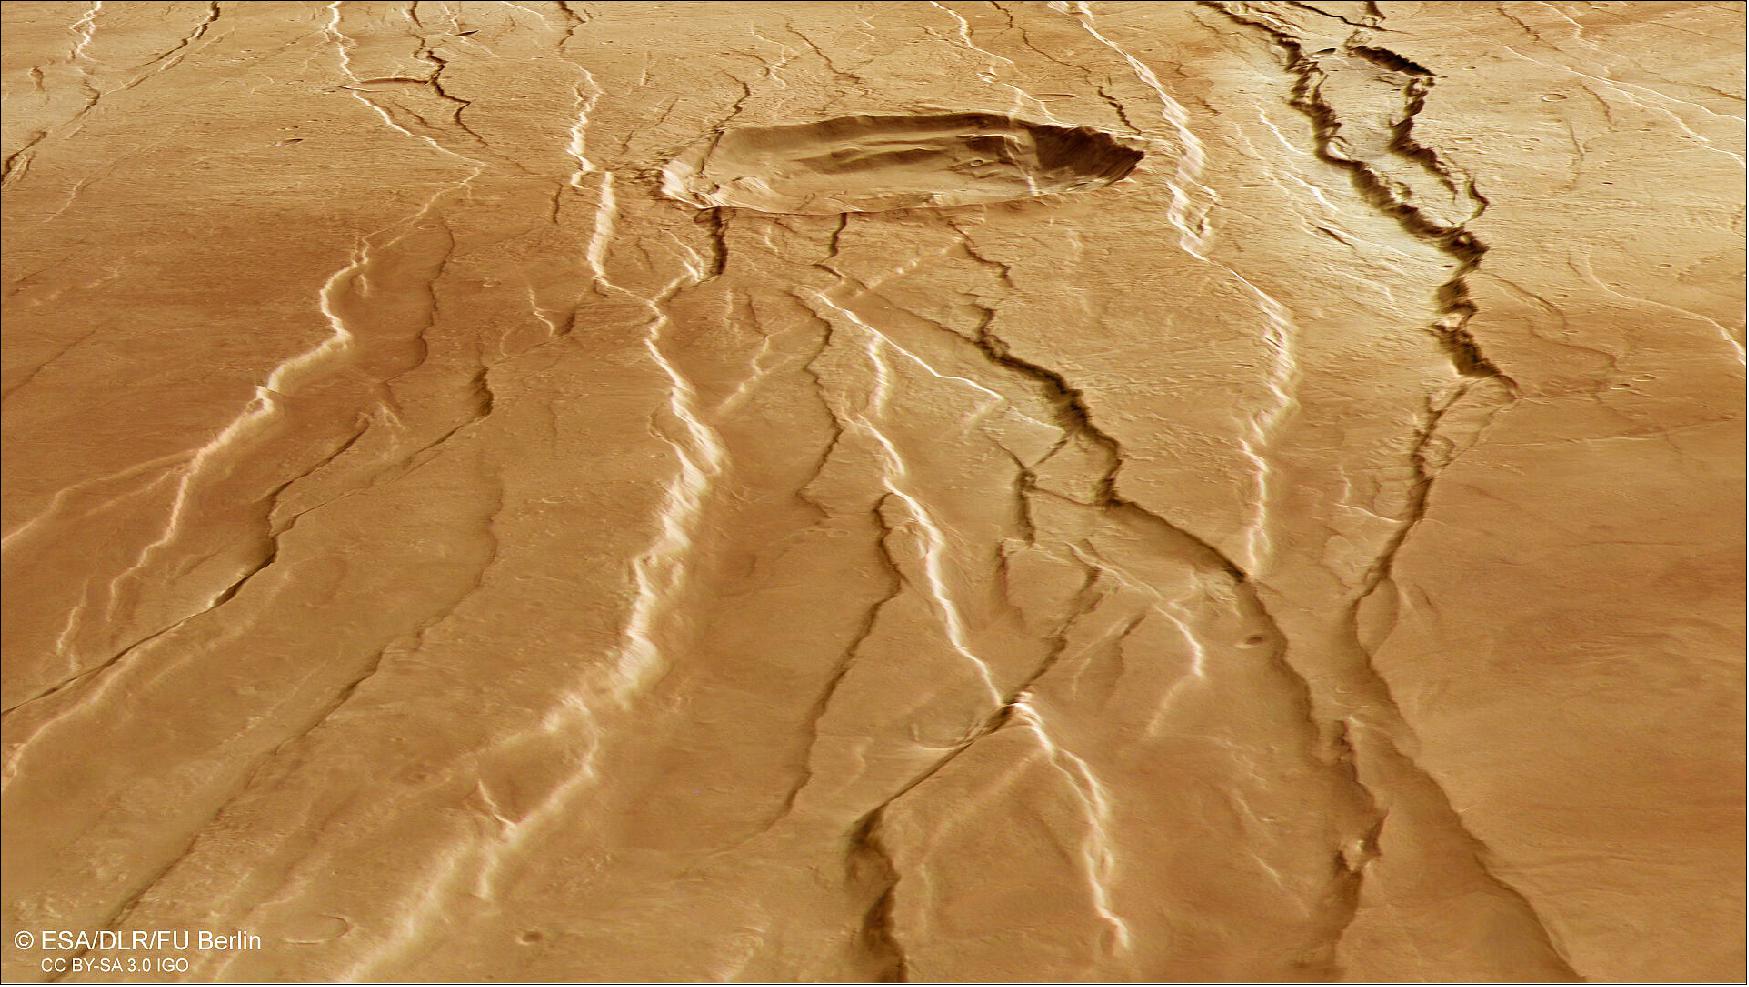
- Next to the dark sand dunes are two light-toned mounds (one cut in half by the upper image border). These ‘mounds’ are more like mountains, rising more than 3000 metres in height. Their surfaces have been strongly eroded by Mars’ strong winds, indicating that they are made of a weaker material than the surrounding rock.
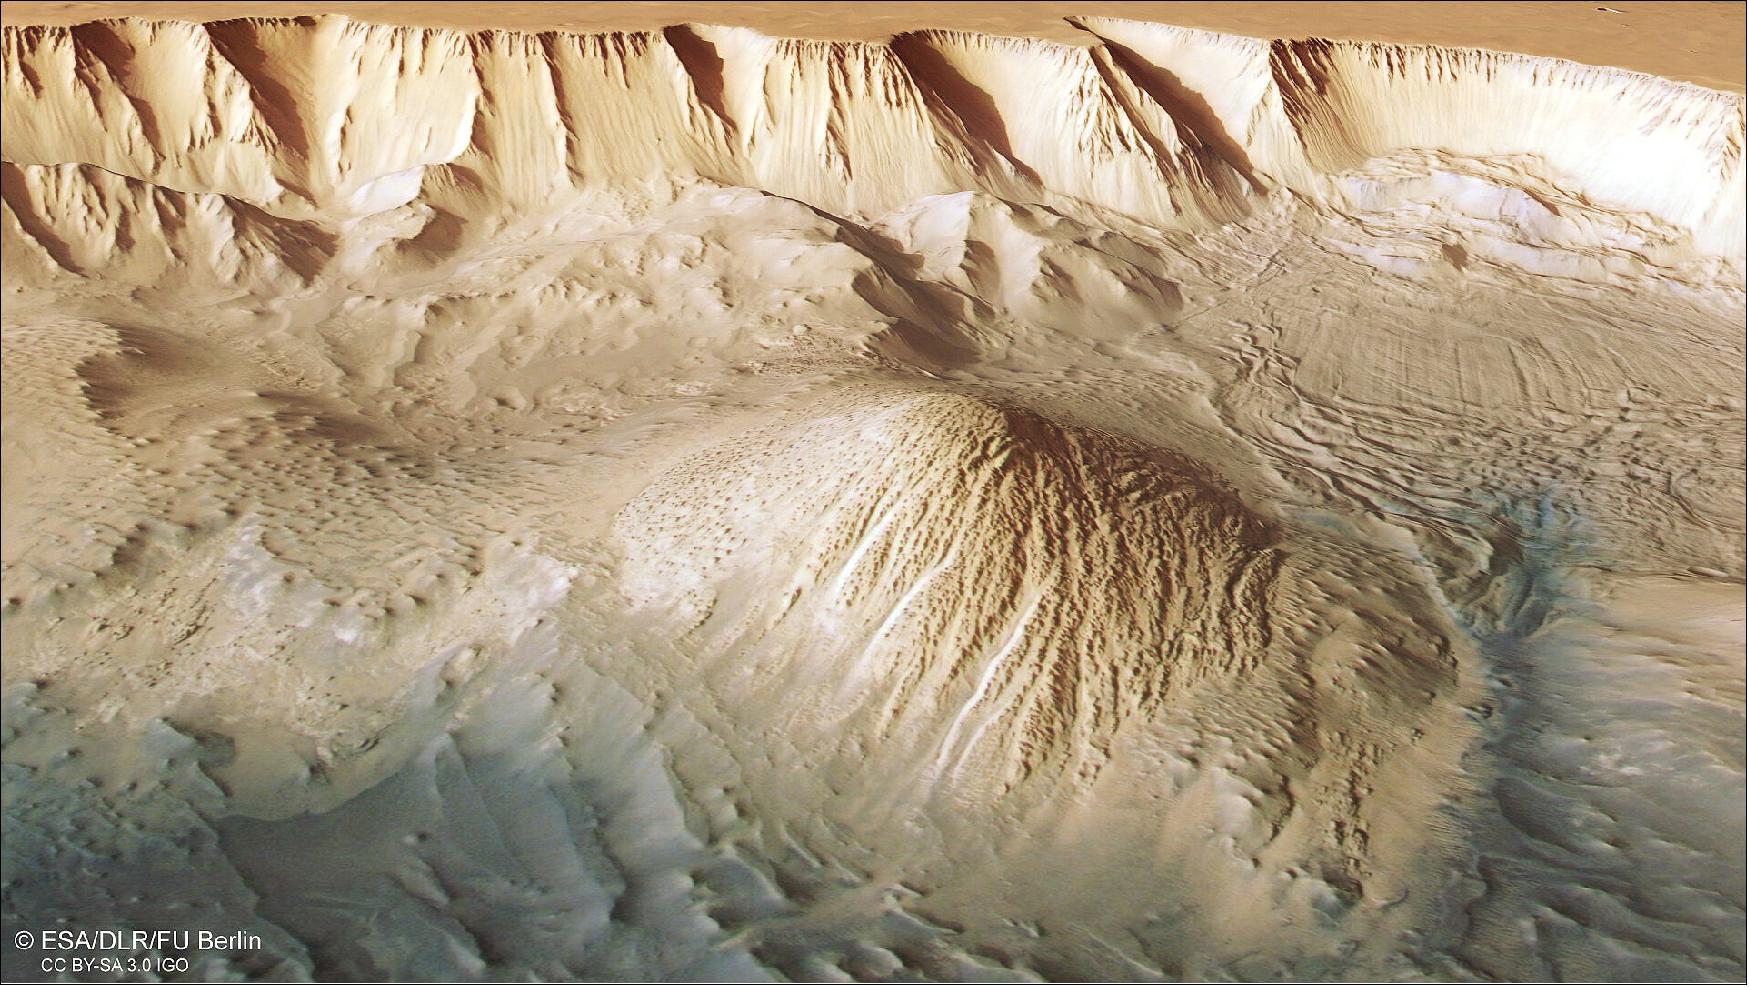
- Between the two mounds we see a series of smaller bumps, as shown in the second perspective view. Investigations by Mars Express have found water-bearing sulphate minerals in this region. This suggests that these bumps may have formed when liquid that once filled the chasma evaporated, although this theory is still hotly debated.
- To the lower right of the mound that we see fully (upper right in the second perspective view), we can see parallel lines and debris piles that indicate a recent landslide. This is also visible as a large purple area in the topography image below. The landslide was caused by the collapse of the canyon wall on the right, and is likely to have occurred relatively recently because it has not been strongly eroded.
Exploring Mars
- Mars Express has been orbiting the Red Planet since 2003, imaging Mars’ surface, mapping its minerals, identifying the composition and circulation of its tenuous atmosphere, probing beneath its crust, and exploring how various phenomena interact in the martian environment.
- The mission’s High Resolution Stereo Camera (HRSC), responsible for these new images, has revealed much about Mars’ diverse surface features, with recent images showing everything from wind-sculpted ridges and grooves through impact craters and channels that once carried liquid water to volcanoes, tectonic faults, river channels and ancient lava pools.
• June 21, 2022: The MARSIS instrument on ESA’s Mars Express spacecraft, famous for its role in the discovery of signs of liquid water on the Red Planet, is receiving a major software upgrade that will allow it to see beneath the surfaces of Mars and its moon Phobos in more detail than ever before. 6)
- Mars Express was ESA’s first mission to the Red Planet. Launched 19 years ago, on 2 June 2003, the orbiter has spent almost two decades studying Earth’s neighbour and revolutionising our understanding of the history, present and future of Mars.
- The MARSIS (Mars Advanced Radar for Subsurface and Ionospheric Sounding) instrument on Mars Express was crucial in the search for and discovery of signs of liquid water on Mars, including a suspected 20-by-30 km lake of salty water buried under 1.5 km of ice in the southern polar region.
- Operated by the Istituto Nazionale di Astrofisica (INAF), Italy, and fully funded by Italian Space Agency (ASI), MARSIS sends low-frequency radio waves down towards the planet using its 40-metre long antenna.
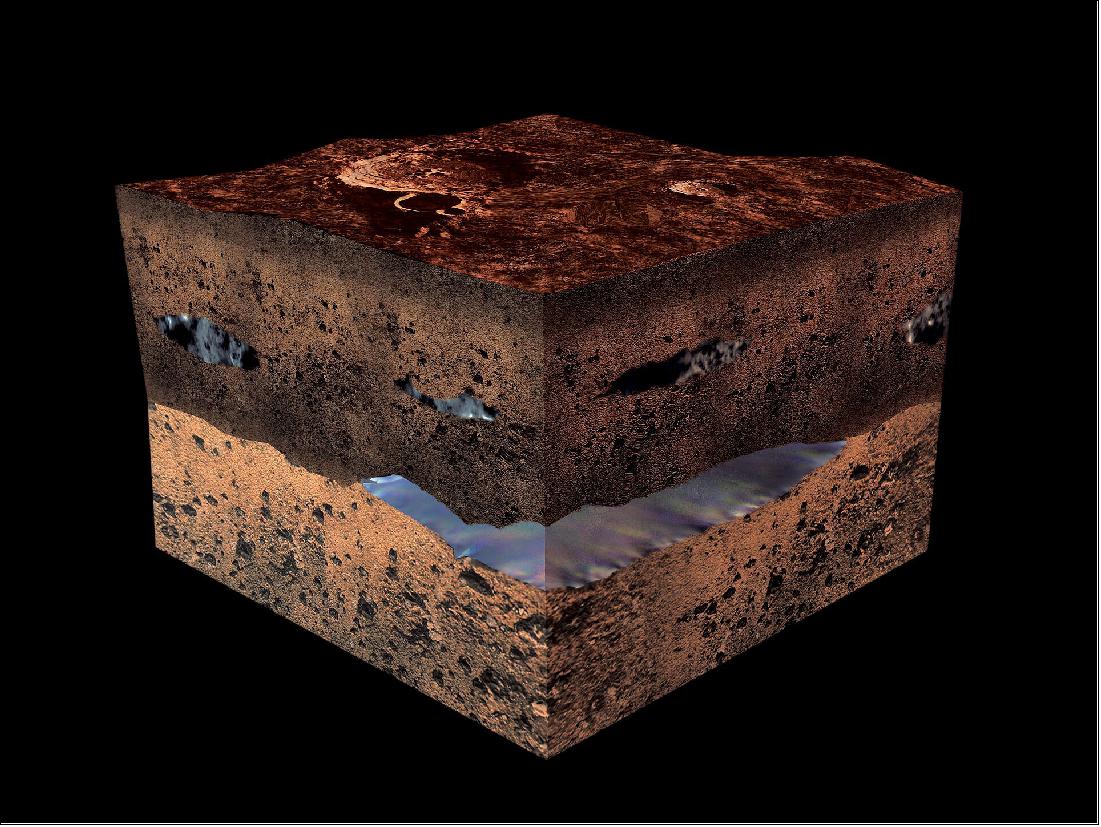
- Most of these waves are reflected from the planet’s surface, but significant amounts travel through the crust and are reflected at boundaries between layers of different materials below the surface, including ice, soil, rock and water.
- By examining the reflected signals, scientists can map the structure below the surface of the Red Planet to a depth of a few kilometres and study properties such as the thickness and composition of its polar ice caps and the properties of volcanic and sedimentary rock layers.
From Windows 98 to Mars 2022
- “After decades of fruitful science and having gained a good understanding of Mars, we wanted to push the instrument’s performance beyond some of the limitations required back when the mission began,” says Andrea Cicchetti, MARSIS Deputy PI and Operation Manager at INAF, who led the development of the upgrade.
- “We faced a number of challenges to improve the performance of MARSIS,” says Carlo Nenna, MARSIS on-board software engineer at Enginium, who is implementing the upgrade. “Not least because the MARSIS software was originally designed over 20 years ago, using a development environment based on Microsoft Windows 98!”
- The new software was designed together by the INAF team and Carlo, and is now being implemented on Mars Express by ESA. It includes a series of upgrades that improve signal reception and on-board data processing to increase the amount and quality of science data sent to Earth.
- “Previously, to study the most important features on Mars, and to study its moon Phobos at all, we relied on a complex technique that stored a lot of high-resolution data and filled up the instrument’s on-board memory very quickly,” says Andrea.
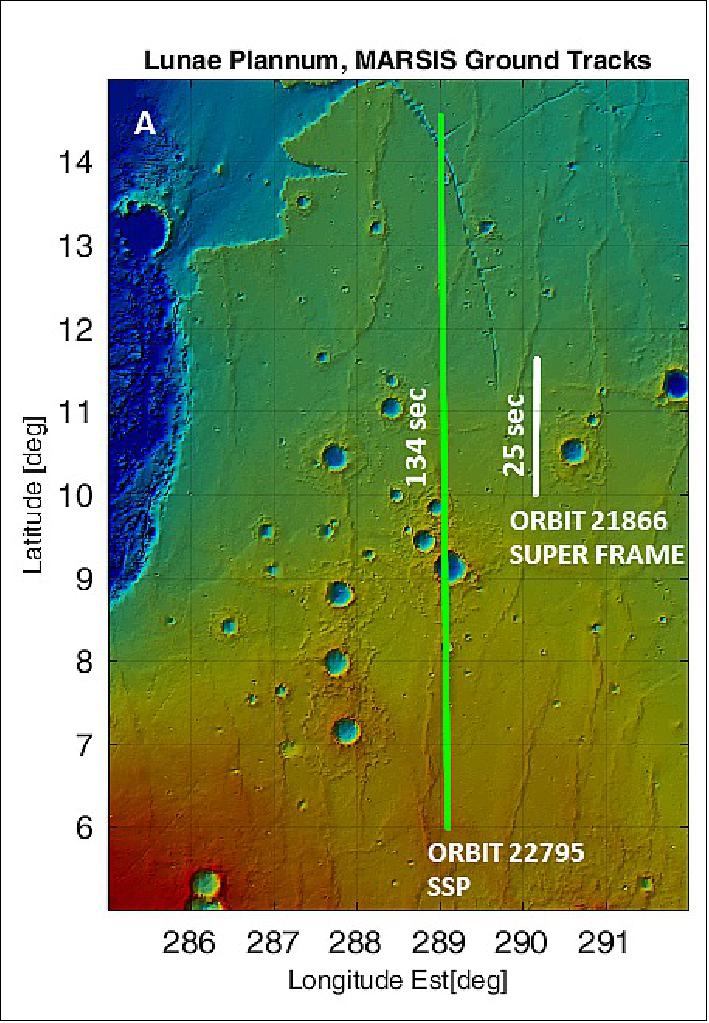
- “By discarding data that we don’t need, the new software allows us to switch MARSIS on for five times as long and explore a much larger area with each pass.”
- “There are many regions near the south pole on Mars in which we may have already seen signals indicating liquid water in lower-resolution data,” adds ESA Mars Express scientist Colin Wilson.
- “The new software will help us more quickly and extensively study these regions in high resolution and confirm whether they are home to new sources of water on Mars. It really is like having a brand new instrument on board Mars Express almost 20 years after launch.”
- Old enough to vote in many places on Earth, Mars Express continues to deliver amazing science while remaining one of ESA’s lowest-cost missions to fly.
- “Mars Express and MARSIS are still very busy,” says James Godfrey, Mars Express spacecraft operations manager at ESA’s ESOC mission operations centre in Darmstadt, Germany. “The team did a great job designing the new software, maximising its impact while keeping the patches as small as possible, helping us continue to get the most out of this veteran spacecraft.”
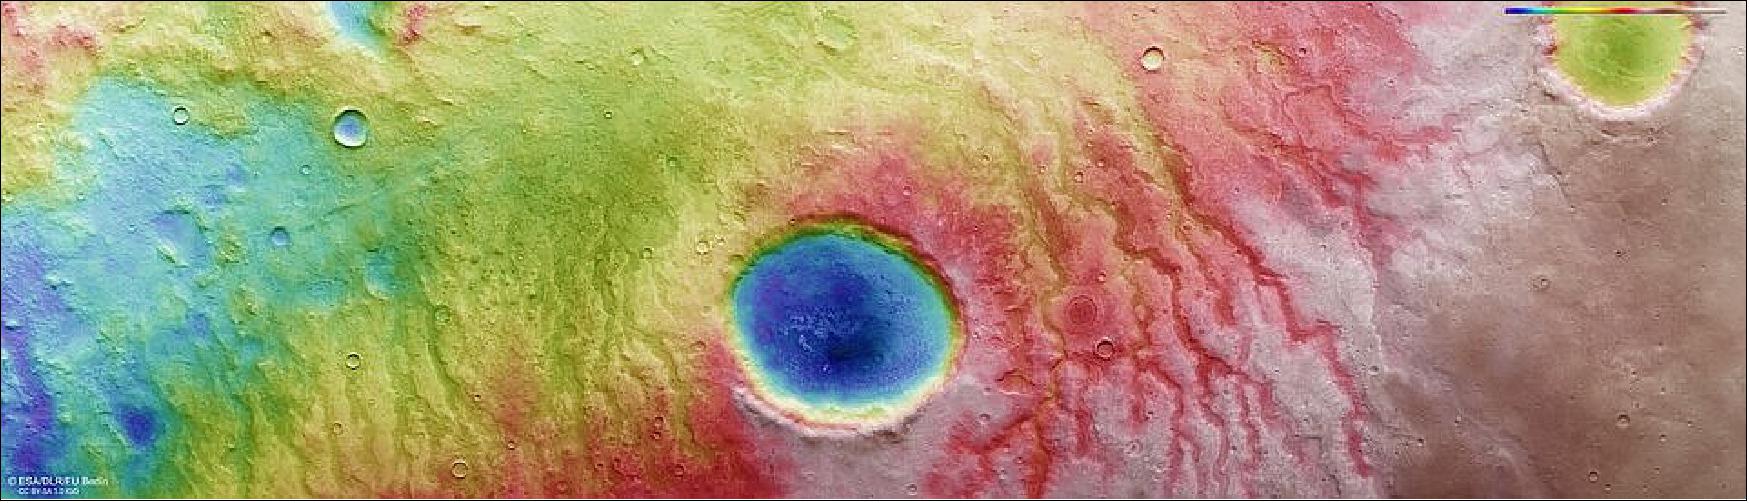
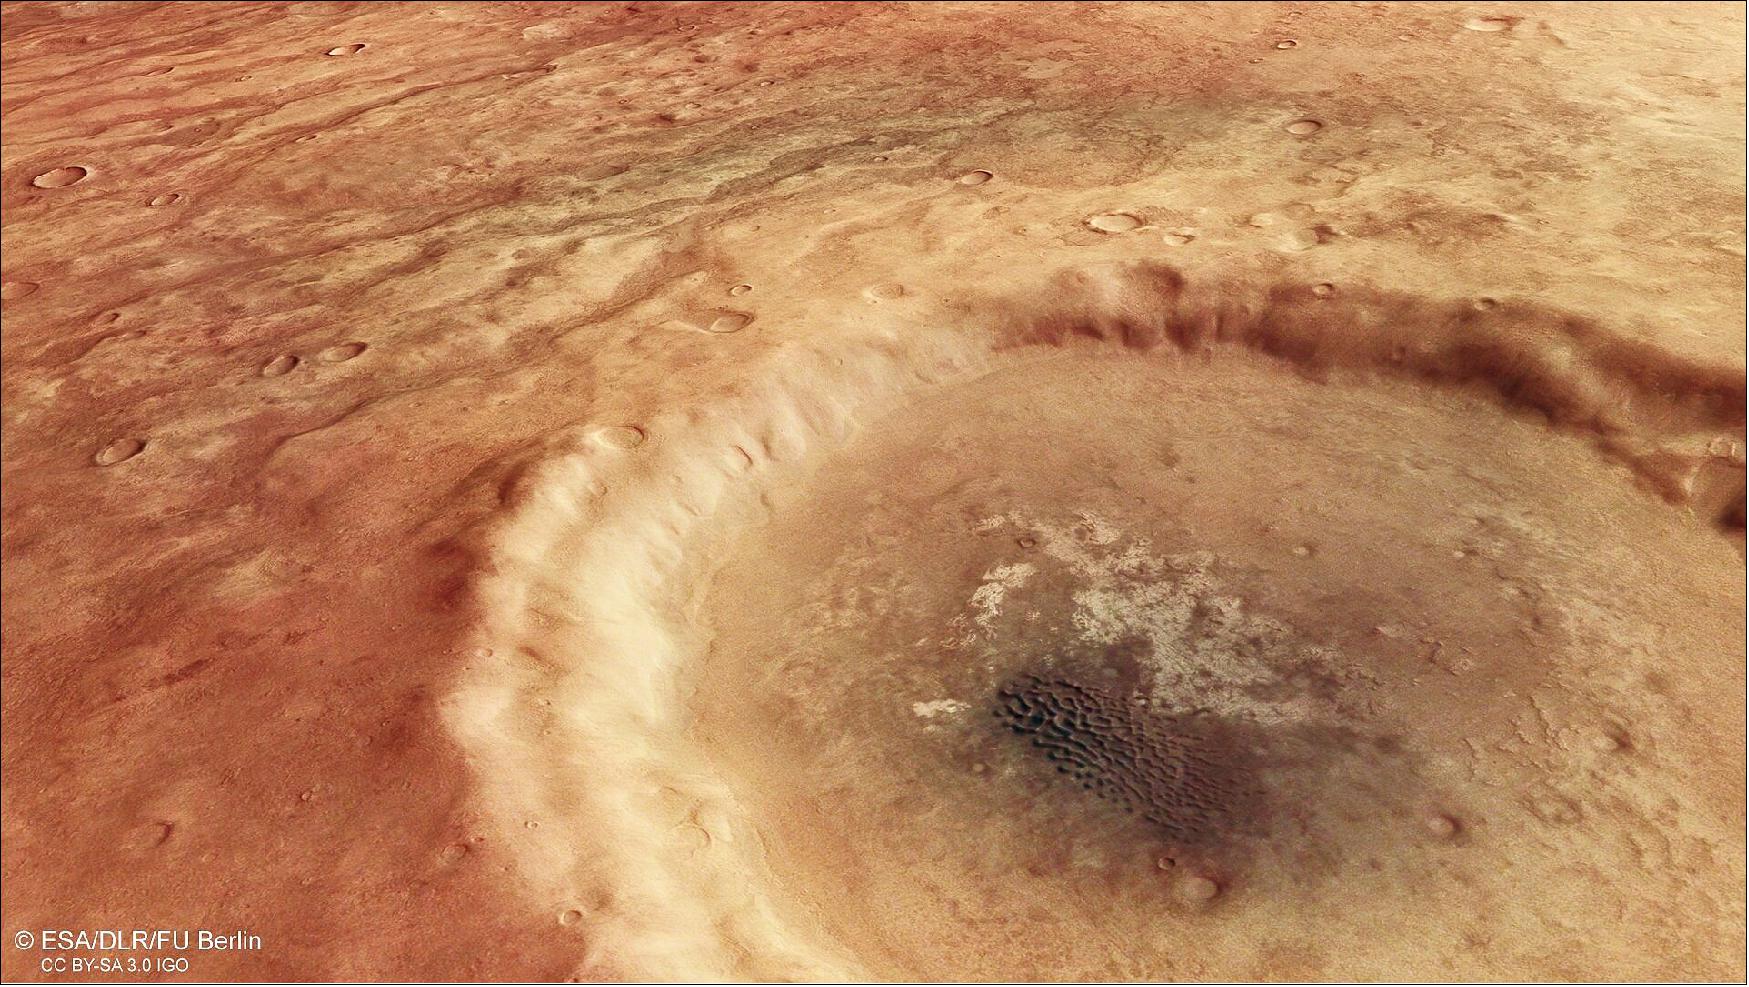
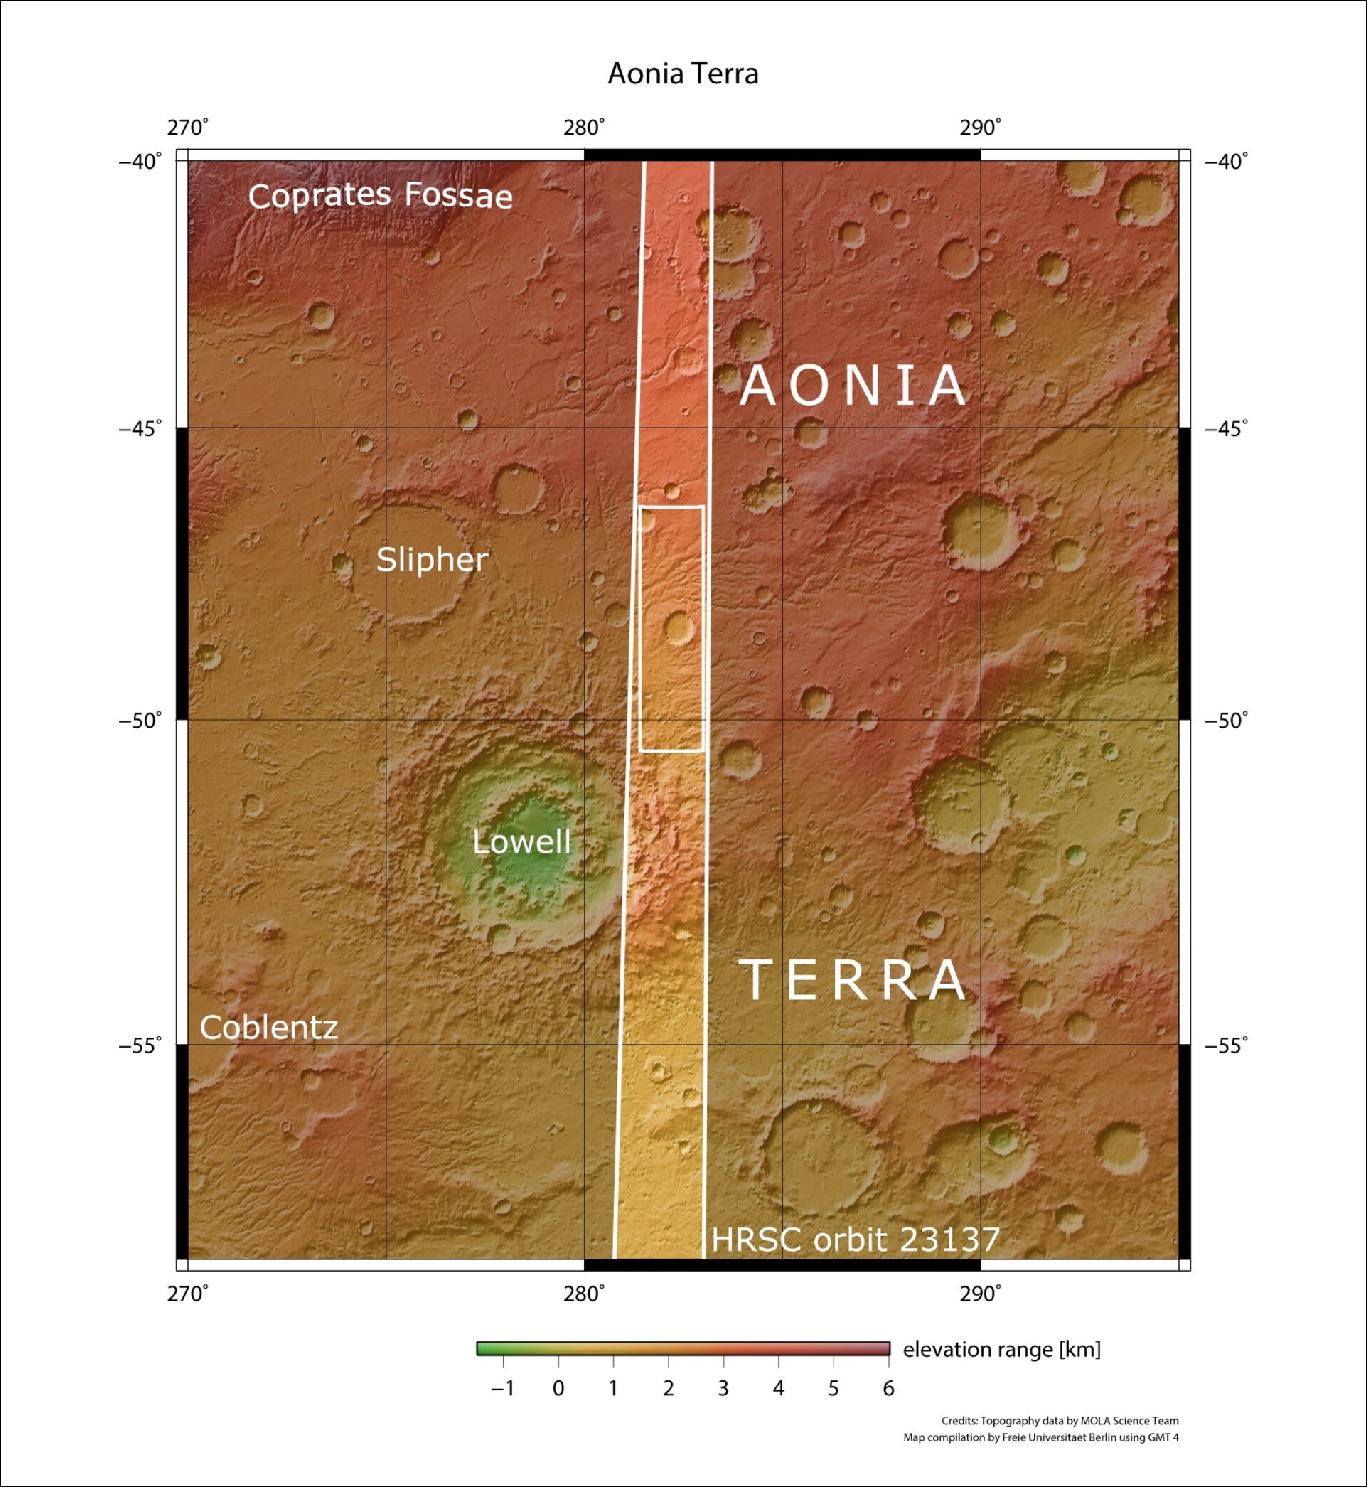
• June 8, 2022: This scarred and colourful (by martian standards!) landscape shows part of Aonia Terra, an upland region in the southern highlands of Mars. The image was taken by ESA’s Mars Express on 25 April 2022. 7)
- The 30 km-wide unnamed crater at the centre of the image is nestled within a landscape of winding channels. Conjuring images of veins running through a human eyeball, these channels are likely to have carried liquid water across the surface of Mars around 3.5–4 billion years ago.
- The channels appear to be partly filled with a dark material, and in some places, seem to actually be raised above the surrounding land. There are a variety of possible explanations for this. Perhaps erosion-resistant sediment settled at the bottom of the channels when water flowed through them. Or perhaps the channels were filled in with lava later on in Mars’ history.
A Cacophony of Colours
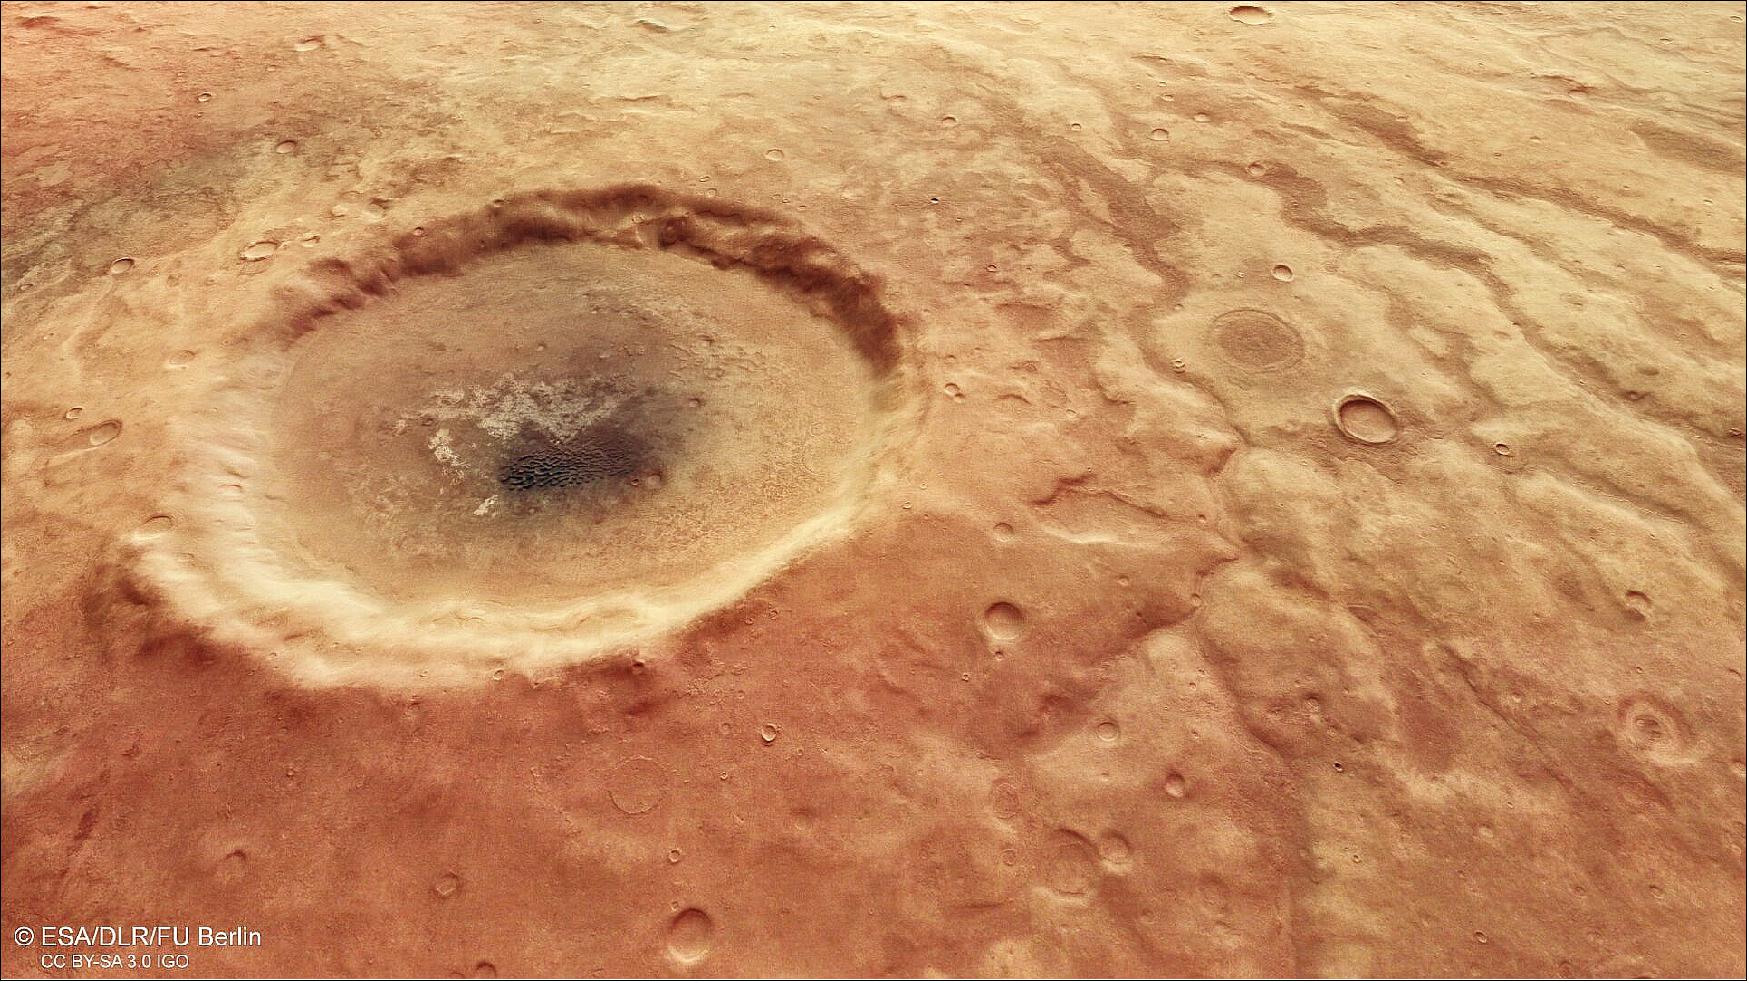
- This Mars Express image reveals many different colours in the surface around the crater, suggesting that this region of Mars is made up of a variety of materials. South of the crater (on the left of the true-colour image above), the surface is a warm red, melting into a darker brownish-grey closer to the crater. In this region, many buttes are visible – these flat-topped towers of rock are created when land is gradually worn away by water, wind or ice.
- Inside the crater, a dark dune field rests on a lighter surface. Upon closer inspection, it becomes apparent that the crater is filled with more buttes and cone-shaped hills. These are evidence that many different materials accumulated inside the crater.
- To the north of the crater (right of the wide view image), the surface is lighter and smoother. The rims of the main crater and the channels appear less defined. To the far right of the image, the surface becomes even smoother.
Aonia Terra
- Aonia Terra is known for its impressive craters. Close to the crater shown in this image is the 200 km-wide Lowell crater. Lowell is thought to have been formed almost four billion years ago, during the Solar System’s ‘Late Heavy Bombardment’ period, when a large number of asteroids crashed into the rocky planets.
- Aonia Terra is named after a feature called Aonia, a dark patch on the surface of Mars that can be seen from Earth, even with rudimentary telescopes. Aonia was also a region in ancient Greece, a location sacred to the Muses, the goddesses of literature, science and the arts.
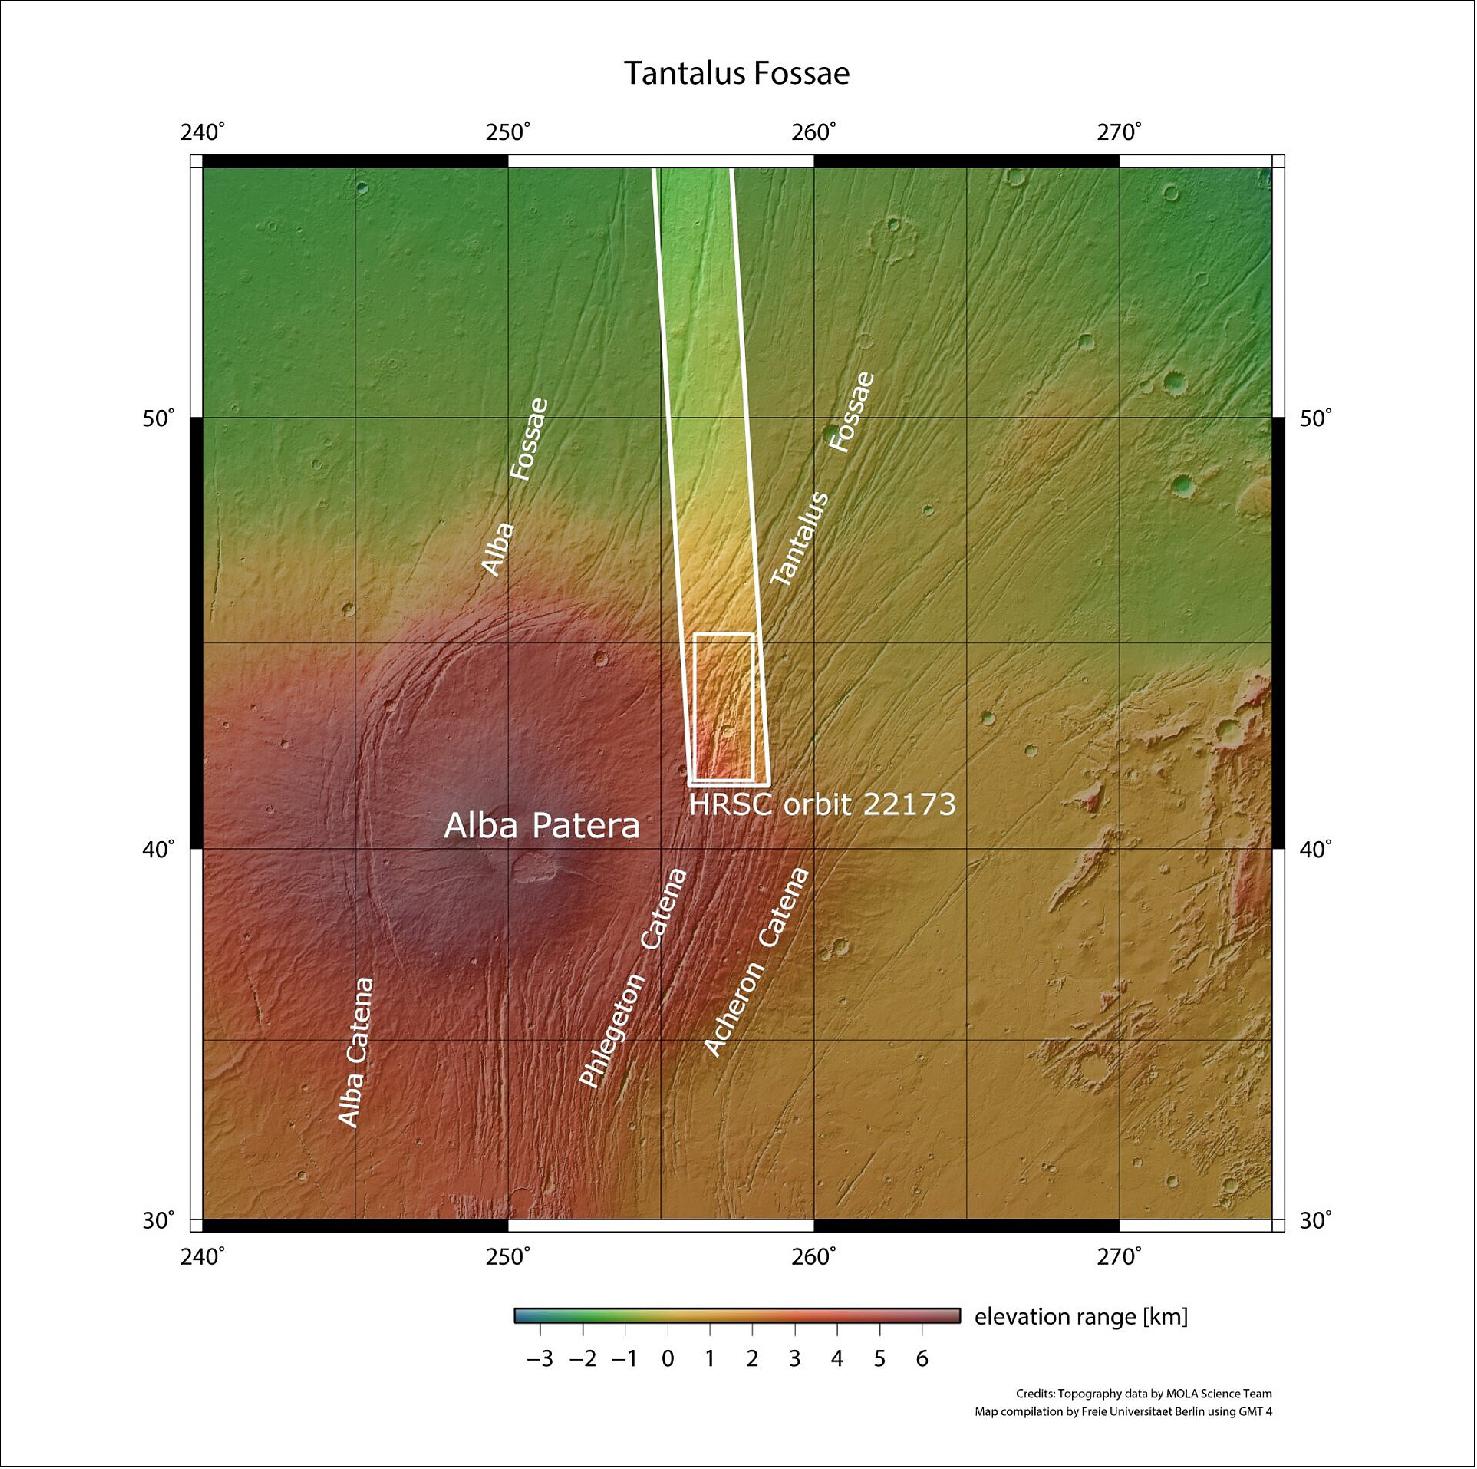
• April 28, 2022: This network of long grooves and scratches forms part of a giant fault system on Mars known as Tantalus Fossae, and is shown here as seen by ESA’s Mars Express. 8)
- At first glance, these features look as if someone has raked their fingernails across the surface of the Red Planet, gouging out lengthy trenches as they did so.
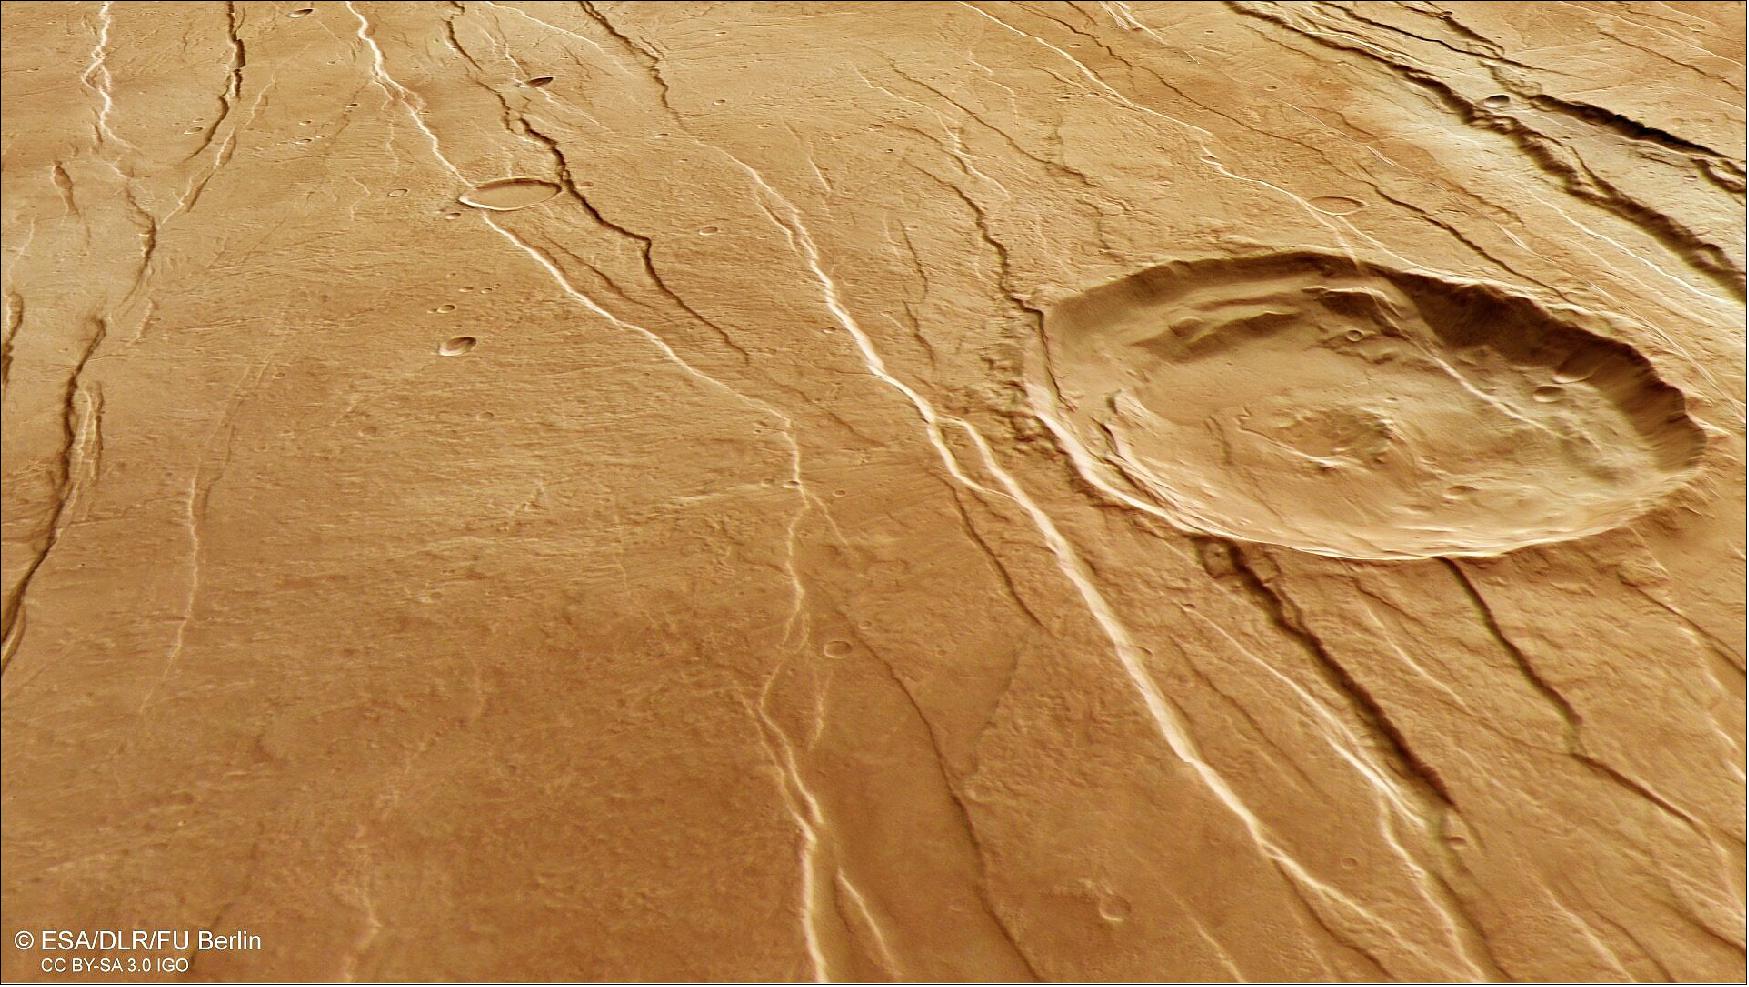
- While not quite so dramatic in its formation, Tantalus Fossae (‘fossae’ meaning a hollow or depression) is a noticeable feature on Mars. This system of troughs flanks a sprawling, low-relief martian volcano named Alba Mons, running along the volcano’s eastern side.
- The fossae were created as the summit of Alba Mons rose in elevation, causing the surrounding surface to become warped, extended and broken. The Tantalus Fossae faults are a great example of a surface feature known as grabens; each trench formed as two parallel faults opened up, causing the rock between to drop down into the resulting void.
- The same features can be found on the western side of Alba Mons, forming an incomplete ring around the volcano. Overall, this volcano’s associated grabens stretch out for up to 1000 km in length, up to 10 km in width, and are up to 350 m deep.
A Complex History
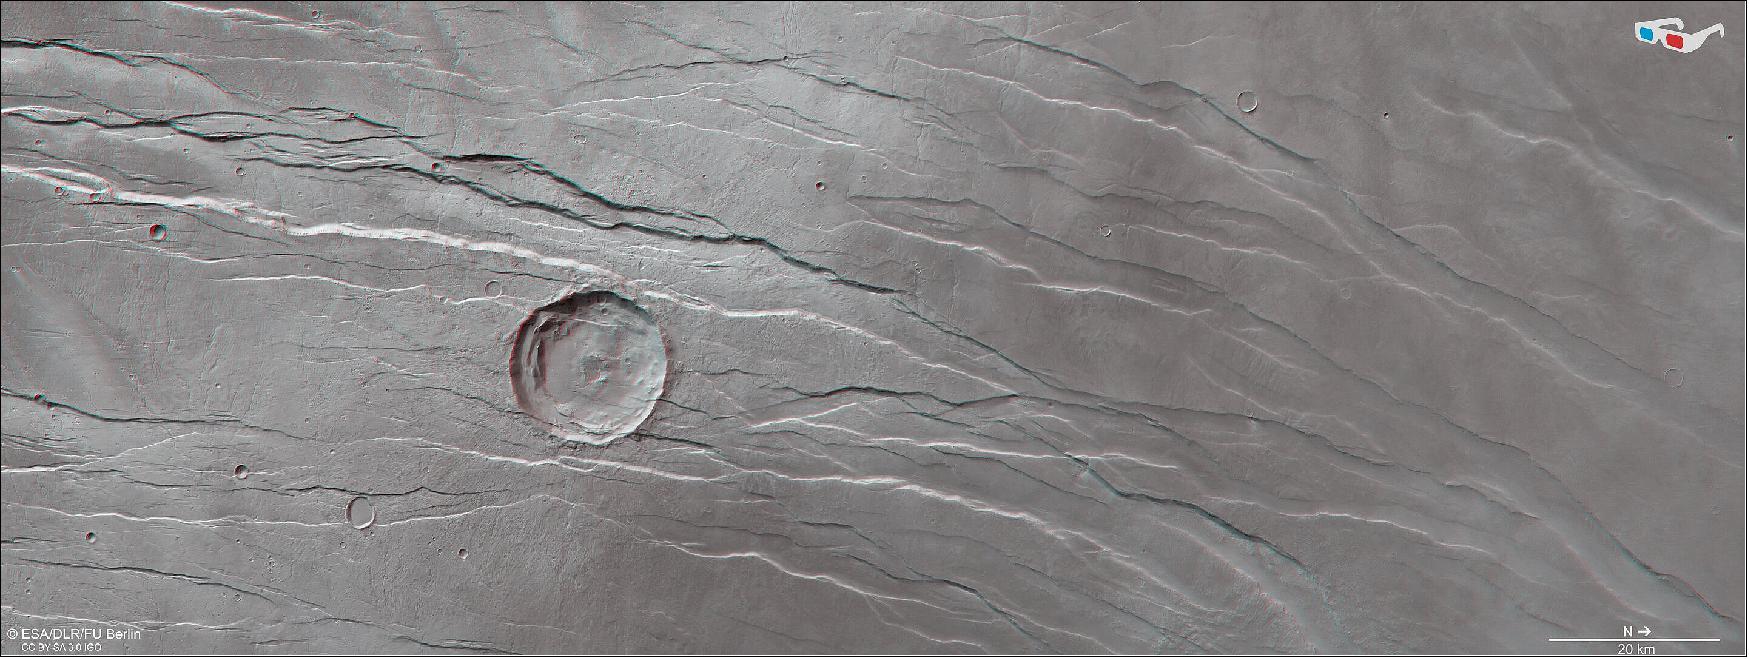
- Throughout this Mars Express image, numerous grabens can be seen running roughly northeast (bottom-right) to southwest (top-left), Figure 17.
- These structures are thought to have formed not at the same time but one after the other, providing scientists the opportunity to reconstruct a past timeline and picture of what created this dramatic landscape.
- The large impact crater at the centre of the image, for example, is crosscut by grabens, indicating that it was already present before the volcano was uplifted to create the Tantalus Fossae faults. The second-largest impact crater (far smaller and to the bottom-left of the central crater) appears to superpose the faults, and is therefore likely to be younger.
- Upon closer look, many small, branching valleys can be seen across this region. These valleys appear to cut directly through the grabens, and so are assumed to be older.
- As shown most clearly in the associated topographic view (Figure 20), the northern (right) part contains far lower terrain than the southern (left) part – in places, as much as three kilometres lower in altitude. We would expect any small, branching valleys to run along the slopes of Alba Mons and merge where the ground is lowest, but this is not seen here, implying that the valleys must originate from more ancient times – before Alba Mons rose to sculpt this terrain into what we see today.
- This area is named after Tantalus, a son of Zeus and Plouto who, according to Greek legend, betrayed the gods and was forced by Hades to stand in water beneath a fruit tree. When he tried to drink the water retreated, and when he tried to eat the branches moved beyond his reach – a punishment known as the torments of Tantalus.
Exploring Mars
- Mars Express has been orbiting the Red Planet since 2003, imaging Mars’ surface, mapping its minerals, identifying the composition and circulation of its tenuous atmosphere, probing beneath its crust, and exploring how various phenomena interact in the martian environment.
- The mission’s High Resolution Stereo Camera (HRSC), responsible for these new images, has revealed much about Mars’ diverse surface features, with recent images showing everything from wind-sculpted ridges and grooves to volcanoes, impact craters, tectonic faults, river channels and ancient lava pools.
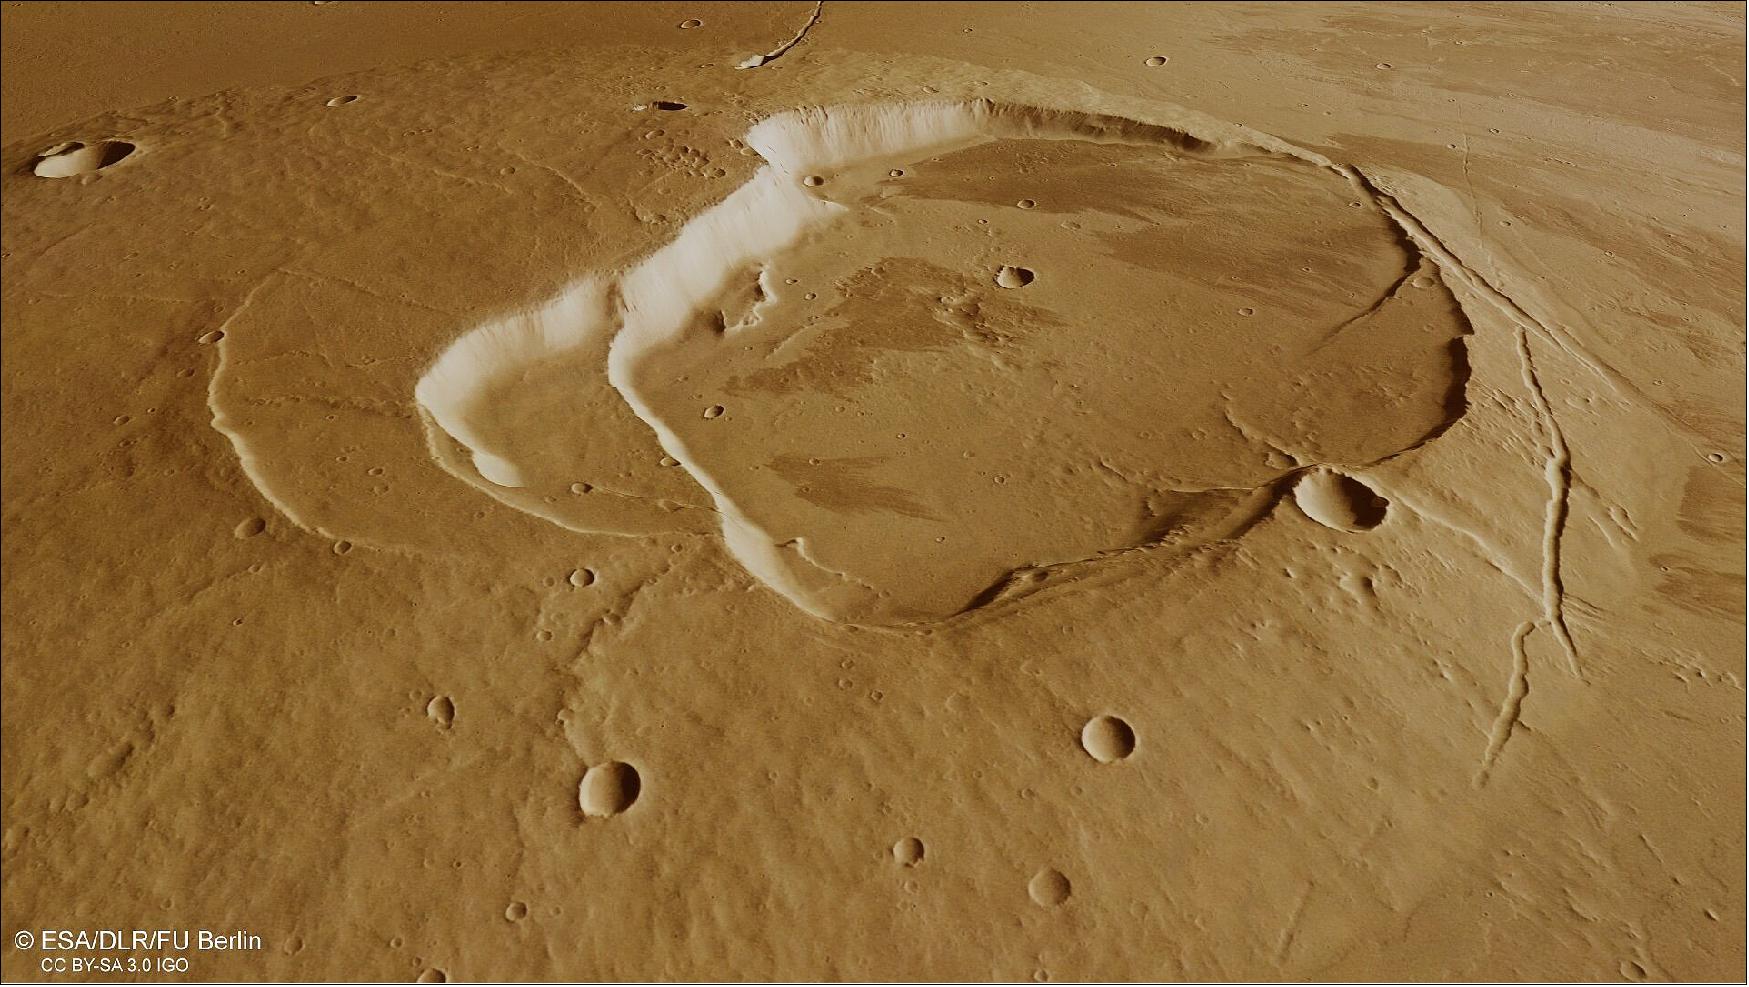
• March 30, 2022: New views from ESA’s Mars Express reveal fascinating ice-related features in Mars’ Utopia region – home to the largest known impact basin not only on the Red Planet, but in the Solar System. 9)
- Utopia is one of three major basins in Mars’ northern hemisphere (along with Acidalia and Arcadia) and has a diameter of roughly 3,300 km: just under twice the north-south size of Earth’s Sahara Desert.
- This image shows a slice of Utopia Planitia, the plain that fills this colossal and ancient basin.
- This plain is thought to have formed as the Utopia basin was filled by a mix of sediments, lavas and volatile substances (those that vaporise easily, such as nitrogen, carbon dioxide, hydrogen and water), all transported across the martian surface by water, wind or other processes.

Layers of ice
- Utopia Planitia is an intriguing and ice-rich region; ice has been spotted lying both at and just below the surface, and at greater depths (detected via observations of fresh craters and pits, and by probing Mars’ deeper layers using radar).
- Visible to the left and right of this scene are large, smooth patches of surface known as ‘mantled deposits’. These are thick layers of ice- and dust-rich material that have smoothed the surface and were likely deposited as snow back when Mars’ rotational axis was much more tilted than it is today (as was last the case some 10 million years ago).
- Moving back towards image centre, the two largest impact craters visible here are surrounded by double-layered mounds of material. A similarly layered appearance is also visible in the deposits that have built up within the craters themselves, and in the craters’ thick rims.
Brain Terrain
- These craters are more interesting still. The second-largest crater in this image (just below-left of centre) showcases a texture known as ‘brain terrain’, where material has become deformed and warped in a concentric pattern that resembles the complex patterns and ridges found on the surface of the human brain.
- Brain terrain is associated with the icy material found near the boundary between Mars’ northern plains and its southern highlands, a ‘dichotomy’ located to the south/south-west (upper left) of this scene.
- Just to the right of the brain-textured crater is an especially dark-coloured region, created as the ice-rich ground contracted and cracked at low temperatures. This formed polygonal patterns and fractures that subsequently captured dark dust blown across Mars by wind, leading to the dark appearance seen here.
- Additionally, scalloped depressions are omnipresent throughout this image. These have circular to elliptical shapes, depths of several tens of metres, and sizes varying from tens to thousands of metres across.
- These features are the result of ground ice either melting or turning to gas, which then causes the surface to weaken and collapse. Upon closer look, layered mantled deposits can also be seen in and around these scalloped depressions.
A Diverse Surface
- Mars Express has been orbiting the Red Planet since 2003, imaging Mars’ surface, mapping its minerals, identifying the composition and circulation of its tenuous atmosphere, probing beneath its crust, and exploring how various phenomena interact in the martian environment.
- The mission’s High Resolution Stereo Camera (HRSC), responsible for these latest images, has revealed much about Mars’ diverse surface features, with recent image releases showing everything from wind-sculpted ridges and grooves to geologically rich regions filled with volcanoes, impact craters, tectonic faults, river channels and ancient lava pools. The camera has also captured other views of Utopia Planitia, such as a snapshot of Adamas Labyrinthus.
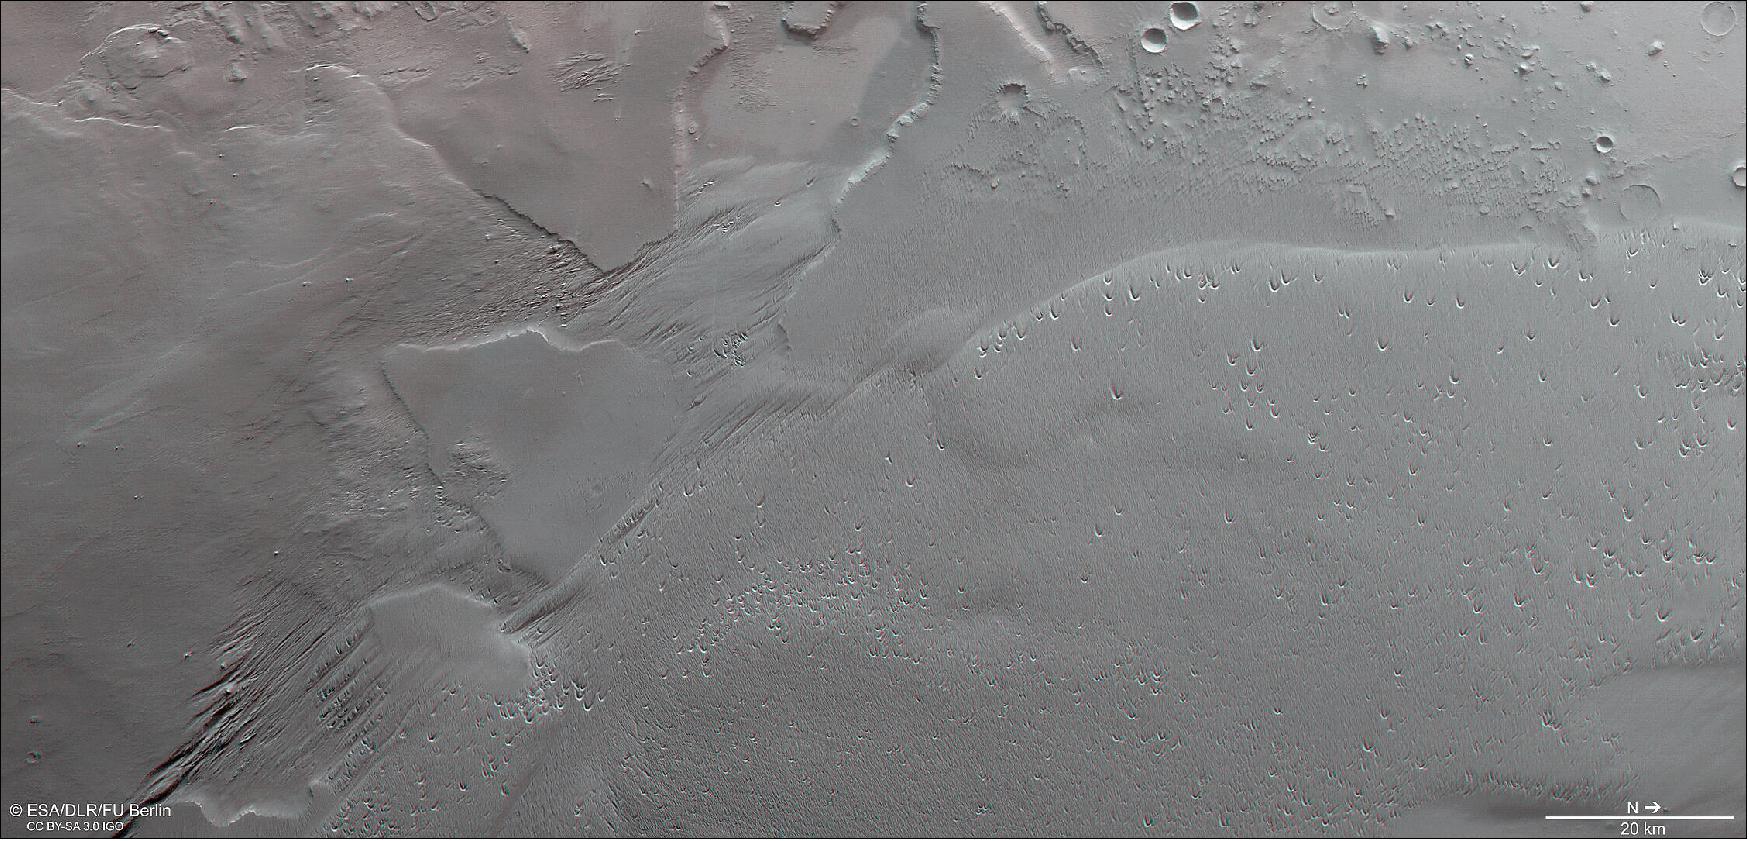
• February 23, 2022: This image from ESA’s Mars Express shows part of possibly the largest single source of dust on Mars: a wind-sculpted feature known as the Medusae Fossae Formation (MFF). 10)
- The MFF is not only a veritable dust factory, but also remarkably extensive – it is the largest sedimentary deposit on the planet and stretches out discontinuously for more than 5000 km, covering an area about the size of India. It is named for the Greek mythological Gorgon Medusa, who was able to turn those who looked into her eyes to stone, with the suffix ‘fossae’ being Latin for trenches or hollows.
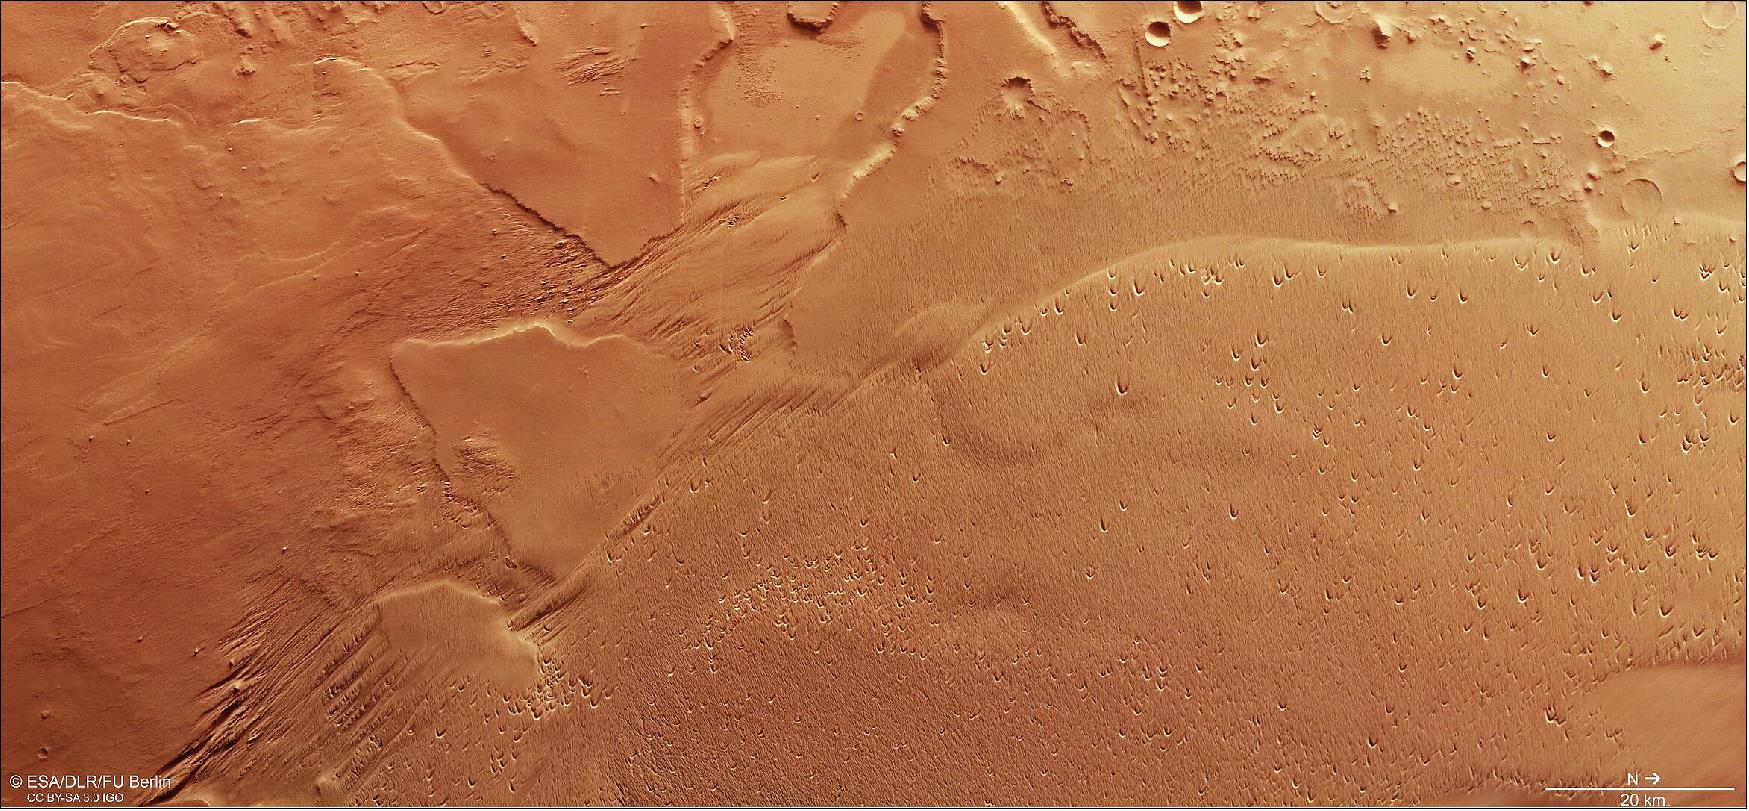
- The formation is found along the boundary between Mars’ southern highlands and northern lowlands (known as the martian dichotomy), and sits between the planet’s two most prominent volcanic regions (Tharsis and Elysium). It also contains the Eumenides Dorsum mountain range, the edges of which can be seen in the gentle elevation extending out of the bottom right of the frame (northeast).
- This change in elevation can be seen especially clearly in the accompanying topographic map (Figure 30) of this slice of martian surface.
![Figure 29: This image shows Medusae Fossae, the largest sedimentary deposit on Mars and an intensely wind-sculpted landscape, in wider context. The area outlined by the bold white box indicates the area imaged by the Mars Express High Resolution Stereo Camera on 14 May 2021 during orbit 21948 [image credit: Topography data by MOLA Science Team, Map compilation by freie Universität Berlin using GMT4 (NASA/MGS/MOLA Science Team)]](https://www.eoportal.org/ftp/satellite-missions/m/MarsExpress_200722/MarsExpress_Auto4E.jpeg)
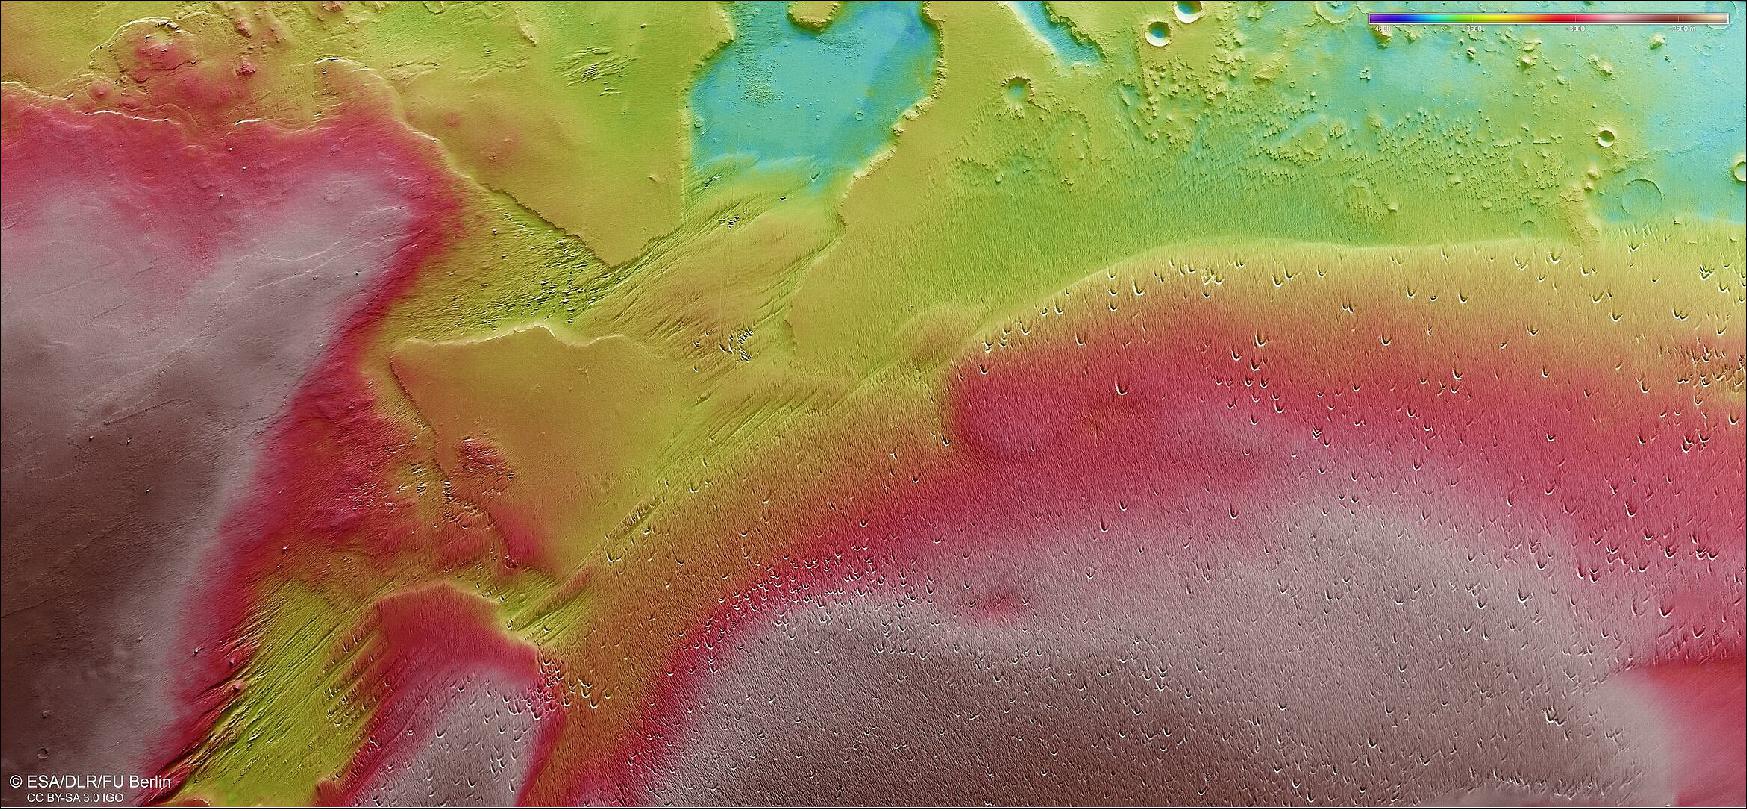
- Here, the edges of Eumenides Dorsum can be seen in shades of red, climbing above the lower-lying surrounding terrain.
Easily Eroded
- Many different surface features comprise the MFF, which appears to be easily eroded by wind. Its surface alternately appears to be smooth and gently undulating, as seen to the upper left of the frame (southwest), wind-sculpted into kilometre-long ridges and grooves known as yardangs, as seen to the centre and lower-left (southeast), and pitted with small, crescent-shaped depressions, visible to the lower right (northeast).
- Wind is a powerful sculptor on the Red Planet – as well as here on Earth. Mars Express has spied several other landscapes on Mars that have been significantly shaped by wind, such as Nili Fossae, Arabia Terra, Syrtis Major, southern dunes, and Schiaparelli crater.
- In fact, this region likely formed as a result of wind moving material around on Mars’ surface. The MFF is thought to consist of ash released by the volcanoes in the nearby Tharsis region – including Olympus Mons, the largest volcano in the Solar System – that has been deposited either through the air or via fast-moving ‘pyroclastic’ flows of lava, gas and rocky debris.
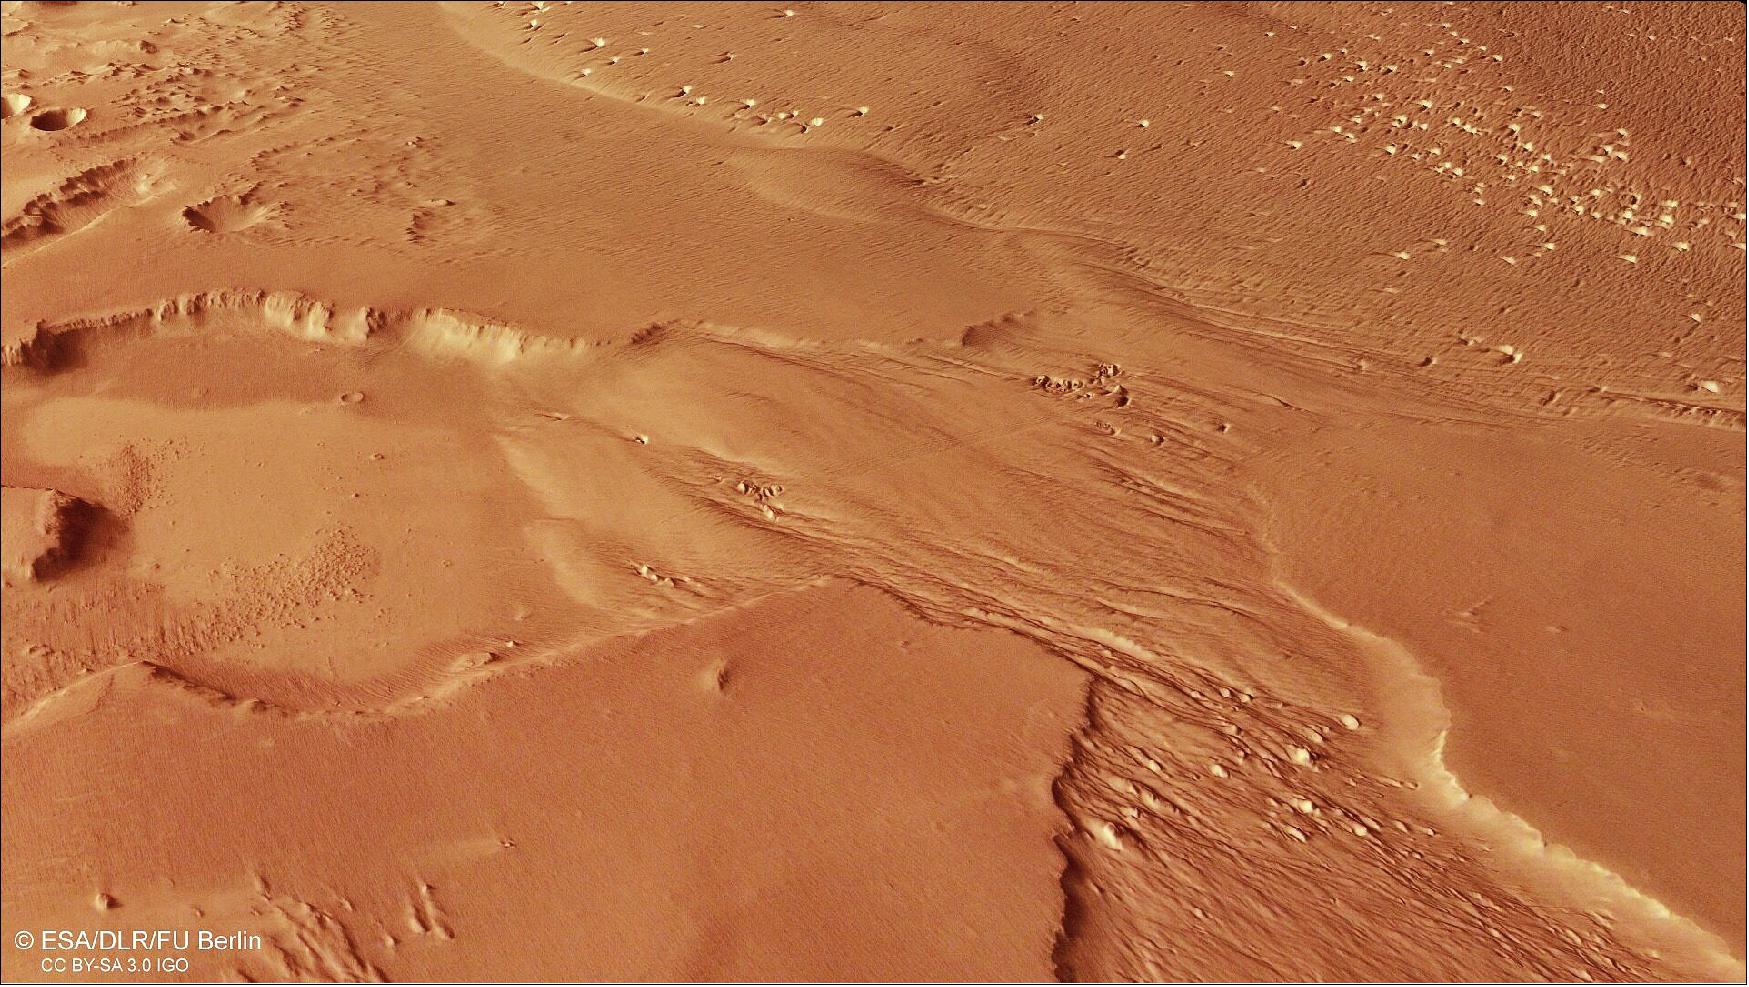
Eddies and Blowouts
- The aforementioned crescent-shaped depressions are also the doing of martian winds. These saucer- or trough-shaped hollows, known as blowouts, are apparently carved into the sand by wind erosion. To create a blowout, sand-laden wind whips along and erodes the smooth surface until it hits an obstacle – a buried object such as a rock or more resistant patch of sediment, for example. The wind is then forced around and beneath the object, creating an eddy, before finally heading back upwards, lifting sand with it as it goes.
- Wind erosion is thought to be the latest stage of erosional processes acting on the MFF. This is evidenced by the general lack of craters seen on the formation’s surface; if wind erosion had occurred long ago only, we would expect to see more recent craters atop the wind-sculpted terrain. Overall, the fact that only a few craters are visible here, sitting alongside underlying older rock that has subsequently been covered and draped in dust, implies that the region’s surface is young.
- Exploring the surface features and geology of Mars is a key objective of Mars Express. Launched in 2003, the spacecraft has been orbiting the Red Planet for nearly two decades; it has since been joined by the ESA-Roscosmos ExoMars Trace Gas Orbiter (TGO), which arrived in 2016, while the ExoMars Rosalind Franklin rover and its accompanying surface science platform are scheduled for launch in 2022. Together, this fleet of martian explorers is working towards a fuller understanding of Mars and its intriguing landscapes.
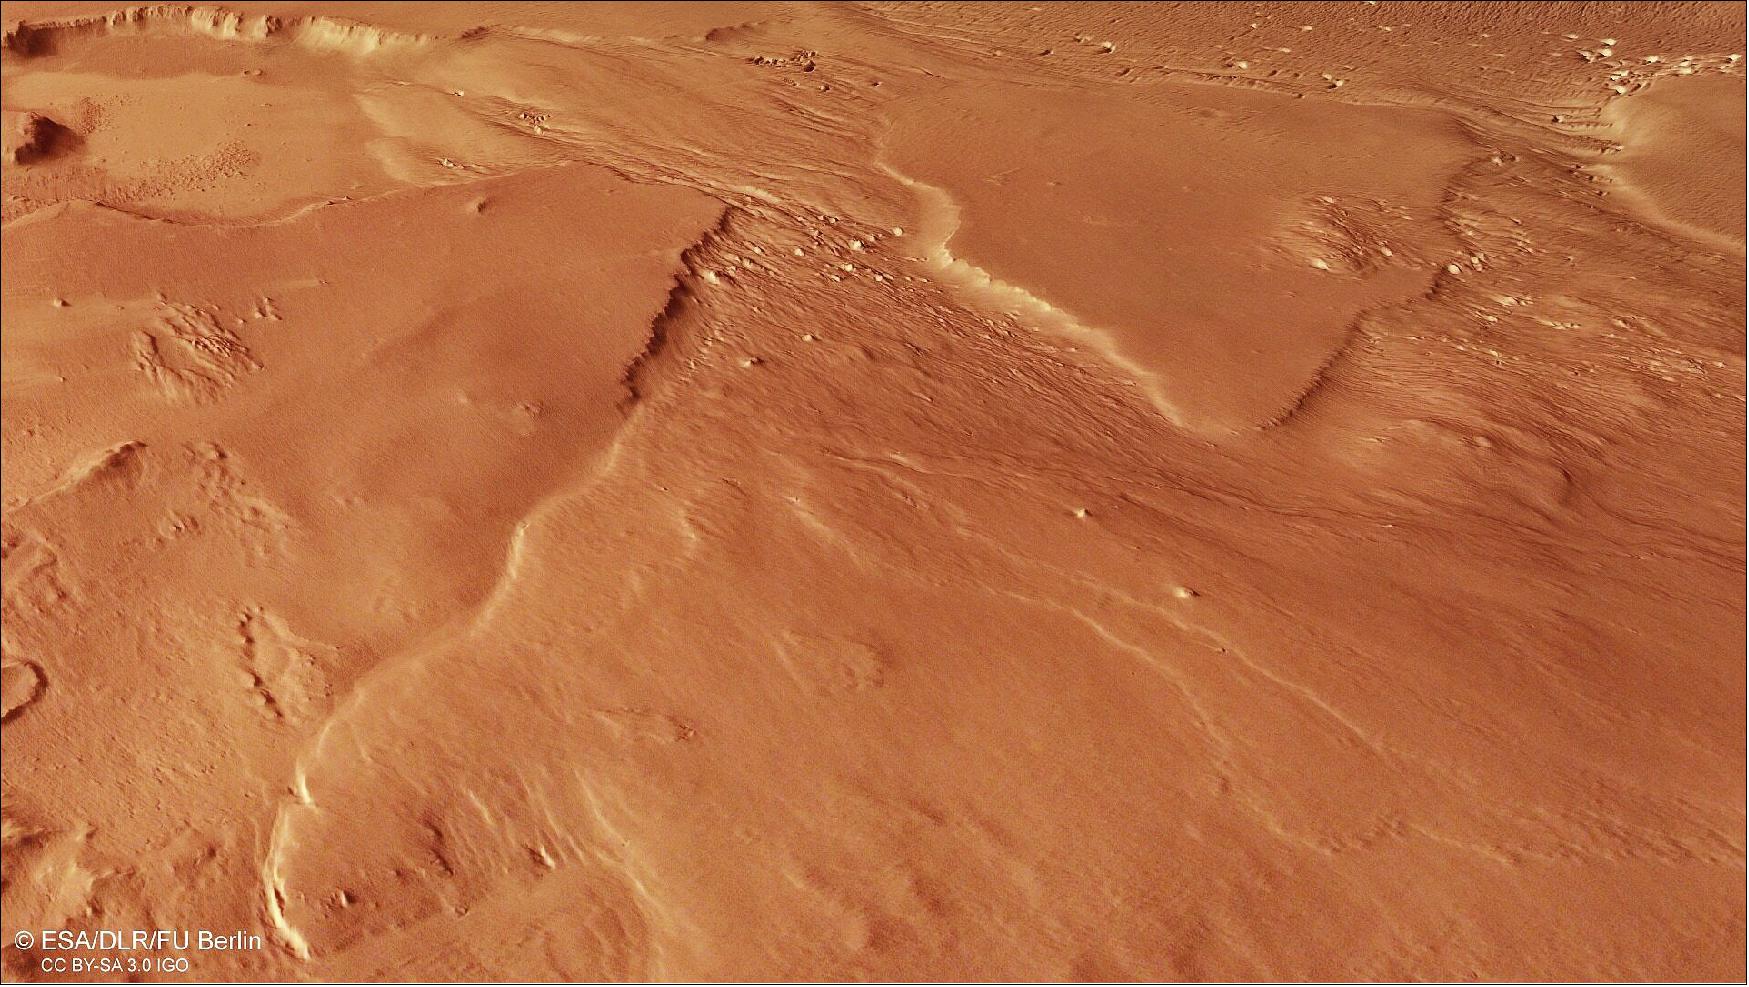
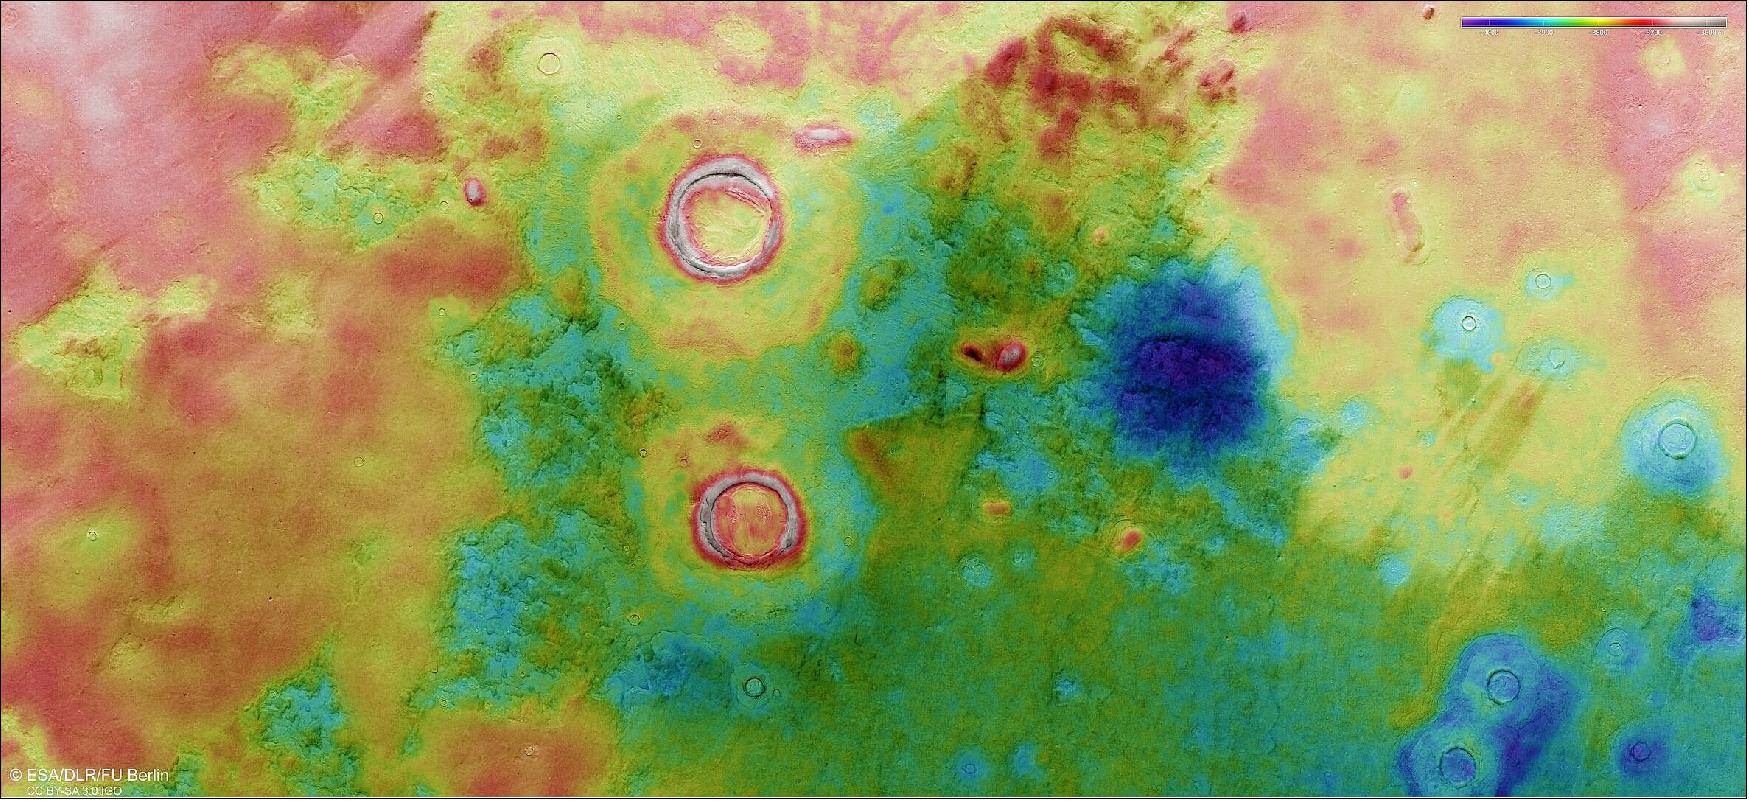
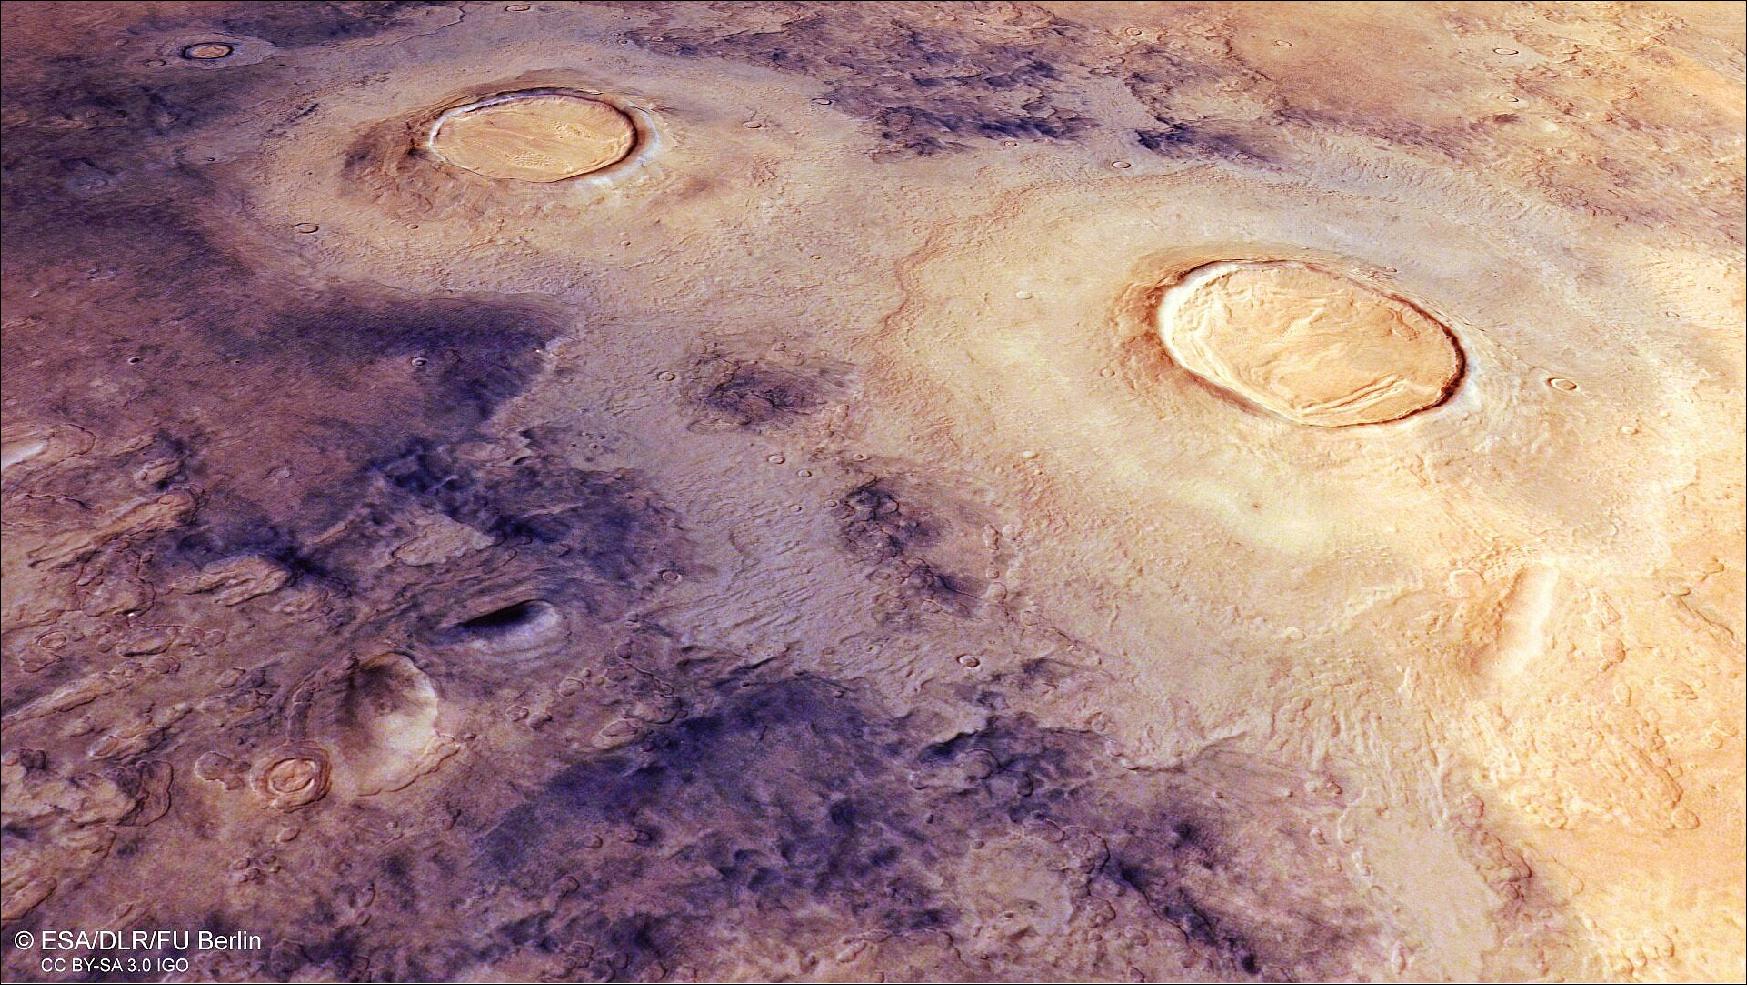
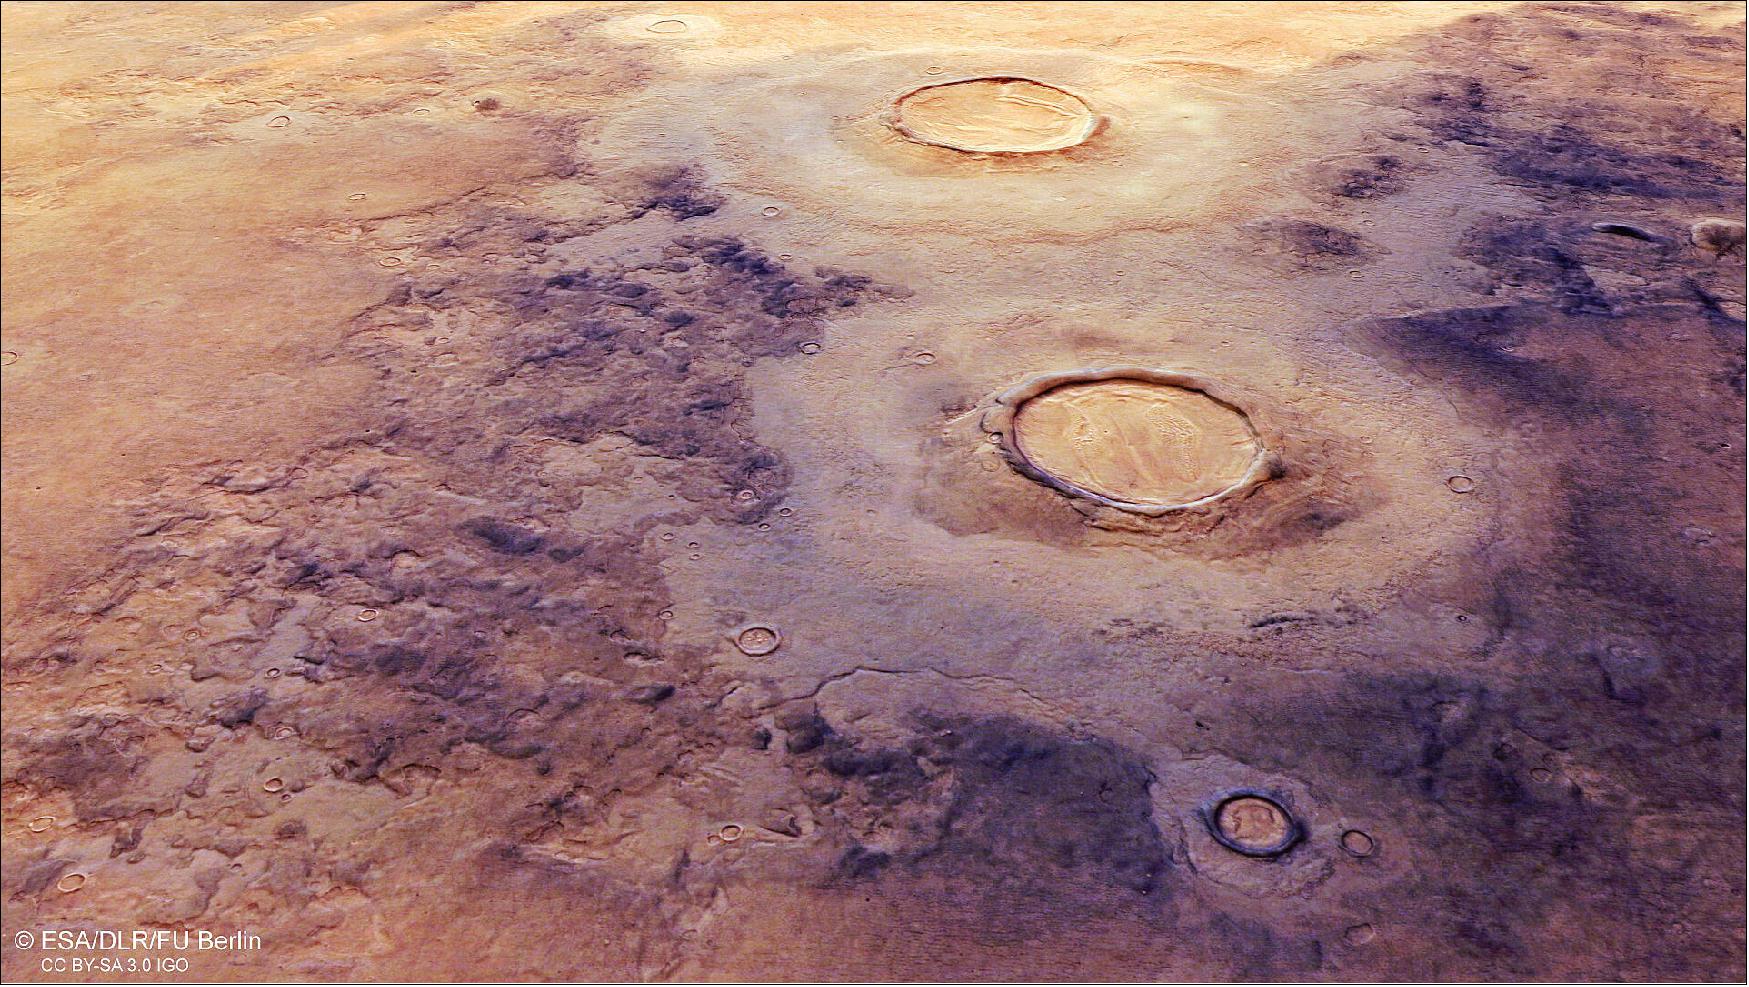
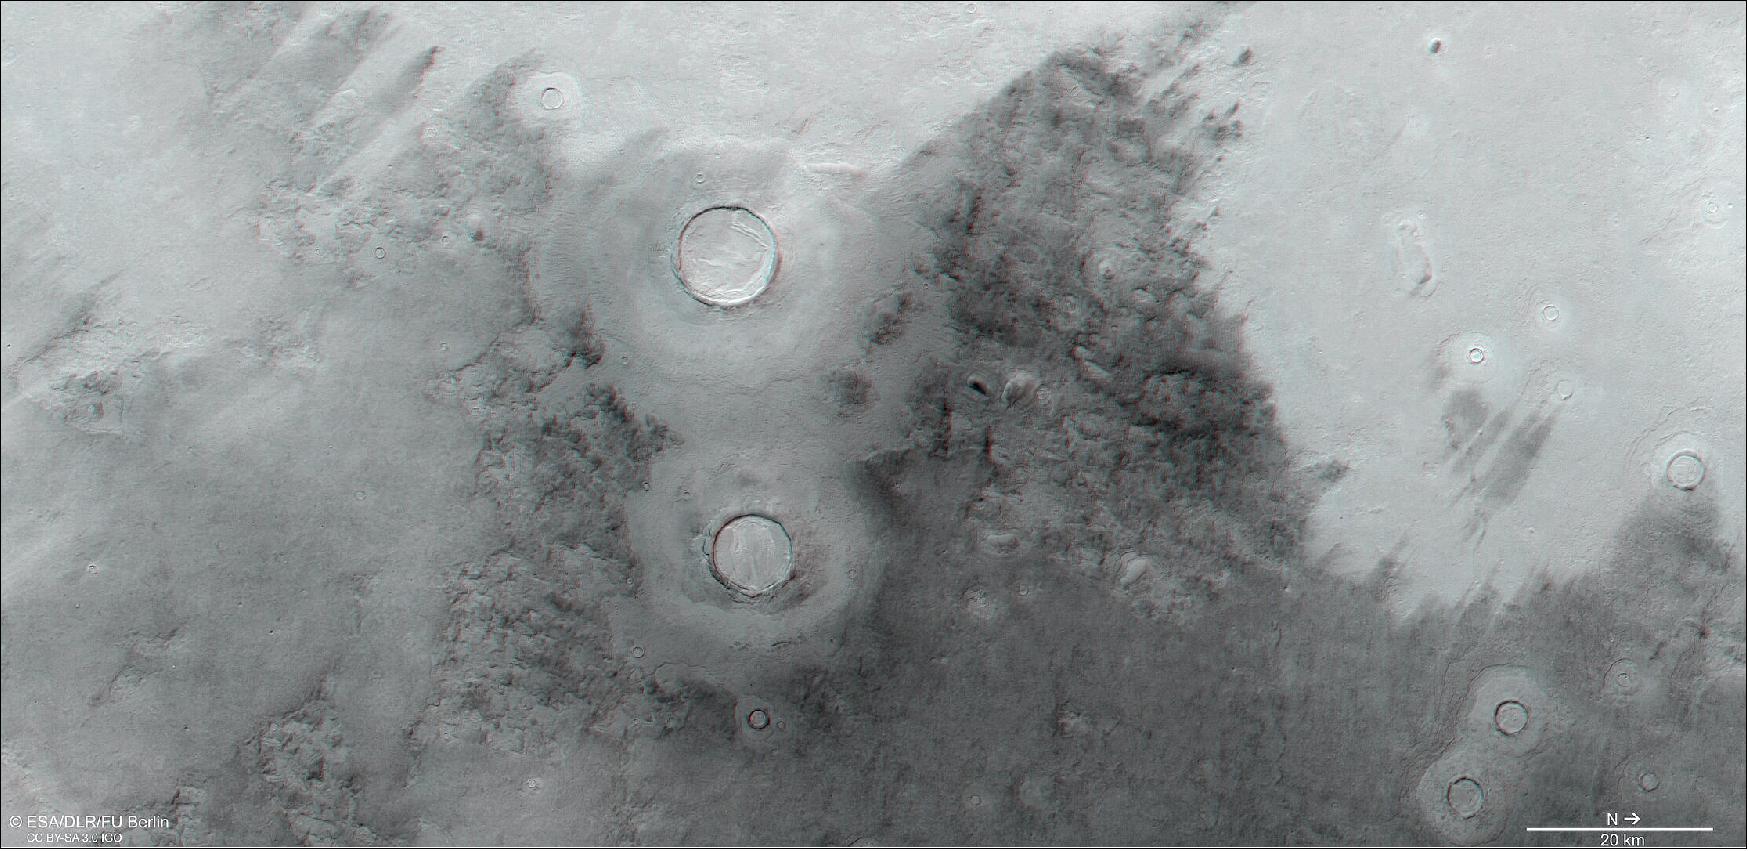
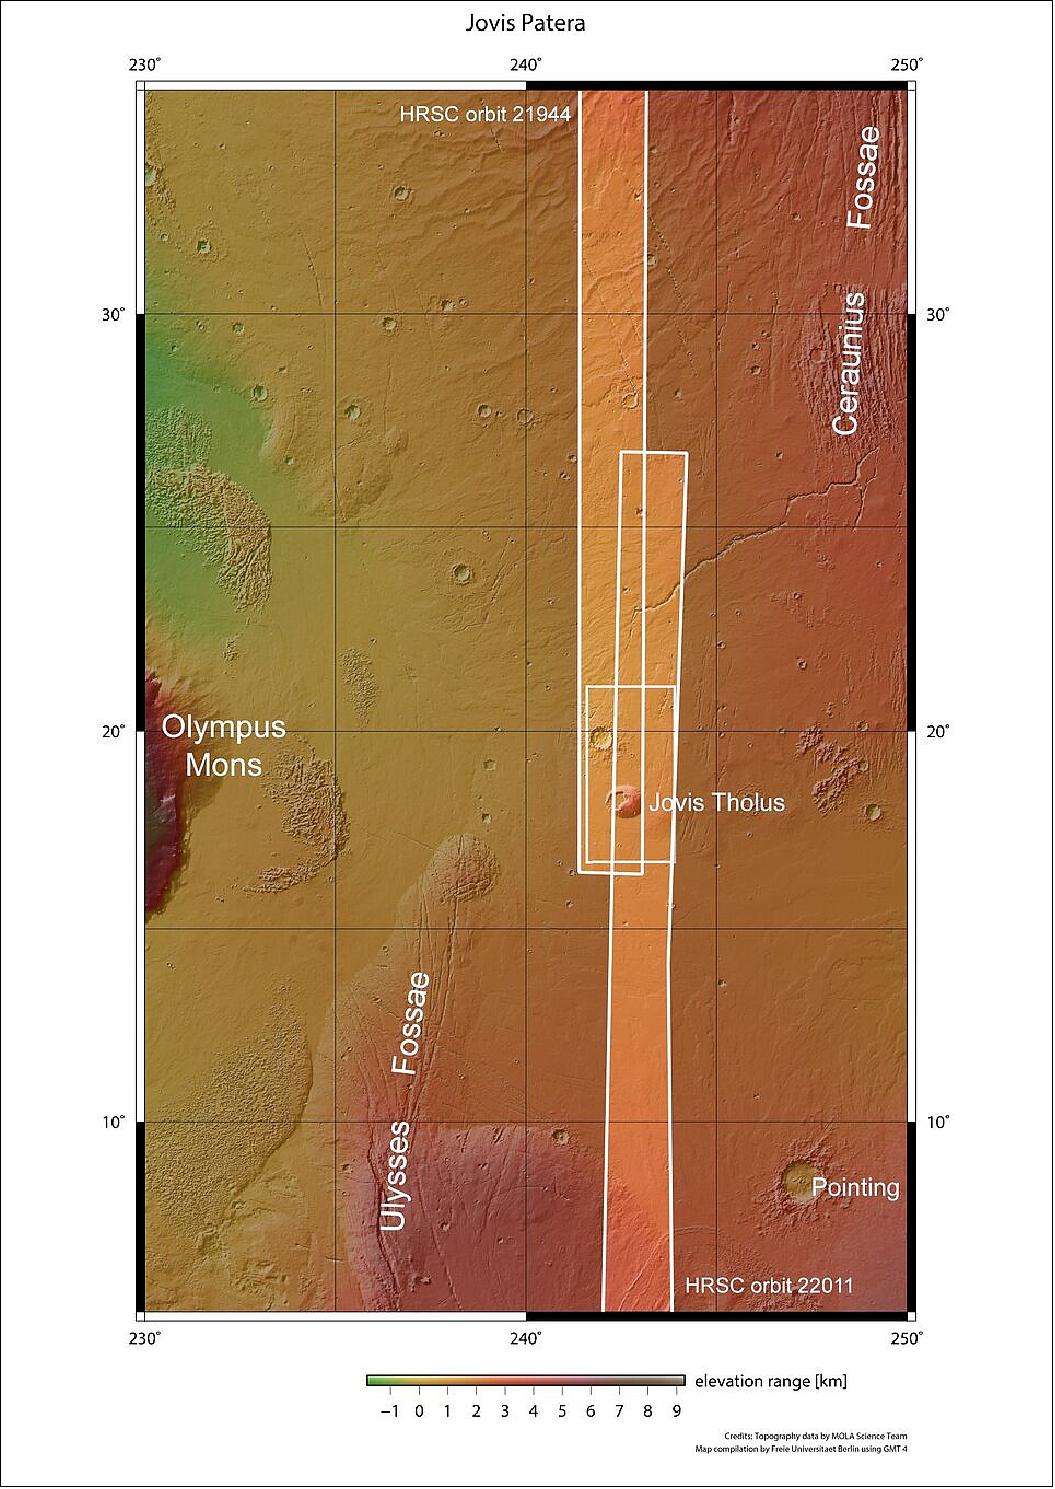
• January 26, 2022: Volcanoes, impact craters, tectonic faults, river channels and a lava sea: a vast amount of information is captured in a relatively small area in this geologically rich new image from ESA’s Mars Express. 11)
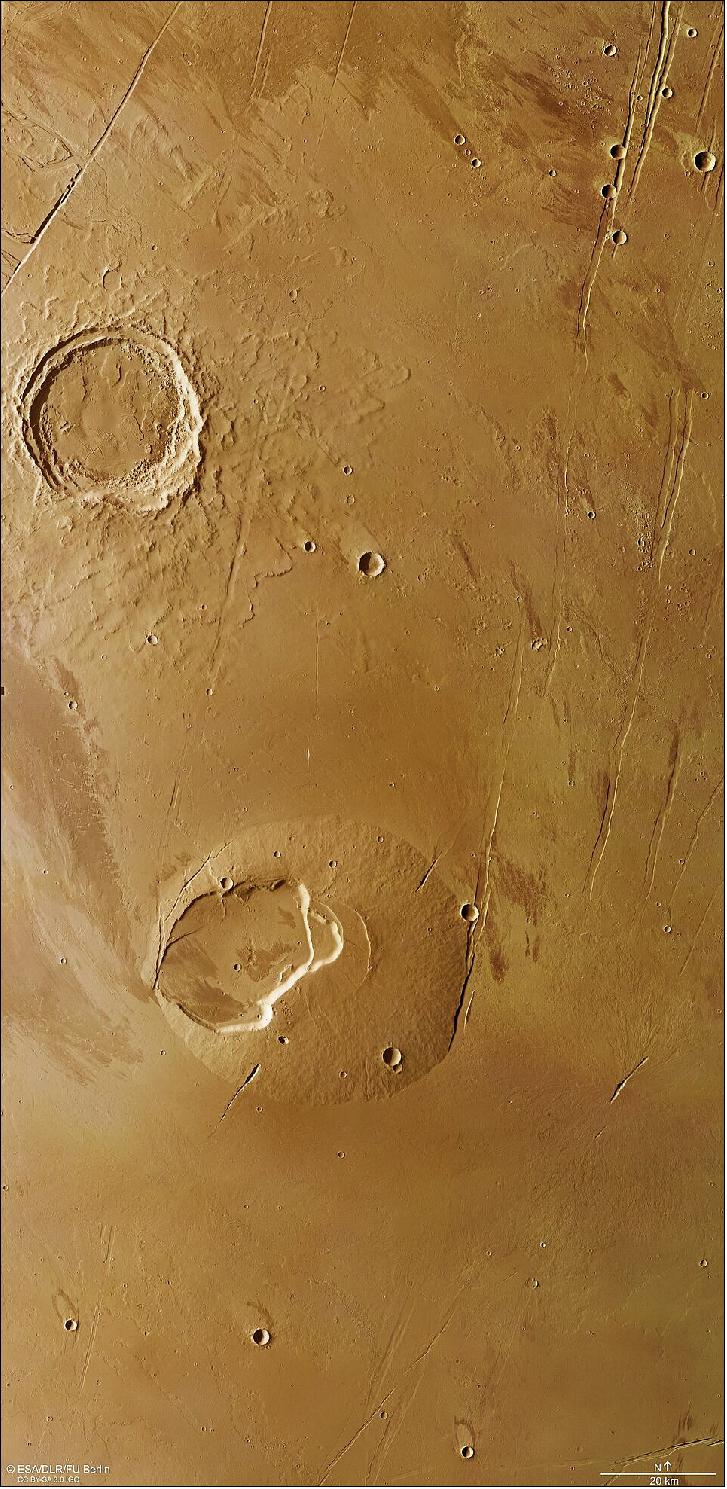
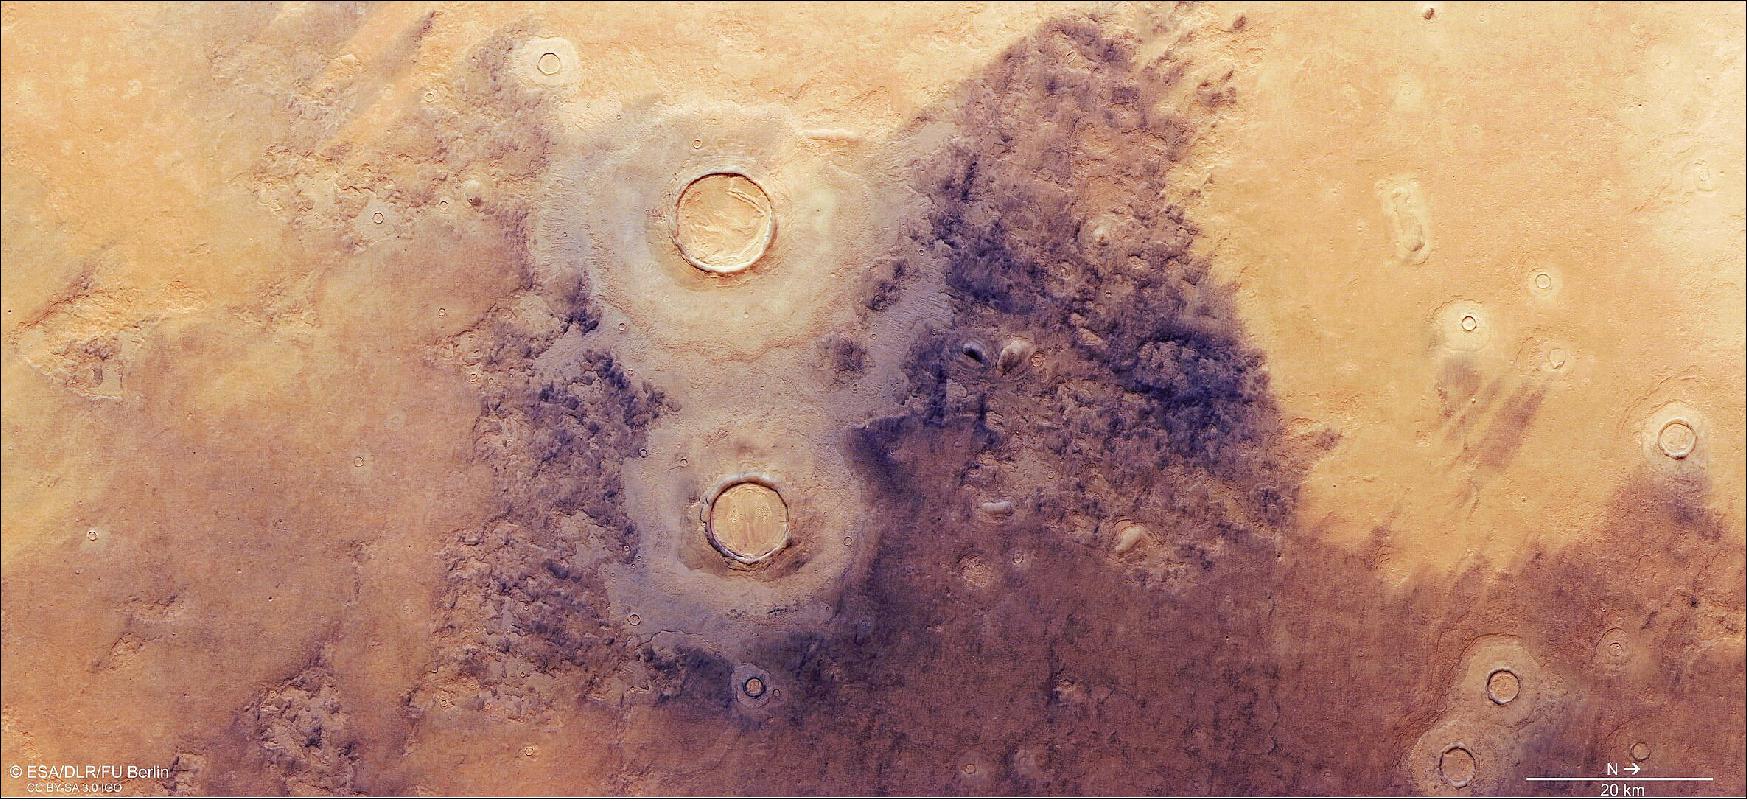
- At first glance, two contrasting circular features jump out of this scene: a volcano that rises gently above the surface with a collapsed caldera system, and an impact crater that digs down below. Both features have different stories to tell.
Volcano in a Lava Sea
- Lying in the shadows of the Solar System’s largest volcano, Olympus Mons, the much smaller Jovis Tholus shield volcano bears its own evidence of a long eruptive history.
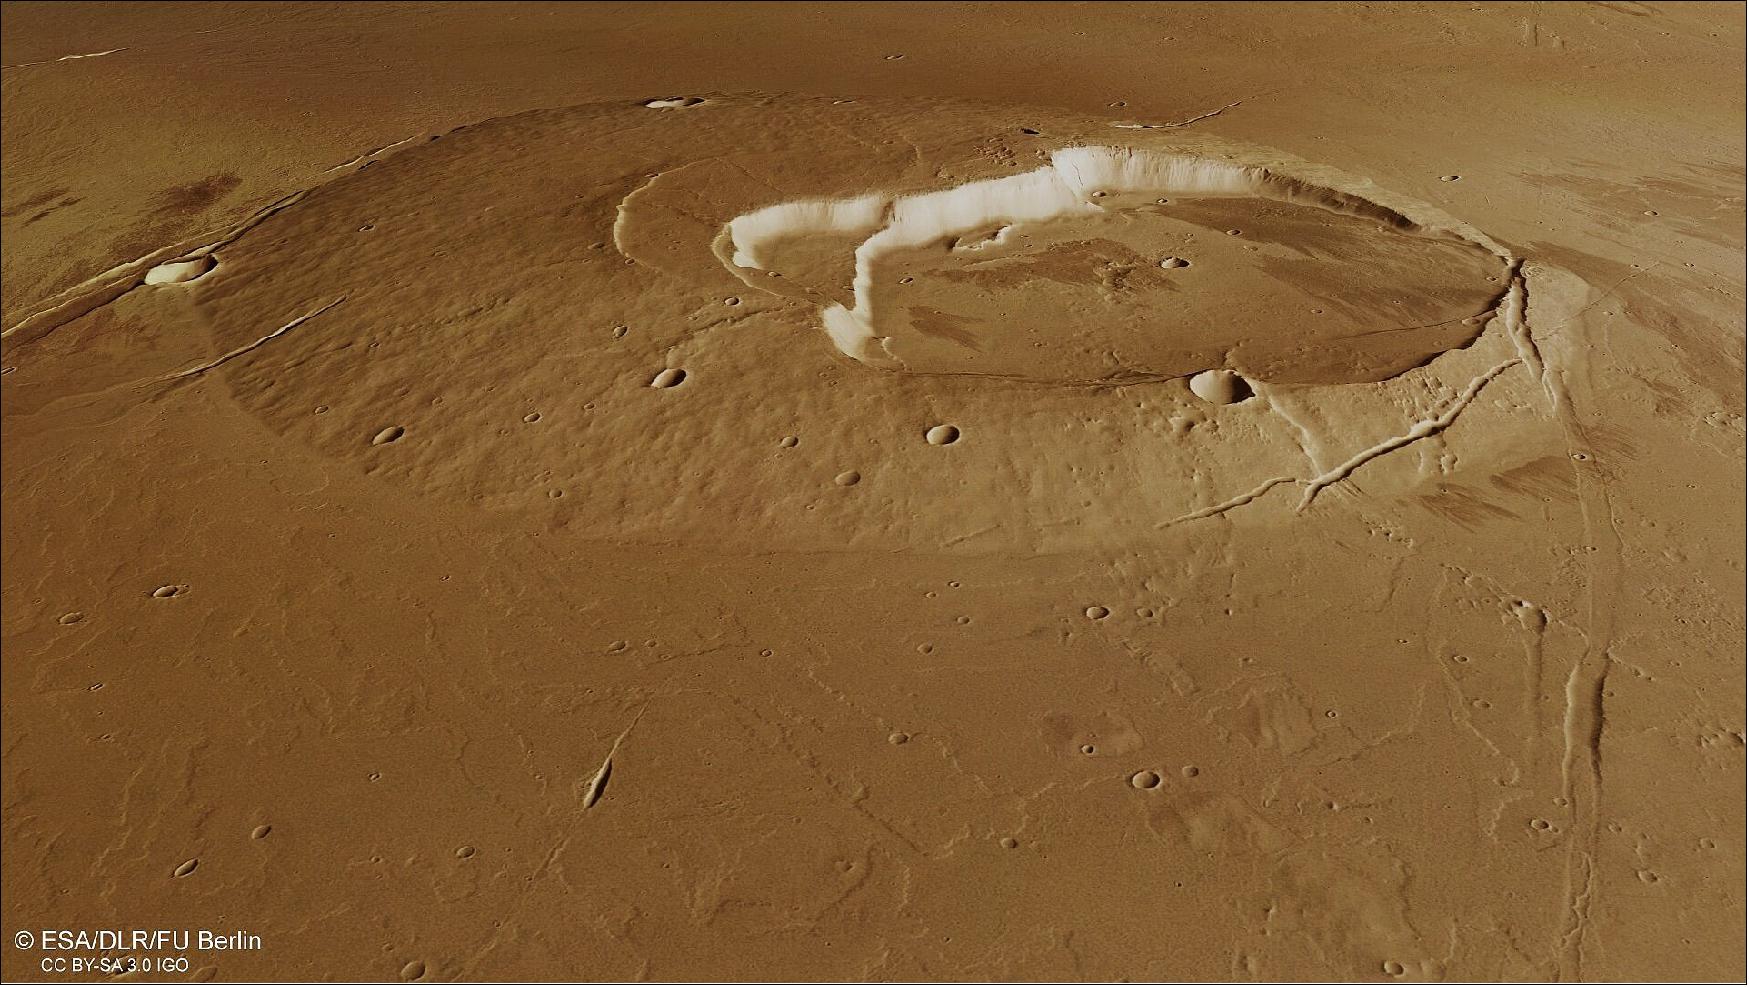
- Its complex caldera system comprises at least five craters. The largest is about 28 km wide, and sits off centre, as clearly seen in the plan view images. The calderas step down towards the southwest where the youngest eventually meets with the surrounding sea of even younger lava flows. The lavas create a shoreline around the flanks, obscuring the original relief of the volcano, which now only sits about 1 km above the surrounding plains.
- On closer look, individual lava flows can be found all over the plains. These lava flows have also washed over fault lines, filling in the sets of parallel graben that dominate the north and north east parts of the scene in particular.
- Graben are sunken valleys created when the planet’s crust stretches apart, such as under the pressure of volcanic and tectonic stresses in this region.
- A steep scarp of one of these graben cuts right into the eastern flank of Jovis Tholus. Some portions of this graben can be traced for several kilometers further north, in some places more significantly filled in with lavas.
- A hidden surprise lies close to the east of Jovis Tholus. Easily missed in the main plan view image, the colour-coded topography image gives it away: a less developed volcano subtly causes the surface to bulge.
- Zooming in shows a fissure vent, from which less viscous lava flows than at Jovis Tholus once erupted, perhaps in a similar style to the activity seen in Iceland or Hawaii on Earth.
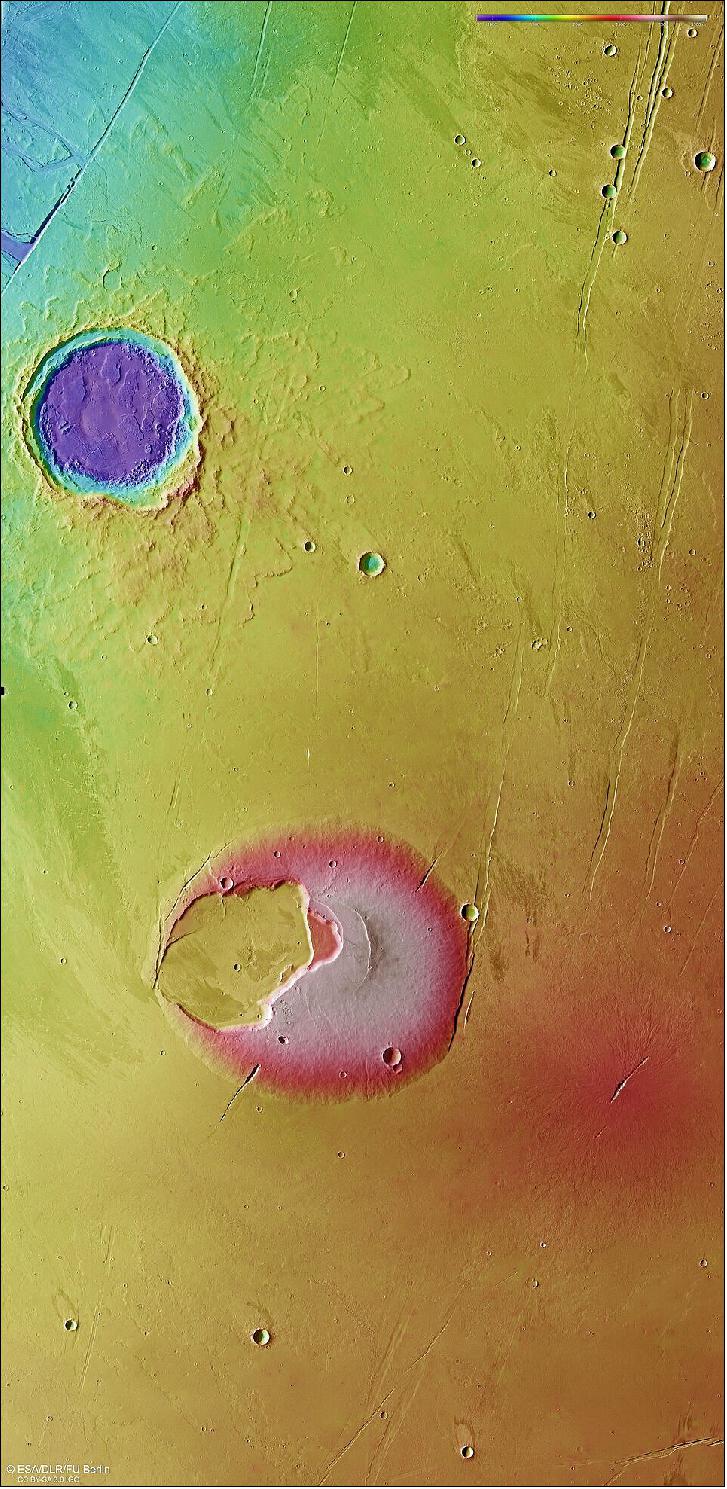
Making a Splash
- In contrast to the volcanic craters, a very different type of crater lies to the north of the region. This 30-km-wide impact crater was created when an asteroid or comet crashed into the surface, penetrating the layers below. Its fractured floor and the fluidised nature of the ejected material around the central crater – giving it the appearance of a flower with many layers of petals – points to the impactor striking a water- or ice-saturated ground.
- More evidence of this region’s watery past lies to the northwest of the crater. Zooming in to the long fault line that truncates the top left of the plan view images are signs of an outflow channel. Water bursting out from here in the past formed streamlined islands and terraced channel walls.
- Some much smaller channels can be found crosscutting the northern ejecta blanket of the large impact crater as well.
- Massive amounts of water were likely purged from underground aquifers over time as a result of volcanic warming melting the ground ice, and as faulting took place, with the water taking the easiest way to the surface through the graben system.
- Taken together, this single scene paints the picture of a fascinating and extremely active planetary history.
- Mars Express has been orbiting the Red Planet since 2003, imaging Mars’ surface, mapping its minerals, identifying the composition and circulation of its tenuous atmosphere, probing beneath its crust, and exploring how phenomena such as the solar wind interacts in the martian environment.
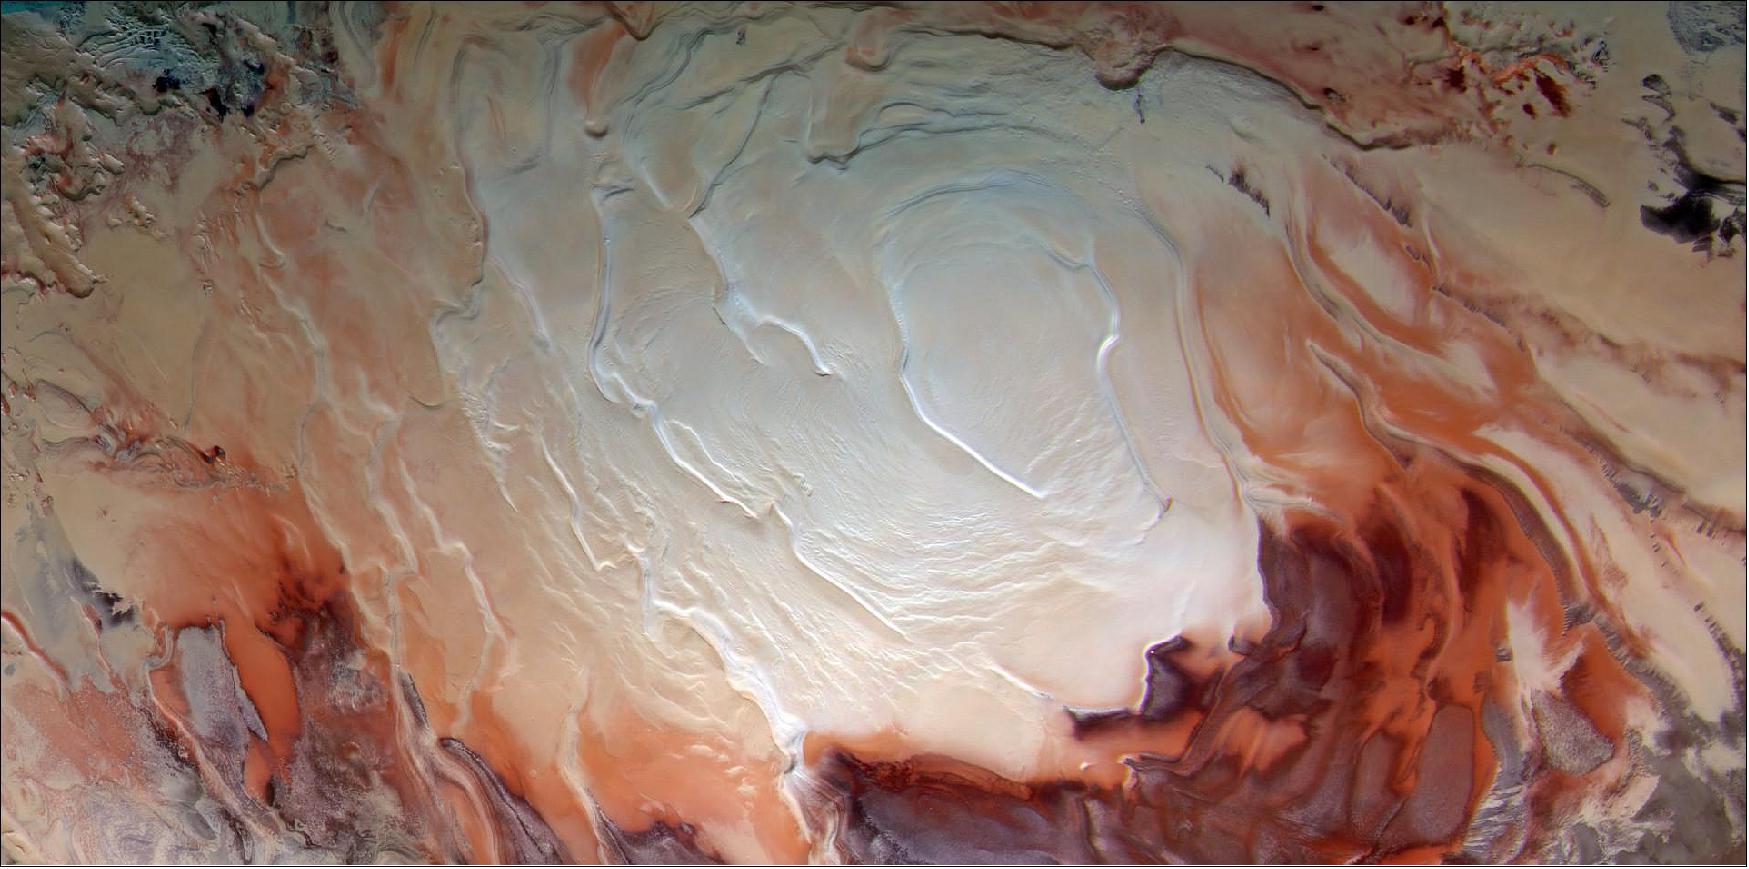
• December 21, 2021: In addition to its enormous volcanoes, huge rift valley systems, and dried-up crater lakes and river valleys, the ice caps at the north and south poles of Mars have been the subject of intensive scientific investigations. These ice caps, which grow in the winter and shrink in the spring and summer, are also a distinctly aesthetic sight. This image, created using data acquired by the German Aerospace Center (Deutsches Zentrum für Luft- und Raumfahrt; DLR) High Resolution Stereo Camera (HRSC) on board the European Mars Express orbiter, shows the planet's South Pole with its ice cover, which is approximately 600 km across. It is springtime in the Martian southern hemisphere, marking the end of the 343-day polar night darkening the surface south of the Arctic Circle, and the increased solar irradiation will soon shrink the ice cap to its summer diameter of 400 km. 12)
- Mars Express, the first planetary mission implemented by the European Space Agency (ESA), has been orbiting Mars since the 25 December 2003. Along with NASA's 2001 Mars Odyssey orbiter, 'MEX' is the spacecraft that has been exploring the Solar System for the longest period of time. One of its seven experiments is the HRSC camera system, developed at DLR in collaboration with German industry, which has been mapping the planet in high resolution since January 2004, both in color and in 3D. The stereo image data recorded by the camera is used to create digital terrain models from which the topography of Mars can be derived.
- This vertical plan view of the South Pole was created using data acquired almost exactly nine years ago, on 17 December 2012 during orbit 11,404, from altitudes of between 1330 and 1700 km. The image resolution is approximately 200 m/pixel. The raw image data were processed by the HRSC team at the DLR Institute of Planetary Research in Berlin-Adlershof. The image was created using data acquired by the blue, green and near infrared sensors, and approximates the true color impression that the human eye would observe from a spacecraft in orbit. The color differences in the ice cover result from alternating layers of ice and dust.
Temperatures Fall Far Below Minus 100 Degrees Celsius
- In 1672, Dutch astronomer Christiaan Huygens discovered the Martian polar ice caps. Just over 100 years later, in 1781, William Herschel observed that the polar ice caps are not centered at exactly 90 degrees north and south from the equator, respectively, but have a slightly offset placement. He also discovered that the ice caps grow and shrink seasonally. In 1976, NASA's Viking 2 spacecraft found that the Martian northern polar cap is comprised of at least 50 percent water ice, with the remaining material being frozen carbon dioxide. The southern polar cap has only a small amount of water ice mixed with carbon dioxide ice. The southern polar cap is up to 1500 meters thick and, like the ice sheet at the North Pole, has a volume of approximately 1.6 million km3. Together, these two poles have slightly more ice than the Greenland ice sheet, which has a volume of just under three million km3.
- During the polar night in the winter months, temperatures at the poles drop below minus 100 degrees Celsius. Mars is an average of 70 million kilometers further away from the Sun than Earth and thus receives less light and warmth – only about 600 W/m2 (Earth receives approximately 1360 W/m2 at the top of its atmosphere). The Martian atmosphere is much thinner than Earth’s and can therefore only generate a much smaller natural greenhouse effect and thus cause the storage of correspondingly less energy.
Dry Ice 'Snows' onto Mars in the Winter
- Because the South Pole of Mars is several thousand meters higher in altitude than the North Pole, temperatures there are even lower during the polar night and can fall to below minus 130 degrees Celsius. This extreme cold causes carbon dioxide to crystallize out of the atmosphere and fall onto the Martian surface as dry ice. This new 'snowfall' causes the polar caps to extend far over the surface of Mars; in the south, this fresh ice layer cover extends to latitudes of 60 to 50 degrees. On Earth, this would be equivalent to Antarctica extending to reach Cape Horn at the southern tip of Chile in South America during the southern winter.
- The Martian atmosphere consists of 95 percent carbon dioxide, together with small quantities of nitrogen and argon, and only traces of water vapor. Calculations indicate that up to one third of the carbon dioxide precipitates out of the atmosphere during the course of a Martian year in the relevant winters, first to one pole, before sublimating again at the beginning of spring, then falling and re-sublimating again at the other pole later in the year. The resulting mass shifts have been detected by multiple observations.
- The somewhat spiral geometry of the ice layers is striking. Its origin is not yet completely understood, but it is thought to be caused by the Coriolis effect, which also acts on Earth. The surface rotation speed of a planet is fastest at its equator and decreases to zero towards the poles. As a result, the warmer air masses flowing from the equator towards the poles are deflected in one direction, while the colder air masses flowing from the poles to the temperate latitudes are deflected in the reverse direction. This leads to characteristic rotational flow patterns, giving rise to eroded structures on the ground. The spiral pattern is much more pronounced at the North Pole of Mars than at the South Pole.
Seasons on Mars and Earth are Similar
- From an astronomical point of view, the seasons on Mars are very similar to those on Earth. Mars is only half the size of Earth, but the three parameters that lead to this almost identical annual cycle as on Earth are easily comparable. Crucial for the occurrence of seasons is the fact that Mars, like Earth, has a rotational axis that is tilted compared to its orbital plane around the Sun. Its axis of rotation is inclined by 25.2 degrees with respect to the ecliptic, which is the plane of Earth's orbit around the Sun. For Earth, the axis tilt is 23.4 degrees. This results in the Martian poles being slightly more shifted to the south and north, respectively. Additionally, the length of a day on planets are comparable; on Earth the rotation period is 24 hours, while on Mars the rotation period, referred to as a 'sol', lasts only 37 minutes longer.
- In addition, the length of a year – the period of time that passes while Earth of Mars complete a 360-degree journey around the Sun – is easily comparable between both planets. For Earth it is 365 days (and an additional quarter of a day – resulting in a leap year every four years), and for Mars it is 687 days. The Martian year is therefore 1.9 times longer than that of Earth, which means that all four seasons on Mars last almost twice as long as they do on Earth.
The HRSC Experiment on Mars Express
- The High Resolution Stereo Camera (HRSC) was developed at the German Aerospace Center (DLR) and constructed in cooperation with several industrial partners (Airbus, Lewicki Microelectronic GmbH and Jena-Optronik GmbH). The science team, led by Principal Investigator (PI) Thomas Roatsch, consists of 50 co-investigators from 35 institutions and 11 nations. The camera is operated by the DLR Institute of Planetary Research in Berlin-Adlershof. Staff from the Department of Planetary Sciences and Remote Sensing at Freie Universität Berlin used the data acquired by the camera system to create the image shown here.
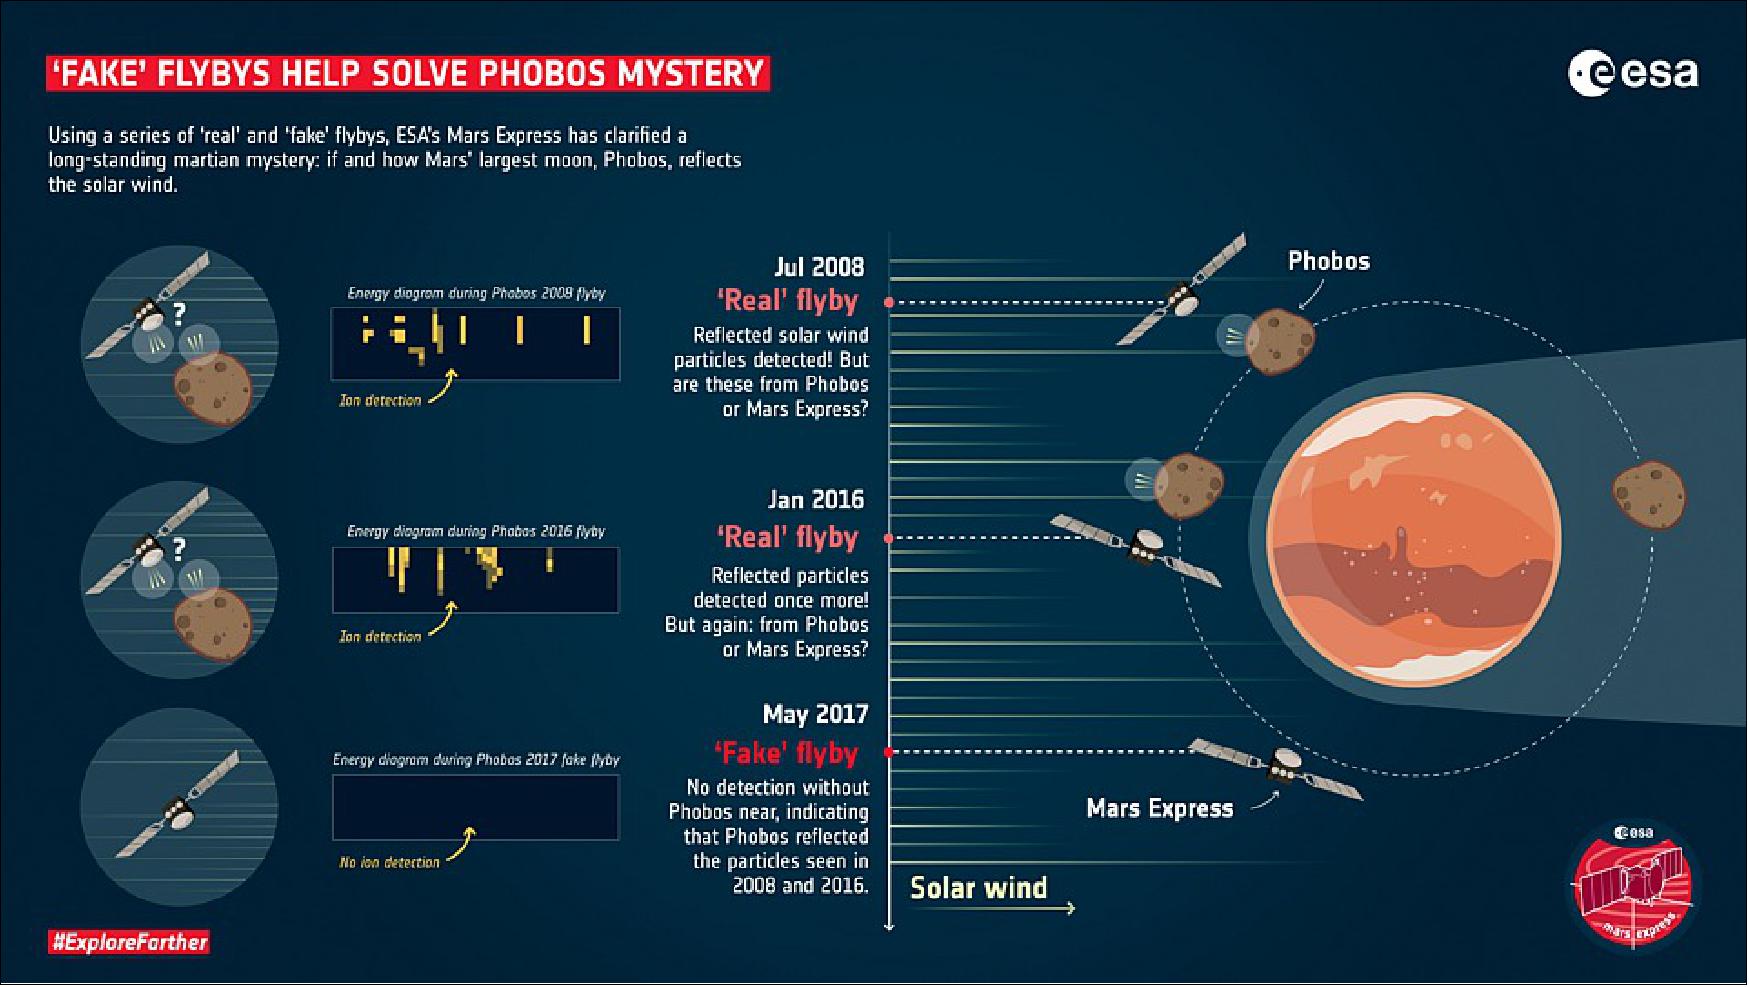
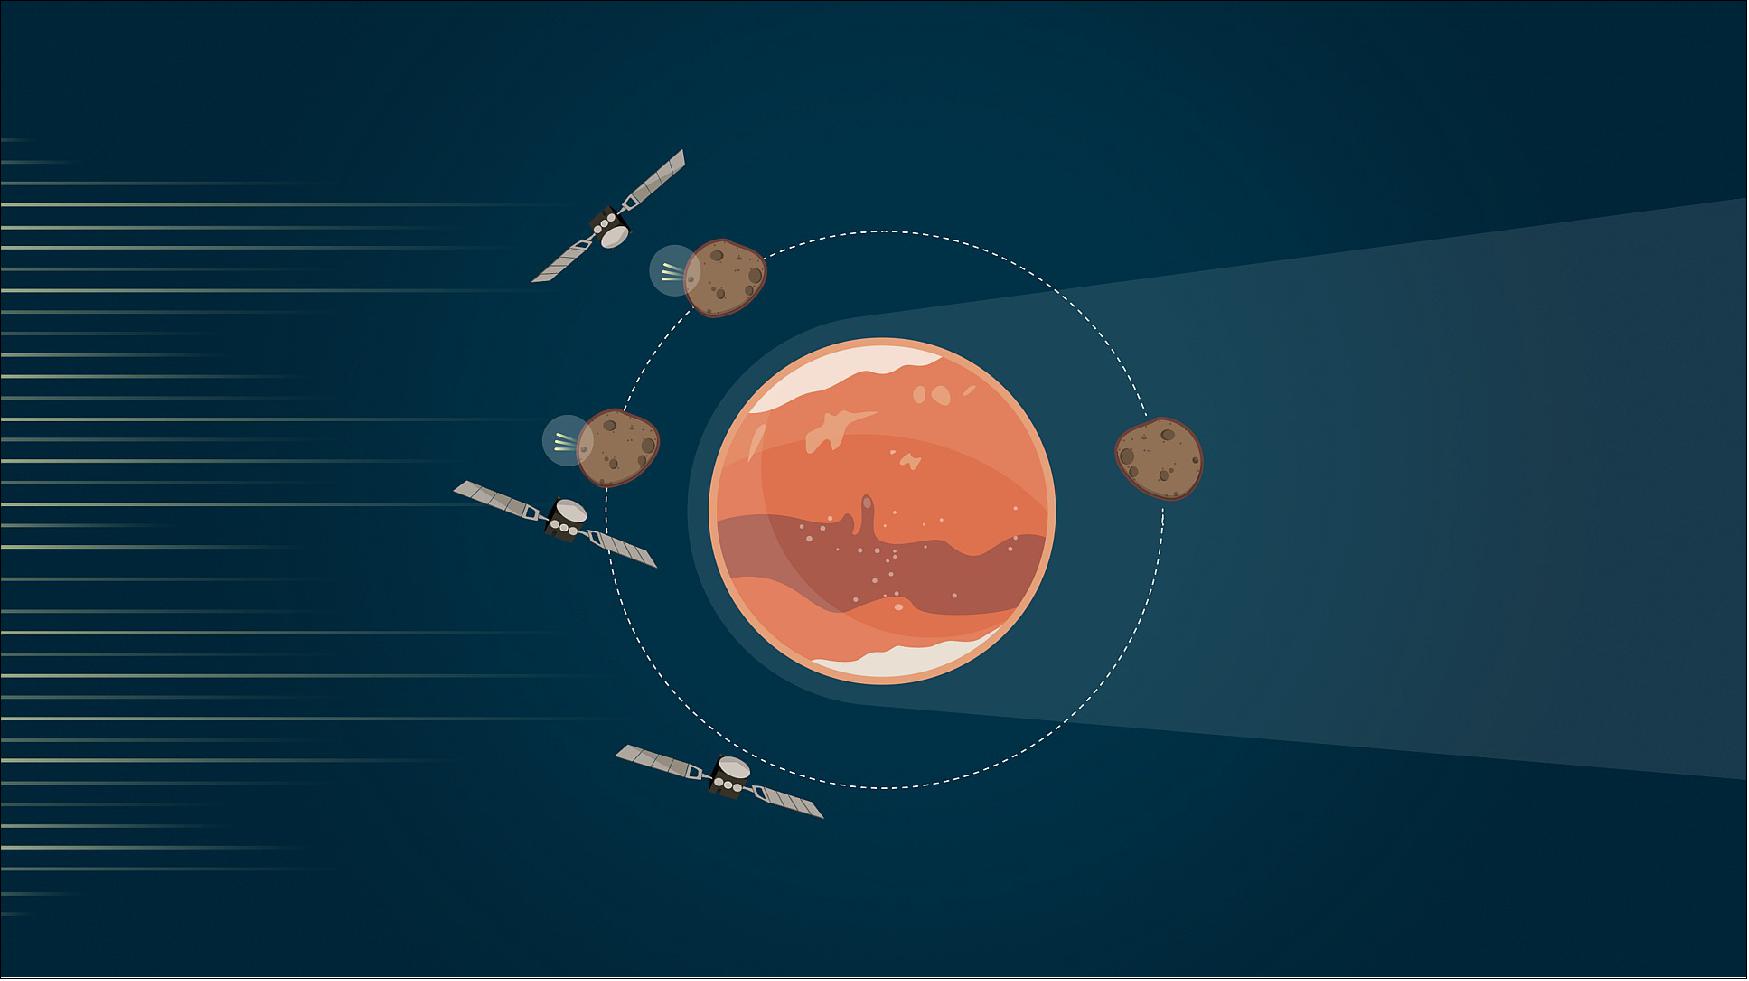
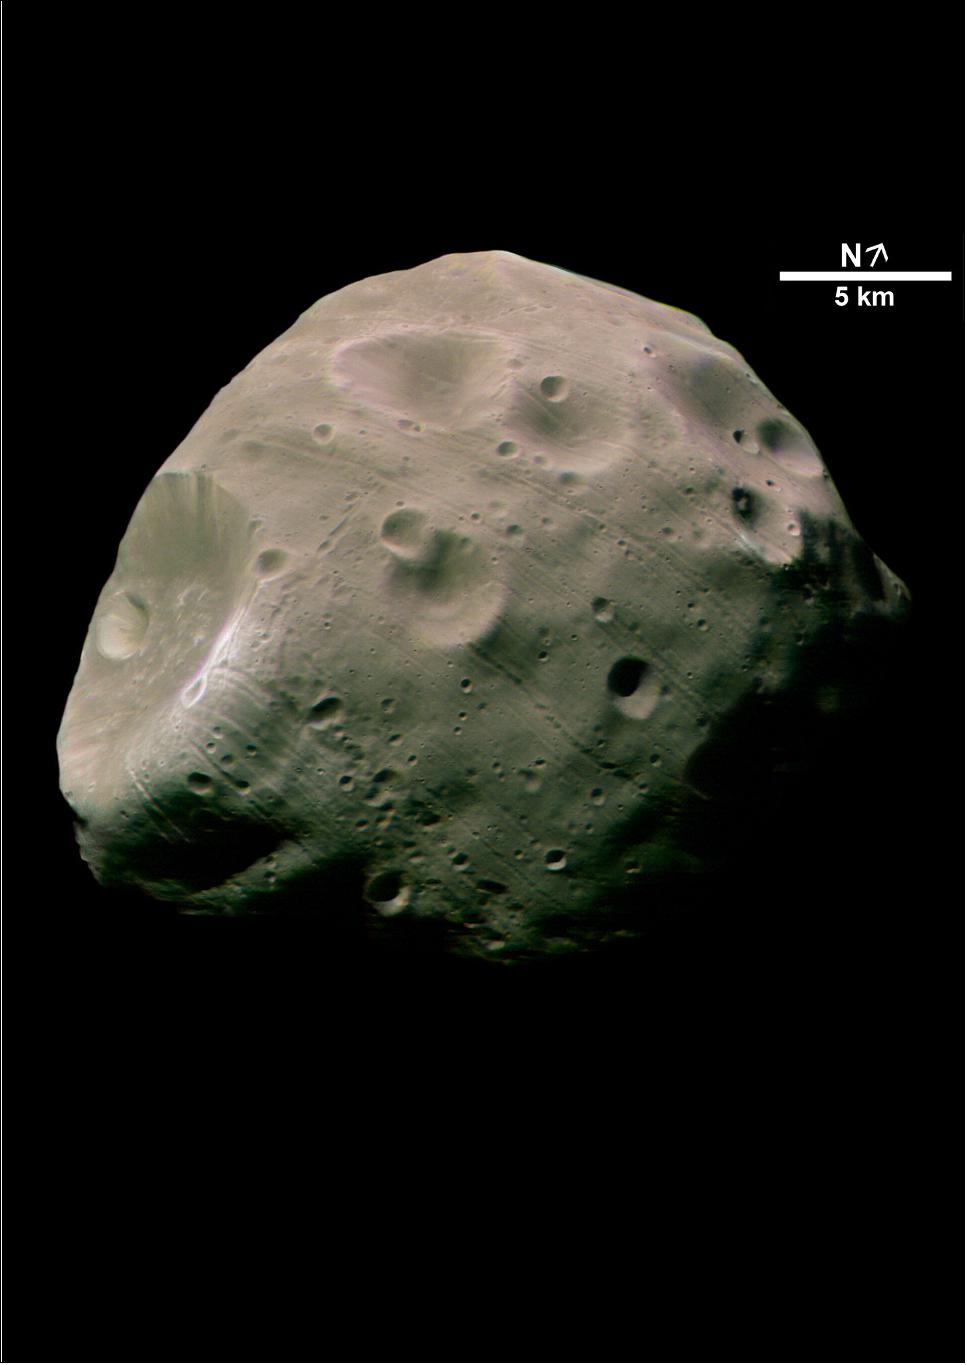
• December 02, 2021: By performing a series of real and 'fake' flybys, ESA’s Mars Express has revealed how Mars’ largest moon, Phobos, interacts with the solar wind of charged particles thrown out by the Sun – and spotted an elusive process that has only been seen at Phobos once before. 13)
- The solar wind streams out from our star, filling the Solar System with energetic particles. Earth’s Moon reflects these particles continuously, and the same ‘backscattering’ is expected at Mars’ moon Phobos given the similarities between the two (both are rocky, lack a magnetic field and atmosphere, and orbit terrestrial planets in the inner Solar System). However, ESA’s Mars Express has only seen this backscattering once (in 2008), despite coming close to Phobos many times.
- Researchers now report the second successful detection of reflected solar wind particles at Phobos, spotted during a flyby of the moon in January 2016.
- “Phobos’ relationship with the solar wind has long been an enigma,” says Yoshifumi Futaana of the Swedish Institute of Space Physics (IRF), and lead author of the new paper on the 2016 flyby. “We know that Phobos must be interacting with these particles, but we’re not seeing them – why? Why is Phobos behaving so differently to the Moon when the two appear to be quite similar?
- “For the first time in eight years of flybys, we’re excited to again see signs of these reflected particles at Mars’ largest moon.”
- However, as this backscattering is so intermittent and seldom seen at Phobos, scientists wondered if the phenomenon could have been caused by Mars Express itself reflecting solar wind particles. During the 2008 flyby, the spacecraft moved its solar array and shifted to point its instruments at Phobos – a maneuver that may have affected the behavior of surrounding particles.
- “The same criticism remained for the 2016 flyby: how do we know this detection is actually reflection from Phobos, and not from Mars Express itself?” adds Yoshifumi.
'Fake' Flybys
- To explore this possibility, the researchers performed three unprecedented special operations, dubbed 'fake' flybys, with the spacecraft in 2017. Using the exact same operation sequence, control maneuvers and solar array adjustments, Mars Express flew in a patch of space filled with solar wind but without the presence of Phobos, essentially performing a flyby – only without its target.
- “In essence, we were completing a kind of laboratory experiment at Mars,” says co-author Mats Holmström, also of IRF and Principal Investigator for Mars Express’ ASPERA-3 instrument, which observed the reflected particles. “The 'fake' flybys let us explore how Mars Express influences the solar wind in a more controlled environment, so we could search for signs of the spacecraft itself being the cause of the particle reflection.”
- The 'fake' flybys revealed no such signs that Mars Express produced or scattered any incoming particles, suggesting that Phobos did indeed reflect the detected particles back into space during the 2008 and 2016 flybys.
Sporadic Scattering
- Despite this, backscattered particles have only been spotted in two of over a dozen Phobos flybys, and even then, signals are sporadic and intermittent. This is entirely different to what we see at the Moon, another body that lacks both an atmosphere and magnetic field, and so would be expected to behave similarly. Why this difference?
- Yoshifumi and colleagues consider a number of possibilities, from processes perhaps taking place on different spatial or temporal scales than those captured by Mars Express, to possible magnetism on Phobos, to differences in the surface compositions of Phobos and the Moon – and more.
- “Overall, the intermittent particles are likely being reflected from the Phobos’ surface, but we can’t rule out another mysterious origin,” adds Yoshifumi. “However, the 'fake' flybys helped us understand the situation significantly better, explicitly showing that Mars Express was not the source.
- “To know more, we need more Mars Express flybys of Phobos in various configurations. Even if no reflected particles are seen during those flybys, even a lack of signal will provide valuable statistics.”
- The solar wind behaving differently at Phobos and the Moon implies that the surfaces of each have evolved differently, raising intriguing questions about how the Mars system differs from our own.
Exploring Phobos
- As one of only three moons in the inner Solar System, Phobos is of great interest for space exploration – past, present and future.
- From the Soviet Phobos program of the 1980s through to future missions such as the Japanese Space Agency (JAXA)’s Martian Moons eXploration (MMX) mission planned for launch in the mid-2020s, there have been many dedicated efforts to explore the origin, environment, behavior and evolution of Mars’ largest moon.
- ESA is partnering with JAXA on the MMX mission, providing communications equipment, support in spacecraft tracking and control, and opportunities for scientists to join the mission’s science team. MMX will characterize both martian moons, Phobos and Deimos, deploy a rover to Phobos’ surface, and return a sample of Phobos to Earth for analysis. A key aim of MMX is to determine if the moons are asteroids captured by Mars’ gravity, or debris remaining in orbit after a giant impact on Mars.
- Beyond our knowledge of Phobos – and other rocky or icy bodies exhibiting similar physics that ESA plans to explore, from Mercury to asteroids to the Galilean moons of Jupiter – understanding how charged particles behave in space is critical to space exploration.
- For example, astronauts on the Moon are exposed to the solar wind, a key consideration for ESA’s forthcoming plans for human expeditions to space. Surface interactions on planets and moons are also a core component of surface chemistry, possibly including how bodies form and store water.
- “This finding uses Mars Express in a truly unique way to solve an ongoing cosmic mystery – it shows wonderful ingenuity and highlights the flexibility and diverse capabilities of the mission,” says ESA’s Mars Express project scientist Dmitrij Titov.
- “The study also shows the value of our operations colleagues and data archives in enabling new discovery and knowledge and making important work such as this possible. We must understand the space environment to explore it with either satellite or astronaut, and so revealing the dynamics at play in the martian system is an important step forward.”
- Yoshifumi and colleagues accessed data from the 2016 Phobos flyby provided by the ESA Planetary Science Archive.
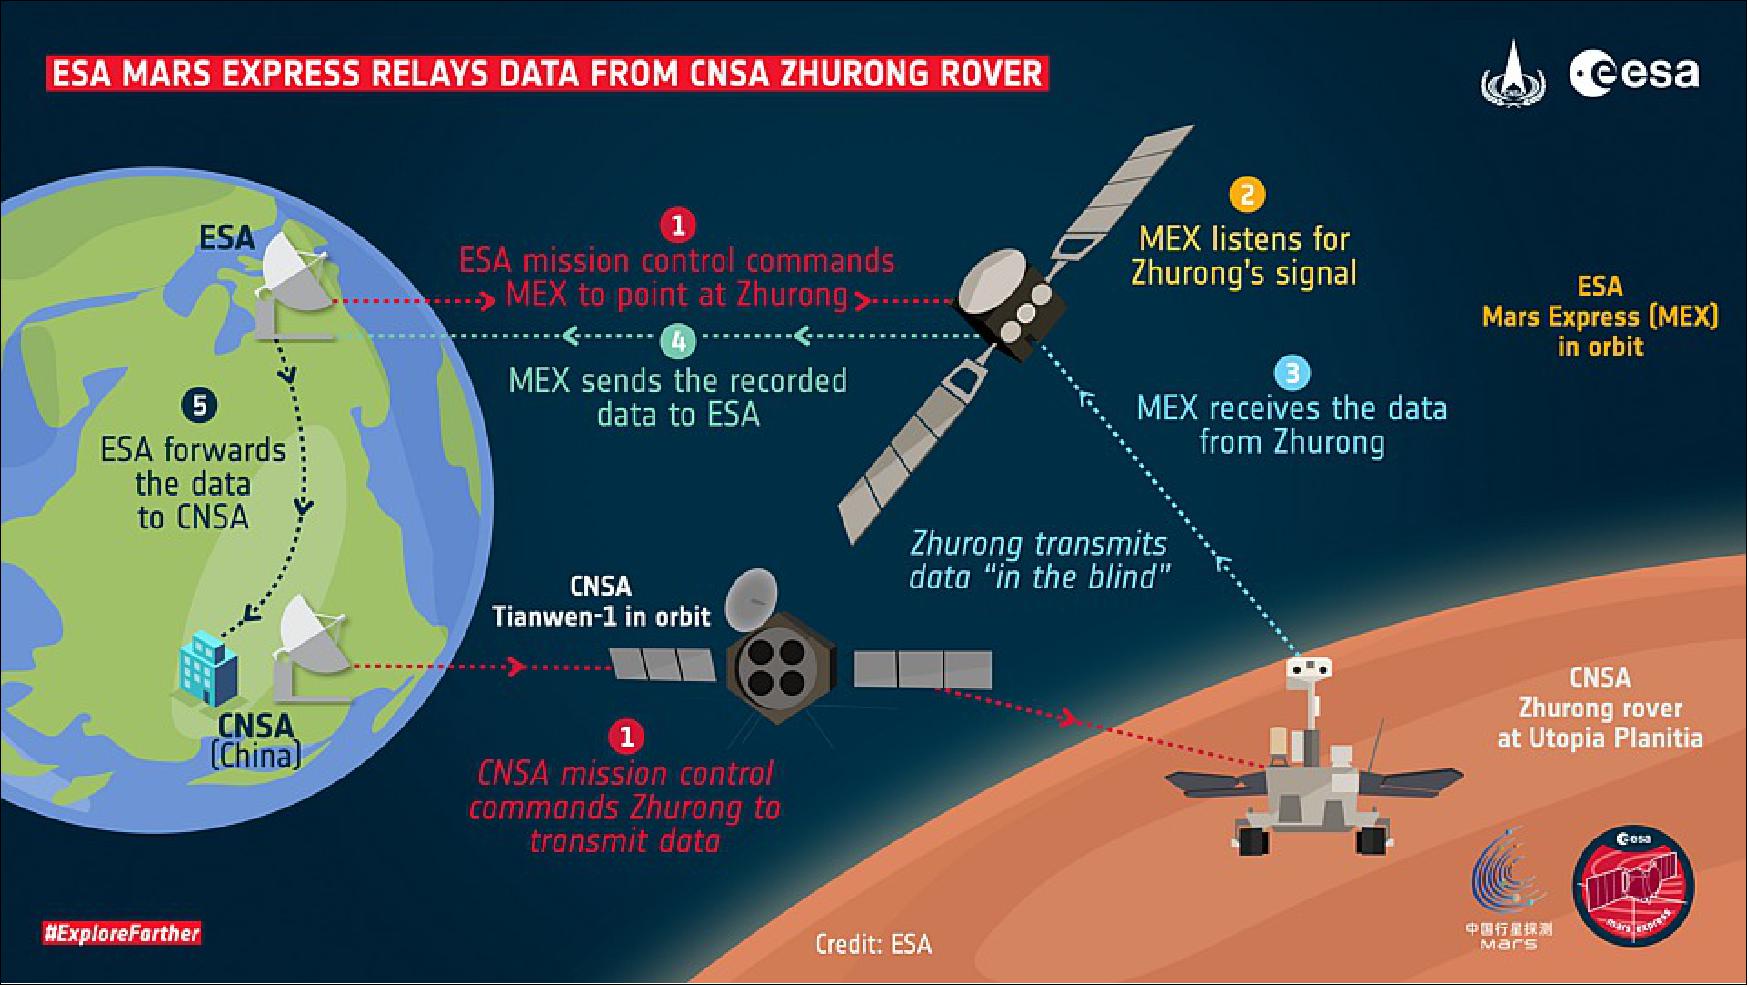
• December 01, 2021: This November, ESA’s Mars Express spacecraft carried out a series of experimental communication tests with the Chinese (CNSA) Zhurong Mars rover. Mars Express successfully caught data sent up ‘in the blind’ by the rover and relayed them to Earth where they were forwarded to the Zhurong team in China. 14)
- In depth: 13:07 CET (Central European Time), 7 November, Utopia Planitia. The Zhurong rover, commanded by the Tianwen-1 orbiter, points its radio up at the Martian sky. Any minute now, ESA’s Mars Express will begin to pass overhead. Zhurong starts transmitting a signal up into space. It has no way of knowing if its message is being received.
- Landers and rovers on Mars gather data that help scientists answer fundamental questions about the geology, atmosphere, surface environment, history of water and potential for life on the Red Planet.
- To get these insights to Earth, they first transmit the data up to spacecraft in orbit around Mars. These orbiters then use their much larger, more powerful transmitters to ‘relay’ the data across space to Earth.
- “Normally, an orbiter like ESA’s Mars Express first sends down a hail signal to a rover as a ‘hello’,” says James Godfrey, Mars Express Spacecraft Operations Manager.
- “The rover then sends back a response to establish stable communications and begin the two-way exchange of information. But this relies on the rover’s radio system being compatible with the orbiter’s.”
- As Mars Express transmits its ‘hello’ signal using communication frequencies that are different from those the Chinese Zhurong Mars rover receives, two-way communication is not possible.
- But in the other direction, Zhurong can transmit a signal using a frequency that Mars Express can receive.
- The relay radio on Mars Express has a mode that allows this one-way communication – communication ‘in the blind’ where the sender can’t be sure if their signal is being received – but until now, the technique hadn’t been tested on the spacecraft.
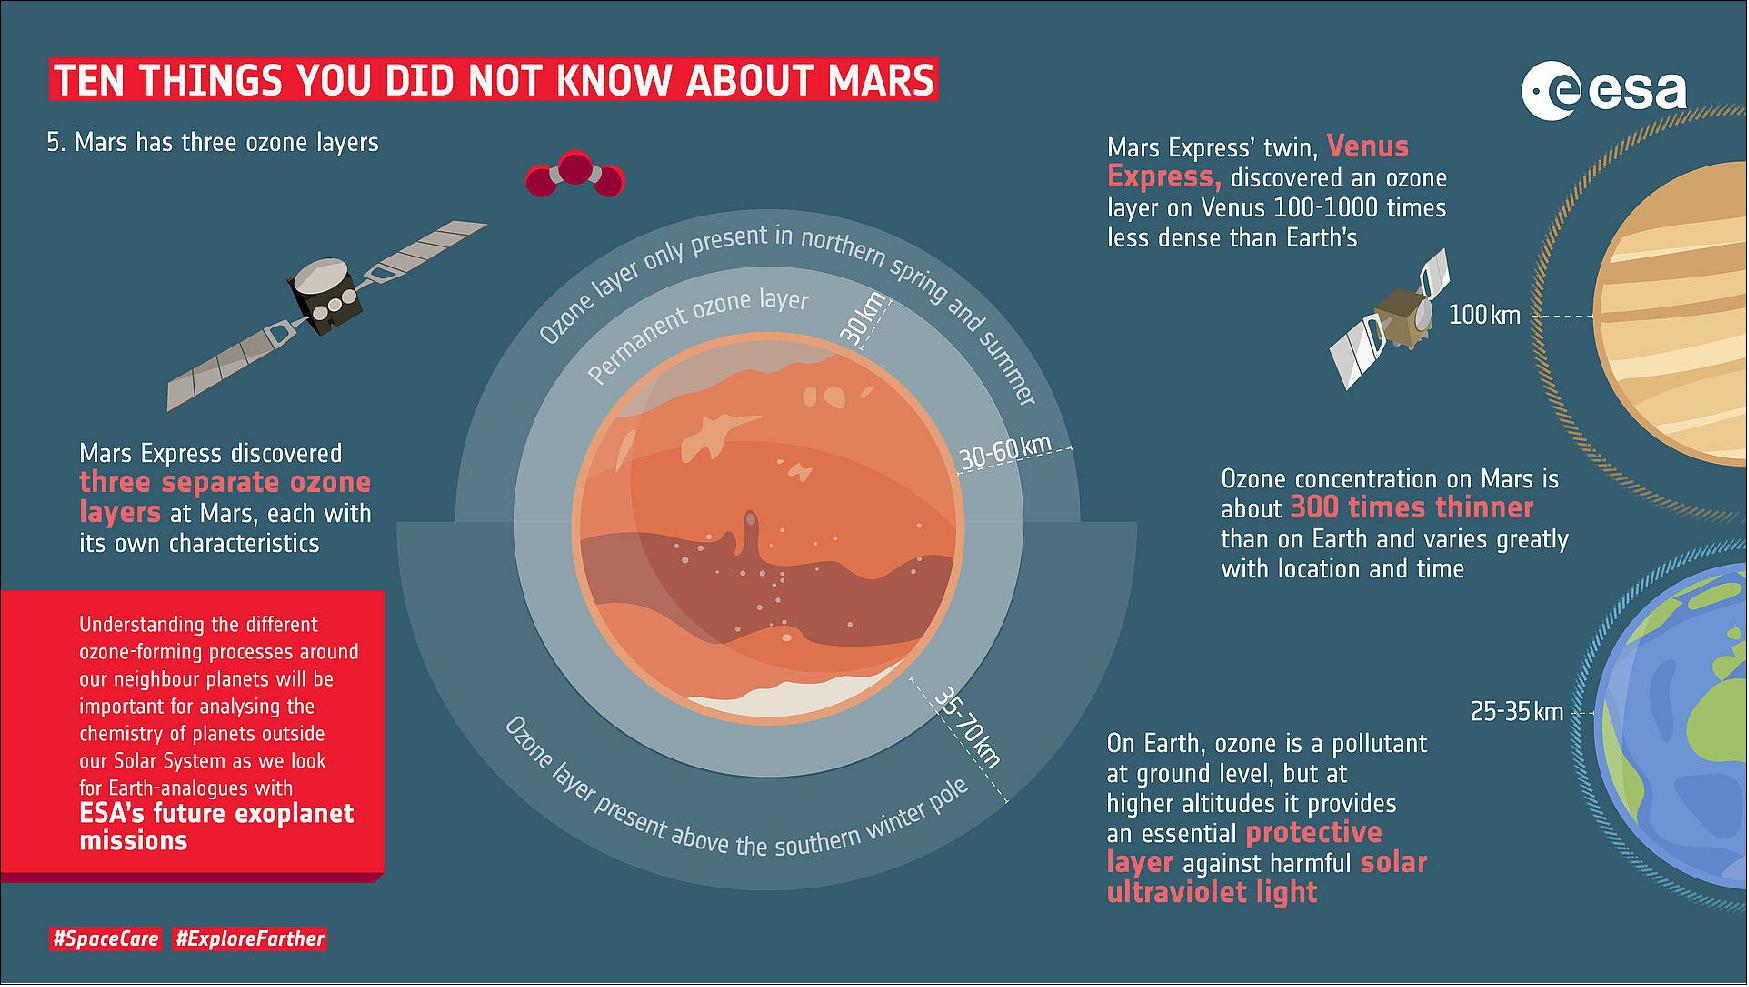
• July 23, 2021: Long-term studies of ozone and water vapor in the atmosphere of Mars could lead to better understanding of atmospheric chemistry for the Earth. A new analysis of data from ESA's Mars Express mission has revealed that our knowledge of the way these atmospheric gases interact with each other is incomplete. 15)
- Using four martian years of observations from the SPICAM (Spectroscopy for the Investigation of the Characteristics of the Atmosphere of Mars) instrument, which corresponds to seven and a half Earth years, a team of researchers from Europe and Russia uncovered the gap in our knowledge when trying to reproduce their data with a global climate model of Mars.
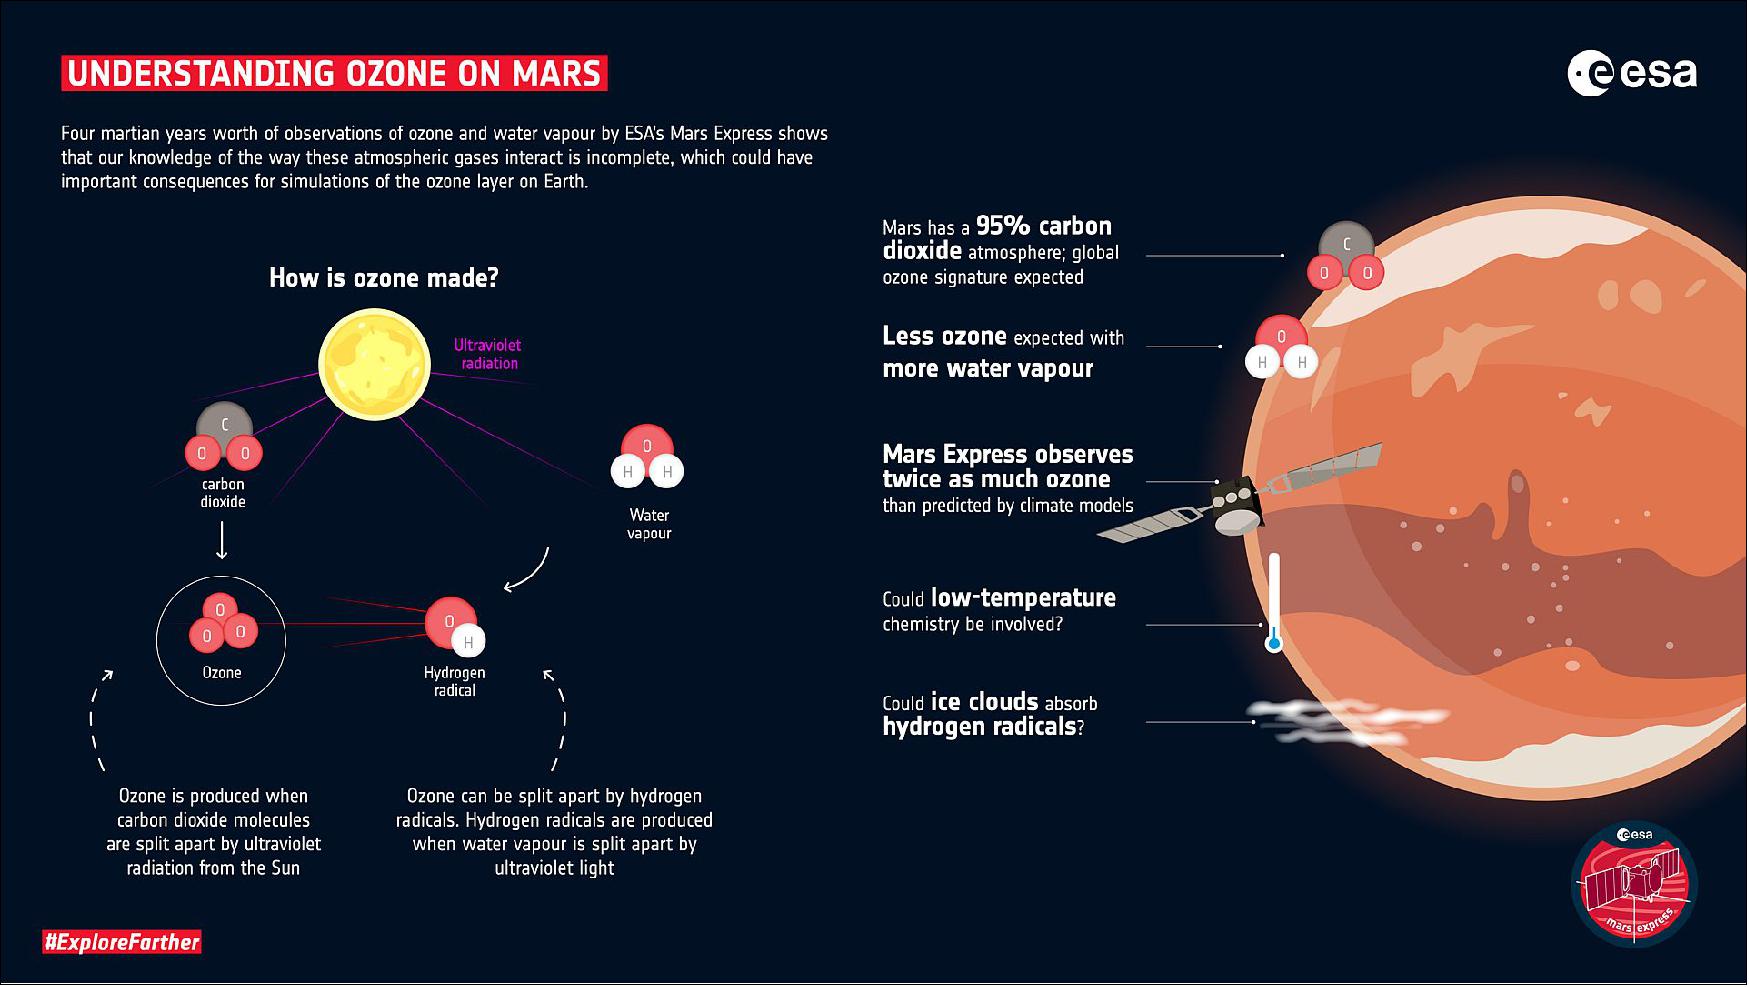
- Ozone and water vapor do not make good atmospheric companions. The ozone (O3) is produced when molecules of carbon dioxide (CO2), which comprises 95% of the martian atmosphere, are split apart by ultraviolet radiation from the Sun. In turn, the ozone can be split apart by molecules called hydrogen radicals (HOX), which contain an atom of hydrogen and one or more atoms of oxygen. The hydrogen radicals themselves are produced when water vapor is split apart by ultraviolet light.
- On Mars, since the carbon dioxide is ubiquitous, there should be a global signature of ozone – unless a particular region contains water vapor. In that circumstance, the water will be split into hydrogen radicals, which will react with the ozone molecule and pull it apart.
- Thus, wherever SPICAM detected water vapor, it should have seen a decrease in ozone. The more water vapor, the less ozone. The team investigated this inverse relationship, also known as an anticorrelation. They found that they could reproduce the general inverse nature of it with a climate model but not achieve the precise relationship. Instead, for a given amount of water vapor, the model produced only 50% of the ozone seen in the SPICAM data.
- “It suggests that the efficiency of ozone destruction is overstated in the computer simulations,” says Franck Lefèvre, of the Laboratoire atmosphères, milieux, observations spatiales (LATMOS), CNRS/Sorbonne Université, France, who led the study.
- At present, however, the reason for this over-estimation is not clear. Understanding the behavior of hydrogen radicals on Mars is essential. “It plays a key role in the atmospheric chemistry of Mars but also in the global composition of the planet,” says Franck.
- The chemical model used in this work was built specifically by Franck and colleagues to analyze Mars. It was based on a model of part of the Earth’s upper atmosphere; the mesosphere. Here, between roughly 40-80 km in altitude, the chemistry and conditions are broadly similar to those found in Mars’s atmosphere.
- Indeed, the discrepancy found in the models could have important repercussions for the way we simulate the Earth’s climate using atmospheric models. This is because the mesosphere on Earth contains part of the ozone layer, which will experience the same interactions with HOX as take place on Mars.
- “HOX chemistry is important for the global equilibrium of the Earth’s ozone layer,” says Franck.
- So, understanding what is happening in the atmosphere of Mars could benefit the precision with which we can perform climate simulations on Earth. And with so much data now available from SPICAM, the modelling has clearly shown that there is something we don’t understand.
- Could that something be the action of clouds?
- When Franck and colleagues introduced calculations for the way HOX is absorbed by the icy particles that make up clouds on Mars, they found that more ozone survived in their models. This is because HOX molecules were absorbed before they could pull apart the ozone. But this only partially explained their results.
- “It doesn't work in all the cases,” says Franck. And so the team are looking elsewhere too.
- One particular area for further study is measuring reaction rates at the low temperatures found in the martian atmosphere and Earth’s mesosphere. At present, these are not well known, and so could also be skewing the models.
- Now that the current work has highlighted in a quantitative way where the gaps lie in our knowledge, the team will collect more data using other UV instruments operating at Mars and continue their investigations and update the model.
- “With Mars Express, we have a completed the longest survey of the martian atmosphere to date, regardless of the mission. We started in 2004, and now have 17 years of data, which has led us to look at almost seven martian years in a row, including four martian years of combined ozone and water vapor measurements before the UV channel of SPICAM, which measured ozone, ceased operating near the end of 2014. This is unique in the story of planetary exploration,” adds Franck Montmessin, also from LATMOS, and the principal investigator of the SPICAM instrument.
- Building on the extraordinary dataset from Mars Express, new results are now coming in from ESA’s Trace Gas Orbiter, which has been circling Mars since October 2016. It carries two instruments, ACS (Atmospheric Chemistry Suite) and NOMAD (Nadir and Occultation for MArs Discovery) that are analyzing the martian atmosphere. NASA’s Maven mission also carries ultraviolet equipment that monitors ozone abundance. So, the vital piece of information that finally unlocks this mystery could come at any time.
- The long-term monitoring of atmospheric parameters and their variations by Mars Express provides a unique data set with which to study the martian atmosphere as a complex dynamic system.
- “Maybe adding up all these years together will eventually hold the key to how the HOX really controls the martian atmosphere, benefiting our understanding of planetary atmospheres in general,” says Franck Montmessin. 16)
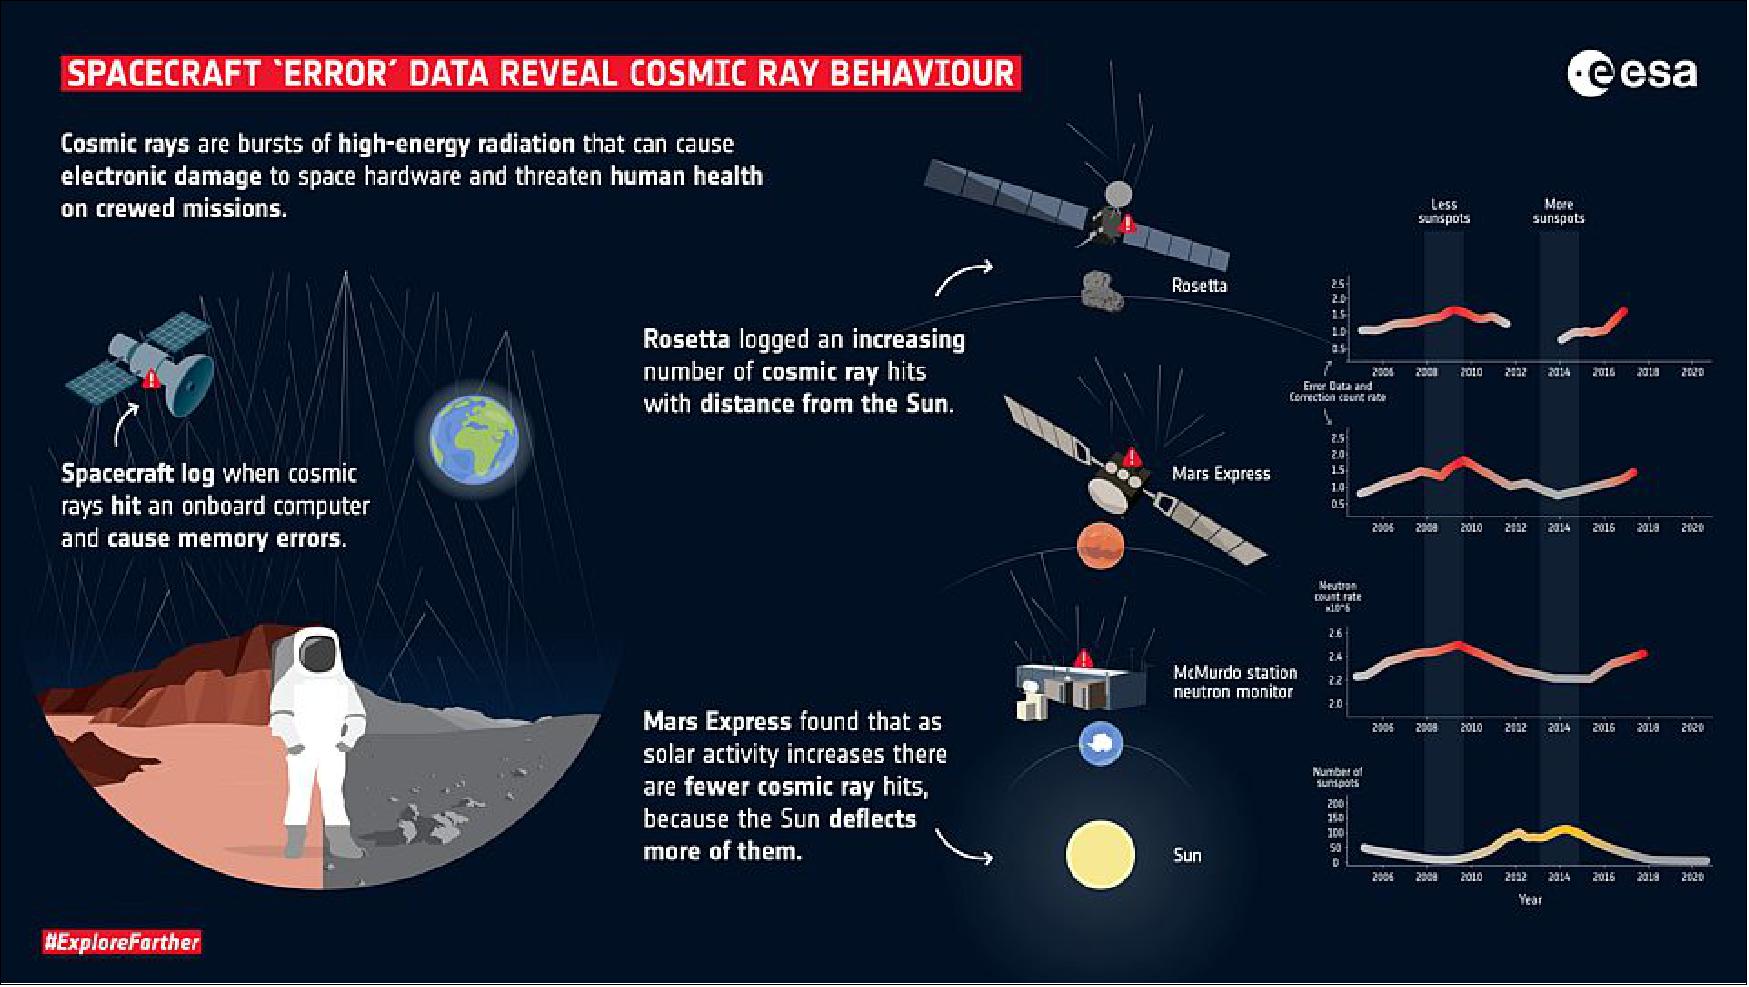
• June 28, 2021: Using data originally gathered for spacecraft ‘housekeeping’ aboard ESA’s Rosetta and Mars Express missions, scientists have revealed how intense bursts of high-energy radiation, known as cosmic rays, behave at Mars and throughout the inner Solar System. 17)
- Housekeeping data is gathered by most spacecraft and components, and is used by engineering teams to monitor spacecraft health and diagnose faults (by logging parameters such as component health and ‘on/off’ status, for example). Such data could be linked to scientifically interesting phenomena, and so represents a valuable science resource that remains mostly unexplored.
- Objects in space are regularly hit by charged particles that stream in from the wider Milky Way, including cosmic rays. Cosmic rays can cause electronic damage if they hit space hardware and threaten human health on crewed missions to Earth orbit, when astronauts are less protected from radiation by our planet’s atmosphere. The threat posed by cosmic rays will be even greater for crewed missions that will venture further into space, for example to the Moon and Mars.
- To keep tabs on spacecraft health, space missions log when cosmic rays hit an onboard computer and cause memory errors – something known as EDAC (Error Detection And Correction).
- “Mars Express has been collecting these measurements since launch. We accessed data collected since 2005, giving us an amazing 15-year dataset spanning almost the entire mission lifetime – a real rarity,” says Elise Wright Knutsen, lead author of the new study, formerly a trainee at ESA’s European Space Research and Technology Centre (ESTEC), and now at LATMOS/IPSL, France.
- A few factors influence the intensity of cosmic rays we see in the Solar System, including where we are in the Sun’s periodic 11-year activity cycle, and distance from the Sun. “We were able to explore the Sun-cosmic ray relationship in detail thanks to EDAC data from two prominent ESA missions: Mars Express and Rosetta,” says Elise. “This is the first time EDAC data has been used in this way – it’s been used before to explore short-term solar events, but never in the longer term.”
- Elise and colleagues used EDAC data from the two missions to characterize how cosmic ray behavior changed throughout our Sun’s cycle of activity at Mars (by comparing Mars Express EDAC data to corresponding data on sunspots and from Earth-based monitoring), and to reveal how the amount of cosmic rays detected in the inner Solar System varies with distance from the Sun (by comparing EDAC data from both Rosetta and Mars Express). Rosetta orbited around the Solar System for 10 years – at its farthest reaching beyond the orbit of Jupiter – before arriving at its target comet, collecting data over a wide range of distances from the Sun.
- “We found that cosmic rays behave very similarly with respect to the Sun at Mars as they do at Earth, and are strongly influenced by the solar cycle,” adds Elise. “As the Sun grows more active and hosts more sunspots, we see fewer cosmic rays, as our star deflects more of them. However, this ‘anti-correlation’ is seen around 5.5 months later – it isn’t immediate – and the reason for this time lag remains an intriguing open question.”
- Comparing the EDAC measurements from Mars Express and Rosetta also showed that cosmic ray counts increase by around 5% per ‘astronomical unit (AU)’, with one AU being the distance between the Earth and the Sun.
- In situ data, especially science data, is rare in much of the Solar System, and observations of the radiation around other planetary bodies are relatively sparse. Although spacecraft do not carry out routine science observations as they cruise through space en route to their destination, they are always collecting housekeeping data.
- “This study emphasizes the immense value of archiving this kind of data, and is a great example of using a spacecraft itself as a scientific instrument,” says ESA planetary scientist Olivier Witasse, co-author. “This approach allows us to do science without a spacecraft’s core research instruments even being switched on – a particularly relevant and exciting option for long interplanetary cruises, when instruments often lie dormant as they await the mission ahead. 18)
- “We can potentially use any and all spacecraft in this way, not just those equipped with particular sensors. This opens up a new realm of possibility for both current and forthcoming ESA missions to discover even more about the space environment.”
- The range of distances to the Sun covered by EDAC observations is expanding with ESA’s Gaia, BepiColombo and upcoming Juice (JUpiter ICy moons Explorer) missions.
• March 22, 2021: Mars has lost most of its once plentiful water, with small amounts remaining in the planet’s atmosphere. ESA’s Mars Express now reveals more about where this water has gone, showing that its escape to space is accelerated by dust storms and the planet’s proximity to the Sun, and suggesting that some water may have retreated underground. 19)
- Although arid today, Mars was likely once a water-covered world like our own. Evidence of this is seen in images of vast, flood-formed outflow channels, river valleys and deltas carved into the planet’s surface, as well as in radar observations of liquid water reservoirs locked up beneath the ice and dust of Mars’ south pole.
![Figure 47: Water density distribution in Mars atmosphere. Data visualization of water density distribution with altitude in the atmosphere of Mars as a function of season, as measured by the SPICAM instrument on ESA’s Mars Express. The data covers eight martian years (Mars year 27 to 34), based on two dedicated campaigns per year. The data show that the vertical distribution of water vapor is highly variable with season and altitude. The results found that water vapor remained confined to below 60 km when Mars was far from the Sun but extended up to 90 km in altitude when Mars was closest to the Sun. The atmosphere also has a greater water density during southern hemisphere summer, enhanced by the planet’s closer proximity to the Sun.- In this visualization, brighter dots indicate a higher density of water (up to 1013 cm-3), darker indicate a lower density (5 x 109 cm-3). Data for two global dust storms are excluded from the data. See A. Fedorova et al (2021) for values and detailed description [image credit: ESA, based on data from A. Fedorova et al (2021)] 20)](https://www.eoportal.org/ftp/satellite-missions/m/MarsExpress_200722/MarsExpress_Auto3C.jpeg)
- Water can now only exist on Mars in the form of ice or gas due to the low atmospheric pressure on the planet, which is less than 1% that of Earth. Mars has lost much of its former water to space over the past few billion years, and is still leaking water from its atmosphere today.
- Two new studies, led by Anna Fedorova of the Space Research Institute of the Russian Academy of Sciences and Jean-Yves Chaufray of the Laboratoire Atmospheres Observations Spatiales, France, now clarify how water moves through and leaves Mars’ atmosphere. They reveal that this process is affected by the planet’s distance from the Sun and changes in its climate and weather, including the massive global dust storms often seen on the planet.
![Figure 48: ESA’s Mars Express finds that atmospheric water loss is accelerated by seasonal change and dust storms. Across a full orbit, the distance between the Sun and Mars ranges from 207 million to 249 million km. The results found that water vapor remained confined to below 60 km when Mars was far from the Sun but extended up to 90 km in altitude when Mars was closest to the Sun. The atmosphere also has a greater water density during southern hemisphere summer, enhanced by the planet’s closer proximity to the Sun. Furthermore, in years when Mars experienced a global dust storm the upper atmosphere became even wetter, accumulating water in excess at altitudes of over 80 km (the global dust storm data is not shown in the graph). - The study finds that Mars loses a global 2 m layer of water every billion years, but this is insufficient to explain where all the water needed to create the observed water-carved features on the planet has gone. The results suggest that either this water has moved underground, or that atmospheric water escape rates were far higher in the past [image credit: ESA; data: A. Fedorova et al (2021)]](https://www.eoportal.org/ftp/satellite-missions/m/MarsExpress_200722/MarsExpress_Auto3B.jpeg)
- Both studies used extensive, multi-year datasets obtained by the orbiter’s SPICAM instrument (Spectroscopy for the Investigation of the Characteristics of the Atmosphere of Mars). 21)
- The atmosphere is the link between surface and space, and so has much to tell us about how Mars has lost its water,” says Anna. “We studied the water vapor in the atmosphere from the ground up to 100 km in altitude, a region that had yet to be explored, over eight martian years.”
- Anna and colleagues found that water vapor remained confined to below 60 km when Mars was far from the Sun but extended up to 90 km in altitude when Mars was closest to the Sun. Across a full orbit, the distance between the Sun and the Red Planet ranges from 207 million to 249 million km.
- Near the Sun, the warmer temperatures and more intensive circulation in the atmosphere prevented water from freezing out at a certain altitude. “Then, the upper atmosphere becomes moistened and saturated with water, explaining why water escape rates speed up during this season – water is carried higher, aiding its escape to space,” adds Anna.
- In years when Mars experienced a global dust storm the upper atmosphere became even wetter, accumulating water in excess at altitudes of over 80 km.
- “This confirms that dust storms, which are known to warm and disrupt Mars’ atmosphere, also deliver water to high altitudes,” says Anna. “Thanks to Mars Express’ continuous monitoring, we were able to analyze the last two global dust storms, in 2007 and 2018, and compare what we found to storm-free years to identify how the storms affected water escape from Mars.”
- This finding is supported by research led by Jean-Yves, which modelled the density of hydrogen atoms in Mars’ upper atmosphere over two years and explored how this related to water escape.
- “We compared our results to SPICAM data and found good agreement – except during the dusty season, when our model underestimated just how much hydrogen was present,” says Jean-Yves. “Far more water escapes through the atmosphere during disturbed conditions than the model predicted.”
- Across two martian years, one of which experienced a dust storm, Jean-Yves and colleagues estimated that the rate of water loss varied by a factor of about 100, highlighting the significant effect that dust storms can have on Mars’ rates of water loss.
- The findings show that Mars loses the equivalent of a global two-meter-deep layer of water every billion years. However, even accumulated over Mars’ four-billion-year history, this amount is insufficient to explain where all of Mars’ water has gone.
- “A significant amount must have once existed on the planet to explain the water-created features we see,” says Jean-Yves. “As it hasn’t all been lost to space, our results suggest that either this water has moved underground, or that water escape rates were far higher in the past.”
- The results from Anna, Jean-Yves and colleagues complement recent findings by the ESA-Roscosmos ExoMars Trace Gas Orbiter (TGO), which, since 2018 and alongside Mars Express, has monitored the distribution of water by altitude in Mars’ atmosphere. These findings suggested that Mars’ rate of water loss may be linked to seasonal changes.
- Mars Express’ work to determine Mars’ water loss is also supported by NASA’s MAVEN (Mars Atmosphere and Volatile Evolution) mission, which is systematically measuring the chemical composition of the martian atmosphere (specifically, the levels of atomic hydrogen and deuterium, a heavy isotope of hydrogen). Such multi-mission data will help constrain not only how water is currently behaving but also the cumulative water loss over martian history – vital to figure out whether Mars’ water has gone underground or to space.
- “Two key themes in our ongoing exploration of Mars are the planet’s evolution and water loss, and the role of dust storms in shaping the martian climate and atmosphere,” says Dmitrij Titov, ESA’s Mars Express project scientist.
- “These findings help us understand the longer-term processes behind Mars’ water loss and paint a picture of not only its present-day climatology, but how its climate has changed throughout history. For such studies we need the kind of high-quality datasets provided by SPICAM and also the instruments aboard ExoMars’ TGO. Together, these and other advanced missions will continue to unveil the mysteries of Mars.”
- Mars Express launched on 2 June 2003, and has spent over 17 years in orbit at Mars carefully monitoring the properties of the planet’s atmosphere.
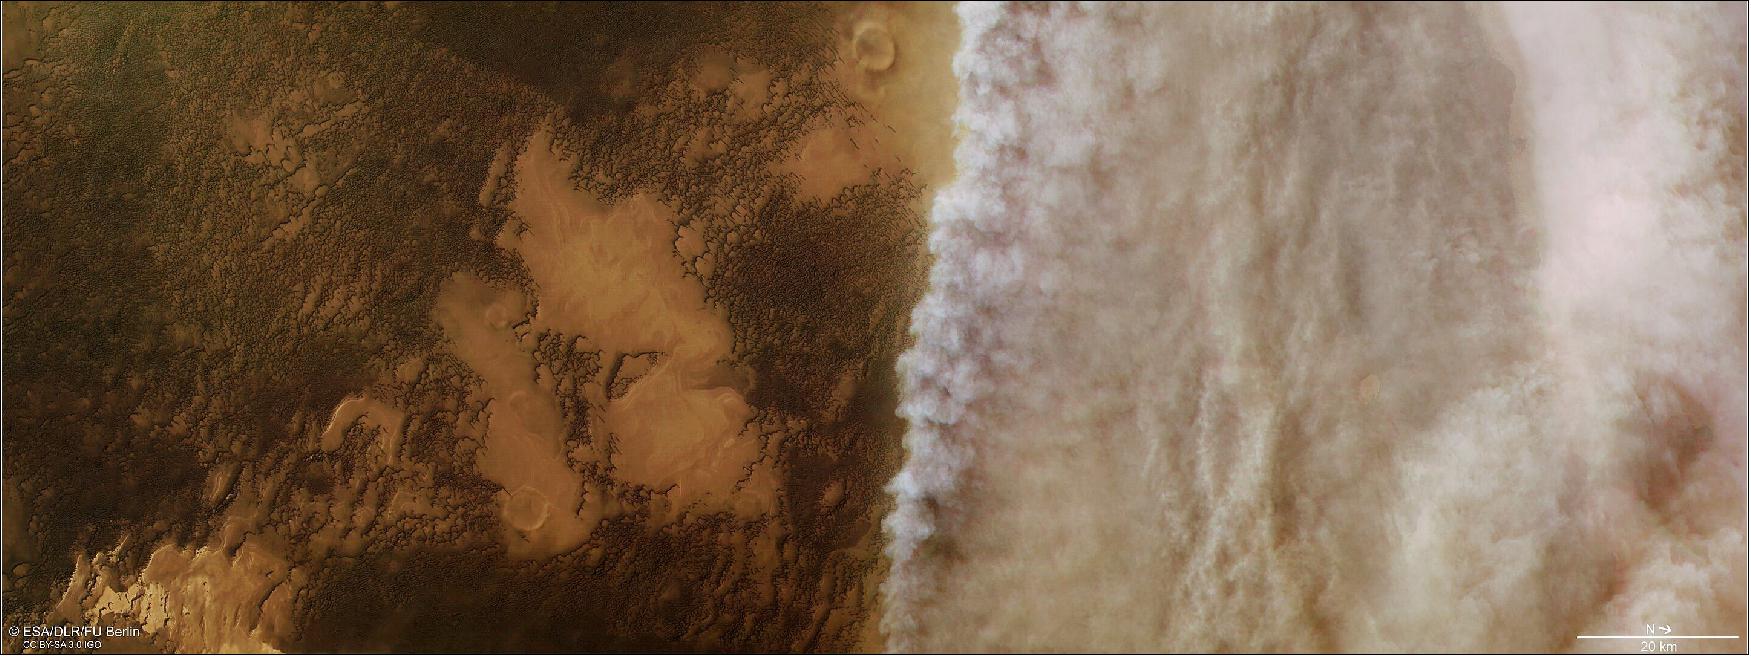
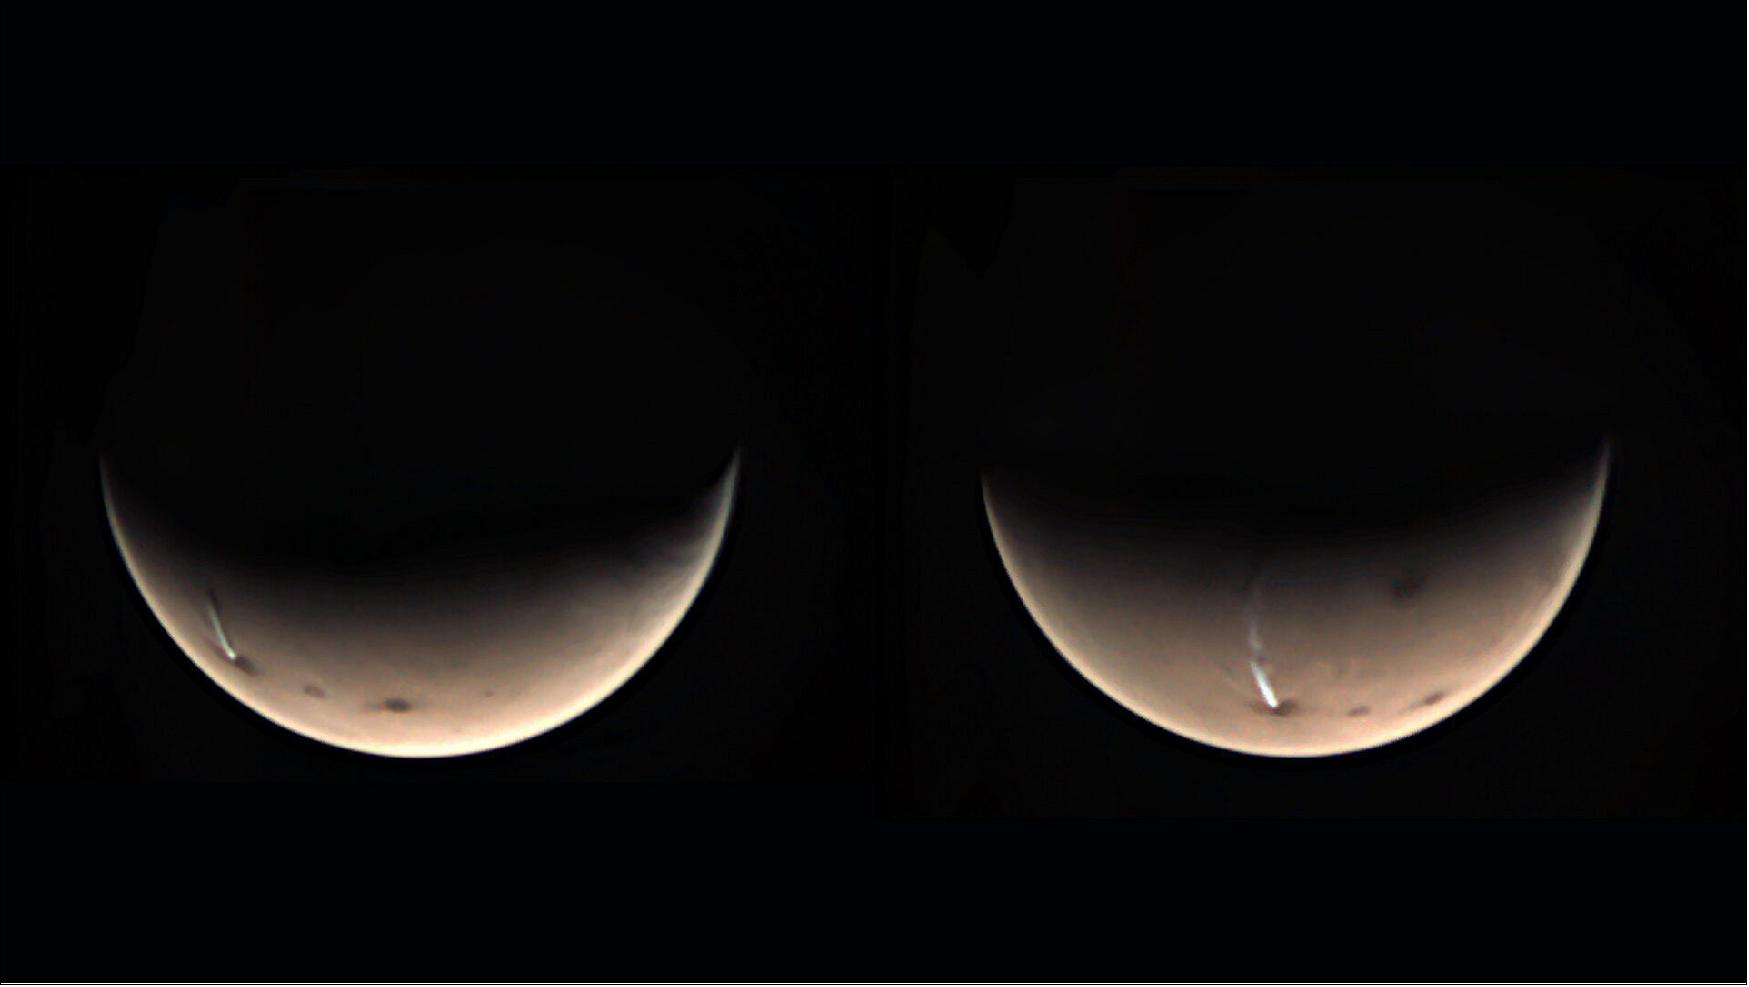
• March 9, 2021: When spring arrives in southern Mars, a cloud of water ice emerges near the 20 km-tall Arsia Mons volcano, rapidly stretching out for many hundreds of kilometers before fading away in mere hours. A detailed long-term study now reveals the secrets of this elongated cloud, using exciting new observations from the ‘Mars Webcam’ on ESA’s Mars Express. 22)
- Mars Express has spied this cloud before as it hovers near the Arsia Mons volcano, just south of Mars’ equator. Puzzlingly, Arsia Mons is the only low-latitude location on Mars where clouds are seen – and the only one of numerous similar volcanoes in the region to possess such a veil of cloud – at this time of year. Mars Express has seen this veil grow and fade on a daily basis throughout the spring and summer seasons, sending back striking images of this long and dramatic white cloud.
- However, the cloud is difficult to observe in its entirety due to the fast, changeable dynamics of the martian atmosphere and the constraints of many spacecraft orbits, limiting our knowledge of how and why it forms and changes over time.
- “To clear these hurdles, we used one of Mars Express’ secret tools – the VMC (Visual Monitoring Camera)” says Jorge Hernández Bernal of the University of the Basque Country in Bilbao, Spain, lead author of the new findings and part of a long-term project studying the cloud’s dynamics.
- Jorge and colleagues’ work demonstrates an exciting, and unintended, use for the VMC. Also nicknamed the Mars Webcam, the VMC has a resolution similar to that of a standard 2003 computer webcam. It was installed to visually confirm that the Beagle 2 lander had successfully separated from Mars Express back in 2003 – after which it was switched off. Several years later, the camera was reactivated and used to gather images of Mars for public engagement and outreach activities, but remained unused for scientific research.
- “However, recently, the VMC was reclassified as a camera for science,” adds Jorge. “Although it has a low spatial resolution, it has a wide field of view – essential to see the big picture at different local times of day – and is wonderful for tracking a feature’s evolution over both a long period of time and in small time steps. As a result, we could study the whole cloud across numerous life cycles.”
- The research team combined the VMC observations with those from two other Mars Express instruments – OMEGA and HRSC – and from several other spacecraft, namely NASA’s Mars Atmosphere and Volatile Evolution (MAVEN), Mars Reconnaissance Orbiter (MRO), and Viking 2 missions, and the Indian Space Research Organisation’s Mars Orbiter Mission (MOM). “We were especially excited when we dug into Viking 2's observations from the 1970s,” says Jorge. “We found that this huge, fascinating cloud had already been partially imaged that long ago – and now we’re exploring it in detail.”
- The findings revealed that, at its largest, the cloud measures some 1 800 km in length and 150 km across. It is the biggest ‘orographic’ cloud ever seen on Mars, meaning that it forms as a result of wind being forced upwards by topographic features (such as mountains or volcanoes) on a planetary surface. In this case, Arsia Mons perturbs the martian atmosphere to trigger the formation of the cloud; moist air is then driven up the flanks of the volcano in updrafts, later condensing at higher, and far cooler, altitudes.
- The cloud undergoes a rapid daily cycle that repeats every morning for several months. It begins growing before sunrise on the western slope of Arsia Mons before expanding westwards for two and a half hours, growing remarkably fast – at over 600 km/h – at an altitude of 45 km. It then stops expanding, detaches from its initial location, and is pulled further westwards still by high-altitude winds, before evaporating in the late morning as air temperatures increase with the rising Sun.
- “Many Mars orbiters cannot begin observing this part of the surface until the afternoon due to the properties of their orbits, so this really is the first detailed exploration of this interesting feature – and it’s made possible by not only Mars Express’ diverse suite of instruments, but also its orbit,” explains co-author Agustin Sánchez-Lavega, also of the University of the Basque Country and Science Lead for the VMC.
- No other climate system in the Solar System is thought to be as similar to Earth’s as the martian system – but even still, the two planets show distinct and intriguing differences. “Although orographic clouds are commonly observed on Earth, they don’t reach such enormous lengths or show such vivid dynamics,” says Agustin. “Understanding this cloud gives us the exciting opportunity to try to replicate the cloud’s formation with models – models that will improve our knowledge of climatic systems on both Mars and Earth.”
- As well as using the VMC in an exciting way, Jorge, Agustin and colleagues also overcame a typical challenge when observing transient phenomena on Mars. High-resolution cameras such as Mars Express’ HRSC have narrow fields of view, and observations are always planned in advance. As a result, meteorological phenomena – which are generally unpredictable – are usually caught by chance. However, once the researchers began to understand the life cycle and annual patterns of this elongated cloud, they were able to direct the HRSC team to the right place and right time to capture it as it emerged.
- “These findings really demonstrate the strengths of Mars Express – its unique orbit, longevity, persistent quality, and ability to adapt as it tackles the mysteries of Mars,” says ESA’s Mars Express project scientist Dmitrij Titov.
- “Repurposing the VMC has successfully enabled us to understand this transient cloud in a way that wouldn’t have been possible otherwise. The VMC allows scientists to track clouds, monitor dust storms, probe cloud and dust structures in the martian atmosphere, explore changes in the planet’s polar ice caps, and more. Its recommissioning not only supports Mars Express’ primary toolkit for Mars exploration, but adds new value to the long-standing mission, which has been revealing more about the Red Planet since 2003.” 23)
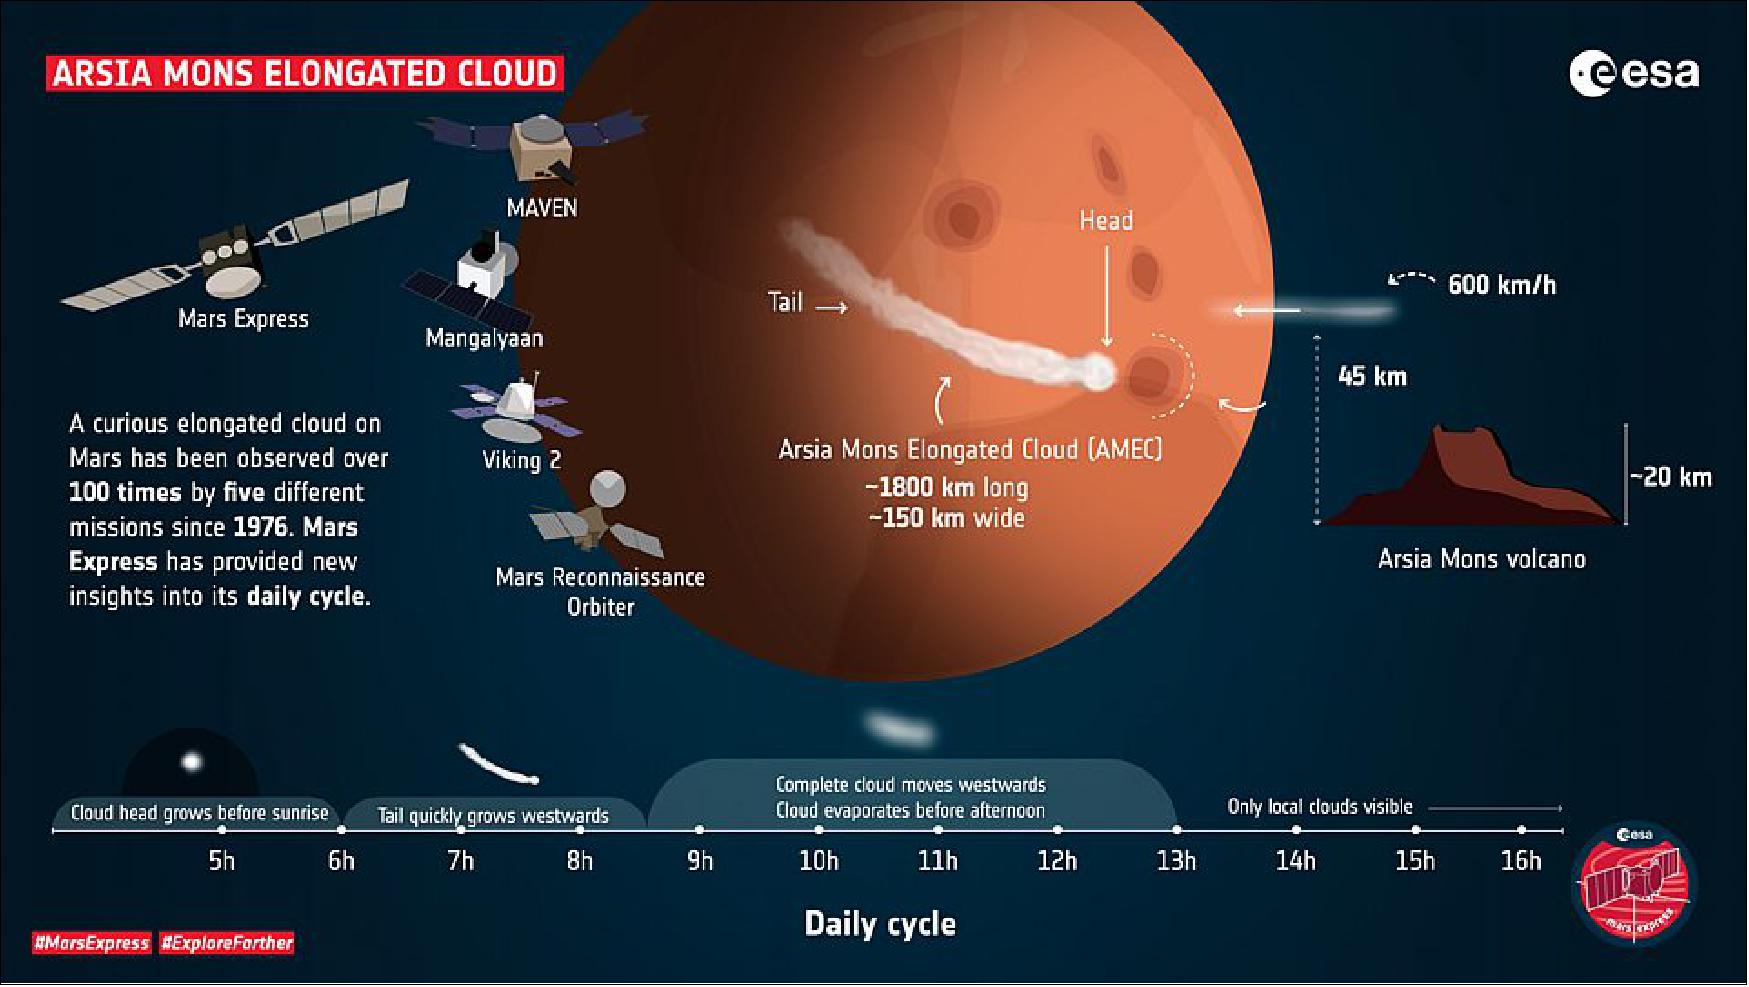
• On 18 February 2021, NASA’s Perseverance rover is expected to arrive at Jezero impact crater, the site of a former lake on Mars. The High Resolution Stereo Camera on ESA’s Mars Express has provided important context for the landing site and its surrounds. 24)
- Mars Express has been imaging the Red Planet in three dimensions and in color since 2004. The data it collects make it possible to create images of large areas of the martian surface – not only as color mosaic images, but also as digital terrain models. These provide researchers with important information about the terrain and elevation of the land. Accurate topographical information is critical for ensuring a safe landing. The detailed data from Mars Express has been used to support the selection of numerous landing site candidates, including that of NASA’s Mars 2020 mission that will see Perseverance rover land in Jezero Crater this week.
- The images shown here are derived from ‘map sheets’ covering millions of square kilometers, depicting the wider geographical context around the landing site. But the images not only provide a large-scale overview of the geographic location; thanks to their high resolution, they can be greatly enlarged for a closer look at individual details of the landscape in exceptional quality.
Jezero in Context
- Jezero crater lies exactly on the border between the ancient highland region of Terra Sabaea, where rocks from 4.1–3.7 billion years ago can still be found, and the 3.9 billion year old Isidis impact basin. The Nili Fossae graben system, which roughly traces the curved shape of the rim of Isidis basin, was formed by the impact event as a result of tectonic fractures. The Isidis Planitia (plains) is made up of much younger deposits and formed in the martian ‘middle ages’ some 3.7-3 billion years ago, modified up to the present day. To the southwest of Jezero Crater is the volcanic region of Syrtis Major, where lava flowed around 3.7-3 billion years ago. Thus, the rocks and deposits in and around Jezero Crater span the geological history of Mars.
Jezero Mineralogy in Depth
- Jezero Crater has a diverse mineralogy, which can be used to infer the environmental conditions at the time of the minerals’ formation. Perseverance rover will be studying them directly.
- The detailed map of Jezero Crater (Figure 54) shows that the crater rim is breached by three valleys that were former rivers. Neretva Vallis and Sava Vallis were inflow channels that have created two deltas on the western and northwestern rim of the crater. Perseverance will examine the larger of the two in the west in more detail.
- Pliva Vallis in the east of Jezero was an outflow channel through which water was discharged from the crater. As such, Jezero is known as an ‘open basin lake’, a type of lake that is thought to have once been numerous on Mars. Compared to closed basins (with inflow but no outflow), they are interesting because they hosted freshwater lakes with a stable water level. Lakes in closed basins, on the other hand, were subjected to more frequent periods of drying out, which turned them into salt lakes, thus making them less promising in the search for conditions that are conducive to life.
- The large map shows the water catchment area of the two inflow channels, from which material from the surrounding area was transported by the rivers into the crater and deposited in the two deltas. Spacecraft orbiting Mars have used spectrometers to detect a variety of minerals in this catchment area. These are mainly silicates from the olivine and pyroxene groups, both mineral classes that originate from magma within the martian mantle and indicate basaltic volcanic deposits that were not subject to long-term weathering by water. Carbonates identified on the inner rim of Jezero Crater, together with the clay minerals, testify to weathering by water of rock with a volcanic source.
- Volcanic minerals, carbonates and clay minerals are observed both in the delta and elsewhere in the crater. Some carbonates (limestones) are thought to have been formed directly in the lake. Such lake carbonates, and especially the clay minerals, indicate freshwater conditions and have the potential to preserve traces of life.
- However, other types of minerals, such as sulphates that contain iron oxide, amorphous silicon oxides, and hydroxides, have also been observed; these tend to form in acidic waters that gradually dried up. These minerals indicate that the environmental conditions in Jezero Crater became drier and less conducive to life at a later stage.
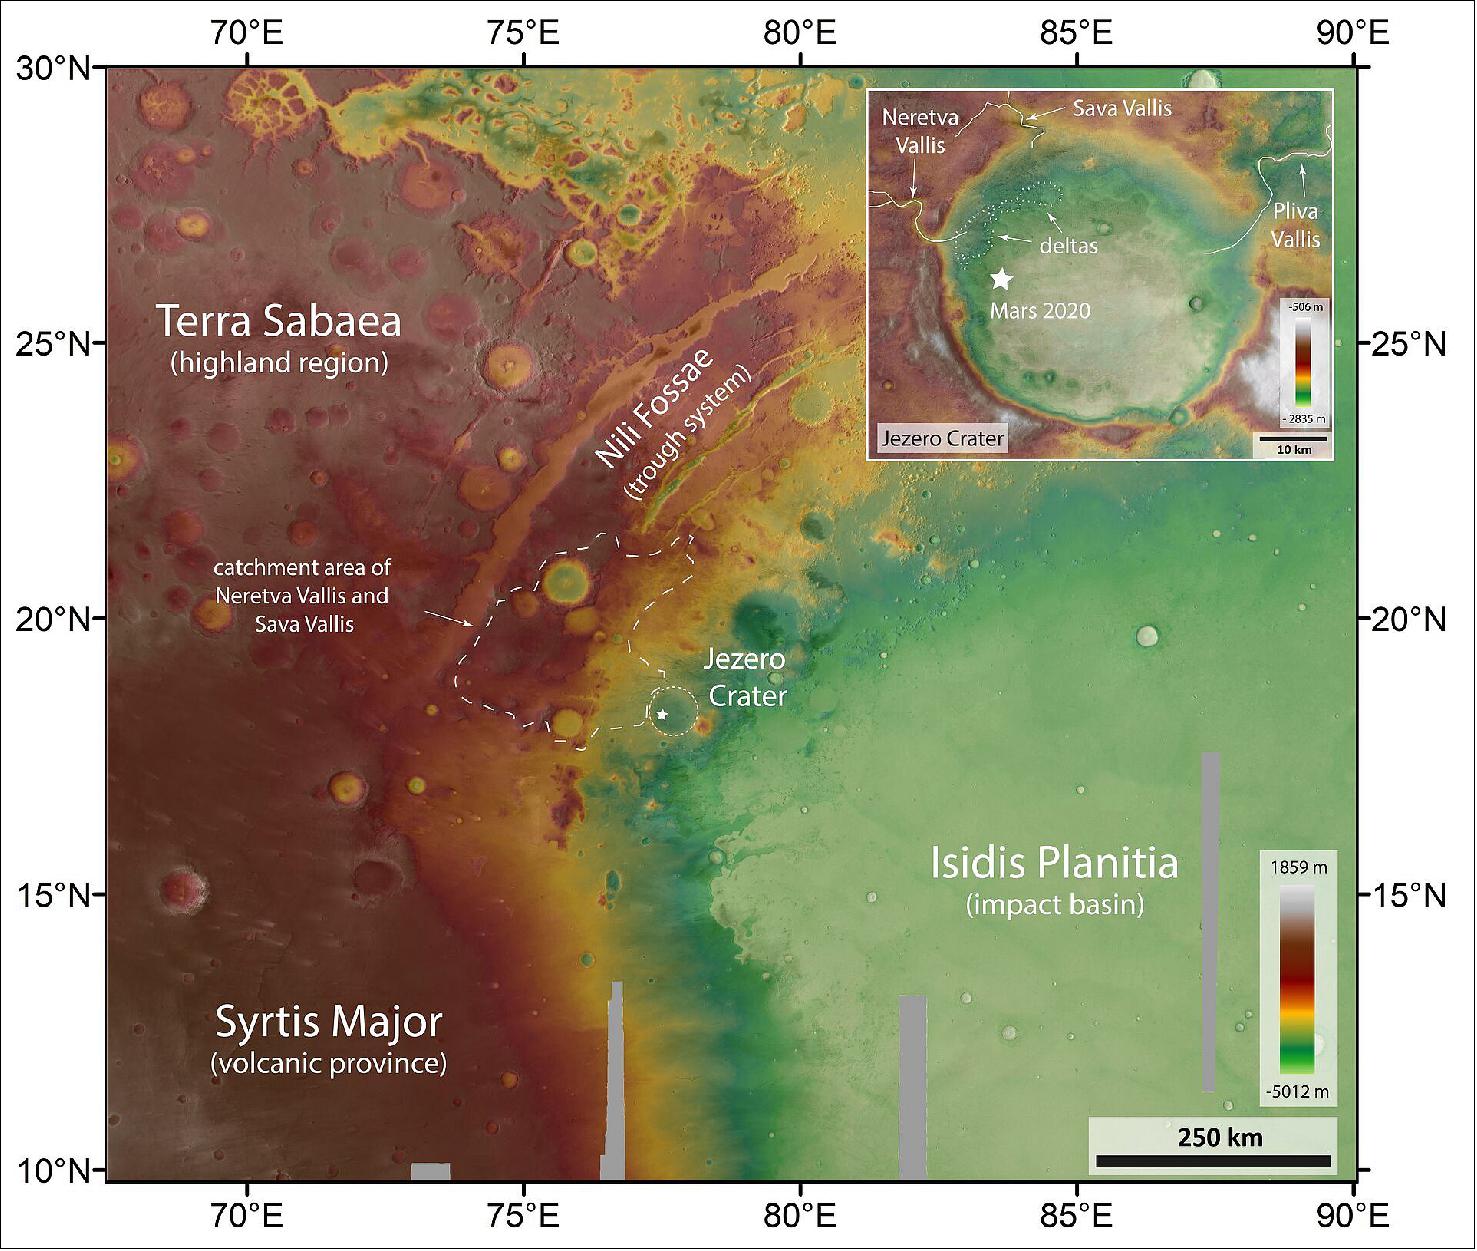
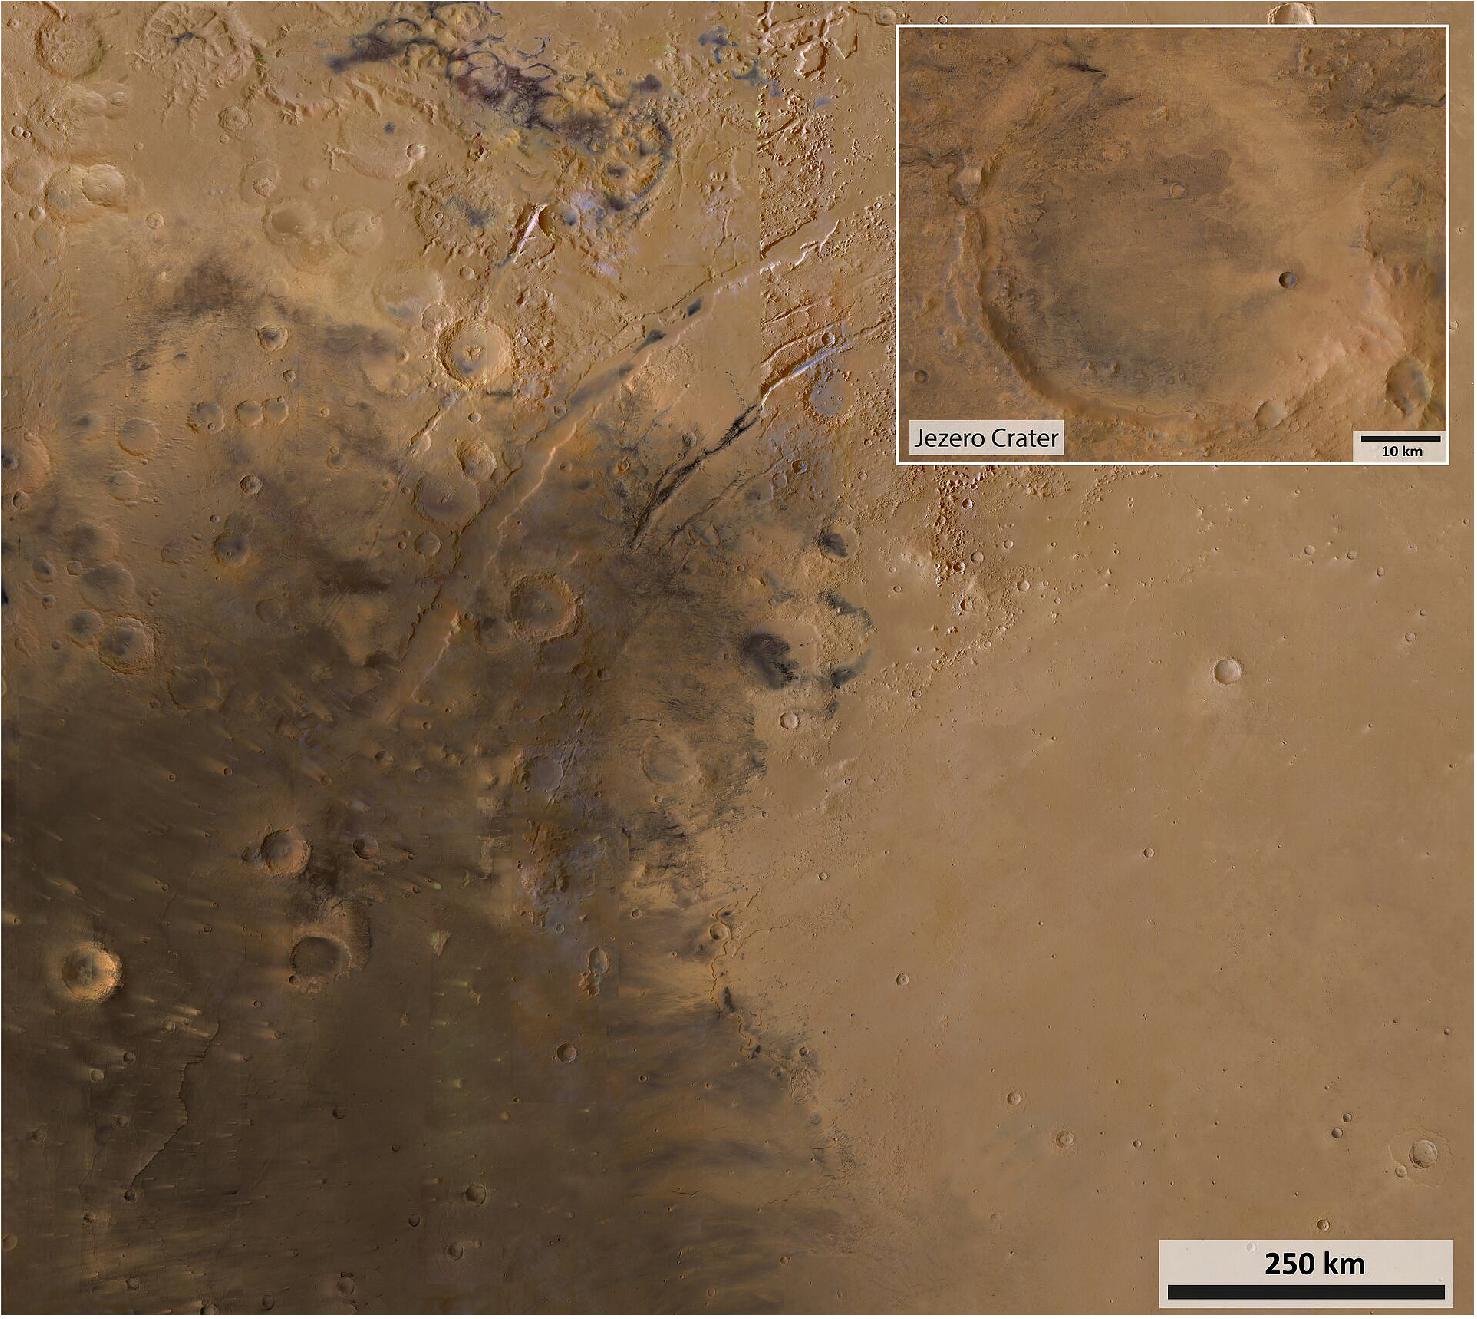
Tour the Viewpoints
- The 49 km Jezero Crater (viewpoint crater center) once hosted an ancient lake fed by two prominent valleys (viewpoints Naretva and Sava Vallis), with Perseverance targeting a region close to one of the river deltas (viewpoints Delta top and basement). Within the delta deposits, numerous water-bearing minerals have been observed from orbit, indicating that liquid water was once present for an extended period of time, perhaps up to 250 m depth.
- The deltas are a prime target to look for ancient biomarkers. Meanwhile an outflow channel (viewpoint Outflow channel) breaks through the eastern rim of Jezero. The presence of both inflow and outflow channels suggest the crater was constantly replenished with fresh water.
- The Mountain View viewpoint on top of a larger hill in the southeast offers a perfect vista into the crater. From here, the observer can see that the northern part of the crater floor is sloping and that the northern crater rim is clearly less defined, compared to the flat, smooth crater floor in the south and the much steeper southern crater rim flanks. This appearance originates from the erosion of material in the catchment areas to the north of the crater, which was then transported into the crater basin itself and deposited in the deltas. Also contributing to the asymmetrical topography is the erosion of the northern crater rim, caused by the river valleys breaking through the flank of Jezero.
• February 11, 2021: NASA’s Mars 2020 Perseverance rover is due to land on the Red Planet at 21:43 CET on 18 February 2021. In order to communicate with Earth from its landing site in Jezero Crater, the rover will rely on spacecraft orbiting Mars to relay the images and other data it collects back to Earth and pass on the commands from engineers beamed across space in the other direction. 25)
- On 18 February, NASA’s Mars 2020 Perseverance rover will land on the Red Planet
- ESA’s Mars orbiters – the ESA-Roscosmos ExoMars Trace Gas Orbiter (TGO) and Mars Express – are supporting the landing
- TGO will relay important data from Perseverance to Earth as soon as four hours after landing
- Mars Express is monitoring the local conditions at the landing site, Jezero Crater
- Both ESA orbiters are providing context images of the region
- TGO will attempt to image the rover in the weeks after landing.
The ESA-Roscosmos ExoMars Trace Gas Orbiter (TGO) is one of these spacecraft. As its orbit takes it over the landing site, TGO will enter communication windows with Perseverance and relay data between Earth and the rover via a network of deep space ground stations on Earth, including ESA’s Estrack network.
Helping Perseverance Phone Home
The data transmitted by Perseverance in its first hours and days on Mars will be vital to the mission. Did the rover land safely? Are all of its systems functional?
To ensure that this information gets to the engineers on Earth as quickly as possible, TGO and NASA’s mars orbiters will be able to communicate with deep space ground stations on Earth almost twenty four hours a day, seven days a week for the first two weeks after landing. ESA’s ground station network will provide roughly 14 hours a day of this ‘low-latency’ coverage.
“TGO will provide low-latency data relay support to Perseverance during this period, and continue to provide routine relay support afterwards,” says ESA’s Peter Schmitz, TGO Spacecraft Operations Manager. “Our first relay session with TGO will start at 02:07 CET on 19 February, just four hours after landing.”
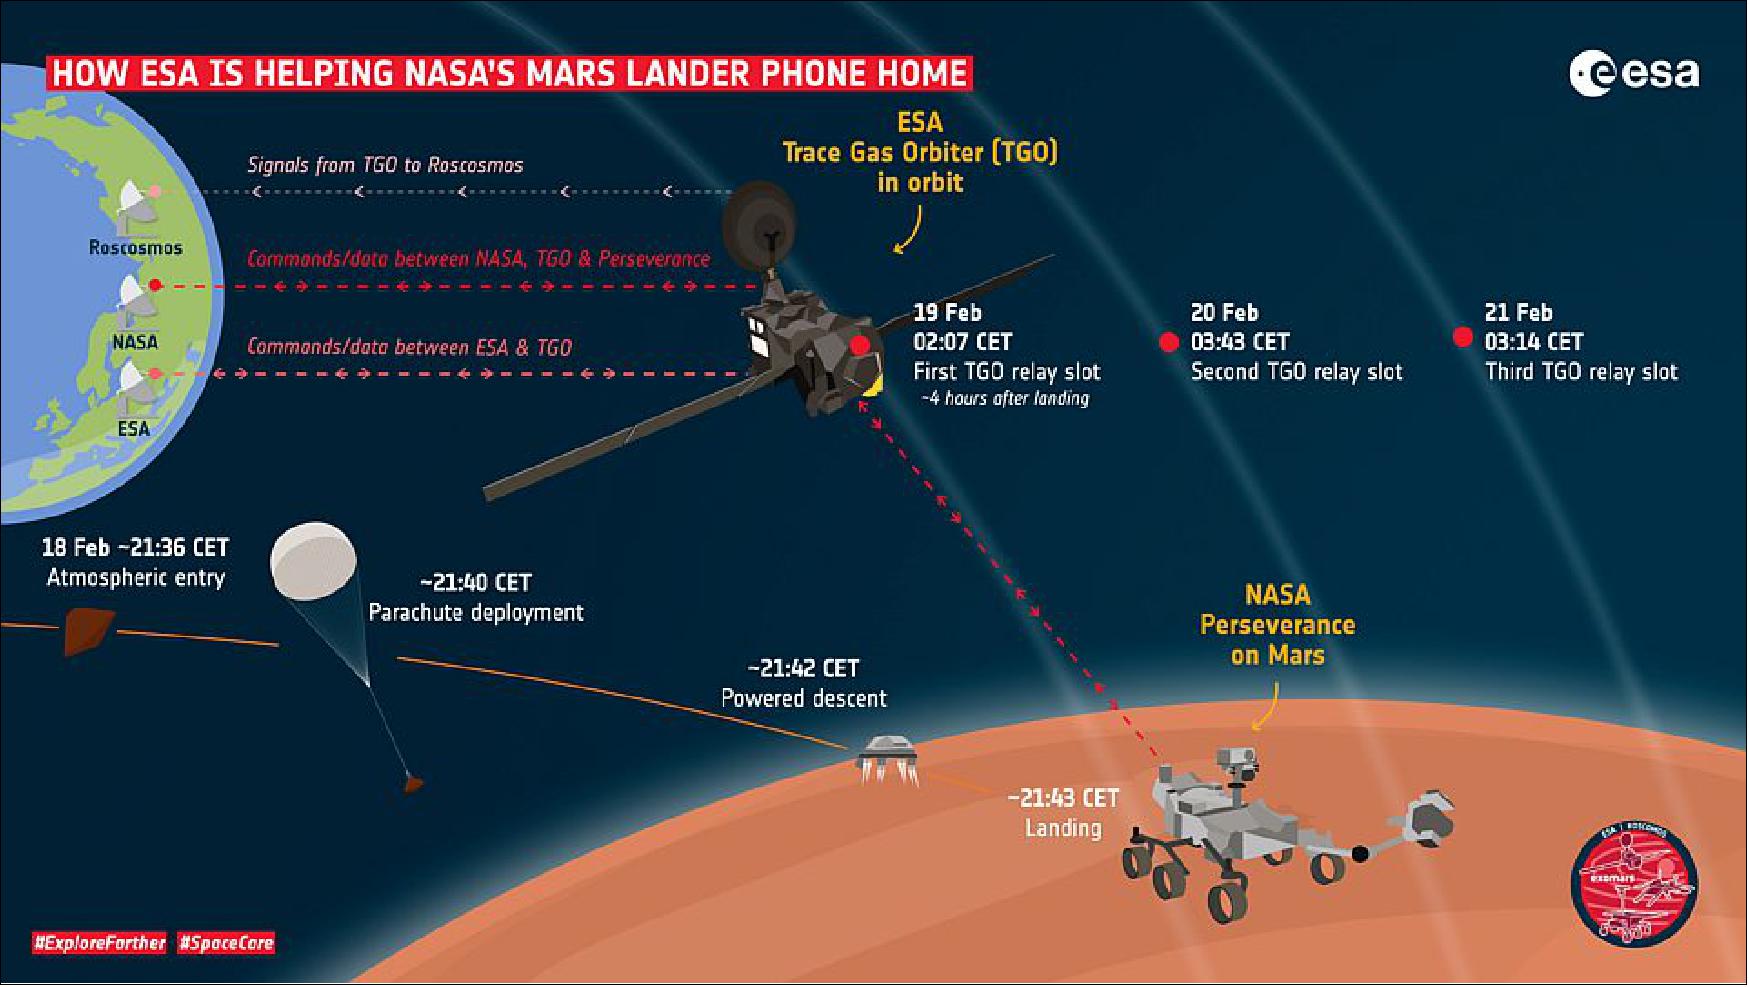
Monitoring Conditions at Jezero
Mars Express is Europe’s first mission to the Red Planet. Since beginning operations in 2004, the durable orbiter has helped answer fundamental questions about the geology, atmosphere, surface environment, history of water and potential for life on Mars.
The high-resolution camera on board Mars Express has sent back thousands of dramatic, 3D views of the martian surface, including those used to produce a virtual flight over Jezero Crater, the planned landing site for Perseverance.
The spacecraft’s Visual Monitoring Camera – also known as the ‘Mars Webcam’ – is providing additional wide context views of the landing region.
The Mars Express Planetary Fourier Spectrometer (PFS) is monitoring local conditions at Jezero Crater. The information it collects is passed on to the Perseverance Entry, Descent and Landing (EDL) team at NASA and is included in their daily report during the two weeks leading up to the landing.
“The engineers working with EDL systems need precise information on the density of the Martian atmosphere above the site at the time of landing and how it changes with altitude,” says Marco Giuranna, PFS Principal Investigator from Istituto Fisica Spazio Interplanetario in Rome, Italy.
“Having up-to-date knowledge of the temperature, pressure, dust and ice conditions in the atmosphere is crucial for understanding its density and predicting and analyzing the trajectory of the rover’s descent to the surface of the Red Planet.”
• February 8, 2021: A new Mars year began on 7 February 2021. 26)
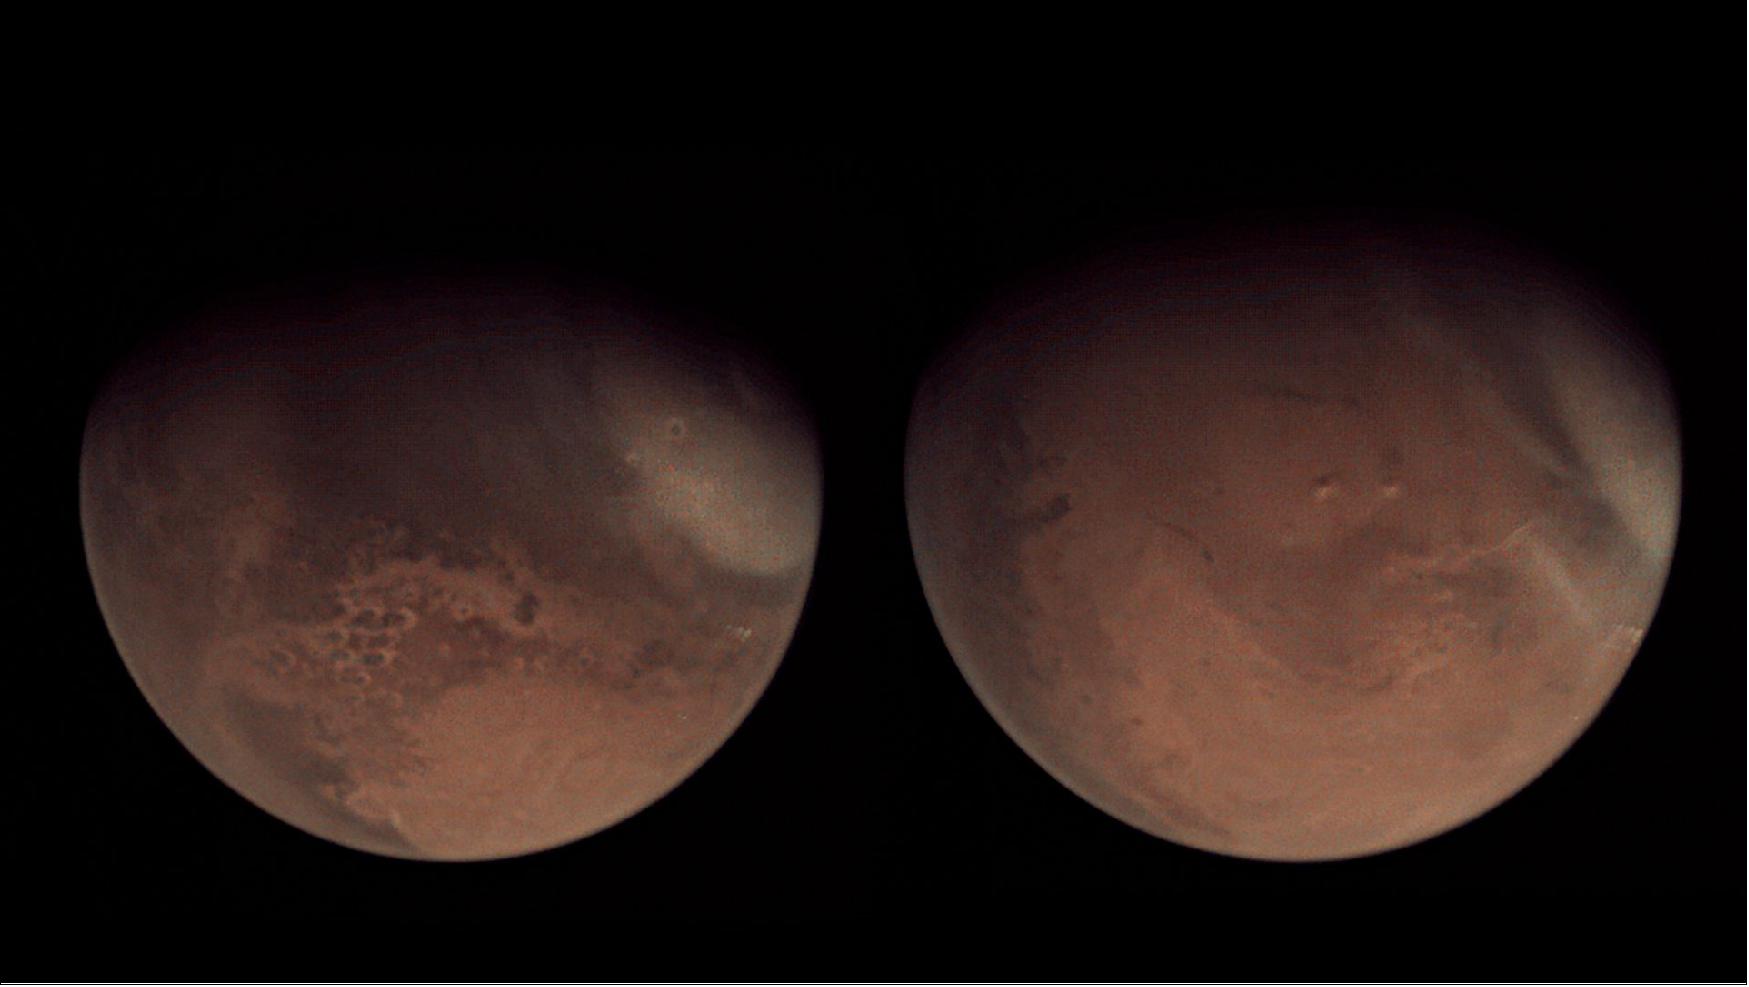
• February 3, 2021: On Mars, there are no yearly tax returns, but as the planet also orbits around our Sun, time on Mars is similarly measured in years. However, there are some significant differences between a year on Mars and a year on Earth. As we approach New Year’s Eve on Mars, let’s look at some similarities and differences between a year on the two planets. 27)

Some Background Information on Planet Mars
• One year on Mars equals 687 Earth days. It takes almost twice as long as our Earth to orbit the Sun. This means your age would be a lot less if you lived on Mars! If you would like to feel younger, just divide your current age by 1.88 and casually mention to your friends that that’s your real age ... on Mars.
• A martian day is defined, like on Earth, as the time it takes for the planet to make one revolution around its axis. This is called a sol. A sol is only slightly longer than an Earth day: 24 hours and 39 minutes.
• Mars has four seasons: winter, spring, summer and autumn. They are defined by the planet’s position along its orbit around the Sun. The martian New Year begins with the northward equinox (northern spring, southern autumn). As Mars travels through its yearly trajectory, the planet’s axial tilt causes the northern hemisphere to receive more sunlight during the northern summer, and the southern hemisphere to receive more sunlight in northern winter – just like on Earth. Unlike Earth’s seasons however, the seasons on Mars are not of equal lengths. This is because the orbit of Mars around the Sun is more elliptical than that of Earth. For example, the northern hemisphere spring (southern hemisphere autumn) lasts the longest, 194 sols, and the northern hemisphere autumn (southern hemisphere spring) is the shortest season at 142 sols.
• Mars’ elliptical orbit can have important consequences. During southern spring and summer, Mars swings by the sun closer and faster. The resulting increase in luminosity heats up the atmosphere, causing turbulence to lift up very fine particles from the martian soil. For this reason, the second half of a martian year is often marked by fierce dust storms that can sometimes become planet-wide.
• Like on Earth, winters are cold and summers are warm on Mars, but the planet’s overall temperature is a lot cooler, it has a yearly average temperature of minus 60 degrees Celsius. The planet experiences different weather phenomena throughout the seasons. A weather phenomenon that reappears every year around the southern spring and summer is the Arsia Mons Elongated Cloud, a cloud of ice crystals that can reach up to 1800 km in length. It repeats for at least 80 sols and then disappears again during the rest of the year.
• The martian calendar began fairly recently compared to the one on Earth. The count started in Earth year 1955. This first martian year coincided with a very large dust storm in its second half, aptly named ‘the great dust storm of 1956’.
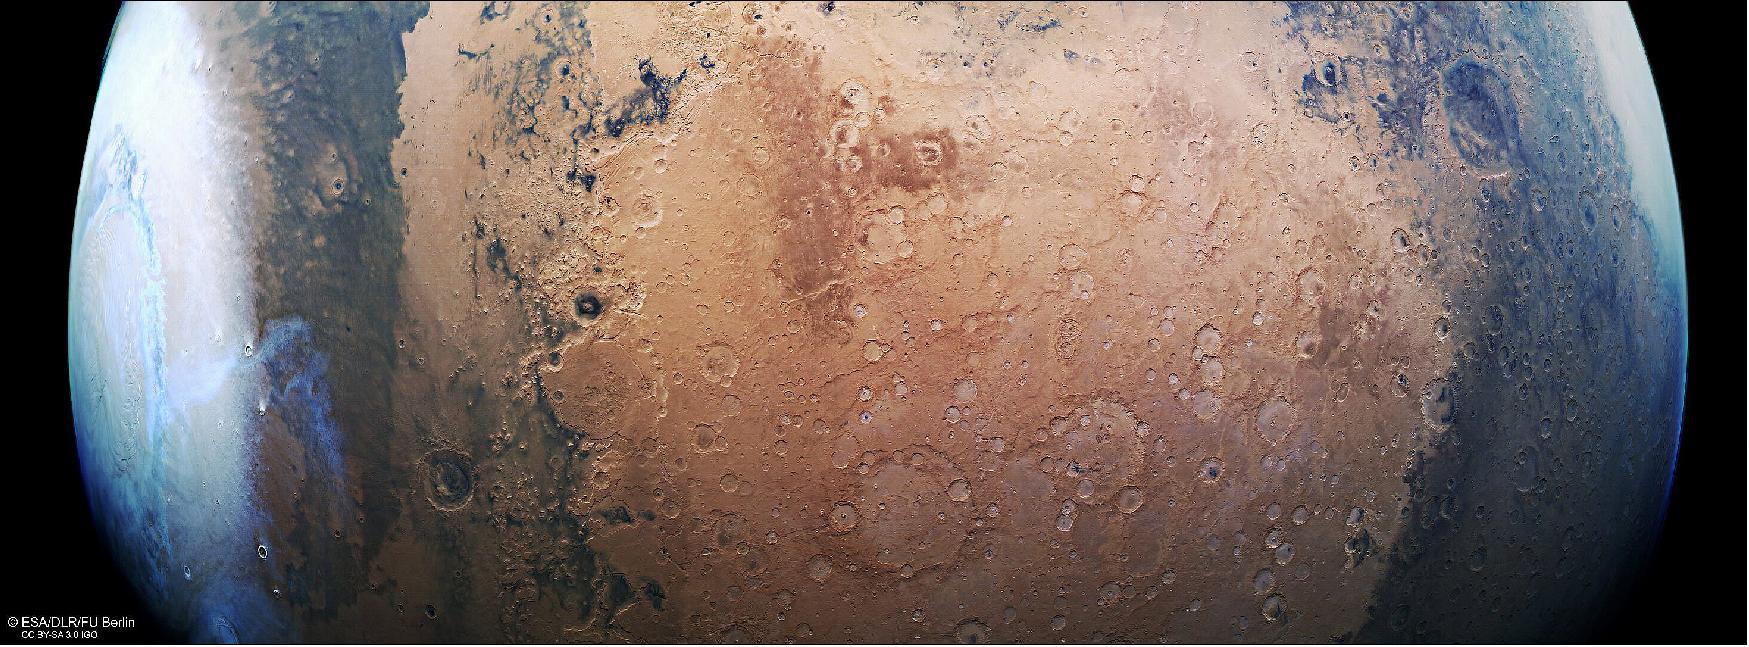
• December 17, 2020: As the holiday season swiftly approaches, even our planetary neighbors are getting into the spirit – as shown by this perfect pair of festive silhouettes spotted by ESA’s Mars Express. 28)
- The defined wings of an angelic figure, complete with halo, can be seen sweeping up and off the top of the frame in this image from Mars Express’ High Resolution Stereo Camera, while a large heart sits just right of centre. These shapes appear to jump out of the light tan — or, in the spirit of the season, eggnog-colored! — surface of Mars; their dark color is a result of the composition of the constituent dune fields, which largely comprise sands rich in dark, rock-forming minerals that are also found on Earth (namely pyroxene and olivine).

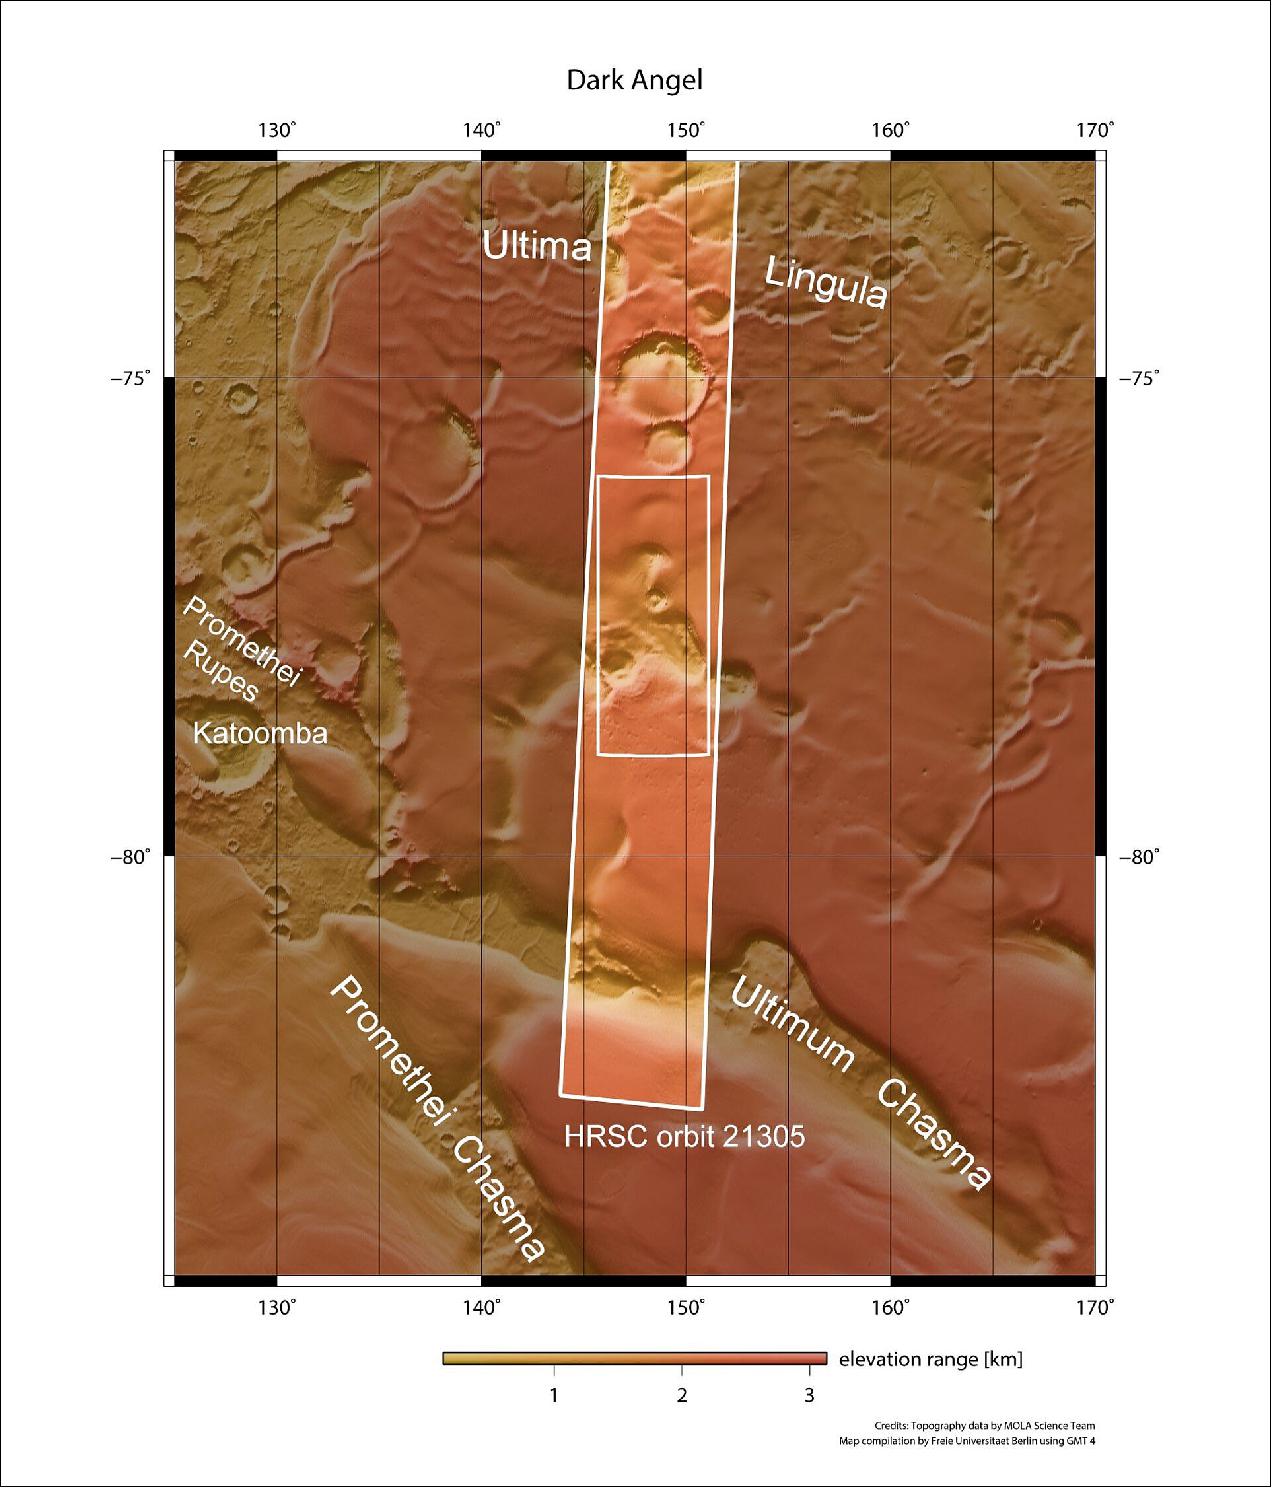
- This ethereal scene is found in the south polar region of Mars, with the pole itself located directly out of frame to the right (south). The south pole is typically covered in a 1.5 km-thick ice cap measuring around 400 km across and with a volume of 1.6 million km3, just over 12% of which is water ice. The rest of the cap is largely composed of ‘dry ice’ (solid carbon dioxide), which freezes from the atmosphere during winter and then sublimates (turns from a solid to a gas) in the summer.
- As Mars’ southern hemisphere is currently experiencing summer, this image shows the planet’s southern polar ice stores at their lowest annual levels.
- The ‘angel’ and ‘heart’ are both composed of various interesting features. Firstly, the angel’s hand, seen as if reaching to the left, is thought to be a large sublimation pit, a type of feature that forms as ice turns to gas and leaves empty pockets and depressions in the planetary surface (a process that often occurs as the seasons change). Sublimation pits have been seen on other planets in the Solar System, such as Pluto, and can also be seen scattered across the terrain to the right.
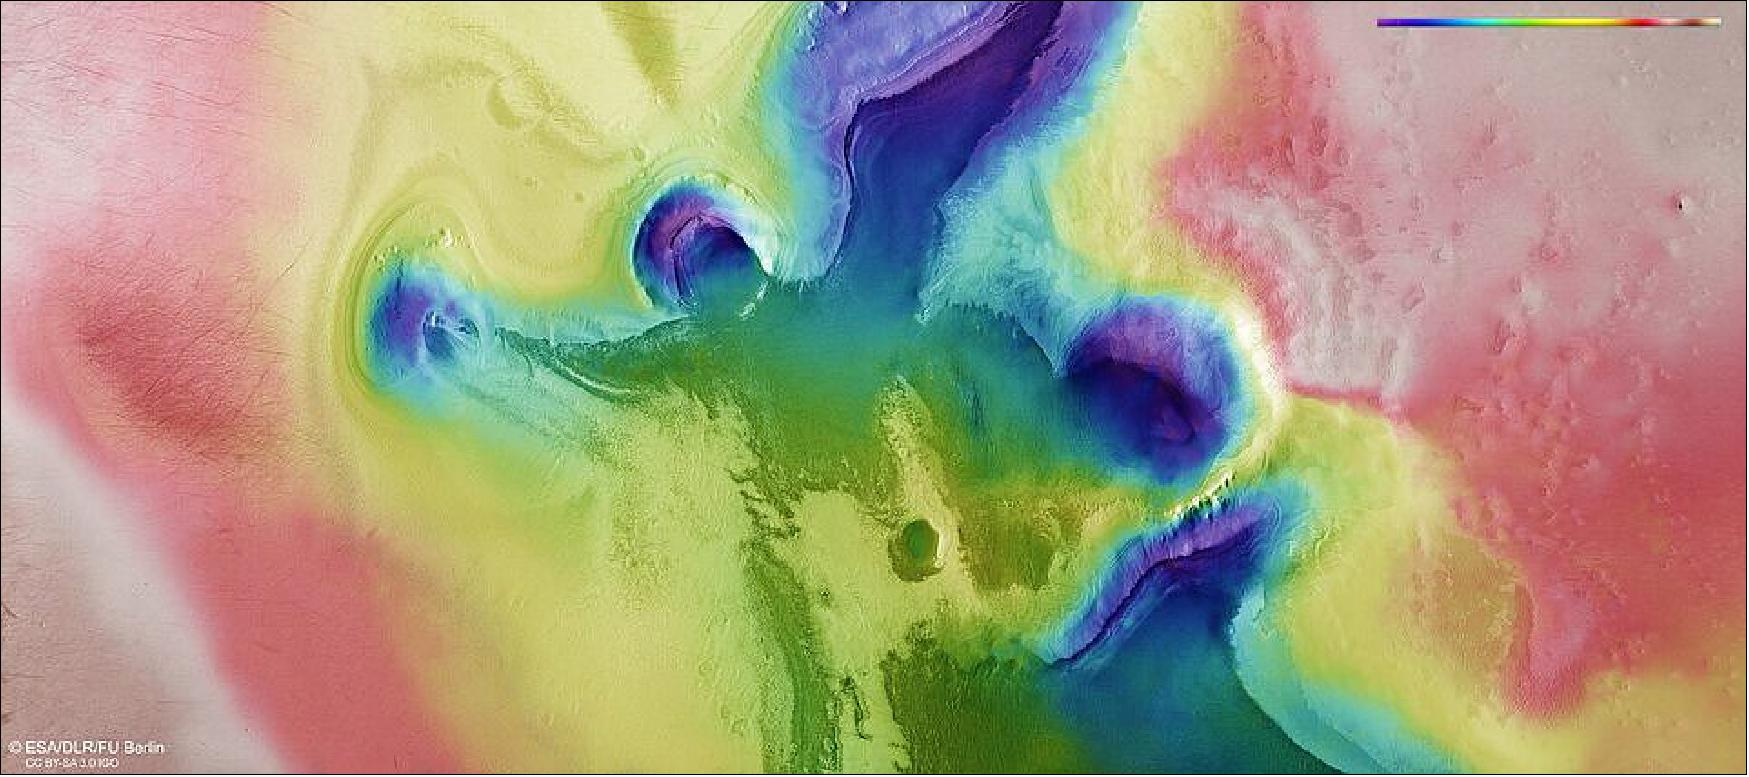
- Moving on to one of the angel’s most distinctive features, its halo, reveals yet more intriguing processes at play. The ‘head’ and halo are formed of an impact crater, created as a body from space flew inwards to collide with Mars’ crust. As this impactor hit it dug down into the surface, revealing the numerous layered deposits that make up the southern polar region. These subsurface layers can be glimpsed in other areas where the surface has been disturbed – areas that are clearly identifiable in the associated topographic view due to their notably low elevation – and hint at the long, complex, interesting history of this part of Mars.
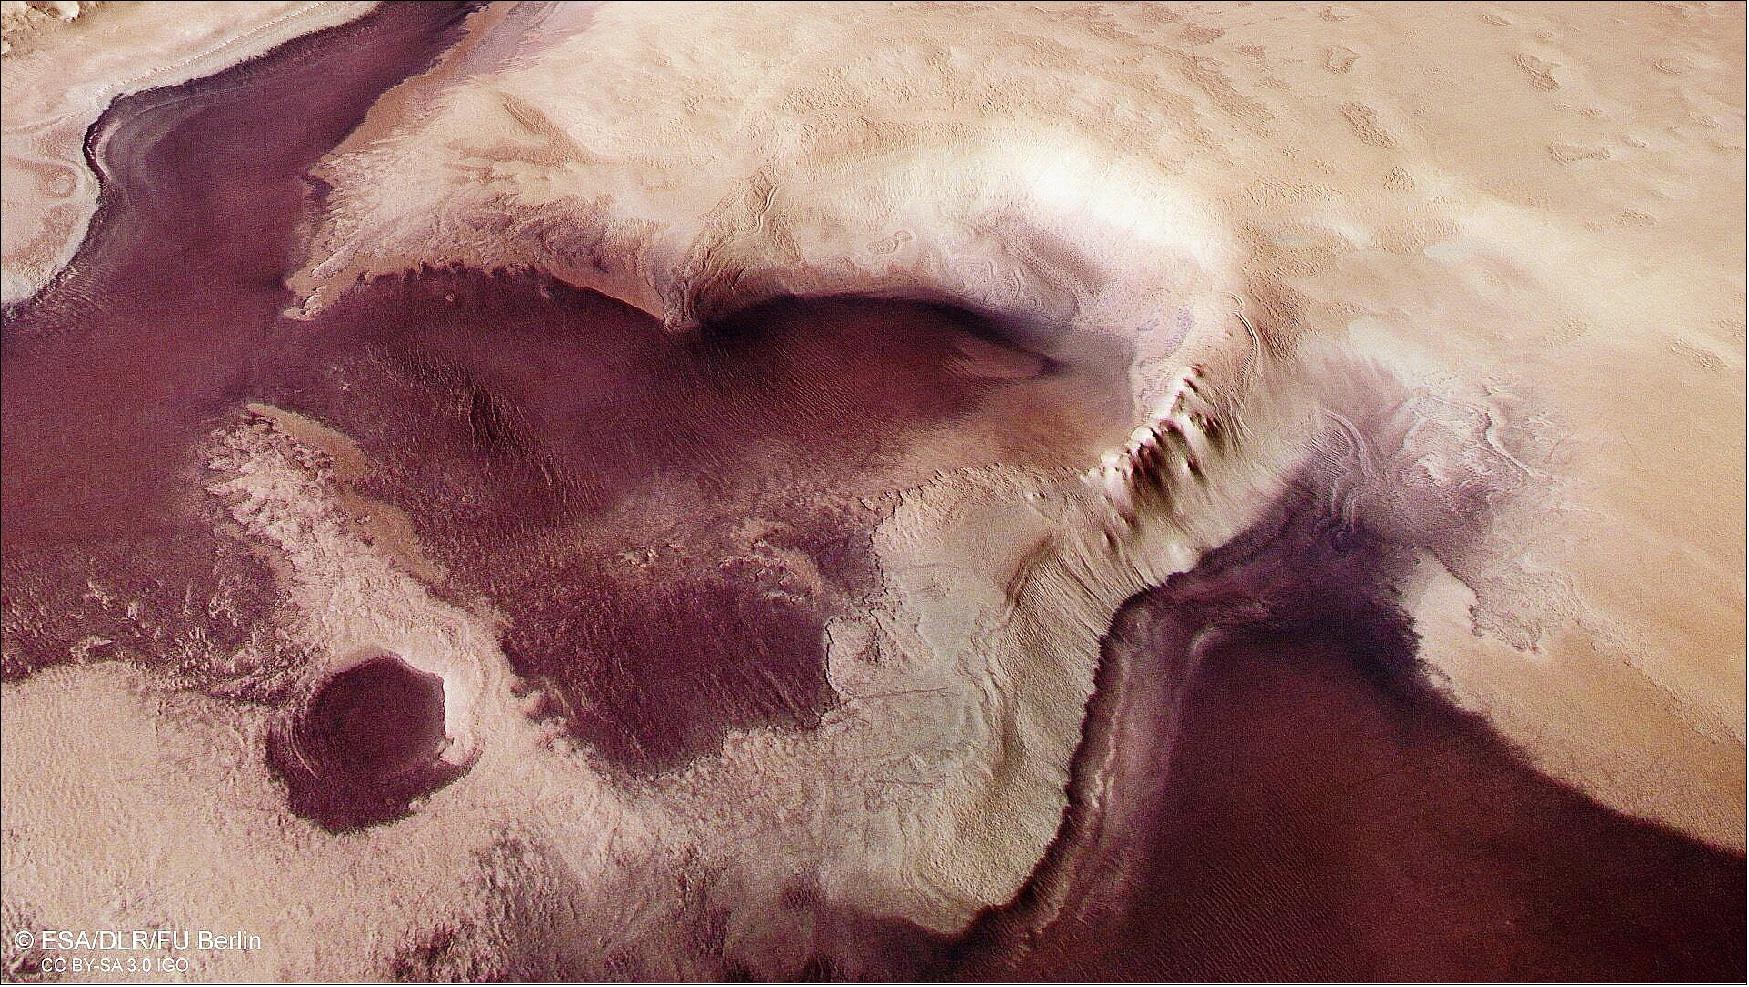
- Finally comes the heart, which is underscored by a steep escarpment – a line of cliffs or steep slopes created by erosive processes – and separated from the dark expanse of dunes below. The origin of this dark material, which is found all over Mars, remains unclear, but scientists posit that it once existed deeper below the surface in layers of material formed by ancient volcanic activity. Although this material was initially buried, it has since been brought to the surface by ongoing impacts and erosion, and then distributed more widely across the planet by martian winds.
- This landscape also shows signs of dust devils in the dark, scratched, cross-hatched pattern to the left of the frame. Dust devils are common on Mars, and form as dust is whipped up from the Sun-warmed surface by wind. Here, dust devils have lifted surface material and carried it away, leaving dark marks in their wake.
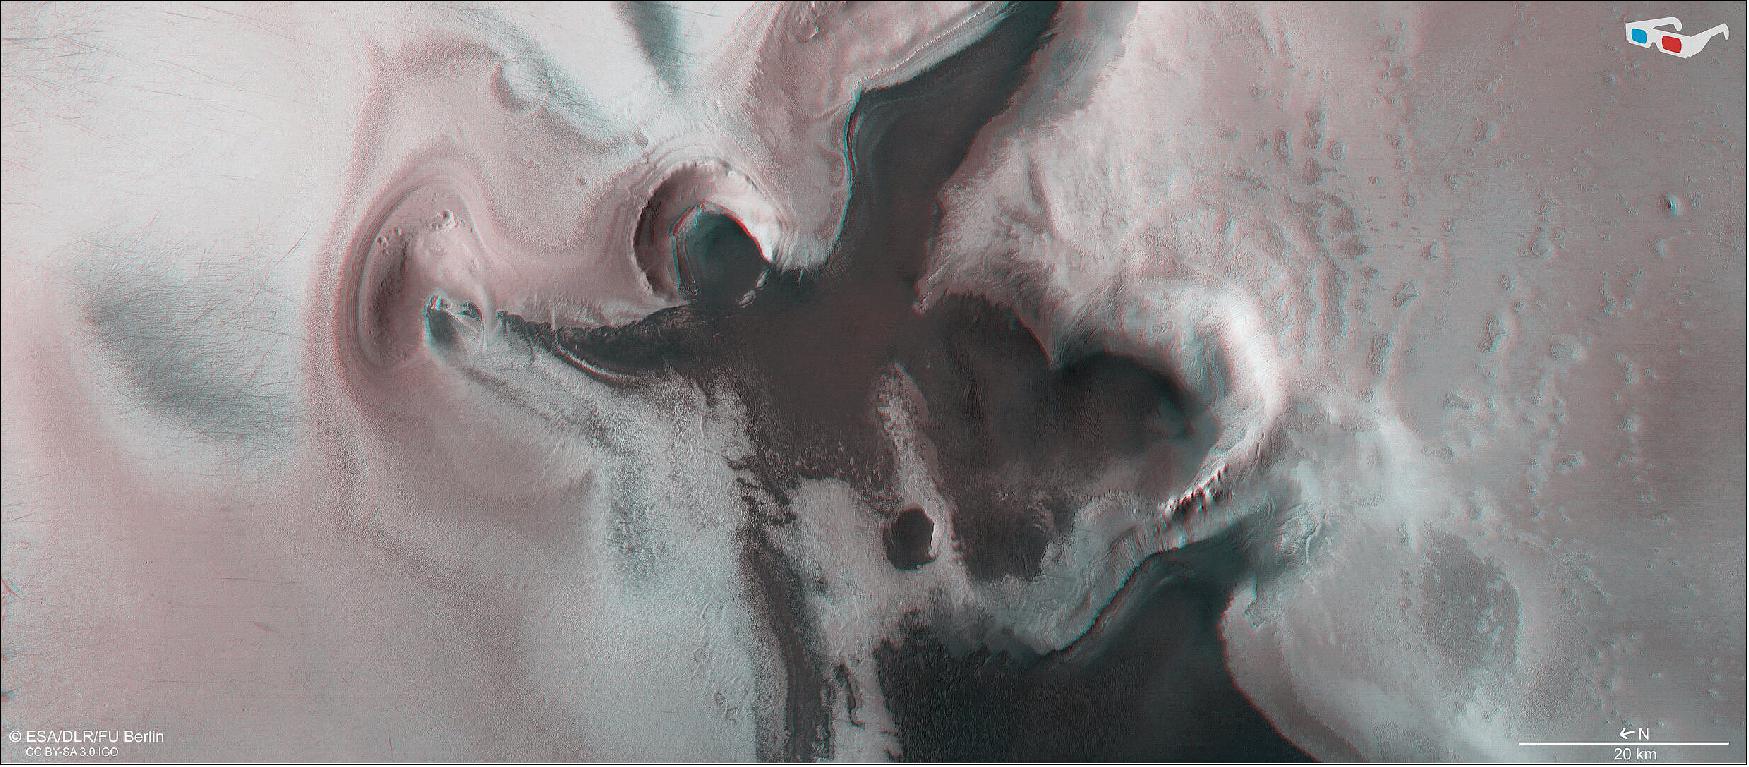
• November 19, 2020: Elevation can be deceiving in satellite imagery of Mars, even when differences are extreme – as demonstrated by this image of Pyrrhae Regio from ESA’s Mars Express. A chunk of terrain has collapsed and dropped more than four kilometers below its surroundings, illustrating the incredible contrast and dynamism seen across the martian surface. 29)
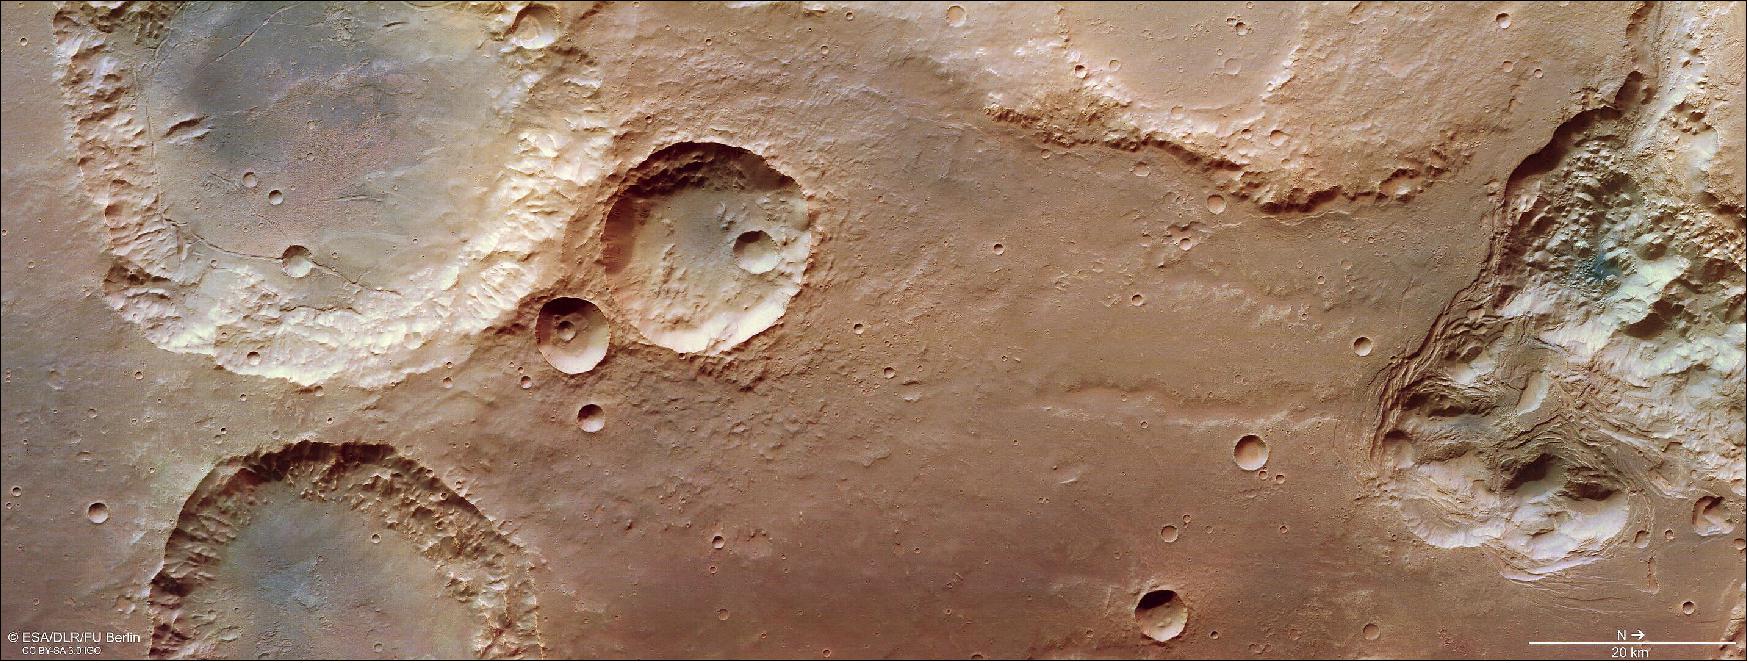
- This slice of Mars, seen here as imaged by Mars Express’ High Resolution Stereo Camera (HRSC), shows signs of various intriguing processes.
- A scattering of impact craters, formed as incoming bodies from space collided with Mars’ surface, can be seen to the left of the frame; the floor of the largest and uppermost basin spans about 40 km, and contains some fractures and markings that formed just after the crater itself. Hot, molten rock is thought to have been thrown up during the crater-forming collision, after which it cooled and settled to form the scar-like features visible here.
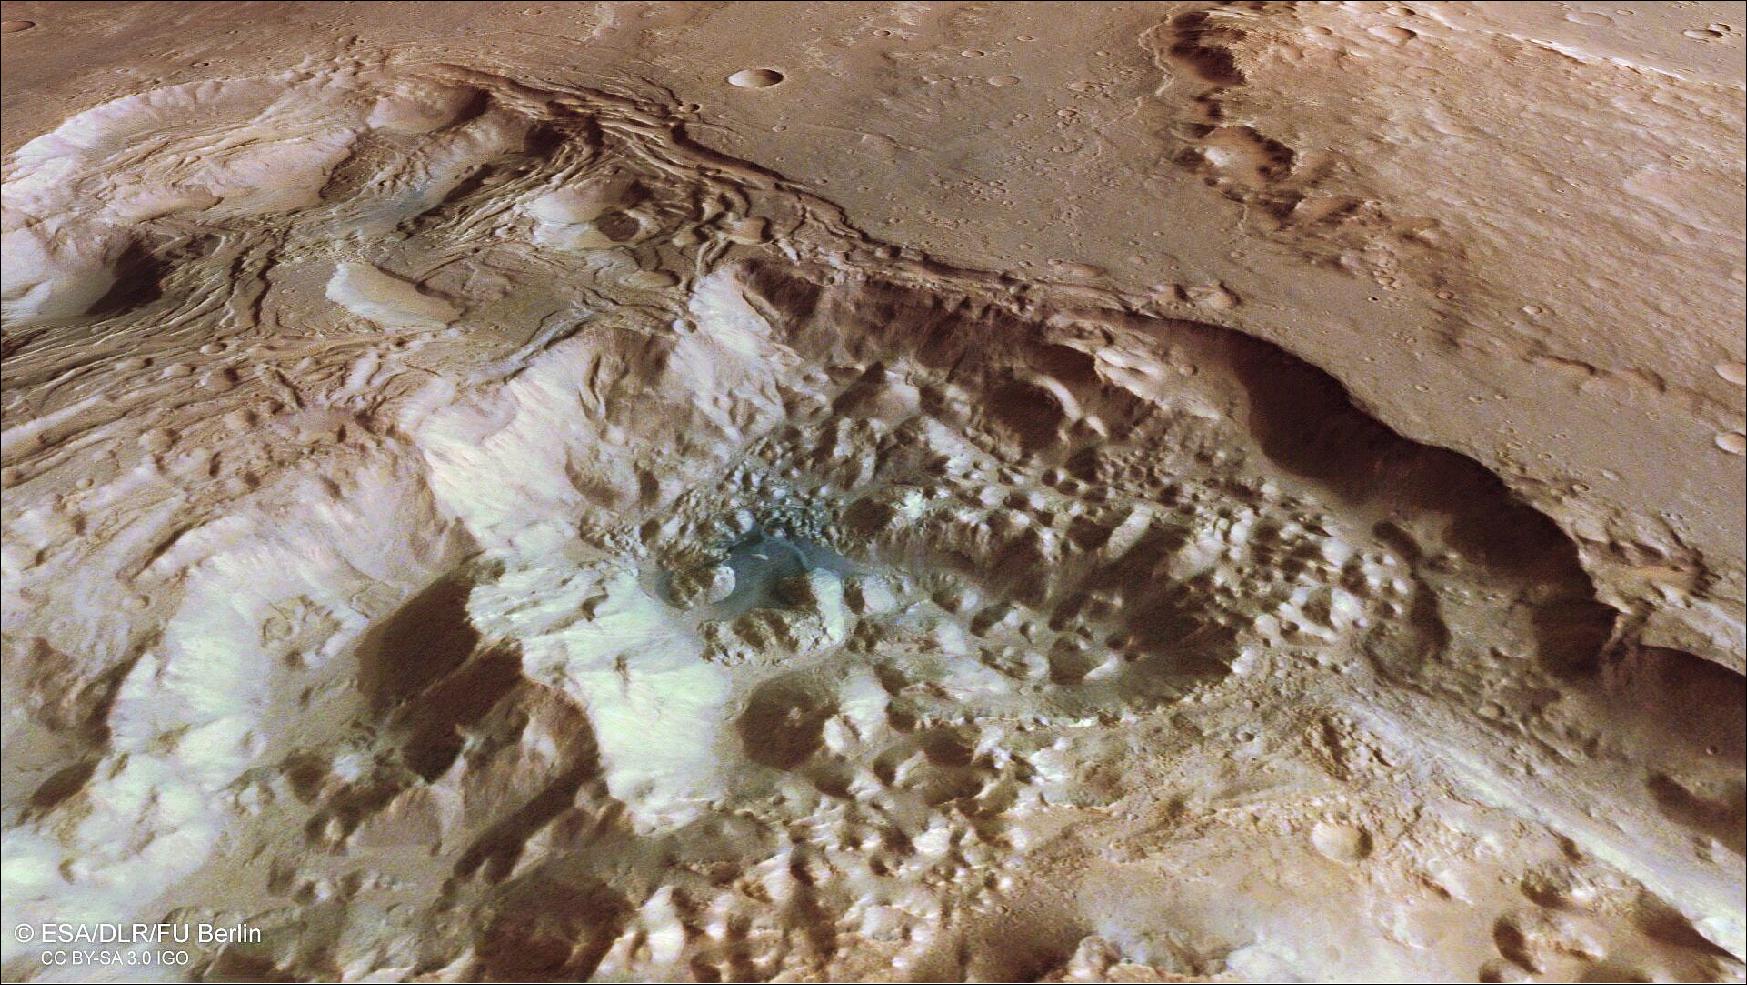
- Towards the middle of the frame, the surface is relatively smooth and featureless – however, two broad channels have worked their way through the landscape, and can be seen as meandering, branching indentations in the surrounding terrain. These channels are reminiscent of so-called ‘sapping valleys’ on Earth, which form as water consistently seeps and flows through sediment to carve out a natural drainage network.
- The valleys are attached at their rightward end to the real star of this image: a sunken, uneven, scarred patch of ground known as chaotic terrain.
- Chaotic terrain, as the name suggests, looks irregular and jumbled, and is thought to form as sub-surface ice and sediment begins to melt and shift. This shifting layer causes the surface above to collapse – a collapse that can happen quickly and catastrophically as water drains away rapidly through the regolith (the near-surface layer of rocky planets). Ice can be triggered to melt by heating events such as volcanic lava flows, subsurface magmatism, impacts by large meteorites, or changes in climate.
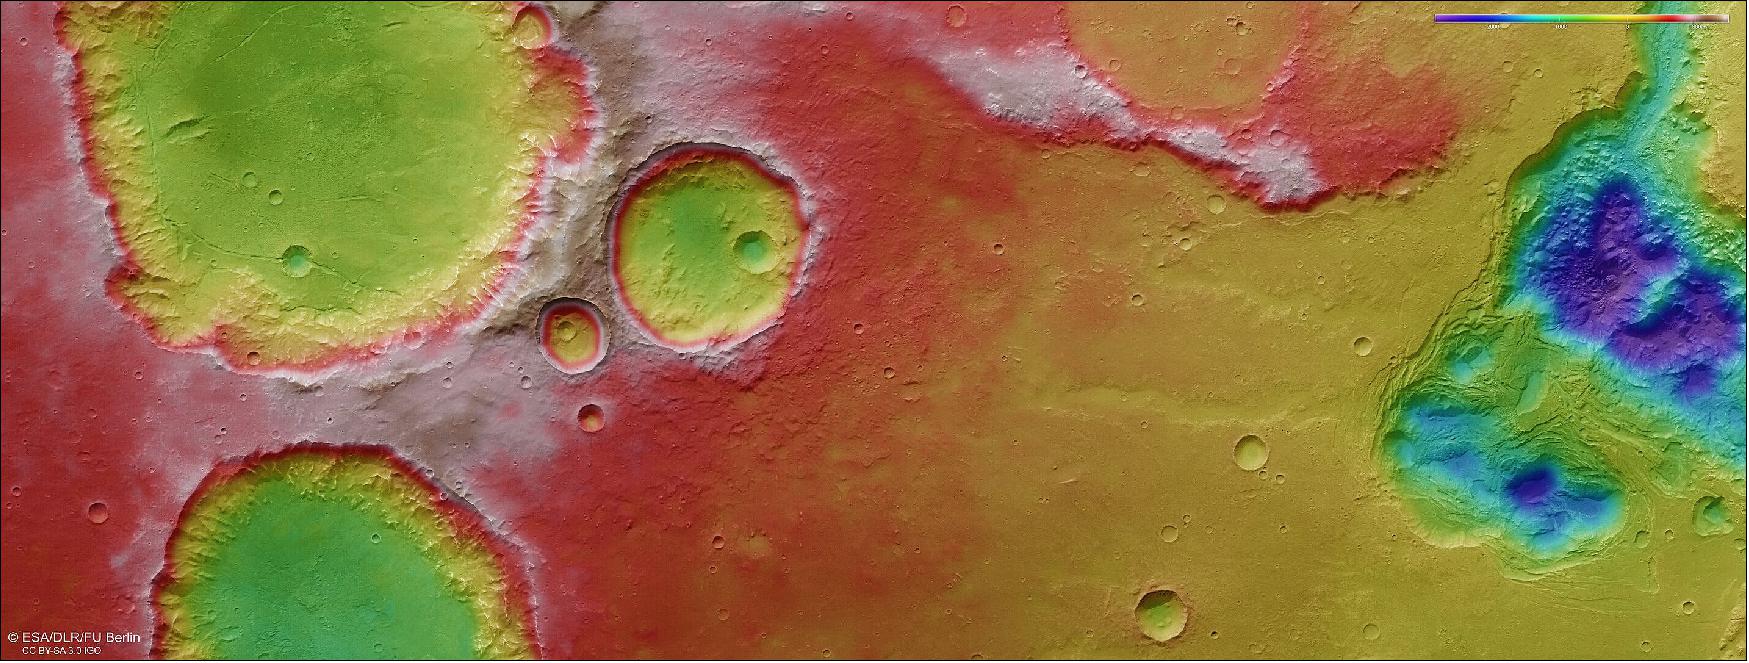
- In the chaotic terrain seen here, ice has melted, the resulting water drained away, and a number of disparate broken ‘blocks’ have been left standing in now-empty cavities (which once hosted ice). Remarkably, the floors of these cavities lie some four kilometers below the flatter ground near the craters to the left, as seen clearly in the associated topographic view – a colossal difference in height (for reference, the highest mountain peaks of the Pyrenees and the Alps top out at just over 3.4 km and 4.8 km, respectively).
- Considering the broader landscape containing and surrounding Pyrrhae Regio, the chaotic nature of this area is unsurprising. To the west of this patch of ground lies one of the most extreme features in the Solar System: a colossal canyon system named Valles Marineris.
- Valles Marineris is roughly ten times longer and five times deeper than the Grand Canyon on Earth, and comprises myriad smaller rifts, channels, outflows, fractures and signs of flowing material (such as water, ice, lava or debris). It is home to many substantial chaotic terrains, including Aurorae Chaos and Erythraeum Chaos.
- Valles Marineris is an unmissable scar on the face of Mars, and thought to have formed as the planet’s crust was stretched by nearby volcanic activity, causing it to rip and crack open before collapsing into the deep troughs we see today. These troughs have been further shaped and eroded by water flows, landslides, and other erosive processes, with spacecraft including Mars Express spying signs that water existed in parts of Valles Marineris in the relatively recent past (‘mere’ hundreds of millions of years ago).
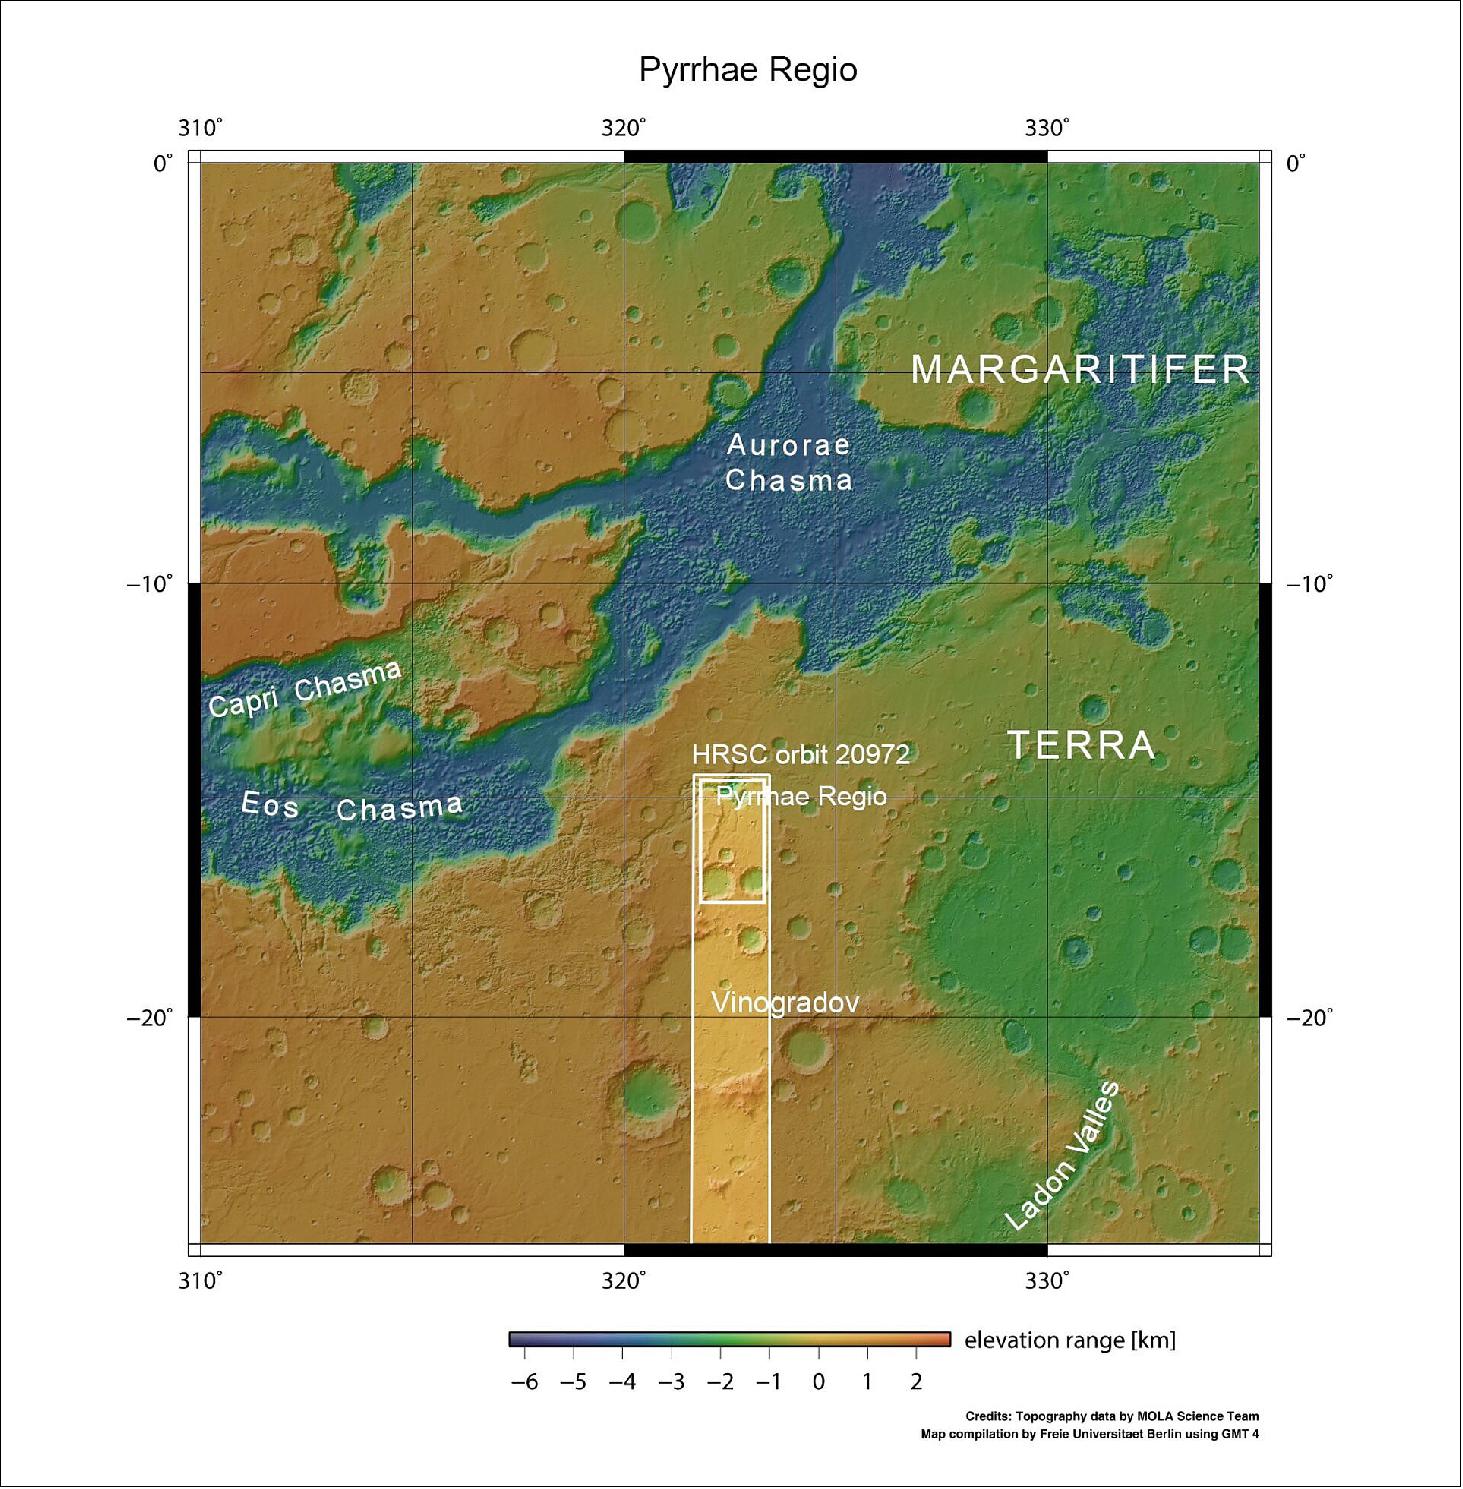
- Valles Marineris is an unmissable scar on the face of Mars, and thought to have formed as the planet’s crust was stretched by nearby volcanic activity, causing it to rip and crack open before collapsing into the deep troughs we see today. These troughs have been further shaped and eroded by water flows, landslides, and other erosive processes, with spacecraft including Mars Express spying signs that water existed in parts of Valles Marineris in the relatively recent past (‘mere’ hundreds of millions of years ago).
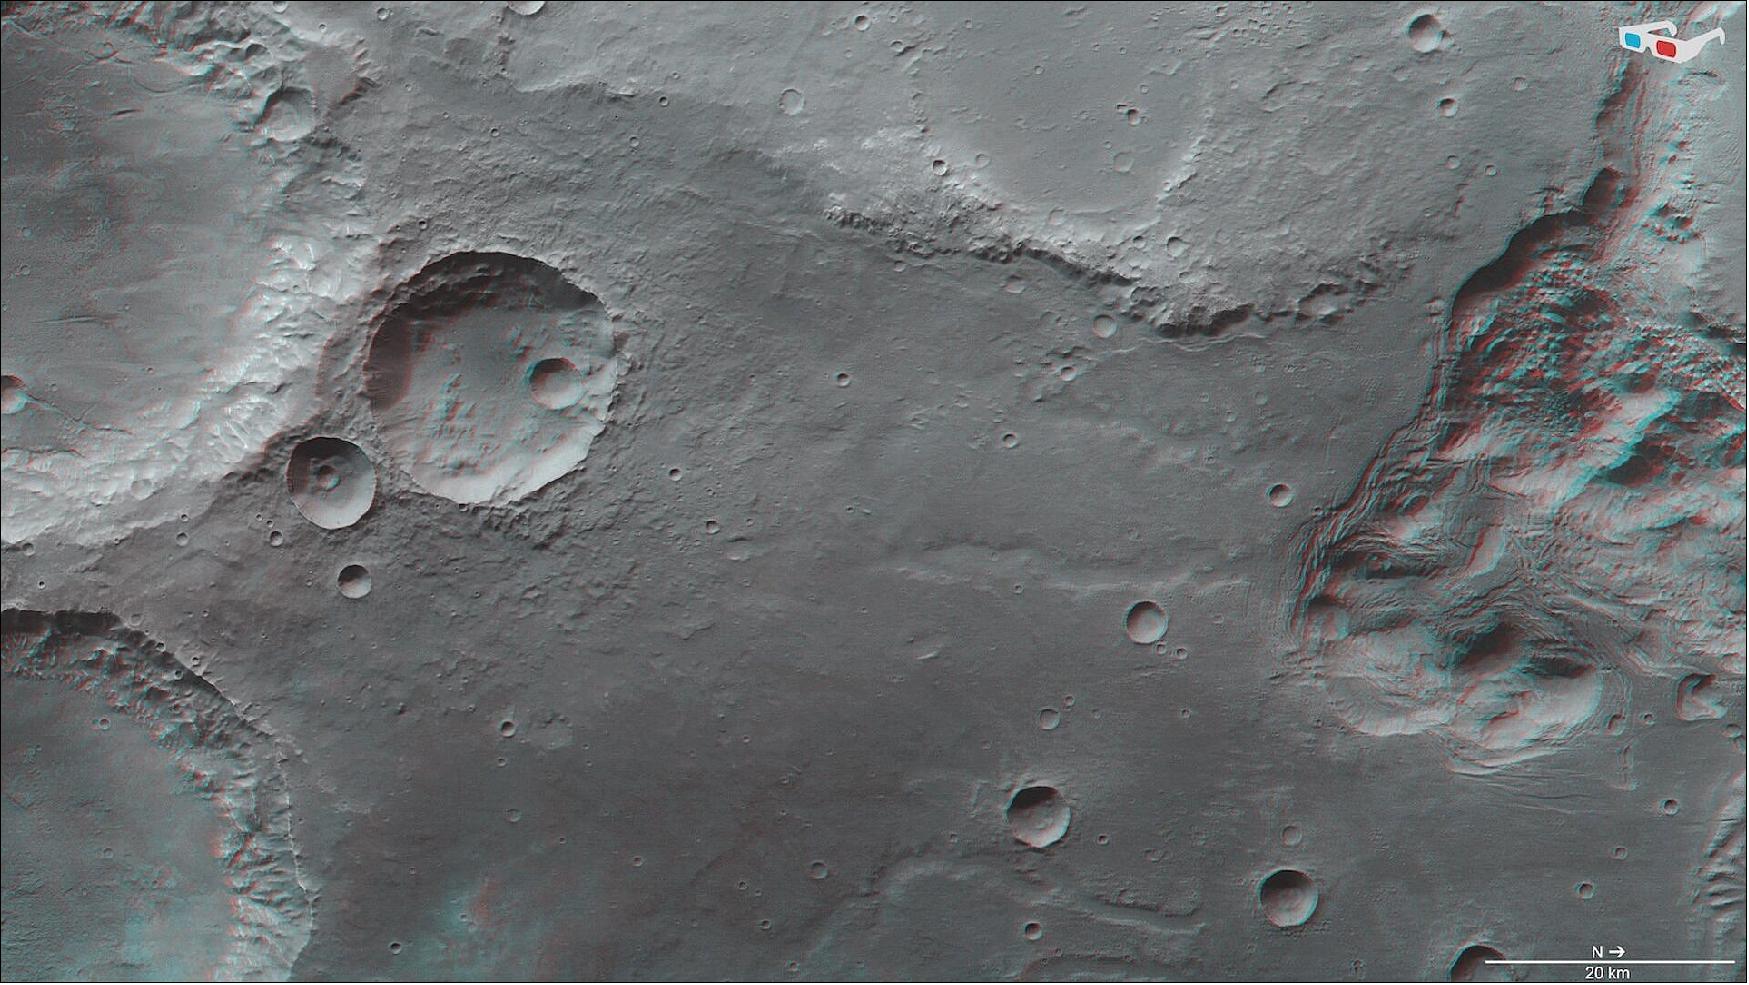
• October 29, 2020: Mars is covered in intriguing scars – some of the most prominent being impact craters. A particularly unusual example is shown in this new image from ESA’s Mars Express: an ancient triplet comprising not one but three overlapping craters. 30)
- The crater triplet is located in an especially old part of Mars’ southern hemisphere known as Noachis Terra. This region was heavily cratered during the Noachian era, an ancient time about four billion years ago in Mars’ history in which huge numbers of asteroids and comets flew inwards to crash into the planet's surface. Some of the features created by these collisions remain intact on Mars today and, as they formed during the very earliest days of the Solar System, are of particular interest to scientists seeking to know more about our planetary neighbor and its past.
- Signs of chaotic Noachian processes and events are seen especially clearly in Mars’ southern highlands, which are peppered with old, time-worn craters. ESA’s Mars Express has imaged many craters in this region, from the severely eroded Greeley Crater, named after the American geologist Ronald Greeley, to the dune-patterned Neukum Crater, named after one of the founders of the Mars Express mission (and the former Principal Investigator of the spacecraft’s High Resolution Stereo Camera (HRSC), the camera responsible for this new image).
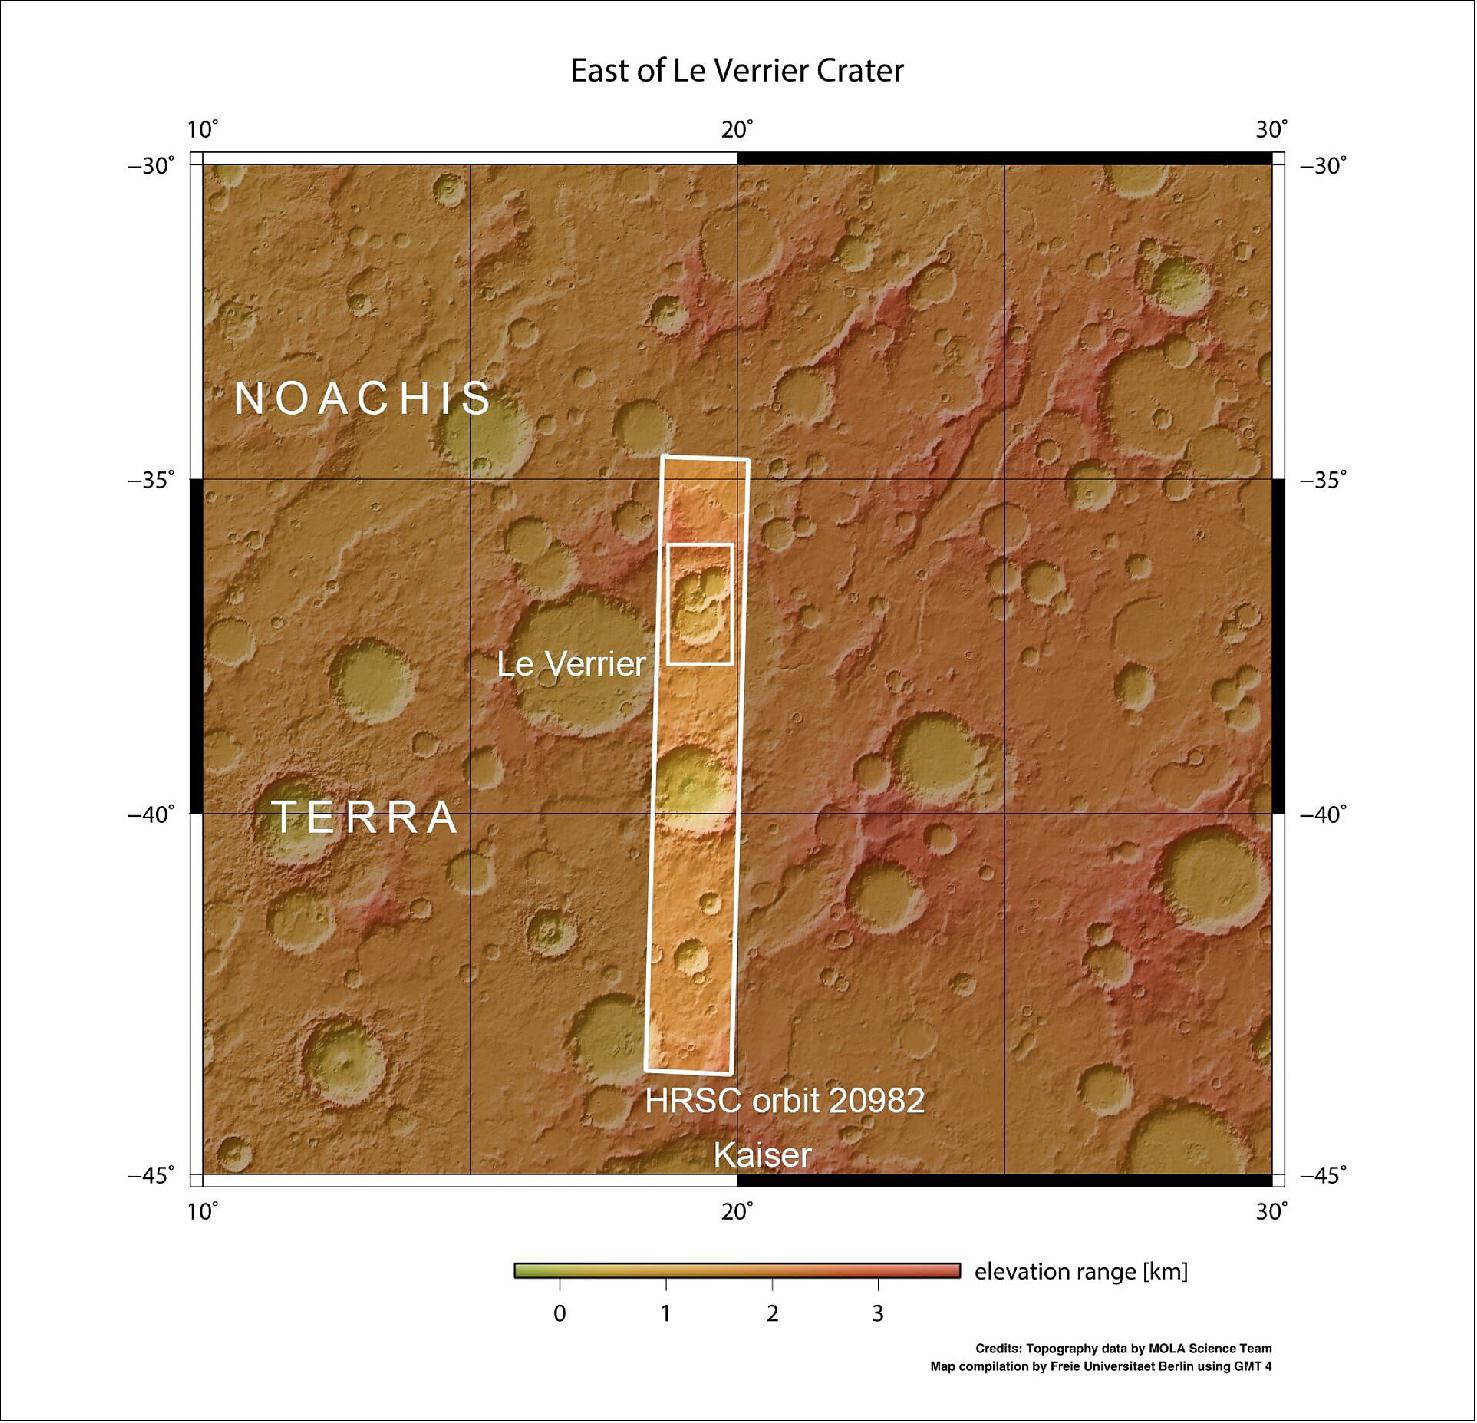
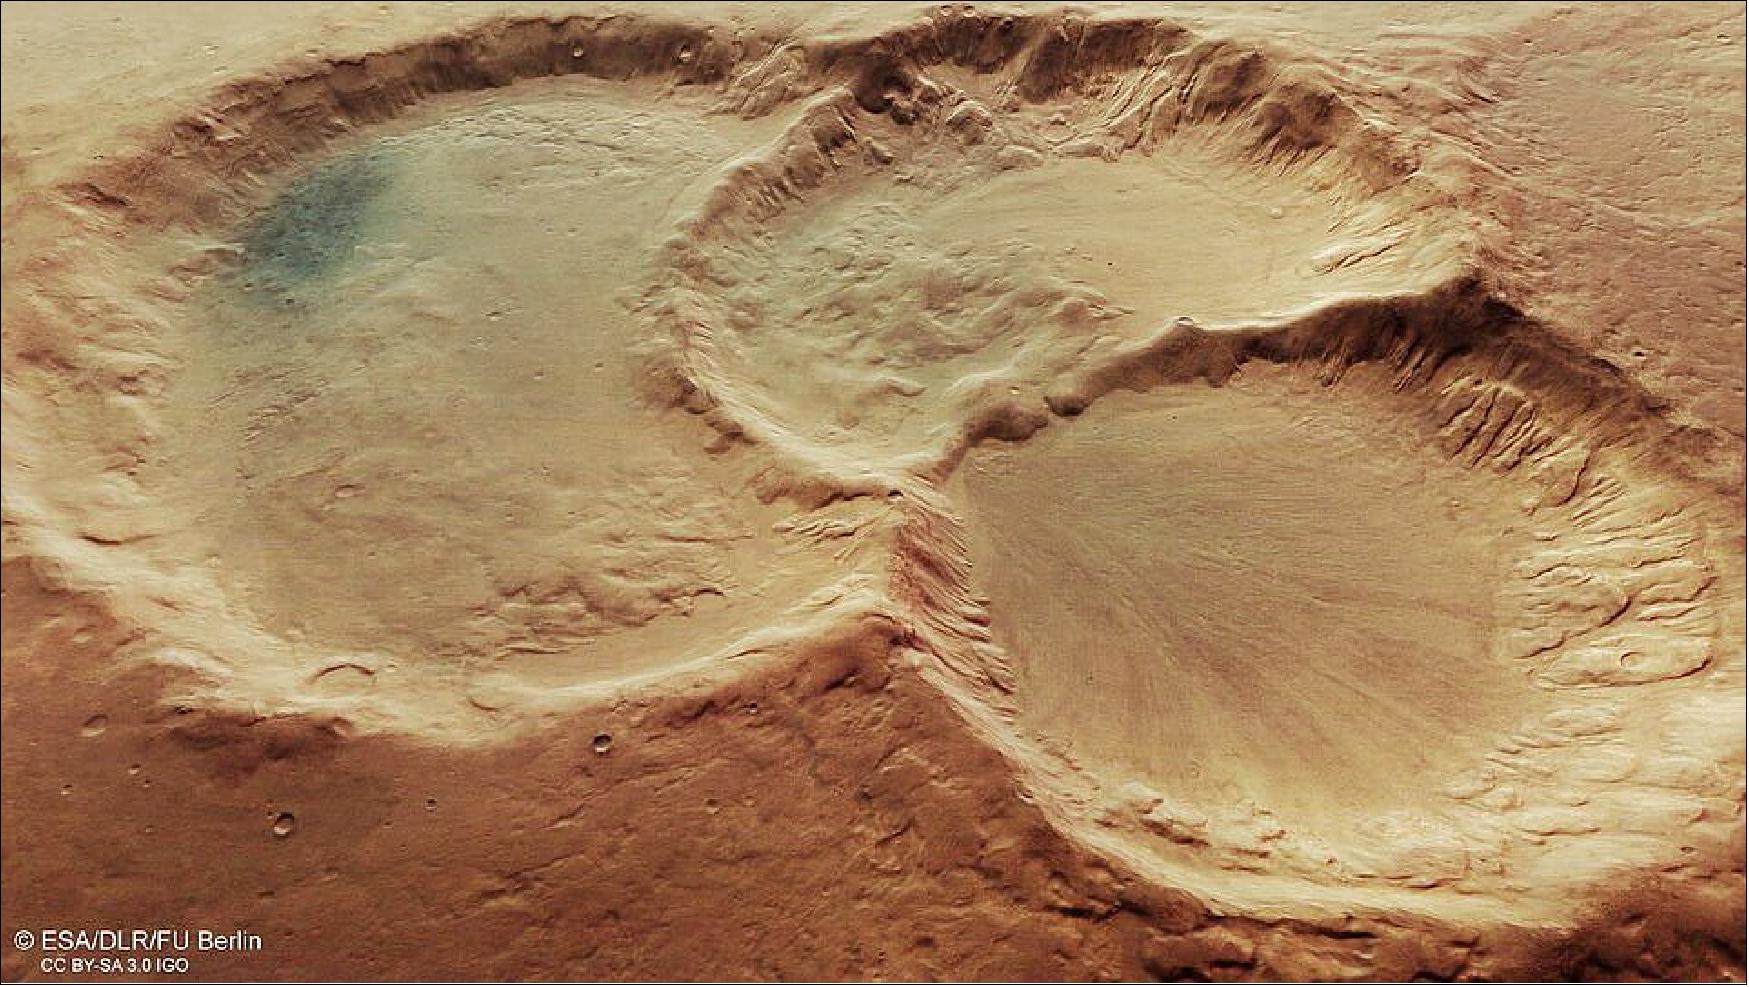
- This image shows a triple crater found just east of a better-known feature named Le Verrier Crater, which spans nearly 140 km across. By contrast, the three depressions seen here are somewhat smaller; the largest measures 45 km across, and the smallest 28 km.
- How would such a crater triplet form? One possible explanation – and that thought to be most likely – is that the impactor broke into three before hitting the ground, forming a crater trio upon impact. Not all ‘multiple impactors’ leave such clear and neat features in their wake, with many instead showing elongated troughs, non-circular hollows lying closely side-by-side, or only partially overlapping basins. Another explanation could be coincidence: at different points in time, three separate impactors could have hit Mars’ surface in this location, creating a neat superposition of craters completely by chance.
- Interestingly, if the impactor did indeed fragment and break apart, this may imply that the atmosphere of Noachian Mars was far denser – and harder to penetrate – than it is now. This points towards an early Mars that was far warmer and wetter than the cold, arid world we see today. Observations from numerous missions are supporting this view and returning evidence that water once flowed across the Red Planet in large amounts, revealing features such as old river valley networks and large lake basins thought to have formed in the Noachian period.
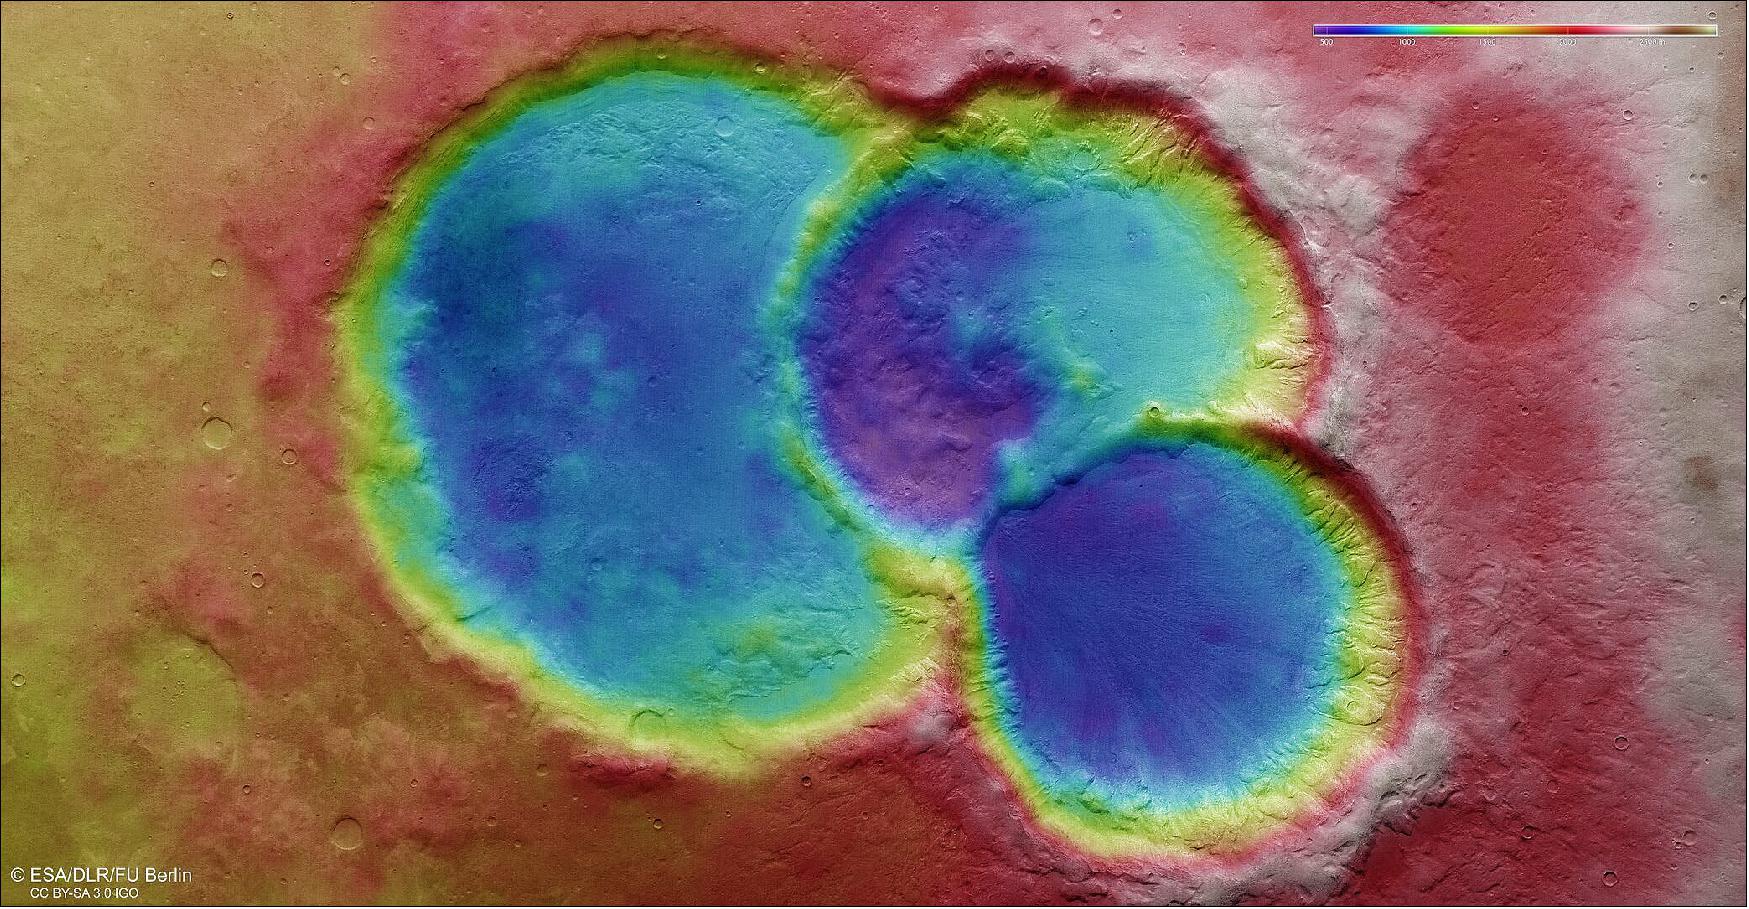
- Like many of the ancient and eroded craters in Mars’ southern highlands, these three craters have flattened rims, shallow floors, and have been filled with sediment in the four billion years since their formation. There is also evidence of ice here – the smallest crater has marks that are typically created as ice and debris creep across a surface, similar to how mixed rock-and-ice glaciers or debris-covered ice glaciers move in alpine regions of Earth.
- This frame may once have contained other craters, as indicated by the round patches of sunken surface to the top right and bottom left. In fact, despite the cratered nature of Noachis Terra, the environment around this triplet is surprisingly smooth for such ancient terrain. Only a handful of small surrounding craters appear to have clear, sharply defined rims and bowls, indicating that they are relatively young and have not yet begun to erode in earnest. Overall, it seems that older craters in this area have ‘melted down’ into the surface – a phenomenon that is, again, due to ice.
- As ice just under the surface of Mars flows and melts over many millions of years, the soil becomes softer. This soft, ice-rich soil subsides more quickly and fills up indentations and depressions more readily, contributing to the smooth appearance of this part of Noachis Terra. This suggests that there must have been a large amount of water present on Mars, at least during the Noachian period, capable of producing a glacier-like flow of abundant ice.
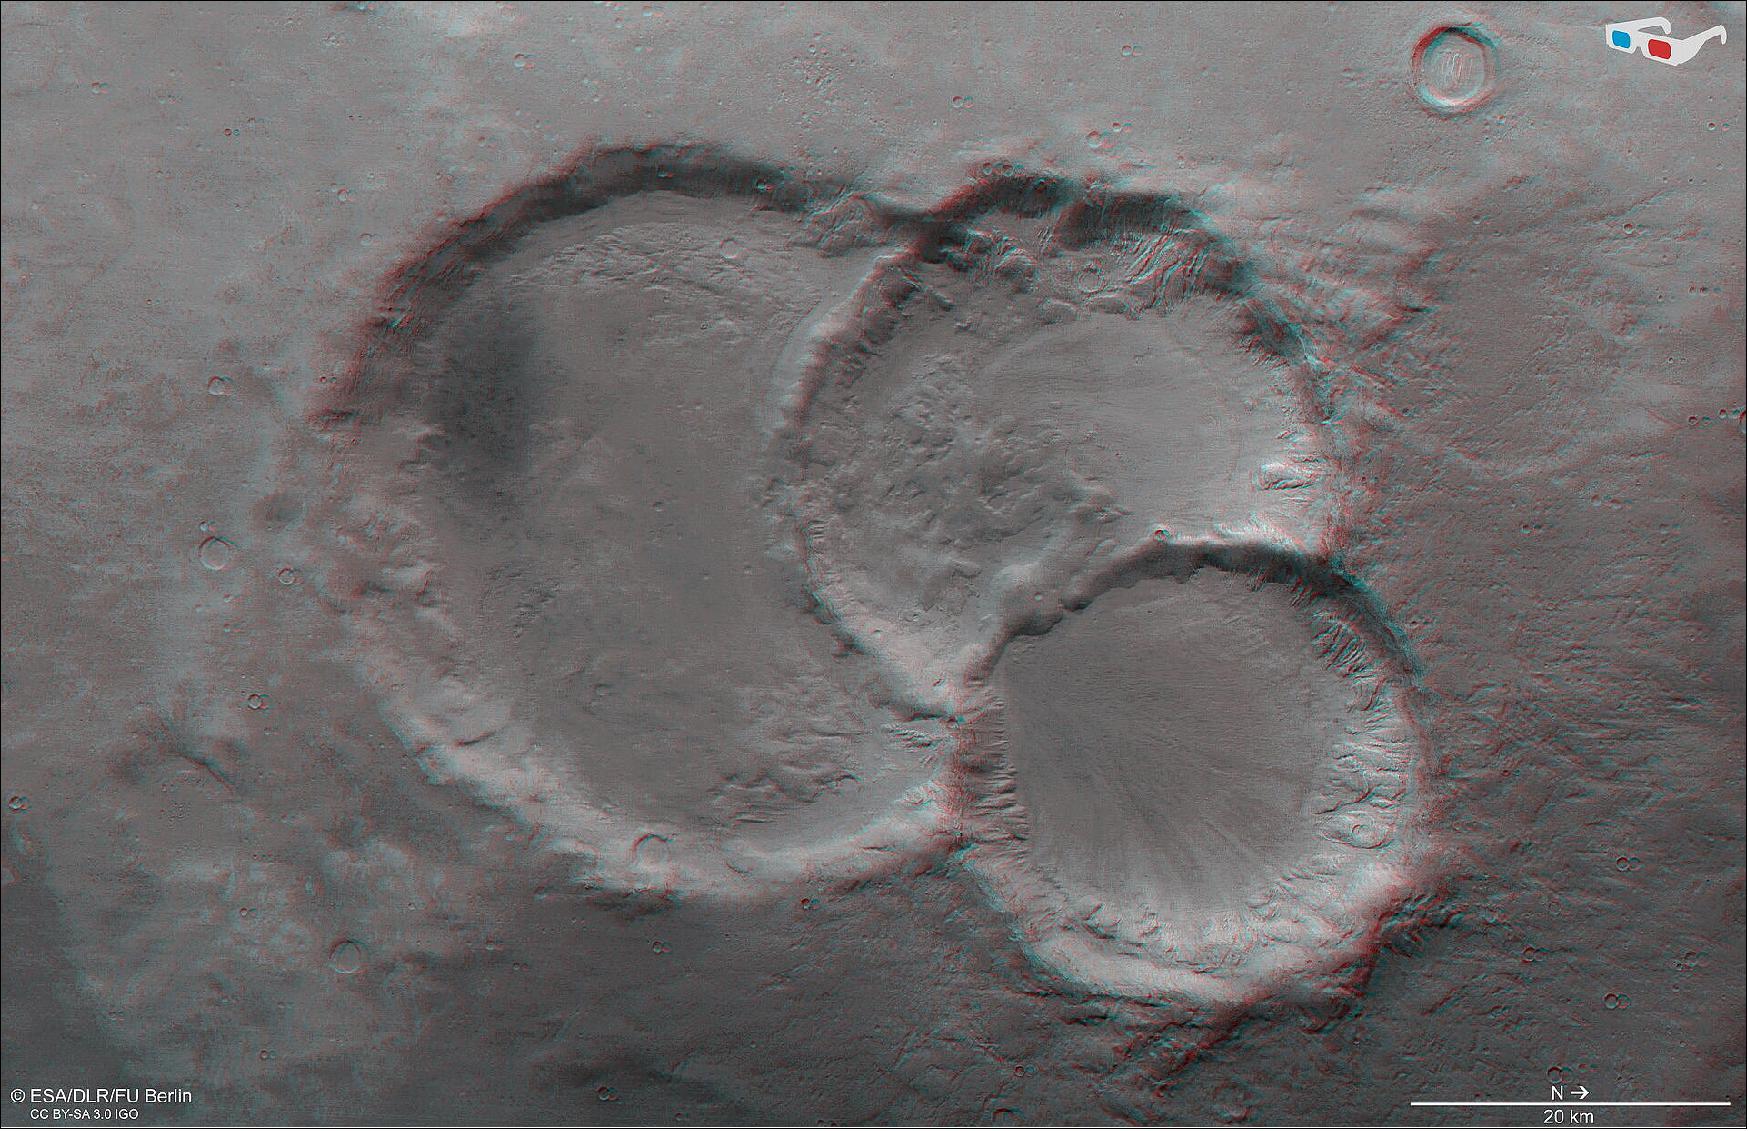
- Understanding the history of Mars, and mapping the features covering the planet’s surface in detail, is a key objective of Mars Express. The spacecraft has been exploring the Red Planet since its launch in 2003, and is gearing up to collaborate with a number of new missions that have joined – or will soon join – the spacecraft at Mars. The ESA-Roscosmos ExoMars Trace Gas Orbiter (TGO) arrived in 2016, and the ExoMars Rosalind Franklin rover and its accompanying surface science platform are scheduled for launch in September 2022.
- Together with Mars Express, these missions will work to fully characterize our neighbor, to help us not only understand more about Mars, but, by comparison, more about the history and nature of our home in the Universe.
• October 16, 2020: Volcanoes, ice caps, dust storms, curious clouds and a double vortex are just some of the delights captured by ESA’s Mars Express ‘webcam’, and now the data behind the images are available in the Planetary Science Archive, the central repository for all scientific data returned by ESA's Solar System missions. 31)
- Originally intended as an engineering instrument to watch the release of the Beagle 2 lander in 2003, the Visual Monitoring Camera (VMC) onboard ESA’s Mars Express was repurposed to observe the Red Planet since 2007, and became a recognized science instrument in 2016. Now the data behind the images are available in the Planetary Science Archives alongside that of the spacecraft’s other seven science instruments.
- The data comes from observations taken of the Red Planet between 2007 to mid-2020, as well as of the release of the Beagle 2 lander in 2003, calibrated for scientific use and available in different formats.
- Data from the VMC has already been instrumental for a number of scientific studies and publications. Previously, VMC images were only available via a Flickr page, but today’s release is the first ‘science data’ release for the instrument, and is the culmination of several years of hard work by the VMC team.
- Stunning views of the Red Planet will continue to be provided to the general public through Flickr in near real-time – usually within a few days of when the images were taken at Mars.
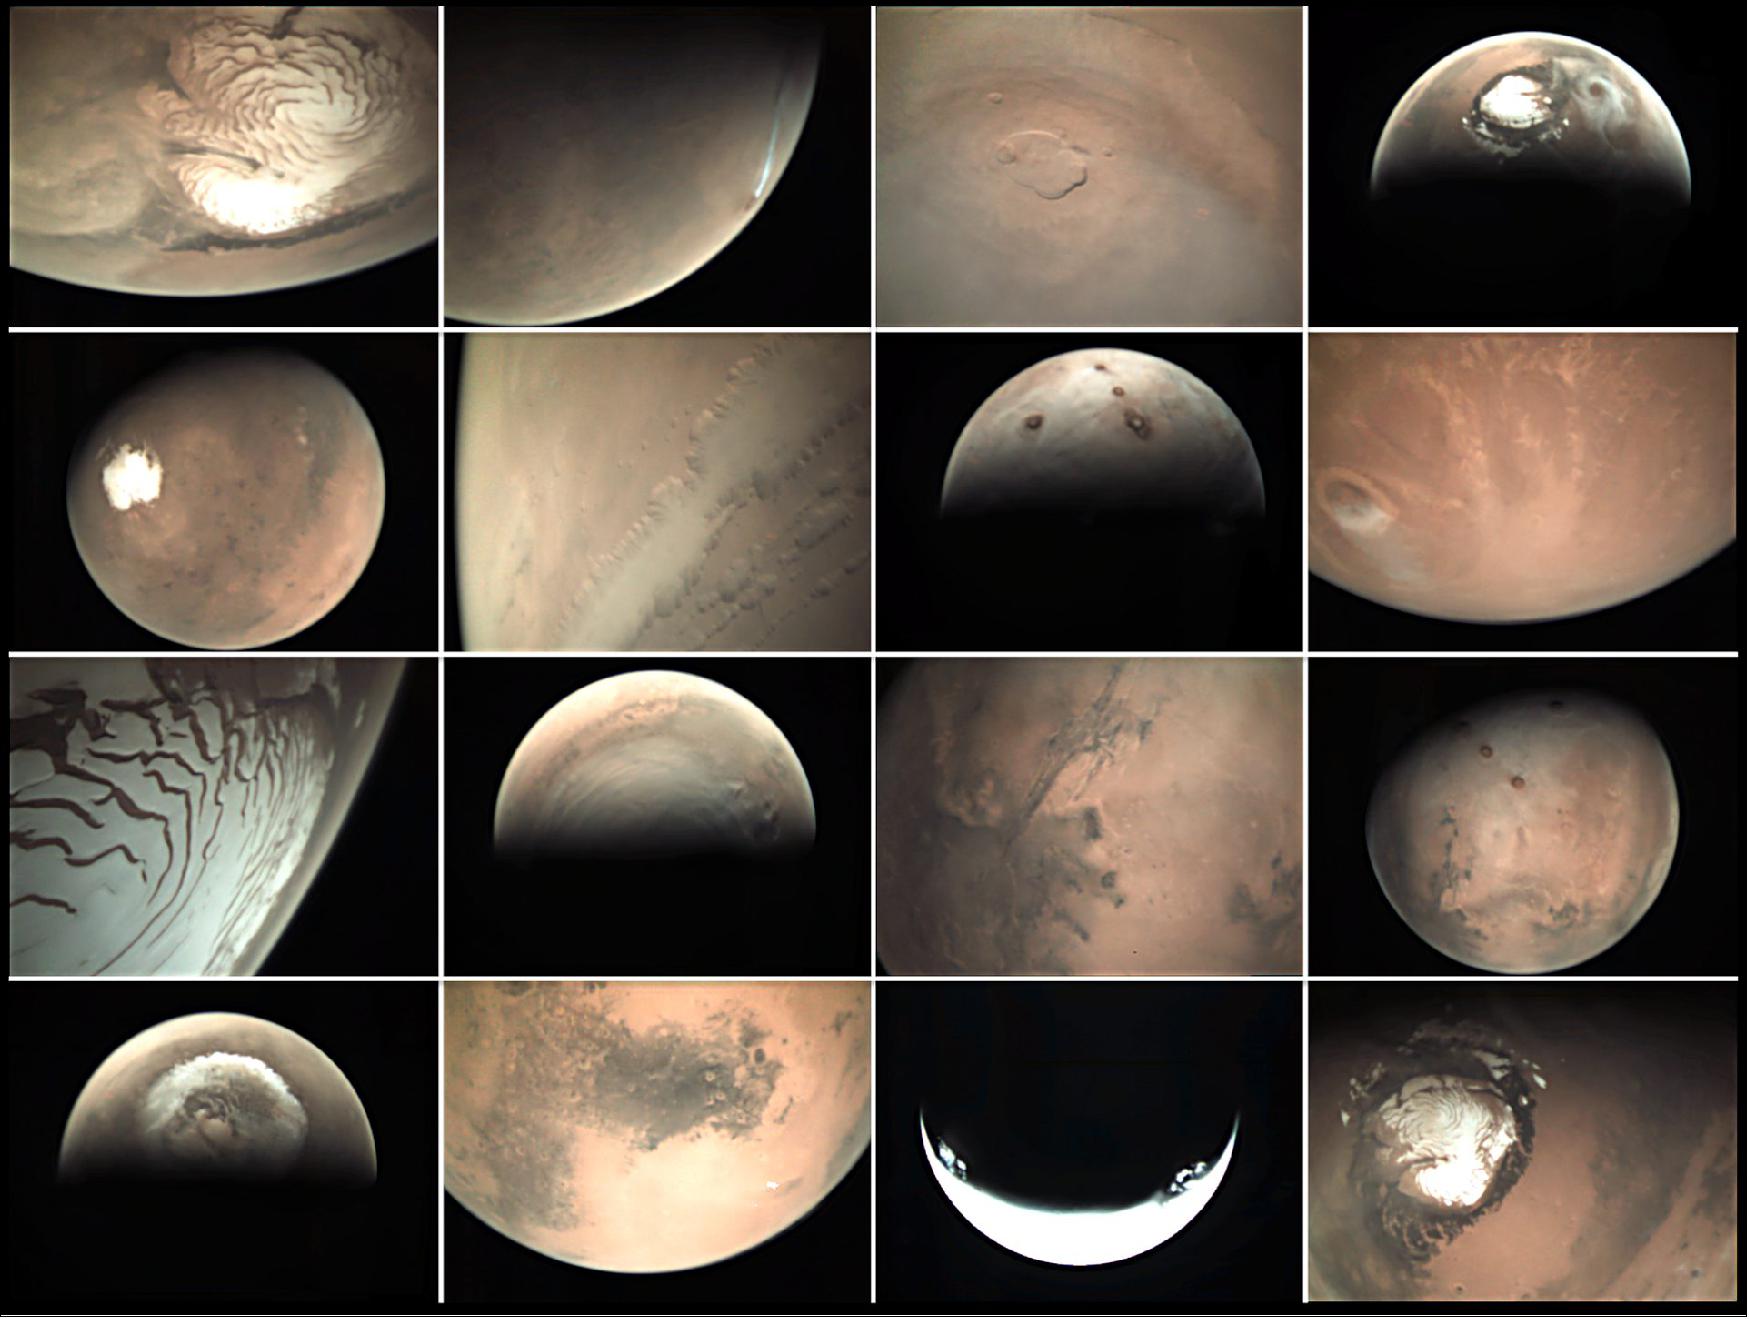
• September 29, 2020: NASA's 2020 Mars mission has been en route to the Red Planet for two months now. The Perseverance rover on board the spacecraft is set to land in Jezero crater on 18 February 2021. There, the rover, which weighs almost one tonne, will search for signs of past microbial life. Jezero crater was chosen for good scientific reasons. Within the crater lie two ancient river deltas in which many hydrated minerals have been discovered – proof that liquid water existed there for a very long period of time. Precise maps showing the geographical conditions are essential both for the selection of the landing site and for planning exploration on the ground. A topographical map has now been created using numerous stereo images acquired by the HRSC camera operated by the DLR (German Aerospace Center) board ESA’s Mars Express spacecraft. This is the most accurate surface model of the entire crater to date. 32)
Water – the Most Important Prerequisite for Life
- Jezero crater was formed during the Noachian era, approximately 3.9 billion years ago. The landing site planned for the Perseverance rover is marked with an ellipse labelled 'Mars 2020 LS'. Jezero was once home to a lake and two deltas that were fed with water by tributaries from the large catchment areas in the region. The larger and more clearly defined delta is marked on the map with a dashed ellipse. Its two former tributary valleys (Neretva Vallis and Sava Vallis) can be seen on the western and north-western edges of the crater. An outflow valley (Pliva Vallis) breaks through the crater rim to the east.
- The floor of Jezero crater has an elevation of 2700 meters below the notional 'sea level' on Mars. Strictly speaking, this reference level, which is used on the map shown here, is a surface of equal gravitational attraction, referred to as an areoid. The lake in Jezero crater is thought to have been at least 250 meters deep, a figure derived from the altitude measurements for the crater rim, the crater floor, the river valley profile and the upper edges of the deltas. However, it is no longer possible to make precise estimates today, as the deltas have been severely eroded since water activity ceased approximately 3.8 billion years ago. In addition, the crater was filled with very extensive lava flows from the nearby Syrtis Major region about 300 million years later.
- The topographical map clearly shows how the northern part of the crater floor is sloping and this results in a less clearly defined crater rim when compared to the flat, southern part of the crater floor and the steeper southern flanks. This is due to the erosion of material in the catchment areas to the north of the crater, which was then transported into the crater itself and deposited as sediments in the delta. The erosion of the northern crater rim by the three river valleys that break through it also contributed to the creation of Jezero's asymmetrical topography.
- Clay minerals, particularly carbonates, which have been discovered in comparatively large quantities in the western delta, are significant as potential repositories of biosignatures – that is, traces of microbial life. The early presence of liquid water and the enormous carbonate deposits here make Jezero a perfect destination for the search for possible past life on Mars.
From Image Data to a Mosaic and Topographic Map
- The map shown here was generated using an image mosaic assembled from individual images acquired by the High Resolution Stereo Camera (HRSC) on board ESA’s mission Mars Express orbiter. The color mosaic on which the map is based was derived from two image strips acquired during orbits 5252 and 5270. It covers an area located at approximately 18 degrees north and 77 degrees east. The color-coded topographical map is based on a Digital Terrain Model (DTM) of the region, from which the topography of the landscape can be derived. The reference for the HRSC-DTM is an equipotential surface of Mars (areoid). The HRSC camera on board Mars Express is operated by the German Aerospace Center (DLR). Systematic processing of the camera data was carried out at the DLR Institute of Planetary Research in Berlin-Adlershof. Personnel at the Department of Planetary Sciences and Remote Sensing at Freie Universität Berlin used these data to create the image products shown here.
The HRSC Experiment on Mars Express
- The High Resolution Stereo Camera (HRSC) was developed by the German Aerospace Center (Deutsches Zentrum für Luft- und Raumfahrt; DLR) and built in collaboration with partners in industry (EADS Astrium, Lewicki Microelectronic GmbH and Jena-Optronik GmbH). The science team, which is headed by Principal Investigator (PI) Ralf Jaumann, consists of 50 co-investigators from 35 institutions in 11 countries. The camera is operated by the DLR Institute of Planetary Research in Berlin-Adlershof.
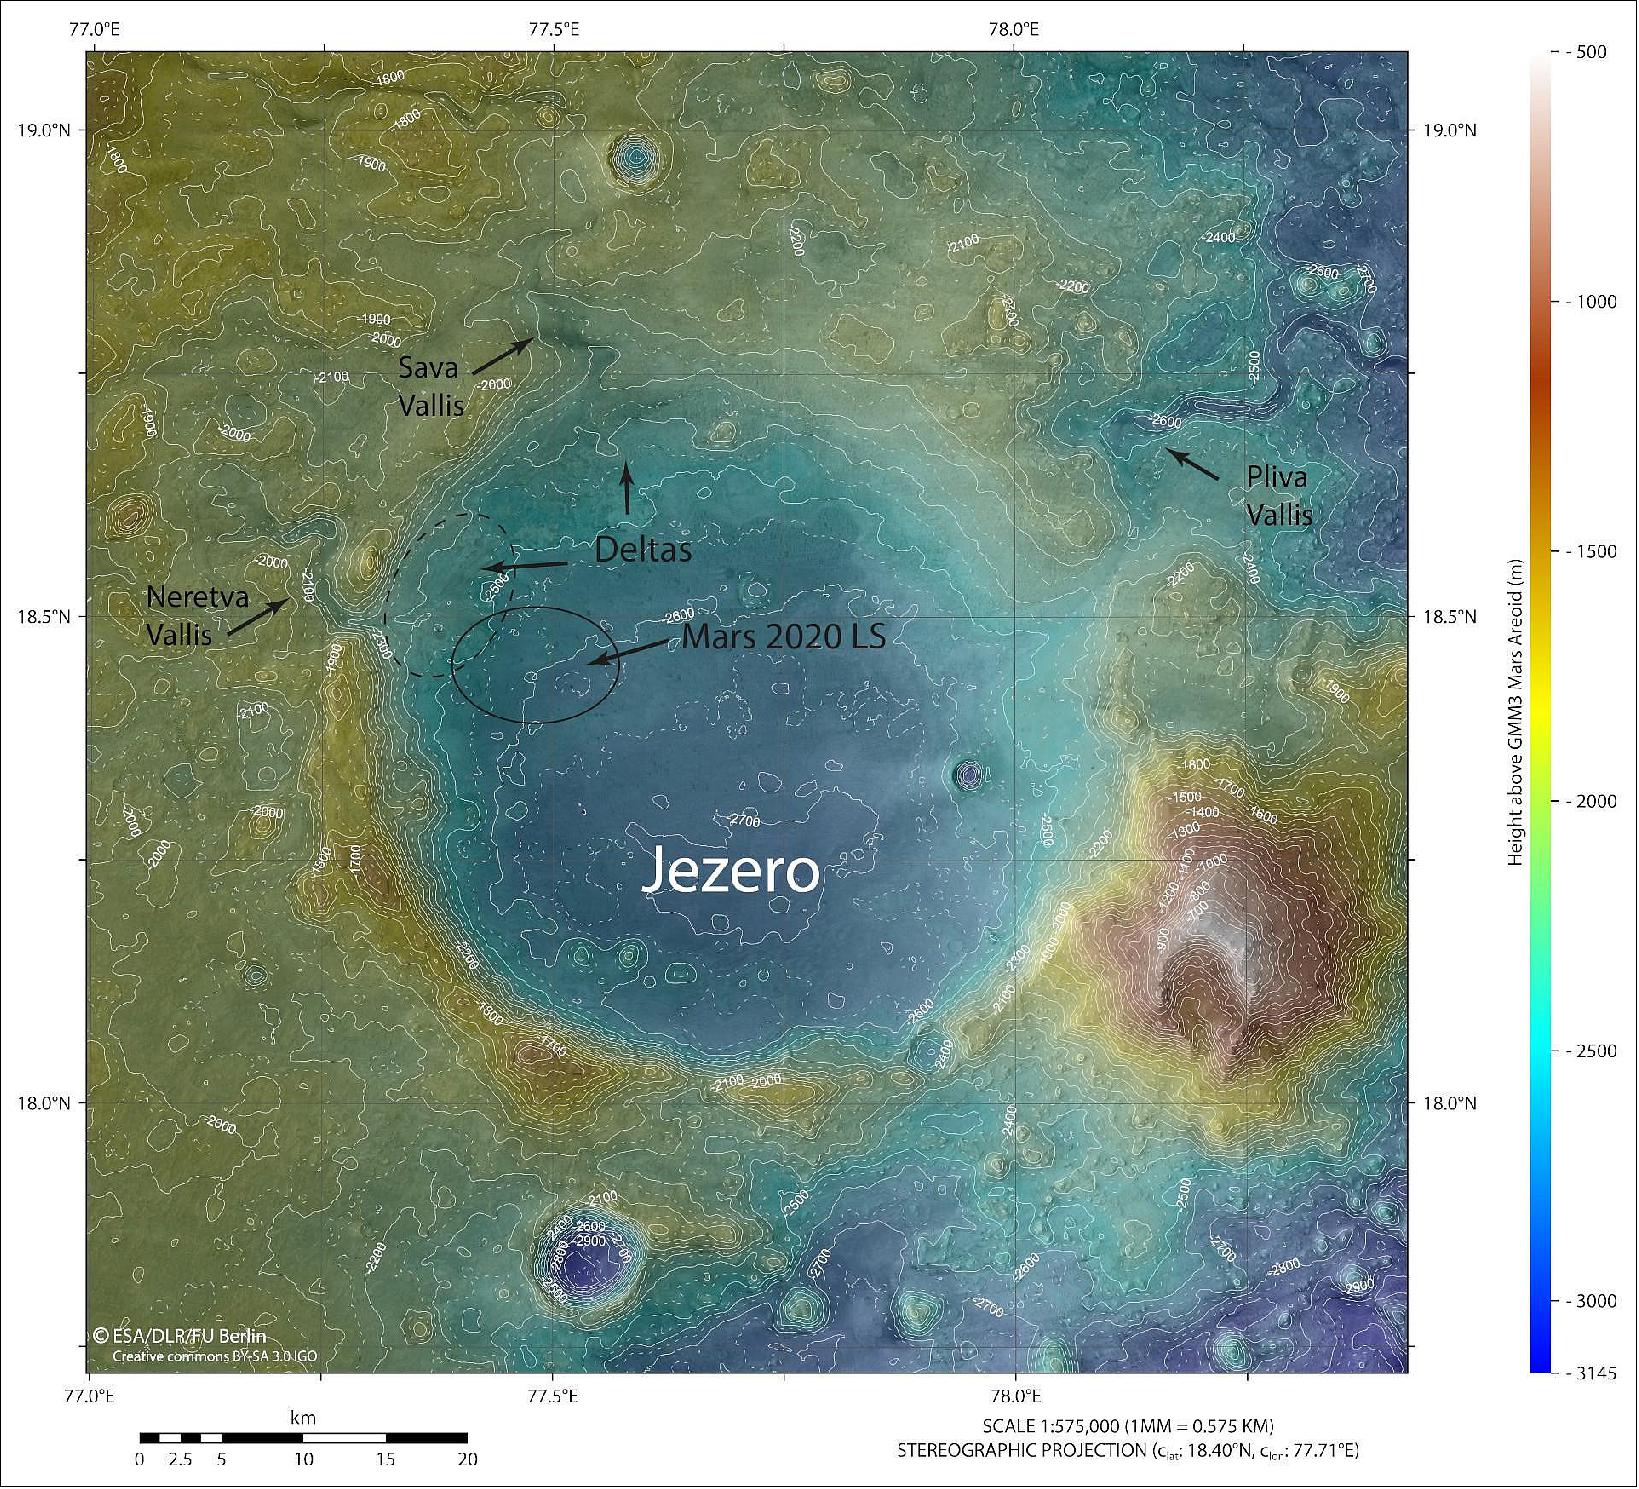
• September 28, 2020: ESA’s Mars Express spacecraft has discovered several ponds of liquid water buried under the ice in the south polar region of Mars. The spacecraft’s radar instrument, MARSIS (Mars Advanced Radar for Subsurface and Ionosphere Sounding), revealed one underground reservoir in 2018, buried about 1.5 km below the ice. Now, taking into account more data and analyzing it in a different way, three new ponds have been discovered. The largest underground lake measures about 20 x 30 km, and is surrounded by several smaller ponds. The water is thought to be very salty in order for it to remain liquid at cold temperatures. 33)
- Subglacial lakes are also known on Earth, like Lake Vostok in Antarctica. They may harbor unique ecosystems, providing useful analogies for astrobiologists exploring how life can survive in extreme environments. The techniques used to analyze the radar data on Mars are similar to those used in investigations of subglacial lakes in Antarctica, Canada and Greenland.
• September 3, 2020: A true-color image of the Nereidum Mountain Range in the southern hemisphere of Mars captured by the High Resolution Stereo Camera (HRSC) aboard ESA's Mars Express orbiter in 2015. The recently reprocessed image reveals evidence of a variety of geological processes that have shaped the area north of the large Argyre impact basin over billions of years. 34)
- Branch-like structures of valleys were carved into the slopes either by the melting snow and ice or runoff from rain in the early period of Mars’ evolution when the planet had abundant water resources.
- Inside the craters in the image, one can see deposits, in some cases concentric, probably created by the sublimation of ice that used to cover the region in the past. Scientists believe water ice might still be present in the region deep under the surface.
- Mass wasting deposits clearly visible in the canyons captured in this image are also a result of glacial processes that had taken place in the area in the past.
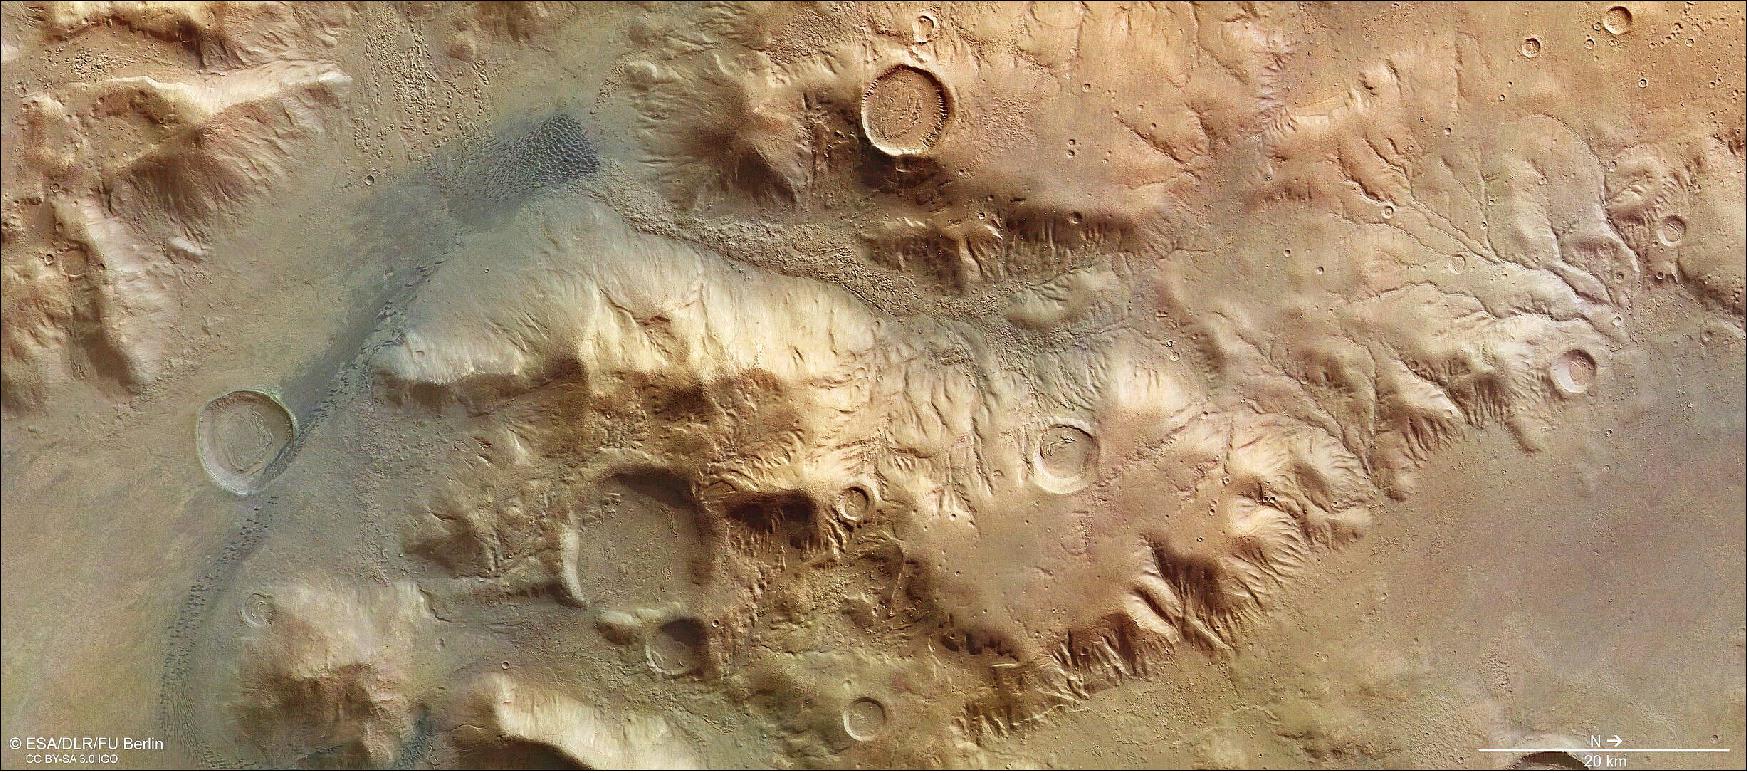
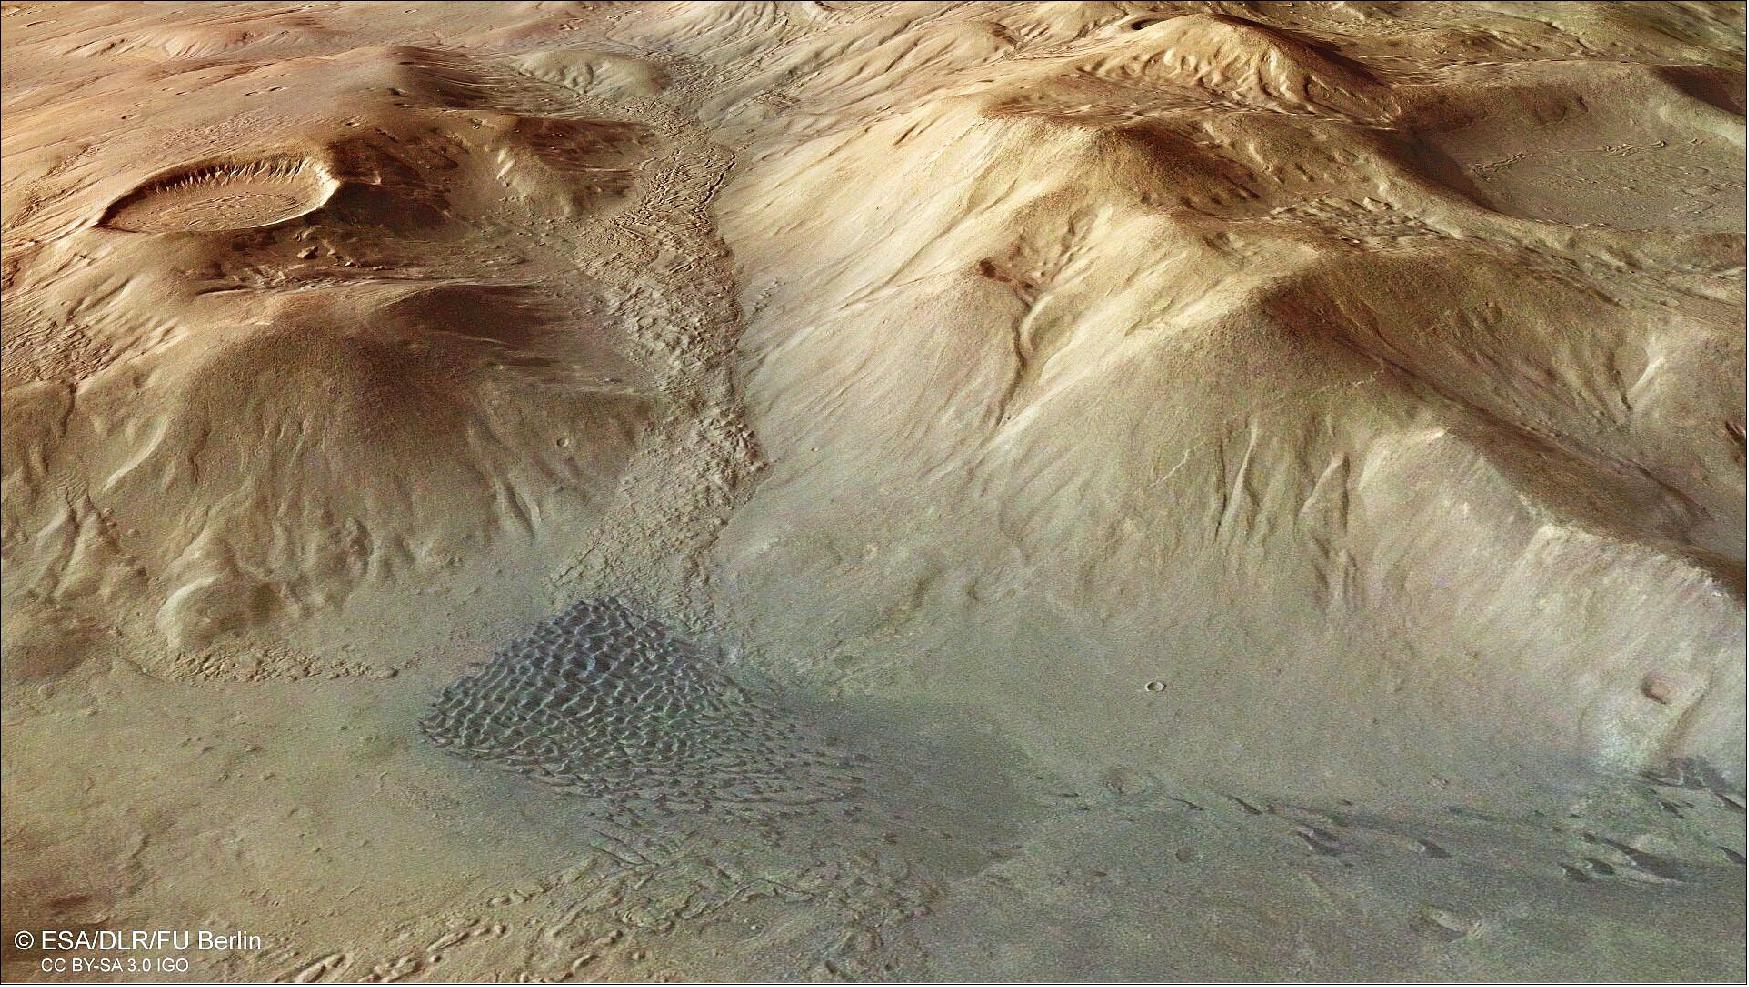
• July 29, 2020: Flight over the Mars Jezero Crater, the landing site of NASA's Mars 2020 Perseverance rover, based on data of the HRSC on ESA's Mars Express mission. 35) 36)
- Scheduled for launch from Cape Canaveral, Florida on 30 July 2020 on board an Atlas V rocket, the Perseverance rover will land on 18 February 2021 in Jezero crater.
- An impact crater with a diameter of about 45 km, Jezero is located at the rim of the giant Isidis impact basin. Morphological evidence suggests that the crater once hosted a lake, some 3.5 billion years ago.
- Jezero possesses an inlet- and an outlet channel. The inlet channel discharges into a fan-delta deposit, containing water-rich minerals such as smectite clays. Scientists believe that the lake was relatively long lived because the delta may have required 1 to 10 million years to reach its thickness and size. Other studies conclude that the lake did not experience periods of important water-level fluctuations and that it was formed by a continuous surface runoff. This makes Jezero crater to a prime target for the search for potential signs of microbial life, because organic molecules are very well preserved in river deltas and lake sediments.
- A recent study of the ancient lakeshores, diverse minerals and violent volcanism of Jezero crater based on data from ESA’s Mars Express mission is available here: Mars Express helps uncover the secrets of Perseverance landing site.
• July 29, 2020: A mysteriously long, thin cloud has again appeared over the 20-km high Arsia Mons volcano on Mars. 37)
- A recurrent feature, the cloud is made up of water ice, but despite appearances it is not a plume linked to volcanic activity. Instead, the curious stream forms as airflow is influenced by the volcano’s ‘leeward’ slope − the side that does not face the wind.
- “We have been investigating this intriguing phenomenon and were expecting to see such a cloud form around now,” explains Jorge Hernandez-Bernal, PhD candidate at the University of the Basque Country (Spain) and lead author of the ongoing study.
- “This elongated cloud forms every martian year during this season around the southern solstice, and repeats for 80 days or even more, following a rapid daily cycle. However, we don’t know yet if the clouds are always quite this impressive”.
- A martian day, or sol, is slightly longer than an Earth day at 24 hours, 39 minutes and 35 seconds long. A year at the Red Planet consists of 668 sols, approximately 687 days, so the seasons last for twice as long.
- The southern solstice is the period of the year when the Sun is in the southernmost position in the martian skies, just like 21 December on Earth. In the early mornings during this period, this fleeting cloud grows for approximately three hours, quickly disappearing again just a few hours later.
- Most spacecraft in orbit around the Red Planet tend to observe in the afternoon, however Mars Express is in a privileged position to gather and provide crucial information on this unique effect.
- “The extent of this huge cloud can't be seen if your camera only has a narrow field of view, or if you're only observing in the afternoon,” says Eleni Ravanis, a Young Graduate Trainee for the Mars Express mission who works specifically for the VMC instrument.
- “Luckily for Mars Express, the highly elliptical orbit of the spacecraft, coupled with the wide field of view of the VMC instrument, lets us take pictures covering a wide area of the planet in the early morning. That means we can catch it!”
- The Mars Express science team have now named the cloud the Arsia Mons Elongated Cloud, AMEC. So, for how long has it been disappearing and reappearing? Why does it only form in the early morning? Stay tuned as scientists continue to investigate, and we reveal more mysteries from Mars.
• July 2, 2020: This movie, based on images taken by ESA’s Mars Express, showcases the 82 km wide Korolev crater on Mars. 38)
- Located in the northern lowlands of the Red Planet, south of the large Olympia Undae dune field that partly surrounds Mars’ north polar cap, this well-preserved impact crater is filled with water ice all year round. The crater’s floor lies two kilometers below its rim, enclosing a 1.8 km thick domed deposit that represents a large reservoir of non-polar ice on Mars.
- Water ice is permanently stable within Korolev crater because the deepest part of this depression acts as a natural cold trap. The air above the ice cools and is thus heavier compared to the surrounding air: since air is a poor conductor of heat, the water ice mound is effectively shielded from heating and sublimation.
- The crater is named after chief rocket engineer and spacecraft designer Sergei Pavlovich Korolev (1907-1966), dubbed the father of Russian space technology. Korolev developed the first Russian intercontinental rocket R7, the precursor of the modern Soyuz rockets that are still operated today. With his rocket and spacecraft design, he was also responsible for the first human-made satellite (Sputnik in 1957) and for the first human spaceflight (Yuri Gagarin in 1961).
• July 1, 2020: An elevation map of Jezero Crater on Mars, the landing site for NASA's 2020 Mars Perseverance rover. Lighter colors represent higher elevation. 39)
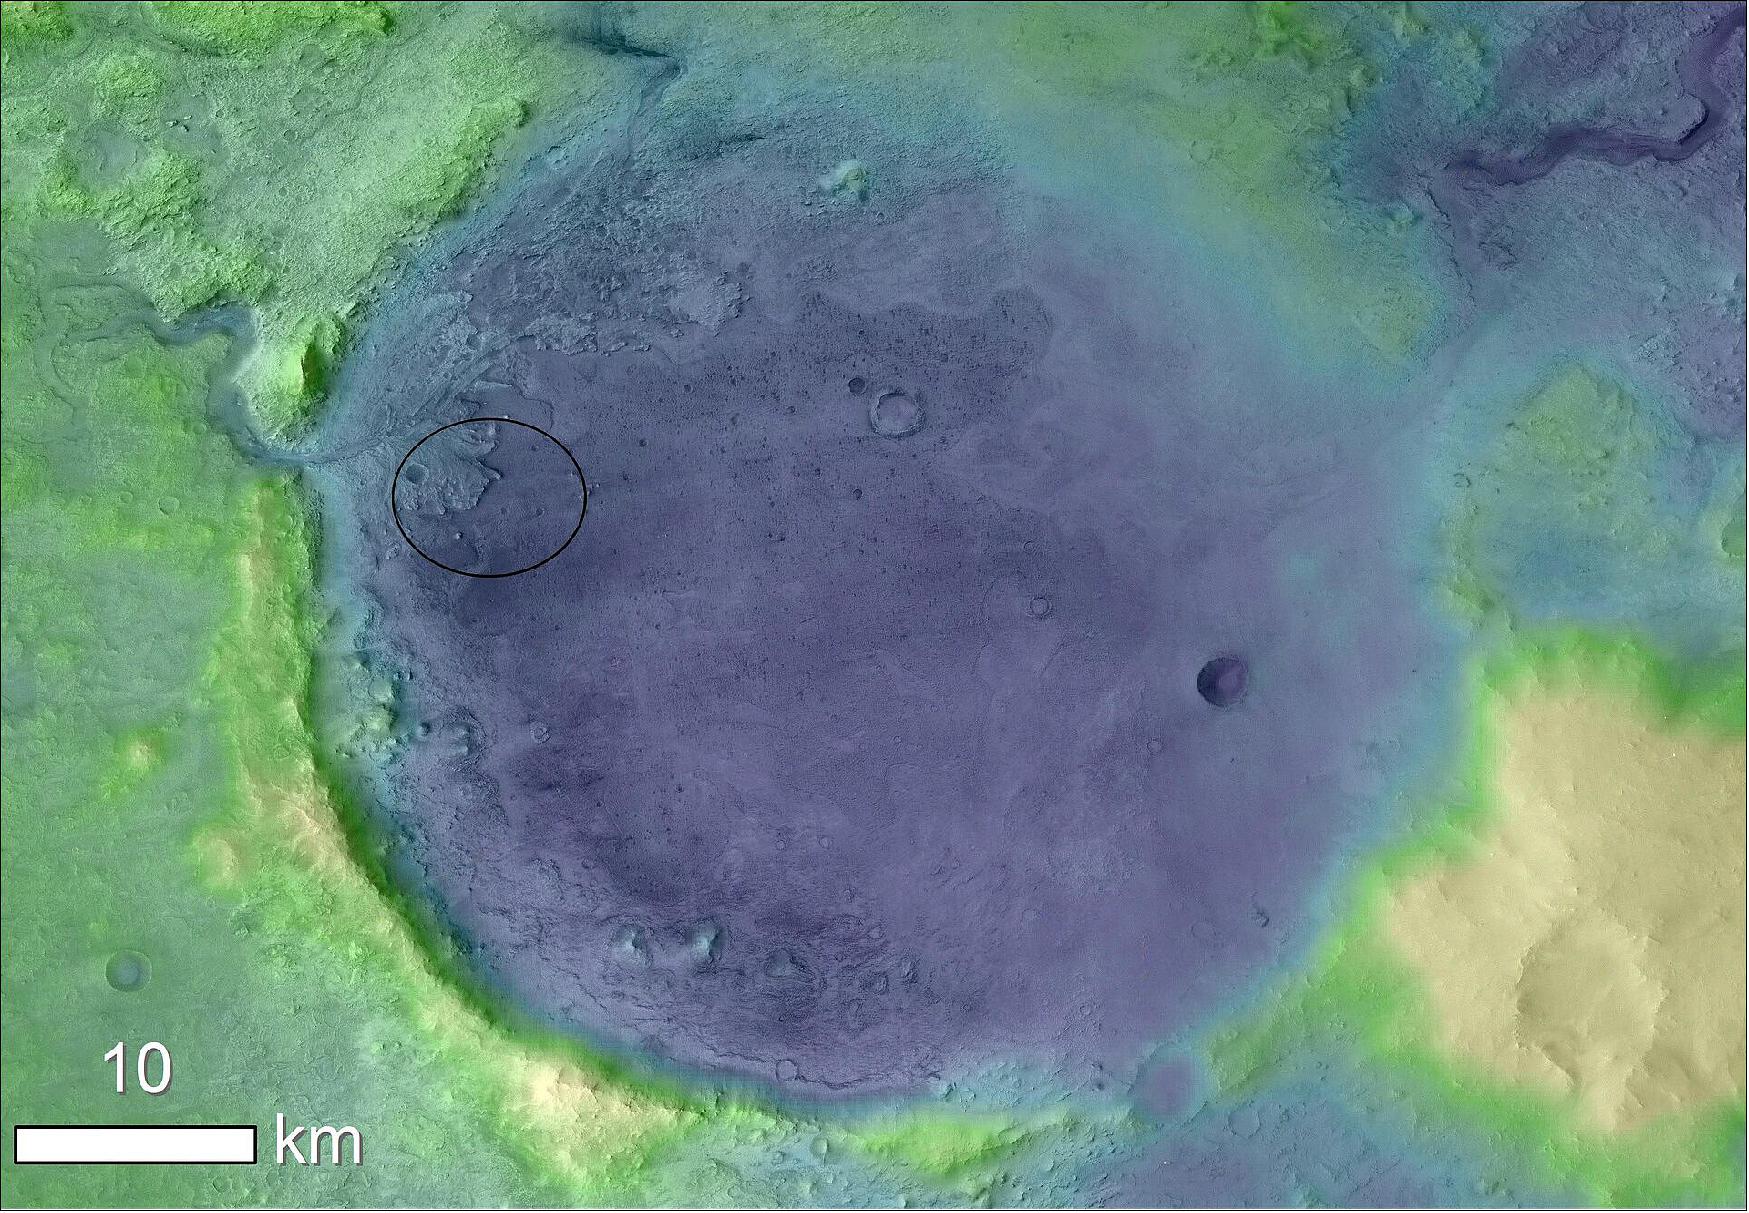
- Two recent studies based on ESA's Mars Express observations of Jezero crater have shed light on how and when this intriguing area formed – and identified the regions most likely to reveal signs of ancient life.
- Full story: Mars Express helps uncover the secrets of Perseverance landing site.
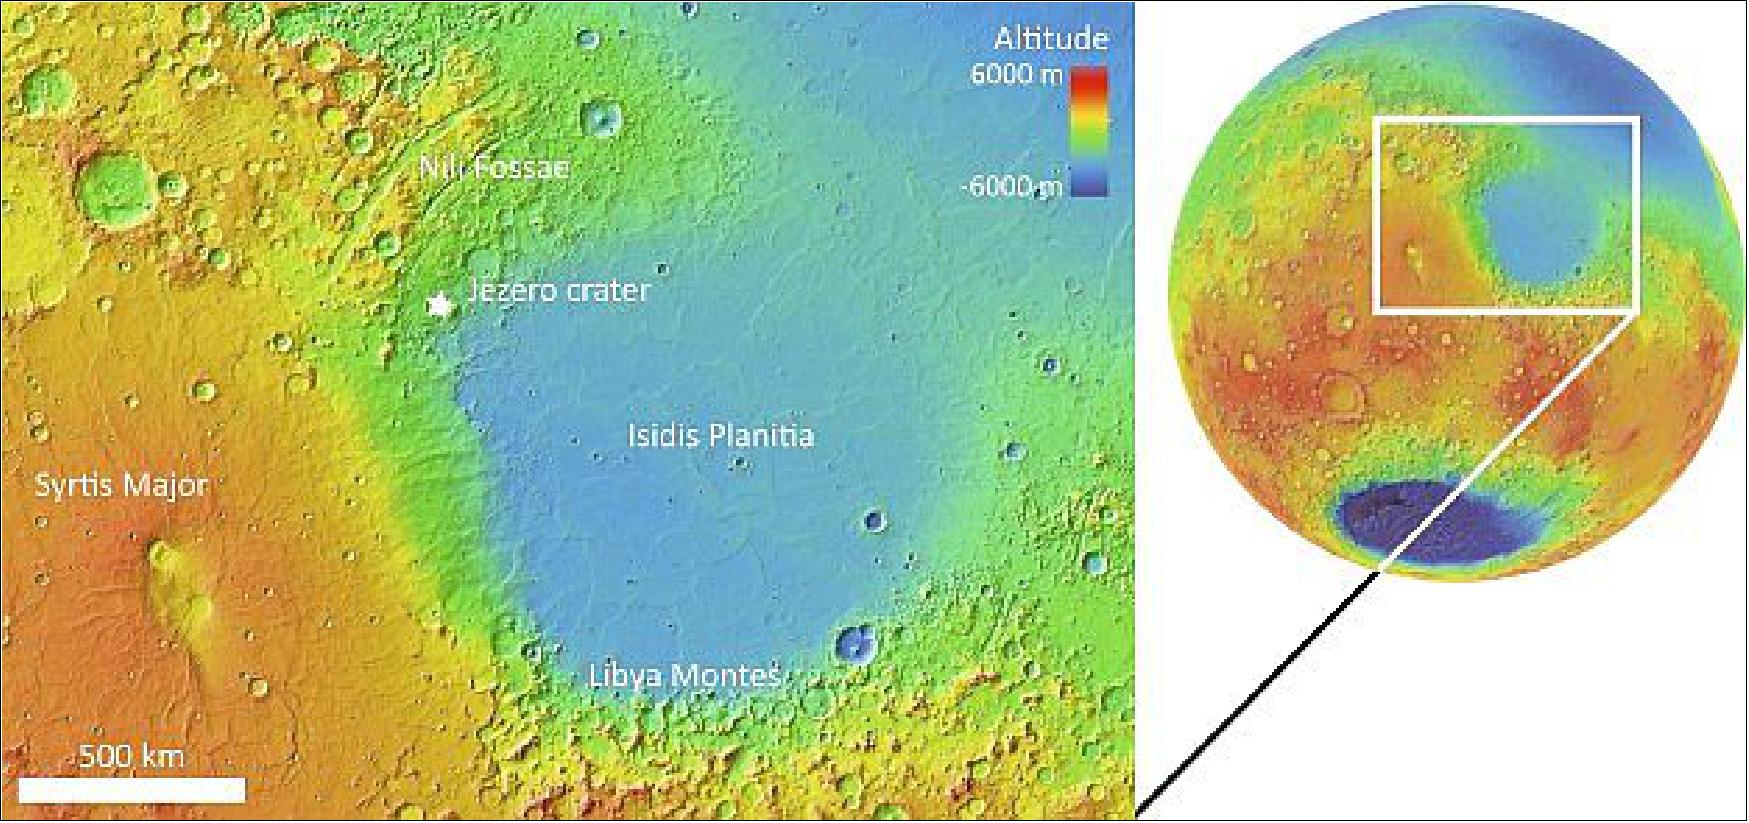
- NASA's Mars 2020 Perseverance rover will search for signs of past life on Mars and collect samples for a future flight to Earth. NASA and ESA are currently working together on mission concepts to bring these samples to Earth by 2031.
- Two studies based on data from another space mission – ESA's Mars Express, orbiting the Red Planet since 2003 – now identify which parts of the rover's landing site are most likely to have preserved ancient signs of life, climate, water, and volcanism. Both studied a part of Mars' surface known as Nili Fossae and, more specifically, a crater within this area named Jezero crater.
- The Jezero crater contains a delta, clear evidence that water once flowed there in the form of an ancient lake, and holds large quantities of both olivine and carbonate minerals. Carbonates form in the presence of water and are known to trap biosignatures, the signatures of life, whereas olivine is present in magmatic rocks and can be used to explore and precisely date Mars' volcanic past.
- "We've known for decades now that Nili Fossae is quite a unique part of Mars, and Jezero crater was chosen as a landing site for the Perseverance rover given this uniqueness," says Lucia Mandon of the Laboratoire de Géologie de Lyon (Terre, Planètes, Environnement), France, and lead author of a study into the mineralogy, age, and evolution of the Nili Fossae region.
- "However, while this part of Mars has been well-studied, scientists were still unsure about how and when it formed, or how it came to contain all of this olivine- and carbonate-rich material. In fact, at least six different formation scenarios have been proposed in the last couple of decades."
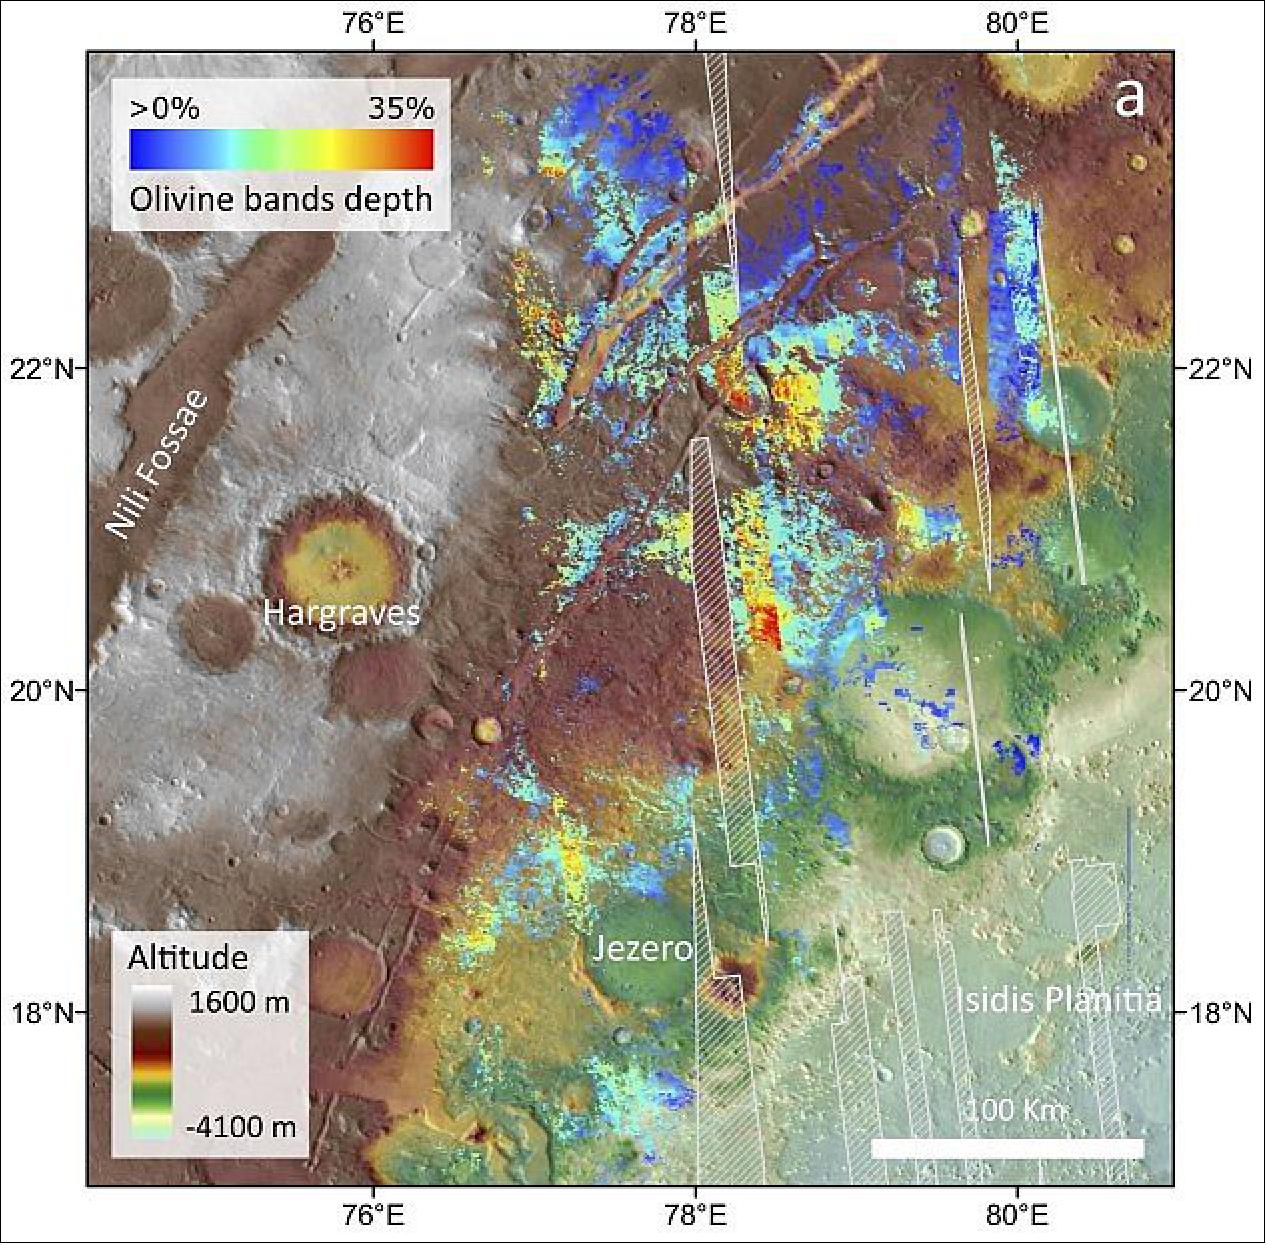
- To resolve this uncertainty, Lucia and colleagues analyzed observations of the Nili Fossae region gathered by ESA's Mars Express and NASA's Mars Reconnaissance Orbiter (MRO): a mix of high-resolution images, topographic data, mineralogical data, and thermal data. They found that the olivine-rich bedrock in the region around Jezero crater extends for at least 18,000 km2, and formed around 3.8 billion years ago.
- "One of the most popular formation theories suggests that the olivine-bearing material formed as a sheet of melted rock, created by the giant impact that produced the huge nearby Isidis basin," adds Lucia, "but our timeline reveals that the olivine-rich bedrock formed tens of millions of years or more after this impact."
- "However, we think that this impact made the crust fragile and more prone to volcanism. After reviewing all plausible scenarios, we found that the Nili Fossae region was most likely sculpted by massive eruptions of ash and other material thrown out from giant volcanoes. The erupted volume is colossal: more than 1000 times larger than that of the Vesuvian event that destroyed Pompeii in 79 AD."
- This suggests that the common view of Martian volcanism, in which volcanic activity broadly occurs via lava flows with only a few instances of explosive activity, may not be wholly accurate.
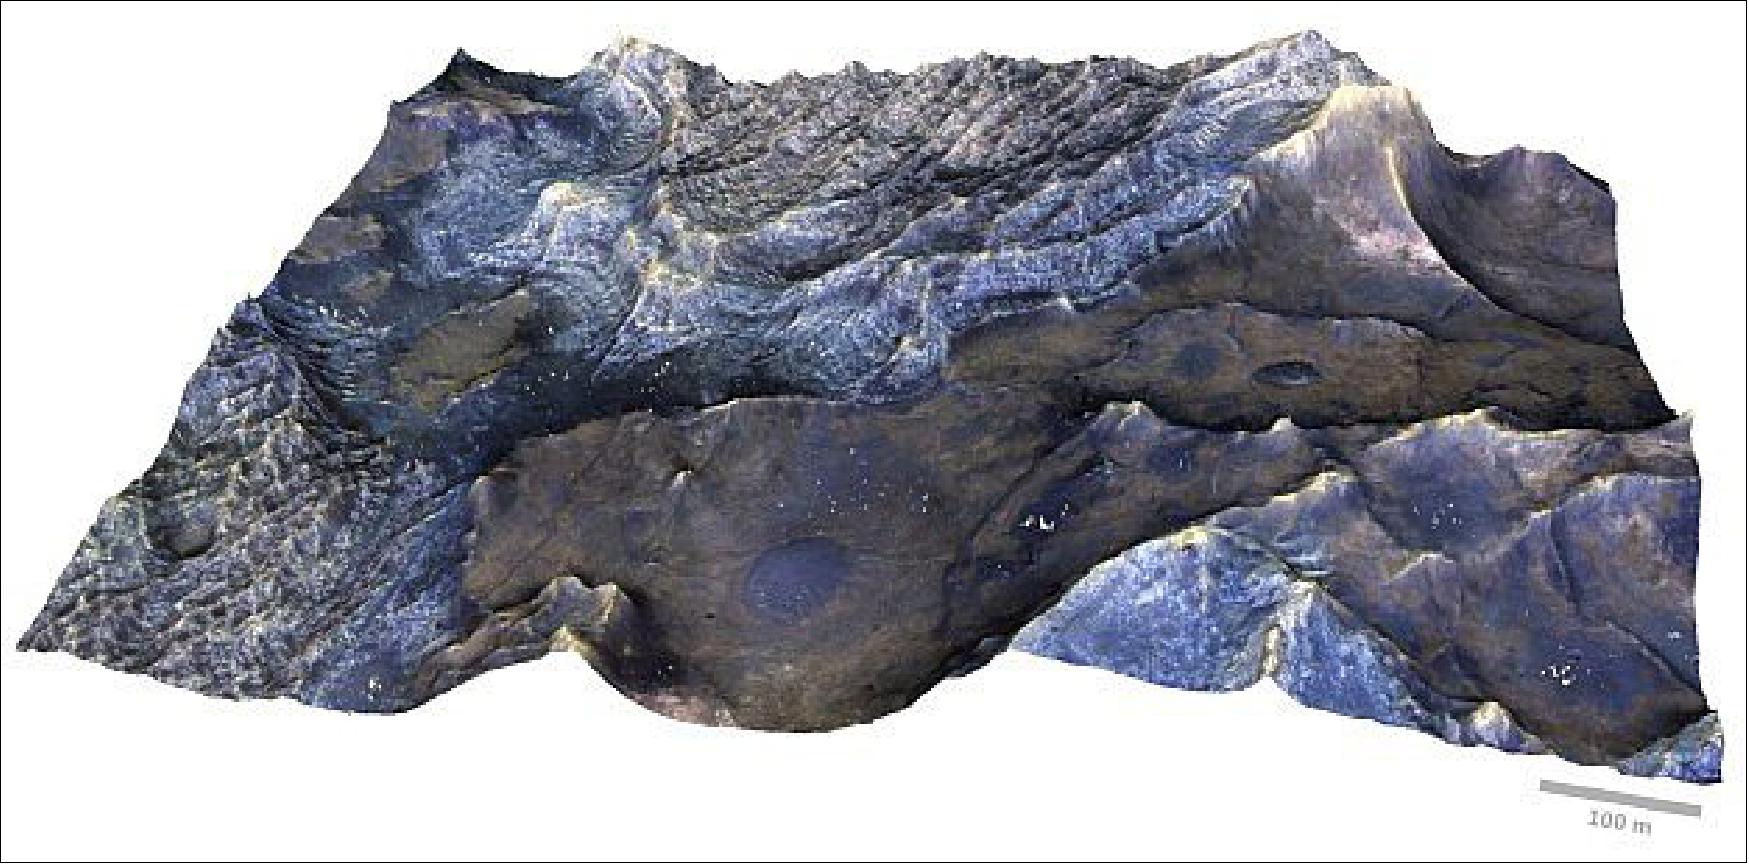
• May 18, 2020: Lava mud flows on Mars. Scientists have long suspected that the 'fire-breathing' volcanoes that spread large quantities of flowing lava over Mars were not the only kind. The numerous mountain cones in the northern hemisphere of the Red Planet may be the result of mud volcanoes. However, until now, researchers have lacked knowledge about the behavior of water-rich mud on the surface of Mars. An unusual laboratory experiment involving the German Aerospace Center (Deutsches Zentrum für Luft- und Raumfahrt; DLR) has now been able to show how mud flows at very low temperatures and under reduced atmospheric pressure. It behaves in a similar way to very specific lava flows on Earth. The results, which have now been published in the journal Nature Geoscience, add important details to the existing knowledge of Mars and its history, which has been shaped by volcanic activity. 40) 41)
- "We have long been aware that in the early history of Mars, several billion years ago, large amounts of water were released over a short period of time, eroding very large valleys in the landscape, which have long since dried up," explains Ernst Hauber of the DLR Institute of Planetary Research in Berlin-Adlershof, who was involved in the study. "Extensively eroded masses of fragmented rock were transported through these outflow channels and into the northern lowlands of the planet, where they were quickly deposited. Later, these rocky masses were covered by younger sediments and volcanic rocks." Some Mars researchers had previously suspected that these underground, water-rich sediments could have become liquefied under certain circumstances and been pushed back up to the surface under pressure. In reference to the similar rise of magma, this process, which is well documented in many sedimentary basins on Earth, is referred to as sedimentary volcanism or mud volcanism.
a) Laboratory experiments show that at very low temperatures and under very low atmospheric pressure, mud behaves similar to flowing lava on Earth.
b) Results suggest that tens of thousands of conical hills on Mars, often with a small crater at their summit, could be the result of mud volcanism.
c) Focus: Space, exploration.
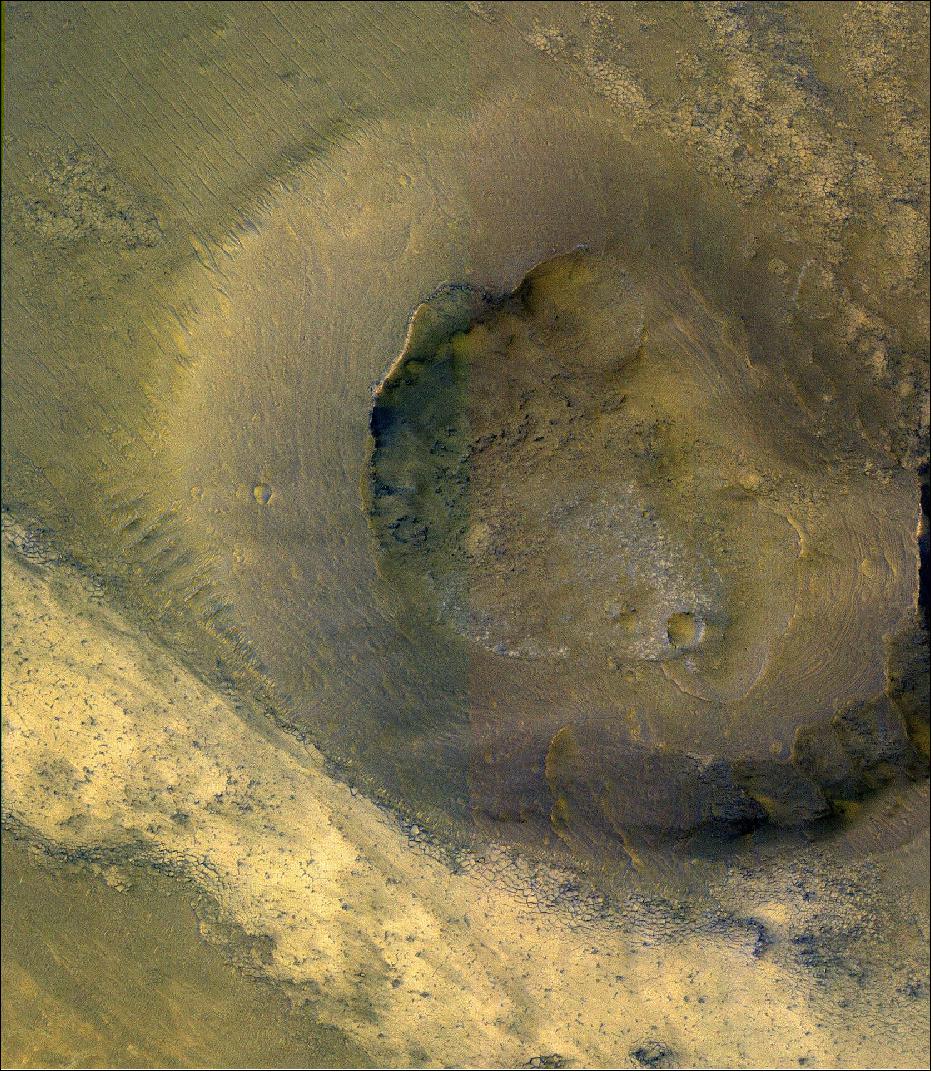
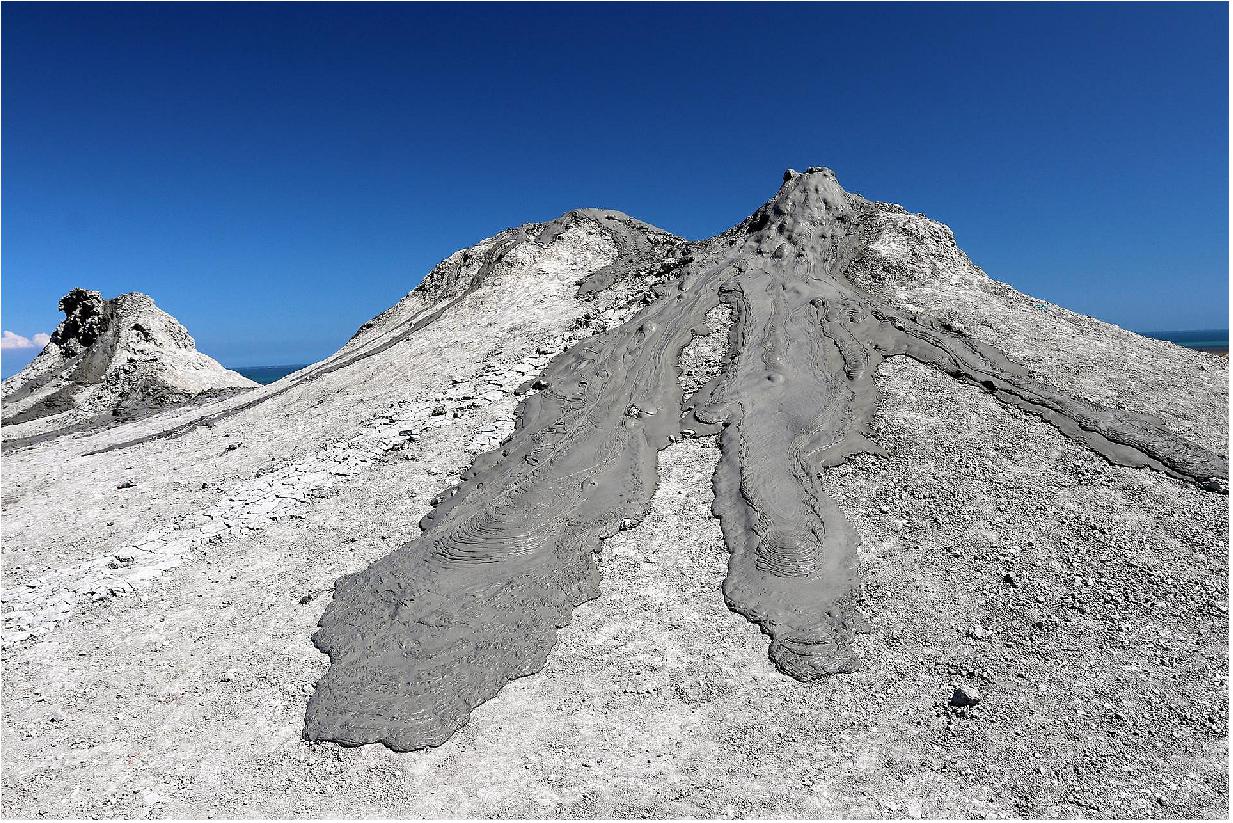
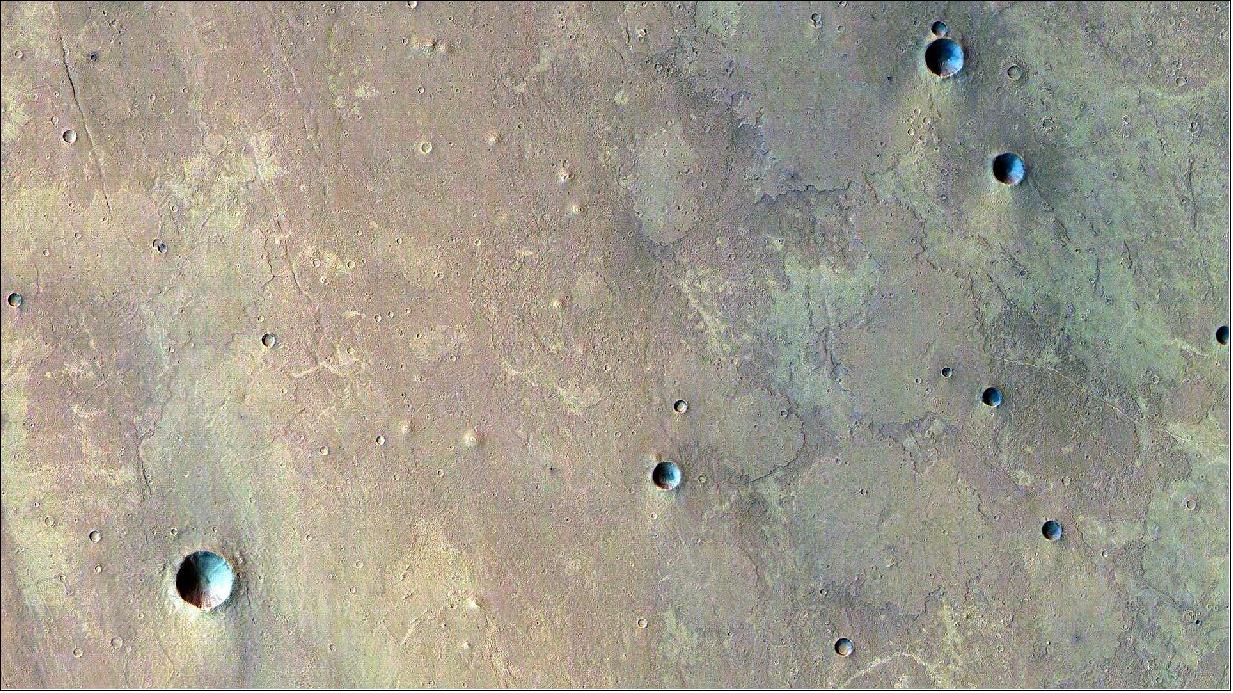
Are Small Volcanic Cones the Result of Mud Extrusions?
- Tens of thousands of conical hills populate the northern highlands of Mars, often with a small crater at their summit. These may be the result of mud volcanism. However, the evidence for this is not easy to acquire. This is due to the fact that little is known about the behavior of low-viscosity mud under the environmental conditions on the Martian surface. To fill this knowledge gap, a group of European scientists carried out a series of experiments in a cylindrical low-pressure vessel 90 cm in diameter and 1.8 m long, in which water-rich mud was poured over a cold sandy surface. Apart from the gravity on Mars, which could not be simulated, this experimental setup was somewhat reminiscent of building a large sandcastle under Mars-like conditions.
- The aim of these unusual experiments was to find out how the changed physical parameters influence the water component of the mud and thus alter its flow behavior. The results came as a surprise. "Under the low atmospheric pressure of Mars, the mud flows behave in much the same way as 'pāhoehoe', or 'ropy', lava, which is familiar from large volcanoes on Hawaii and Iceland," says the lead author of the study, Petr Brož of the Czech Academy of Sciences. These findings were somewhat unexpected, as comparable geological processes on other bodies in the Solar System are thought to occur in a similar way to conventional volcanic processes on Earth. "Our experiments show that even a process as apparently simple as the flow of mud – something that many of us have experienced for ourselves since we were children – would be very different on Mars."
Major Impact of Low Atmospheric Pressure
- The key reason for the flow behavior of the mud is the very thin atmosphere of Mars. The pressure is 150 times lower than the pressure at sea level on Earth. This difference has a major impact. Under such conditions, liquid water on the Martian surface is not stable and begins to boil and evaporate. This process absorbs latent heat in the vapor and cools the remaining mud, which then freezes at its surface, forming a crust. In a phase transition, such as during a freezing or thawing process, latent heat is released or absorbed by a material without changing its temperature. “Of course, we already know that liquid water begins to boil sooner under low pressure – that is why, for example, it takes longer to cook pasta on a camping stove on high mountains on Earth," explains Hauber. "However, the impact of this familiar effect on mud has never been investigated in an experiment before. Once again, it turns out that different physical conditions must always be taken into account when looking at apparently simple surface features on other planets. We now know that we need to consider both mud and lava when analyzing certain flow phenomena," adds Hauber.

- The team of researchers were able to show in detail that the mud flows in the experiment behaved like pāhoehoe lava, with liquid mud spilling from ruptures in the frozen crust, and then refreezing to form a new flow lobe. When mud escapes onto the Martian surface, it is able to flow for some time before it solidifies due to the low temperatures. However, the morphology – the shape of the mud flows – is different from those found on Earth. The research work that is currently being carried out is important for investigations of other planetary bodies, because similar processes may also play a role in cryovolcanic eruptions, in which liquid water comes to the surface, instead of magma or mud, such as on icy moons in the outer Solar System.
• May 14, 2020: Nature is a powerful sculptor – as shown in this image from ESA’s Mars Express, which portrays a heavily scarred, fractured martian landscape. This terrain was formed by intense and prolonged forces that acted upon Mars’ surface for hundreds of millions of years. 42)
- Features on Mars often trick the eye. It can be difficult to tell if the ground has risen up towards you, or dropped away. This is a common phenomenon with impact craters especially, and is aptly named the ‘crater/dome illusion’; in some images, craters appear to be large domes arching up towards the viewer – but look again, and they instead become a depression in the surrounding terrain, as expected.
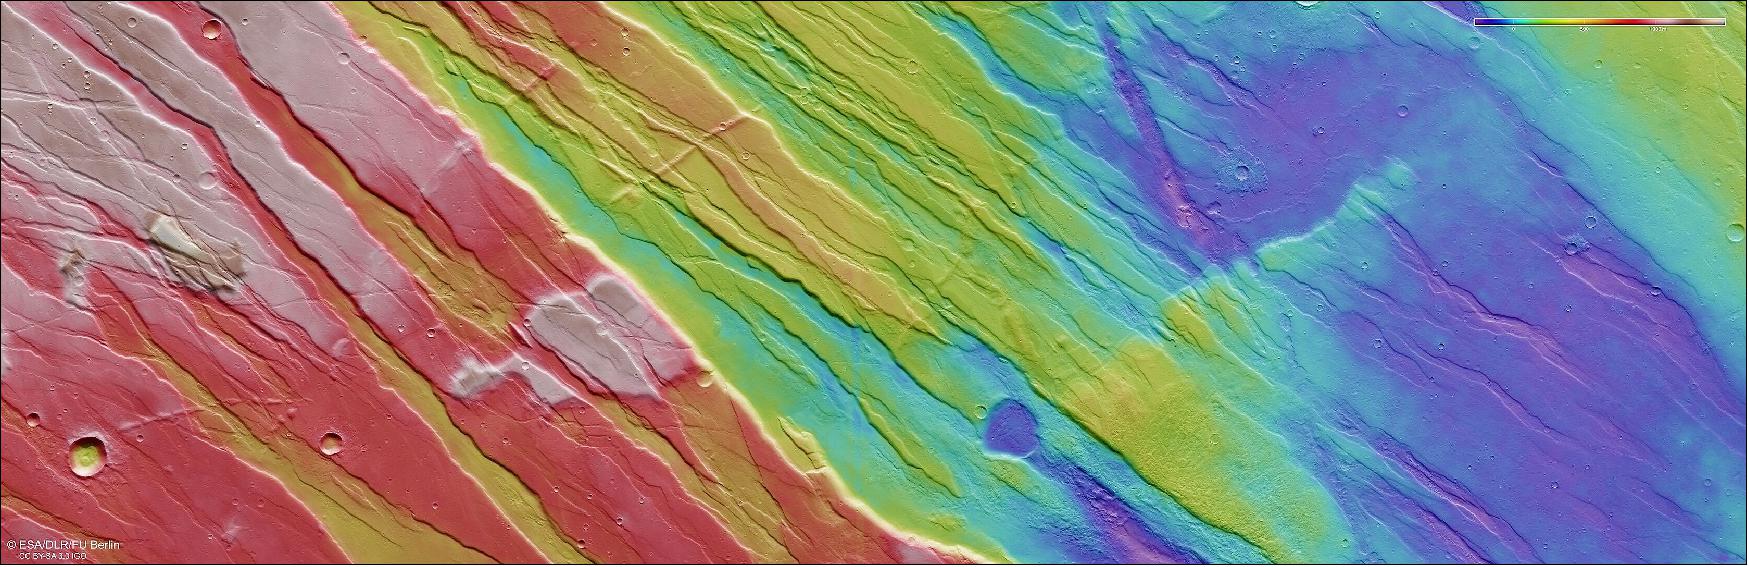
- Such a phenomenon is at play in this image from Mars Express, which shows part of Tempe Fossae, a series of faults that cuts across the region of Tempe Terra in Mars’ northern highlands.
- Upon first glance, it is difficult to tell if ground is rising up, sinking down, or a mix of both. The landscape here is scratched, scored, and wrinkled: ridges slice across the frame, interspersed with the odd impact crater, and the entire region is full of cliffs and chasms.
- The terrain here belongs to the volcanic Tharsis province, also known as Tharsis rise, which is located close to the planet equator, at the boundary between low plains in the Northern hemisphere and highlands in the South, and displays a complex geology originating from the processes involved in its formation.
- Tempe Fossae is a great example of terrain featuring two key martian features: grabens and horsts. In a way, these are opposites of one another – grabens are slices of ground that have dropped down between two roughly parallel faults, while horsts are ground that has been uplifted between faults.
- At most, the grabens seen here reach a few kilometers wide, a few hundred meters deep, and several hundred kilometers long. Both were created by volcanic and tectonic forces acting across the surface of Mars, which fractured the ground and manipulated it into new configurations. Mars Express has observed these features many times before, in regions including Claritas Fossae, Acheron Fossae, and the nearby Ascuris Planum.
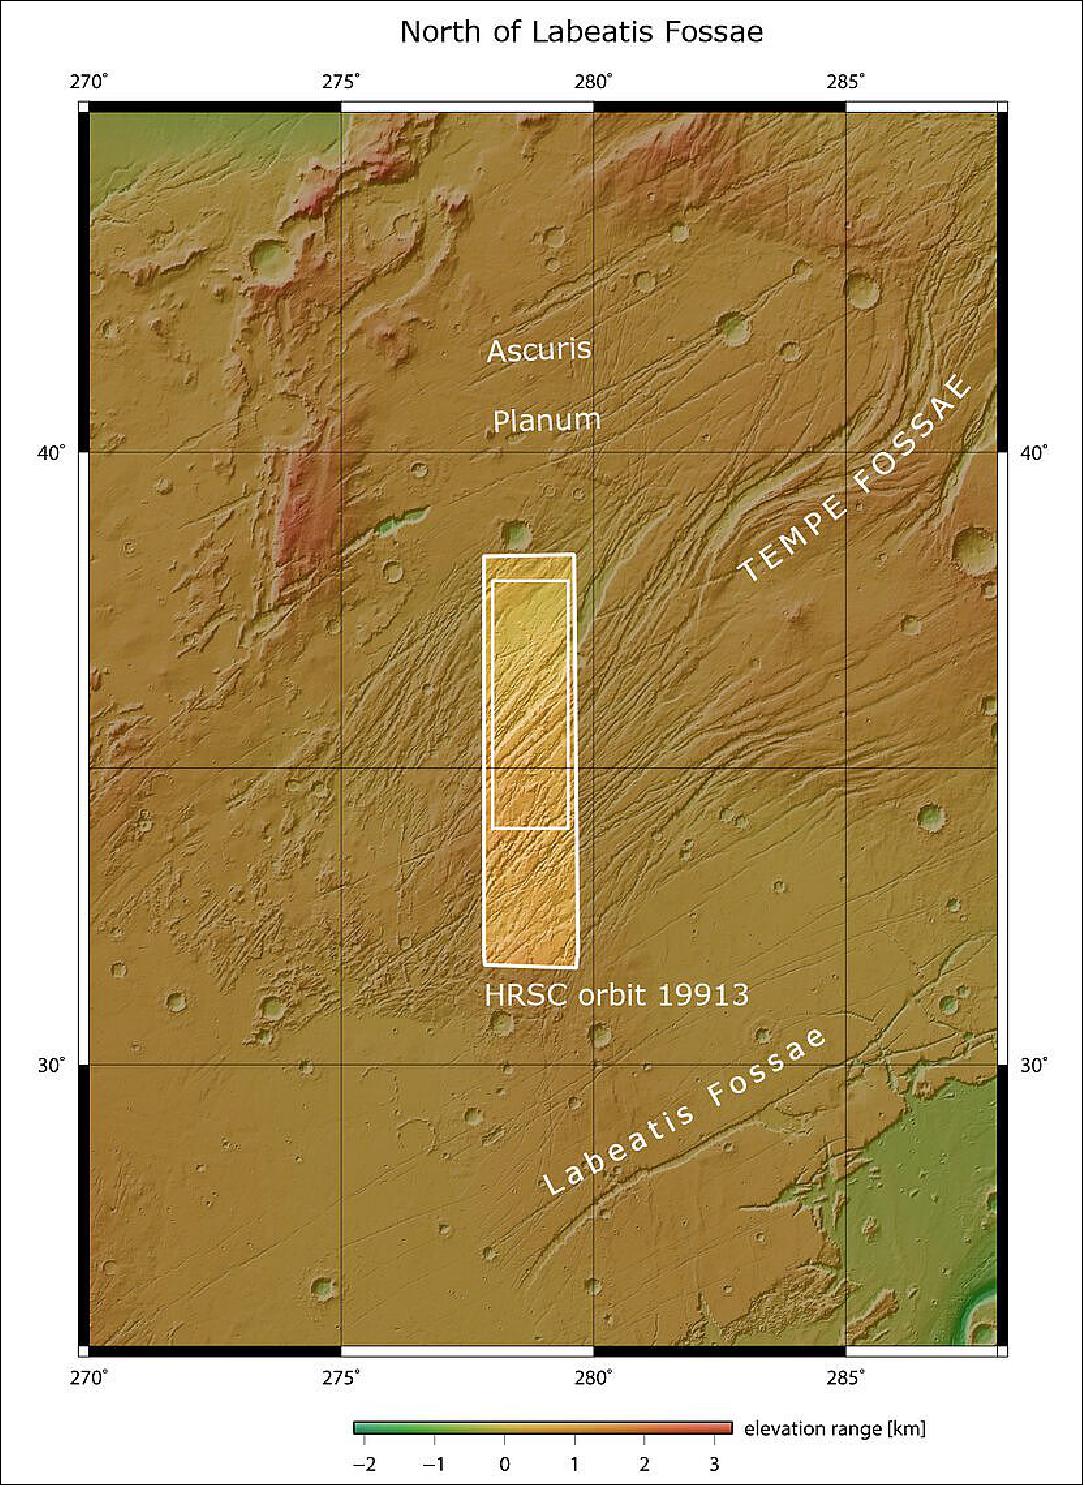
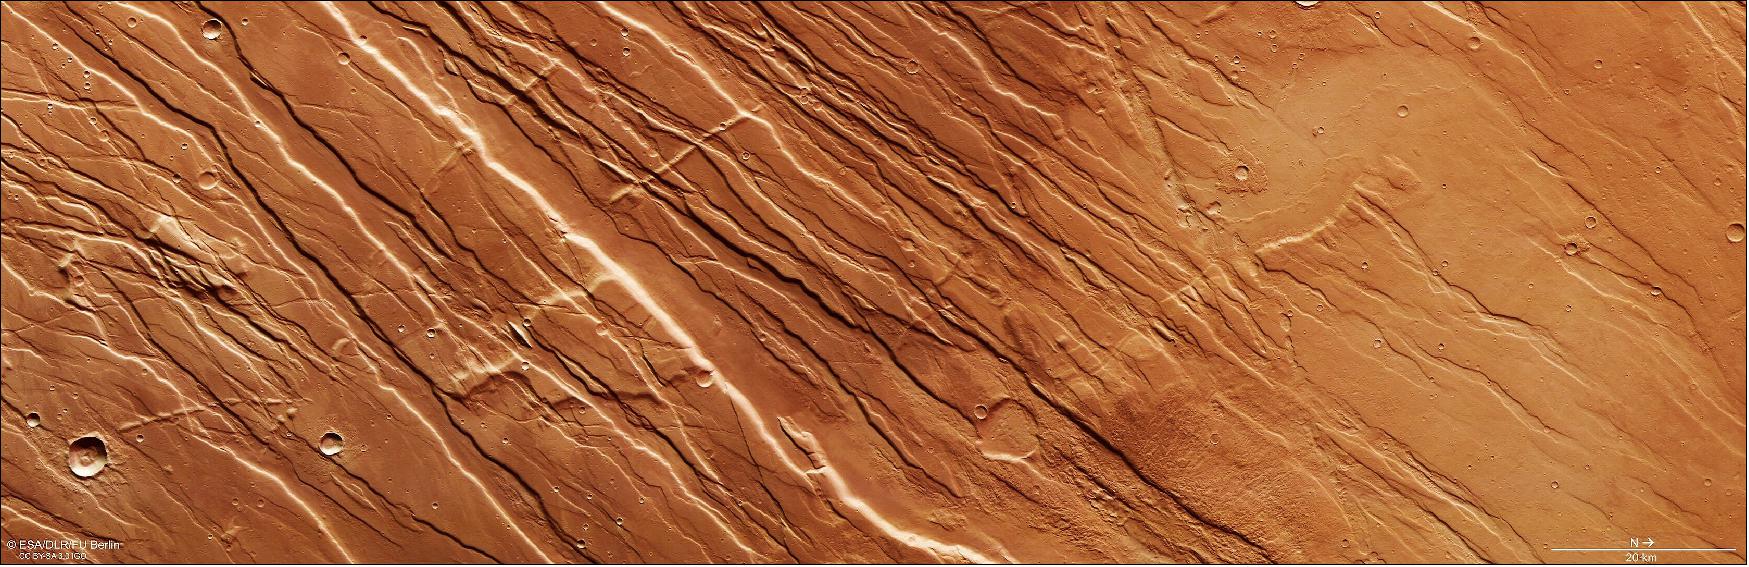
- Despite any initial visual confusion, this landscape is a mix of faults, elevated ground, deep valleys, and largely parallel ridges, extending both down into the surface and up above the martian crust. The crater/dome illusion is actually just a trick of the light caused by our eyes incorrectly interpreting shadows. Comparing this image to the aforementioned image of Ascuris Planum, a similar terrain, highlights this nicely, demonstrating the importance of lighting conditions in photography.
- Our Earth-bound eyes are accustomed to seeing images lit from above, but this is not the default orientation for spacecraft, which can gather data at all angles of sunlight.
- Mars Express has a peculiar orbit that is not Sun-synchronous. Sun-synchronous orbits pass over the same spot on a planetary surface at roughly the same local time of day on every orbit – for instance, Earth orbiters passing over a certain city at around noon every day. Mars Express, however, does not do this, and can therefore gather data at a wide range of local times on Mars. As a result, it experiences a range of different illumination conditions as it observes the Red Planet, and produces a varied array of observations and snapshots of our planetary neighbor.
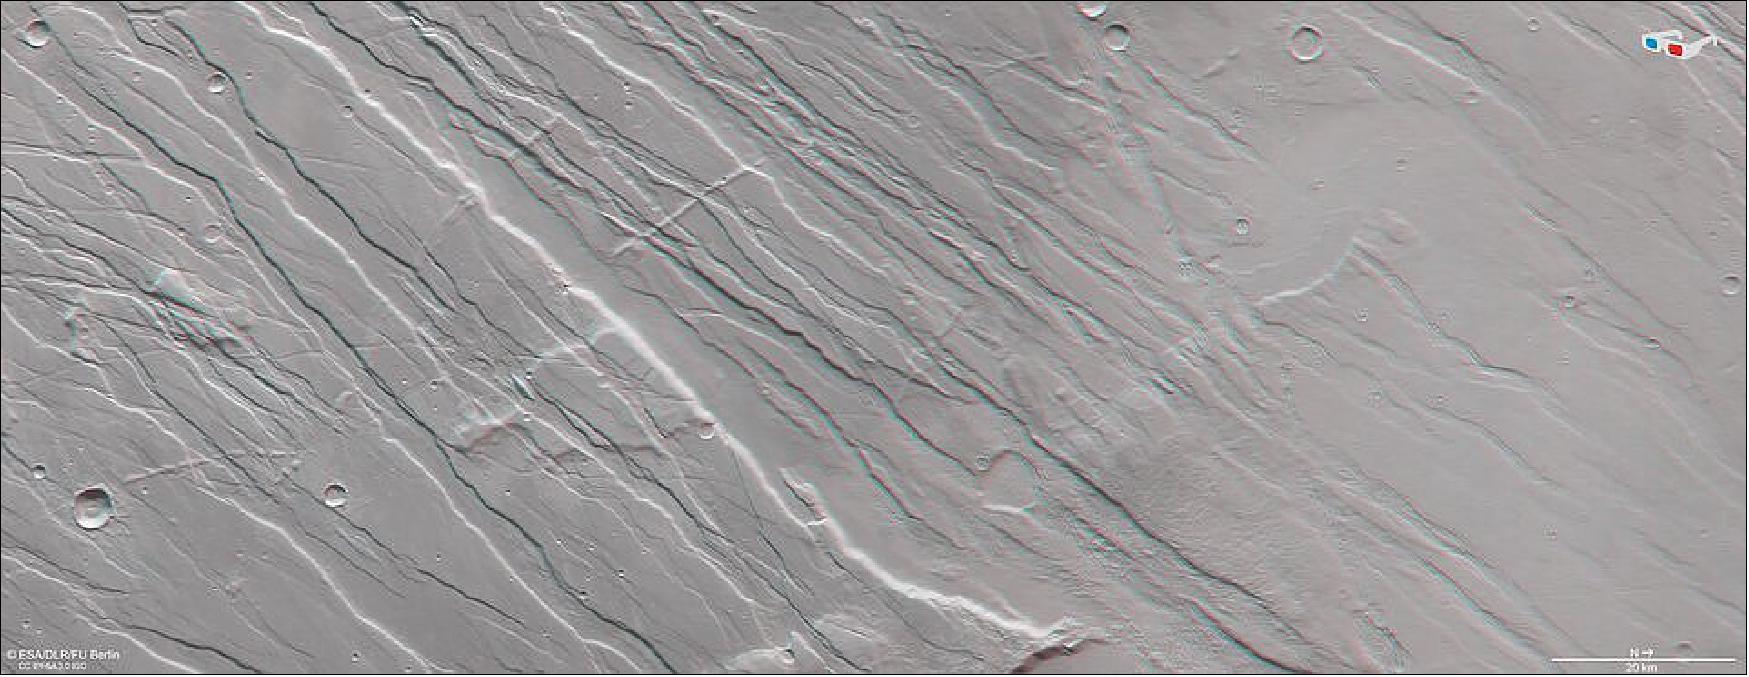
- To the right of the frame (pointing to the planet’s north), the surface becomes significantly smoother, with grabens and horsts almost nowhere to be seen. This smoother profile is a result of lava flooding these features before cooling and solidifying, in-filling and resurfacing this part of Mars.
- While most of the ridges seen here run parallel to one another from the upper left to lower right, there are also a few scratches cutting across in a perpendicular direction. This is an effect of location, as this patch of terrain is just northeast of the well-known Tharsis province, a past hotspot on Mars for substantial volcanic and tectonic activity.
- Tharsis is sizeable. The province measures several thousand kilometers across and five kilometers high on average relative to martian ‘sea level’ – a level that, given the planet’s lack of seas, is arbitrarily defined on Mars based on elevation and atmospheric pressure. It hosts the largest volcanoes in the entire Solar System, ranging from 15 to over 20 km in height.
- As the province grew larger and larger over several hundreds of millions of years, it stretched and stressed the surrounding crust, causing it to fracture and tear in different directions. The perpendicular slices seen in this image are evidence of a change in the direction of stress.
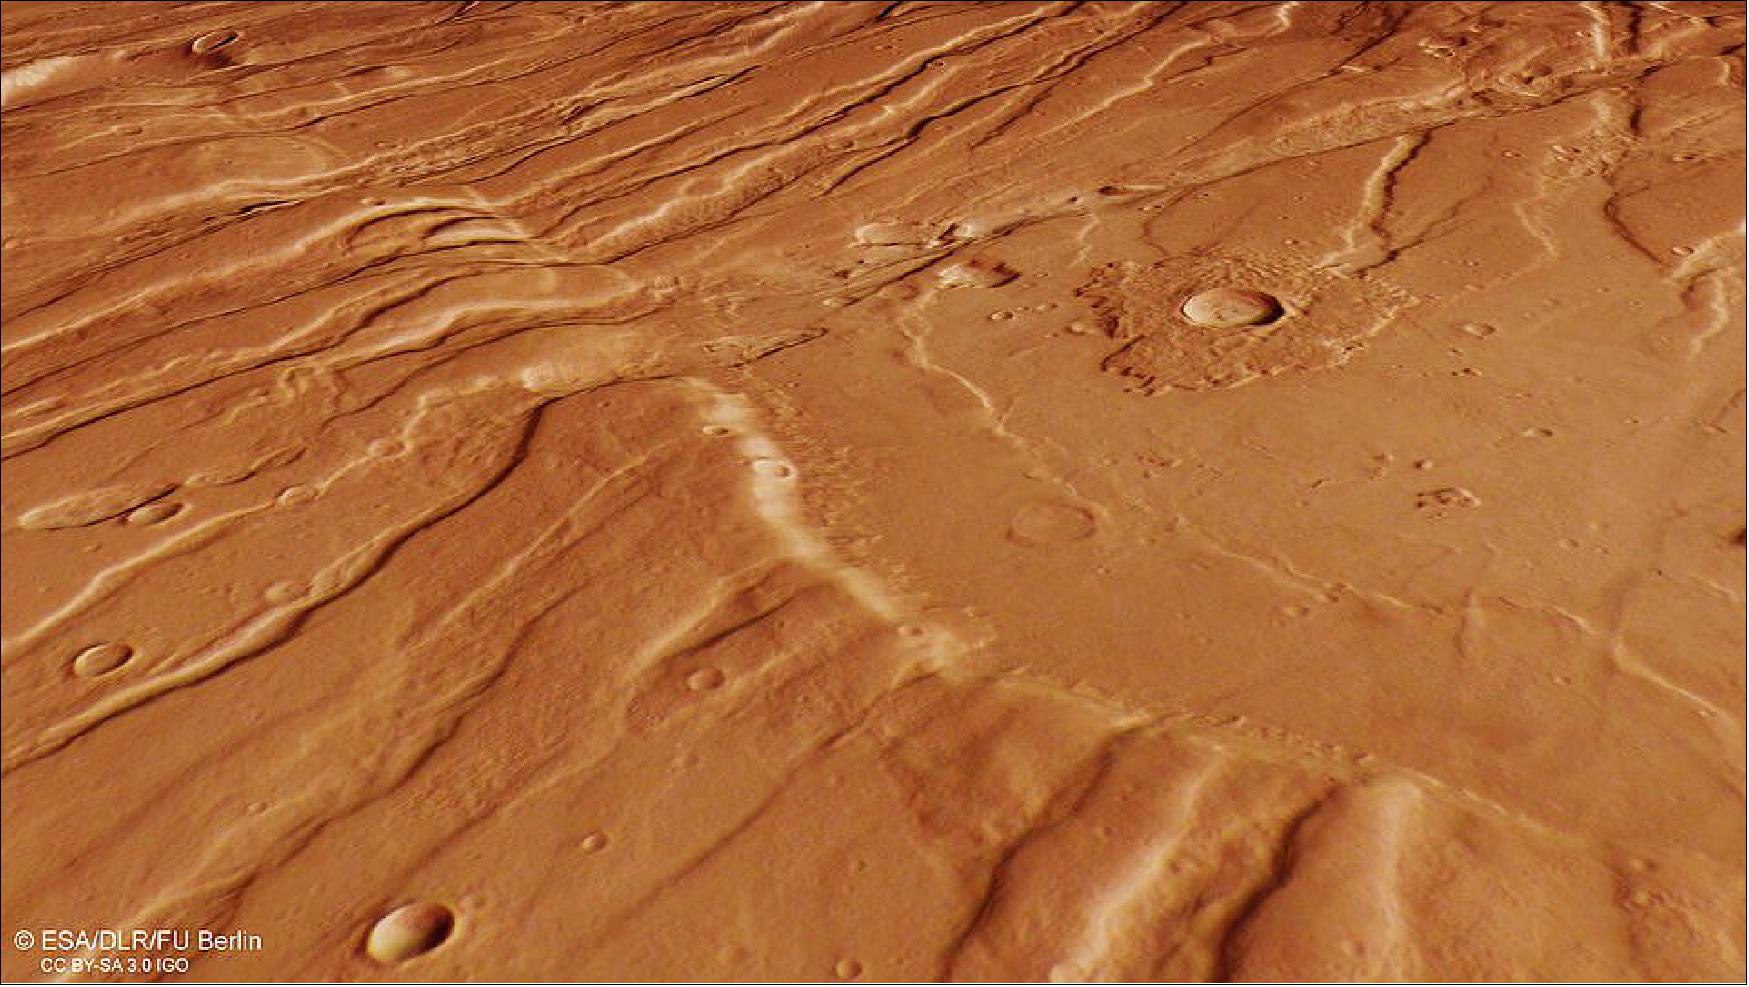
- While the formation of Tharsis caused tectonic activity locally, as shown by these slices, it also influenced Mars’ crust on a much larger scale and is thought to have had a major influence in forming Valles Marineris, the largest canyon in the Solar System. Widespread erosion has occurred in Valles Marineris since its formation, shaping and sculpting the landscape into the canyon system we see today.
- Exploring the geology of Mars is a key objective of Mars Express. Launched in 2003, the spacecraft has been orbiting the Red Planet for over a decade and a half; it has since been joined by the ESA-Roscosmos ExoMars Trace Gas Orbiter (TGO), which arrived in 2016, while the ExoMars Rosalind Franklin rover and its accompanying surface science platform are scheduled for launch in 2022.
- The fleet of spacecraft currently at Mars, operated by several space agencies, are able to image the planet’s surface at scales from the global (with a spatial resolution of around ten meters) to the local (spatial resolution of around one meter). This combination allows scientists to characterize geological processes at global, regional, and local scales, enabling them to work towards a fuller understanding of Mars and its intriguing history.
• March 5, 2020: Known for its wide swathes of rippling, textured, gently sloping dunes, the Terra Sabaea region on Mars is home to many fascinating geological features – including the prominent Moreux crater, the star of a new image from ESA’s Mars Express. 43)
- The crater is roughly three kilometers deep, and spans 135 kilometers from edge to edge. While the surrounding material is visible in hues of butterscotch and caramel, the crater’s walls are dark, resembling a smudged ring of charcoal, and dark brown-black dunes cover the crater floor. This darkness is thought to be a result of the dunes comprising sandy material rich in pyroxene and olivine, minerals with a typically dark appearance.
- The dunes and flow features in Moreux crater are intriguing. Many of the features surrounding the central peak and southern region of the crater (to the left of the image) appear to have been formed by substantial and episodic glacial activity over the past few million years. Many other features, most notably the sickle-shaped dunes covering the crater floor, show signs of being eroded or formed by wind-related processes.
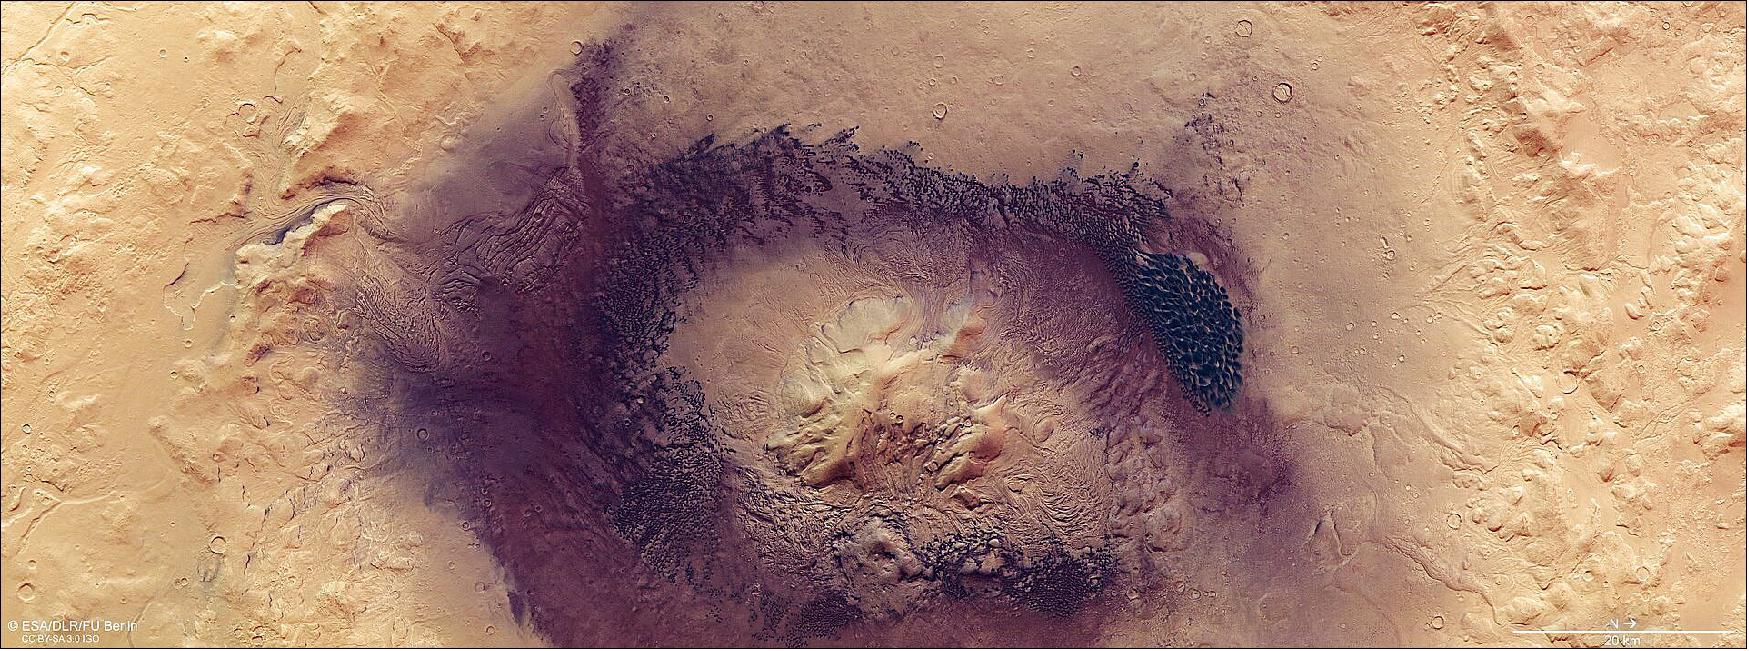
- The Moreux crater on Mars showcases numerous intriguing geological processes and features. It sits at the northern edge of Terra Sabaea, a large area of the Red Planet that is speckled with impact craters and covered in glacial flows, dunes, fretted terrain and intricate ridge networks.
- When compared to other impact craters on both Mars and Earth, Moreux crater appears a little misshapen and messy – the result of ongoing erosion over martian history. Its egg-shaped rim is broken up, its dark walls are ridged, rippled and mottled, and its center features a prominent clustered ‘peak’, created as material from the crater floor rebounded and rose upwards following the initial impact.
- It is difficult to get a sense of scale when viewing this peak from orbit, but Moreux crater’s central peak is sizeable, reaching around two kilometers in height. The crater itself is roughly three km deep, and spans 135 km from edge to edge.
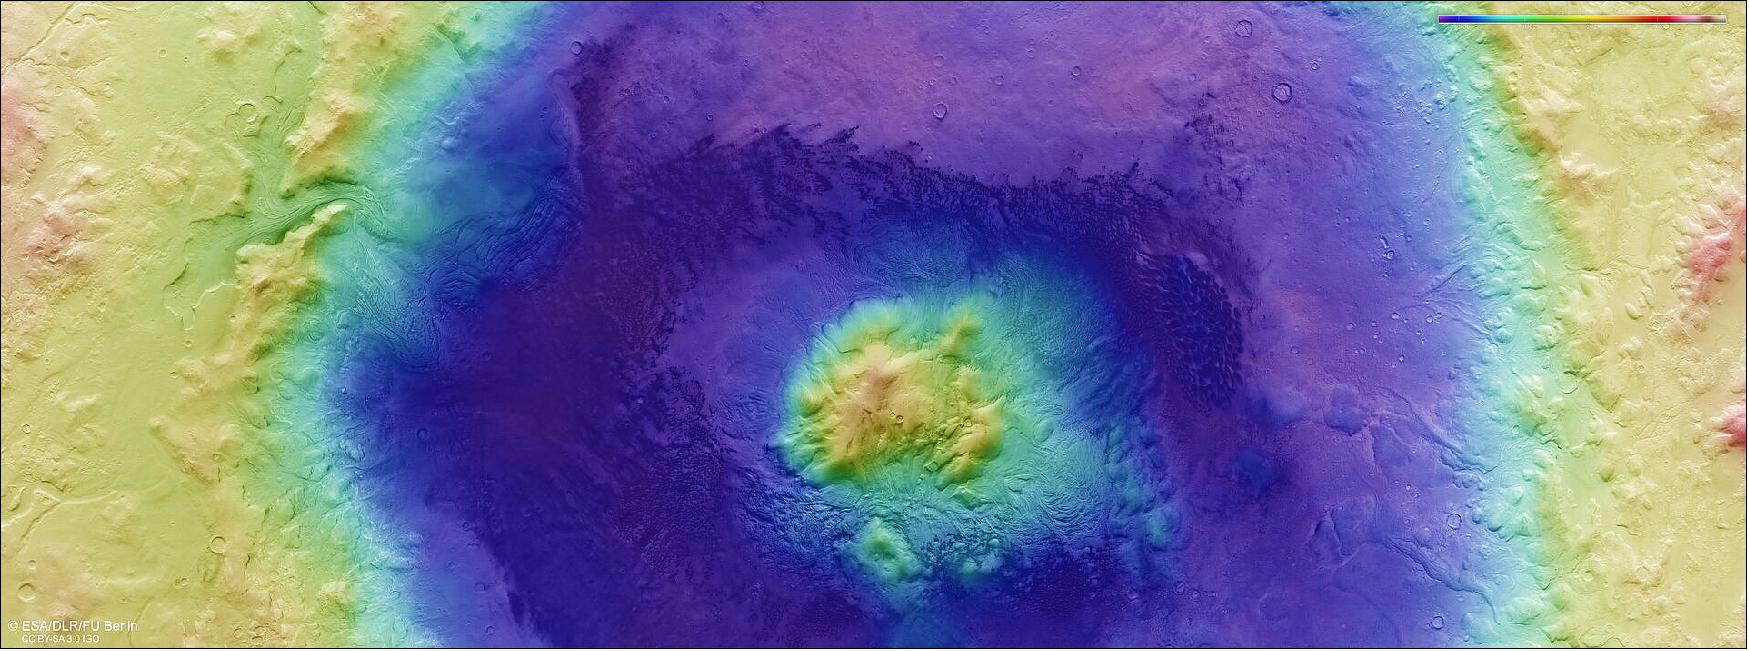
- The range of colors featured in images like this one, taken by the High Resolution Stereo Camera on Mars Express, reveals much about the composition of a particular region, material or feature.
- In the case of Moreux crater, the color differences are stark: while the surrounding material is visible in hues of butterscotch and caramel, the crater’s walls are dark, resembling a smudged ring of ash or charcoal. Dark brown and black dunes cover the crater floor, while the peak remains a pale yellow-orange. Dark, prominent ejecta, comprising material flung outwards during the crater-forming collision, spread outwards from the crater rim, discoloring and encroaching upon the lighter surrounding terrain.
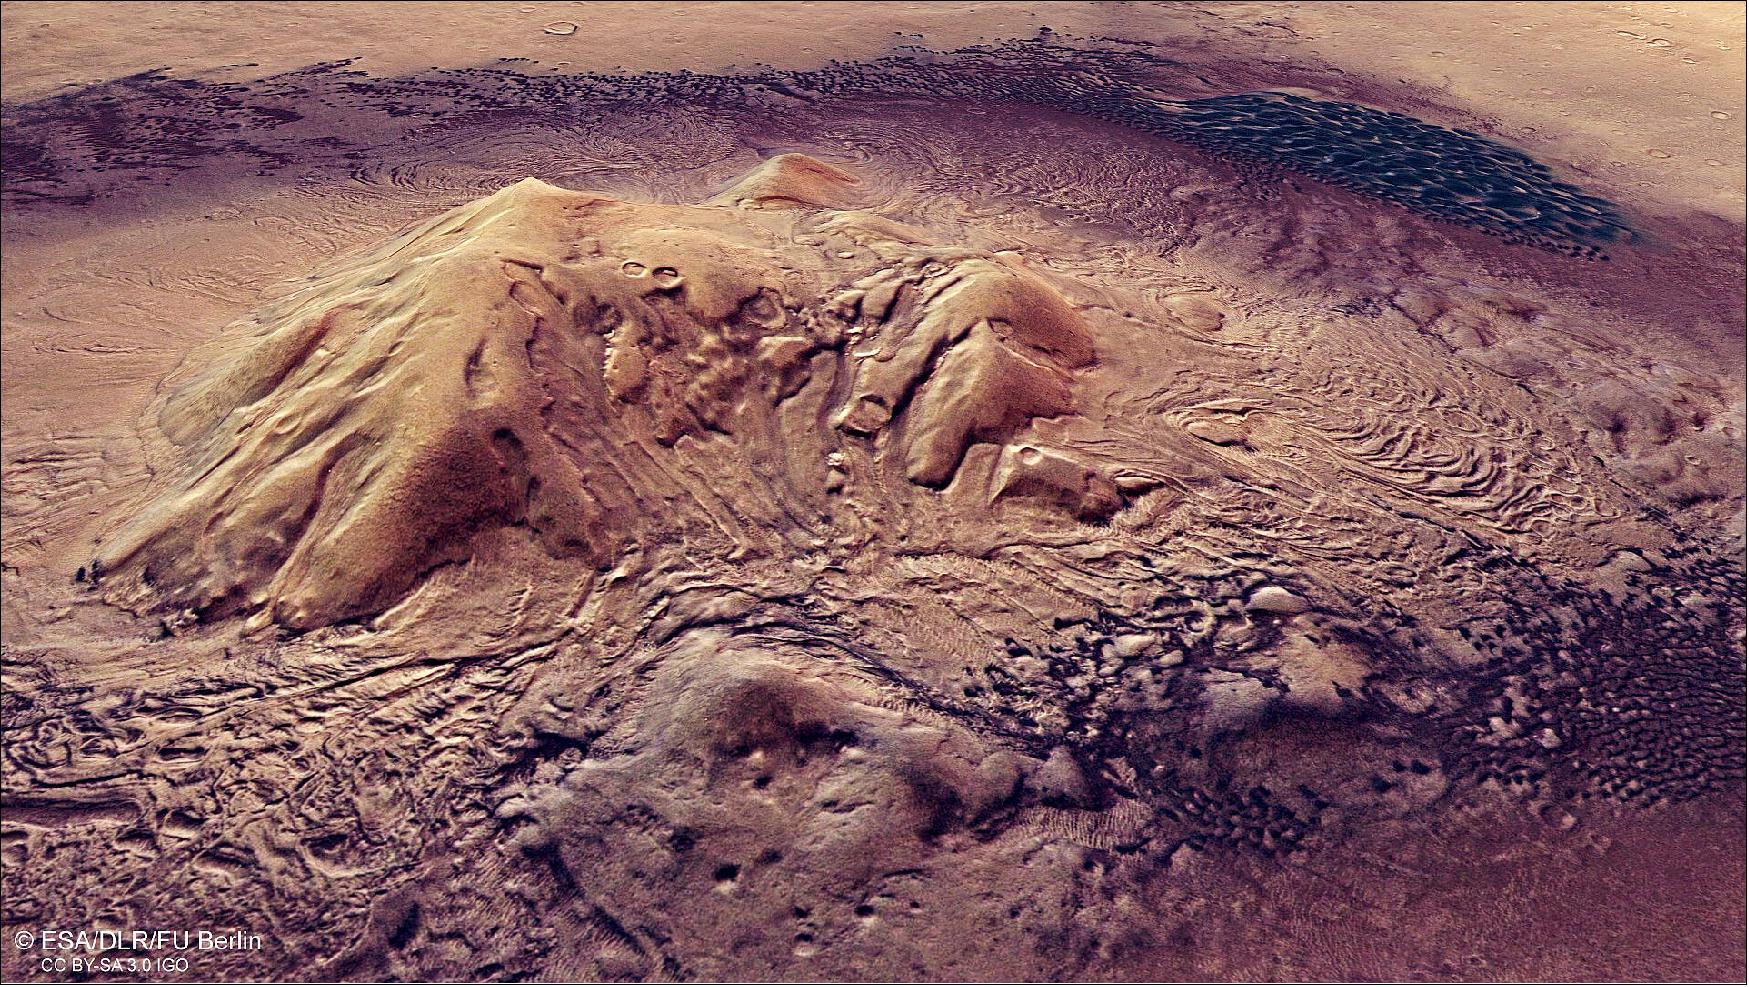
• February 13, 2020: Mars is very much a world of two halves, as this new image from ESA’s Mars Express highlights, showing where these dramatically different regions come together as one. 44)
- The morphology and characteristics of the martian surface differ significantly depending on location. The northern hemisphere of Mars is flat, smooth and, in places, sits a few kilometers lower than the southern. The southern hemisphere, meanwhile, is heavily cratered, and peppered with pockets of past volcanic activity.
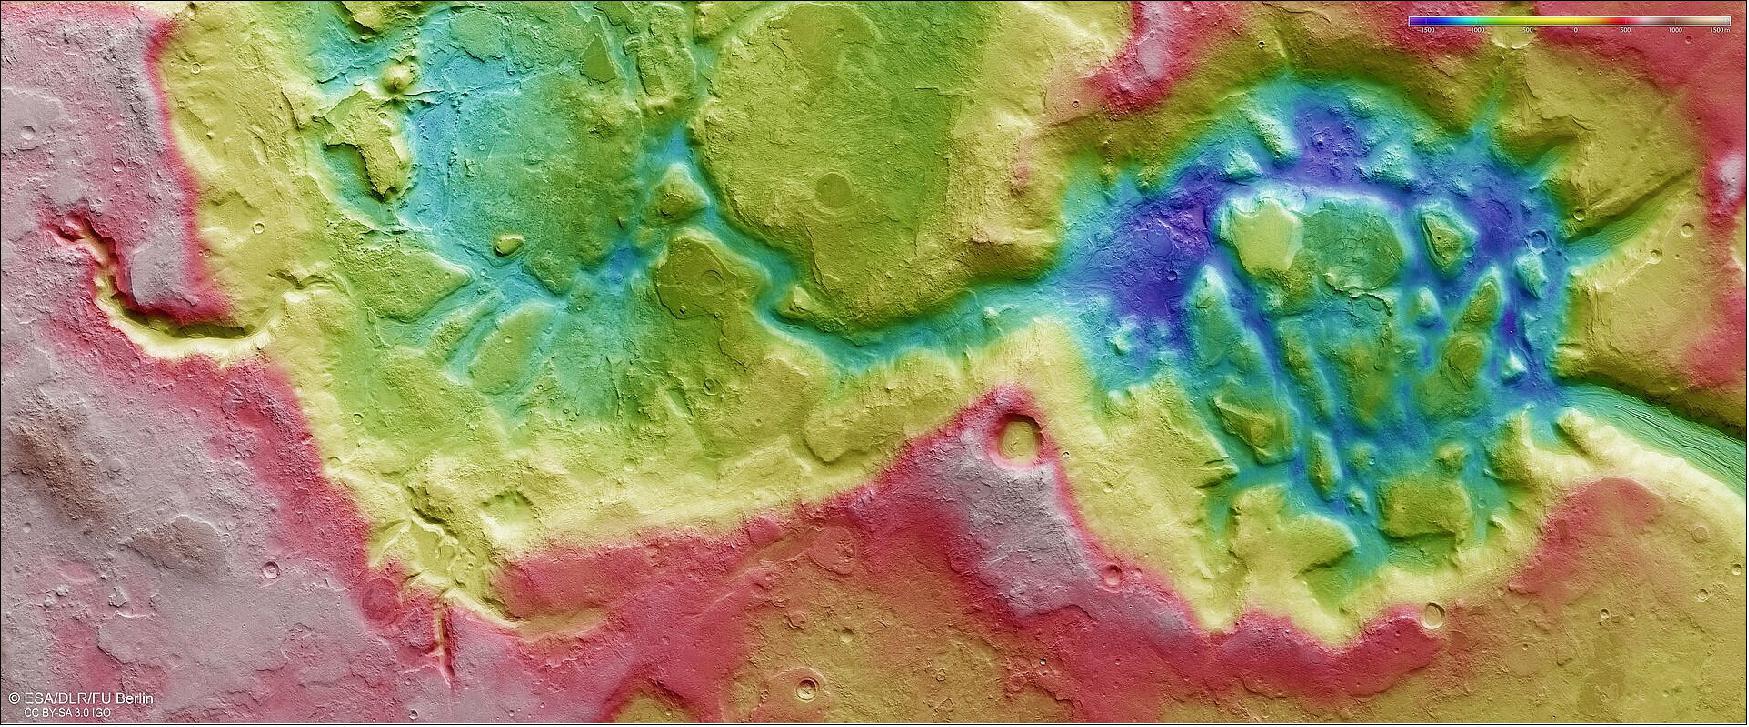
- A transition zone known as ‘dichotomy boundary’ separates the northern lowlands and southern highlands. Large parts of this region are filled with something scientists call fretted terrain: blocky, broken-up, fragmented swathes of terrain where the rough, pockmarked martian south gives way to the smoother north.
- This new image from the Mars Express High Resolution Stereo Camera (HRSC) shows exactly that: a region of fretted terrain named Nilosyrtis Mensae.
- Nilosyrtis Mensae has a labyrinthian appearance, with numerous channels and valleys carving through the terrain. Water, wind and ice been strongly affecting this region, dissecting and eroding the terrain, along with changes in martian geology: valleys have formed over time and sliced across the region, and once-defined impact craters have slowly degraded, their walls and features gradually wearing away.
- The large crater to the right of Figure 100 is an example of this degradation: it has a smooth, rounded appearance, with gently sloping walls, softened edges, and a flat bottom that has been widened and filled by sedimentary material over time. This worn-away morphology reflects both the crater’s advanced age, and the levels of erosion it has undergone since it formed.
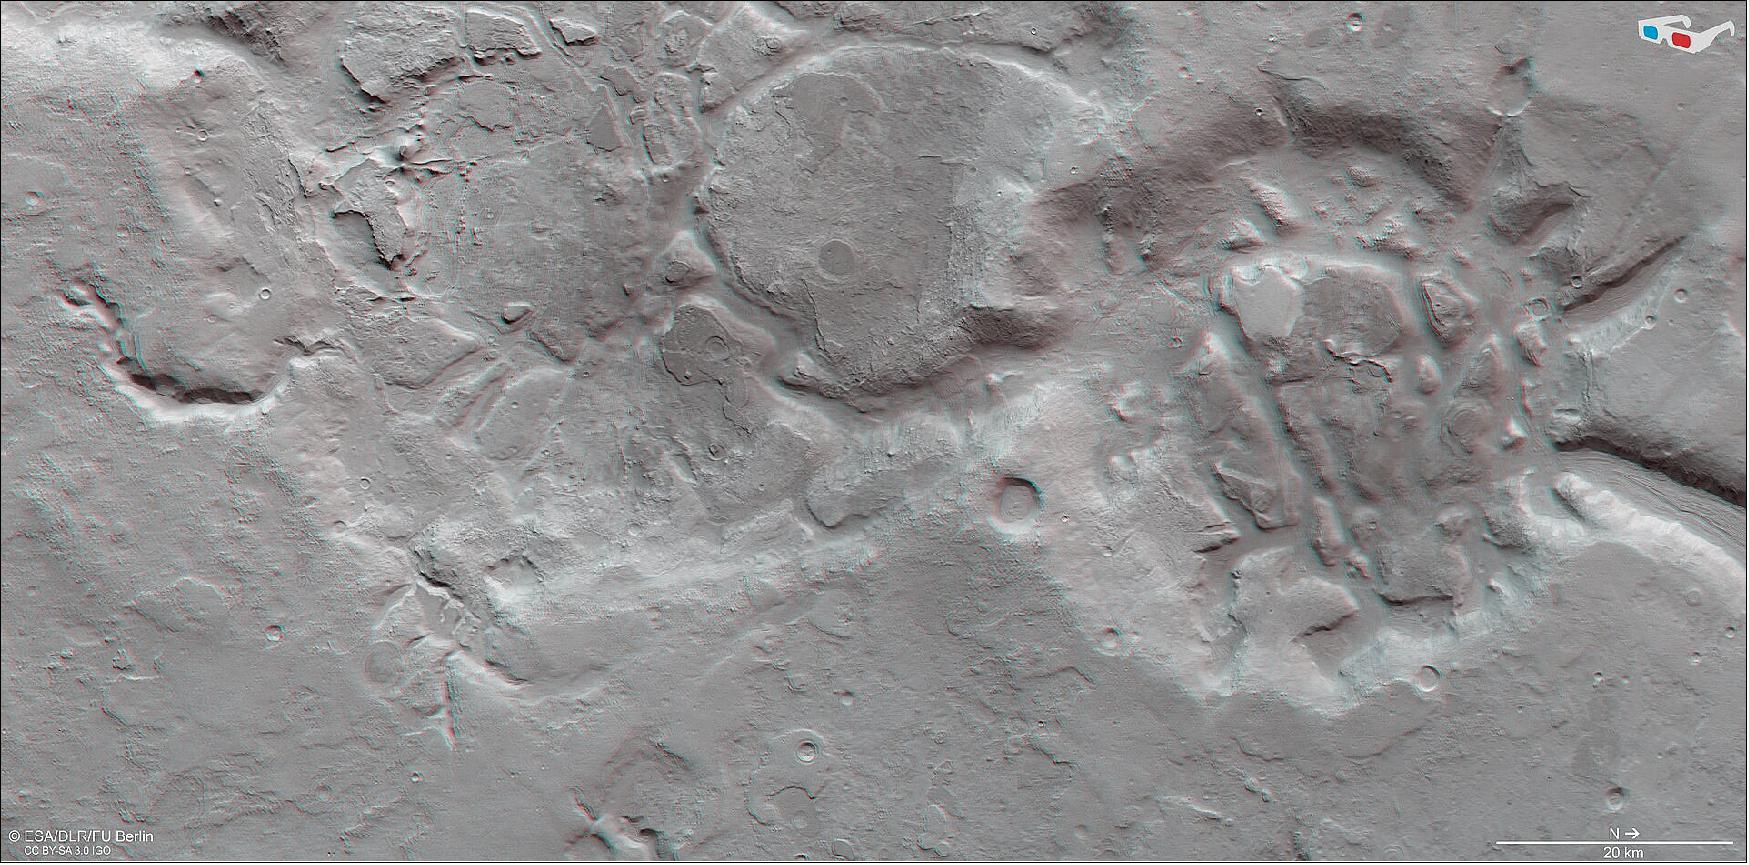
- Such erosion processes also created rounded hills and isolated flat-topped hills, or ‘mesas’, that are visible within the crater and across the region more widely. These stand apart from their surroundings as isolated features, and contribute to the blocky, fractured appearance of fretted terrain.
- Scientists are interested in Nilosyrtis Mensae not only for its location in this intriguing transition zone between north and south, but also for the secrets it could hold about the history of water on Mars.
- Observations of this region by missions such as Mars Express have revealed ridges, grooves and other surface textures indicative of flowing material – most likely ice.
- The climate and atmosphere of ancient Mars allowed ice and snow to accumulate and move around across the planet’s surface.
- Ice is thought to have flowed through the various valleys and across the plateaus in this region, in the form of slow-moving glaciers that swept up debris as they travelled. Such features would be similar to rock glaciers here on Earth: either icy flows covered in layers of mud and sediment, or flowing mixtures of ice, mud, snow and rock interspersed with larger rocks and boulders.
- Studying and characterizing the various processes at play across the surface of Mars is a key aim of Mars Express. Launched in 2003, the spacecraft has now been orbiting the Red Planet for over a decade and a half. Meanwhile, the ESA-Roscosmos ExoMars Trace Gas Orbiter (TGO) joined in 2016, soon to be joined by the ExoMars Rosalind Franklin rover and its accompanying surface science platform, scheduled for launch in July.
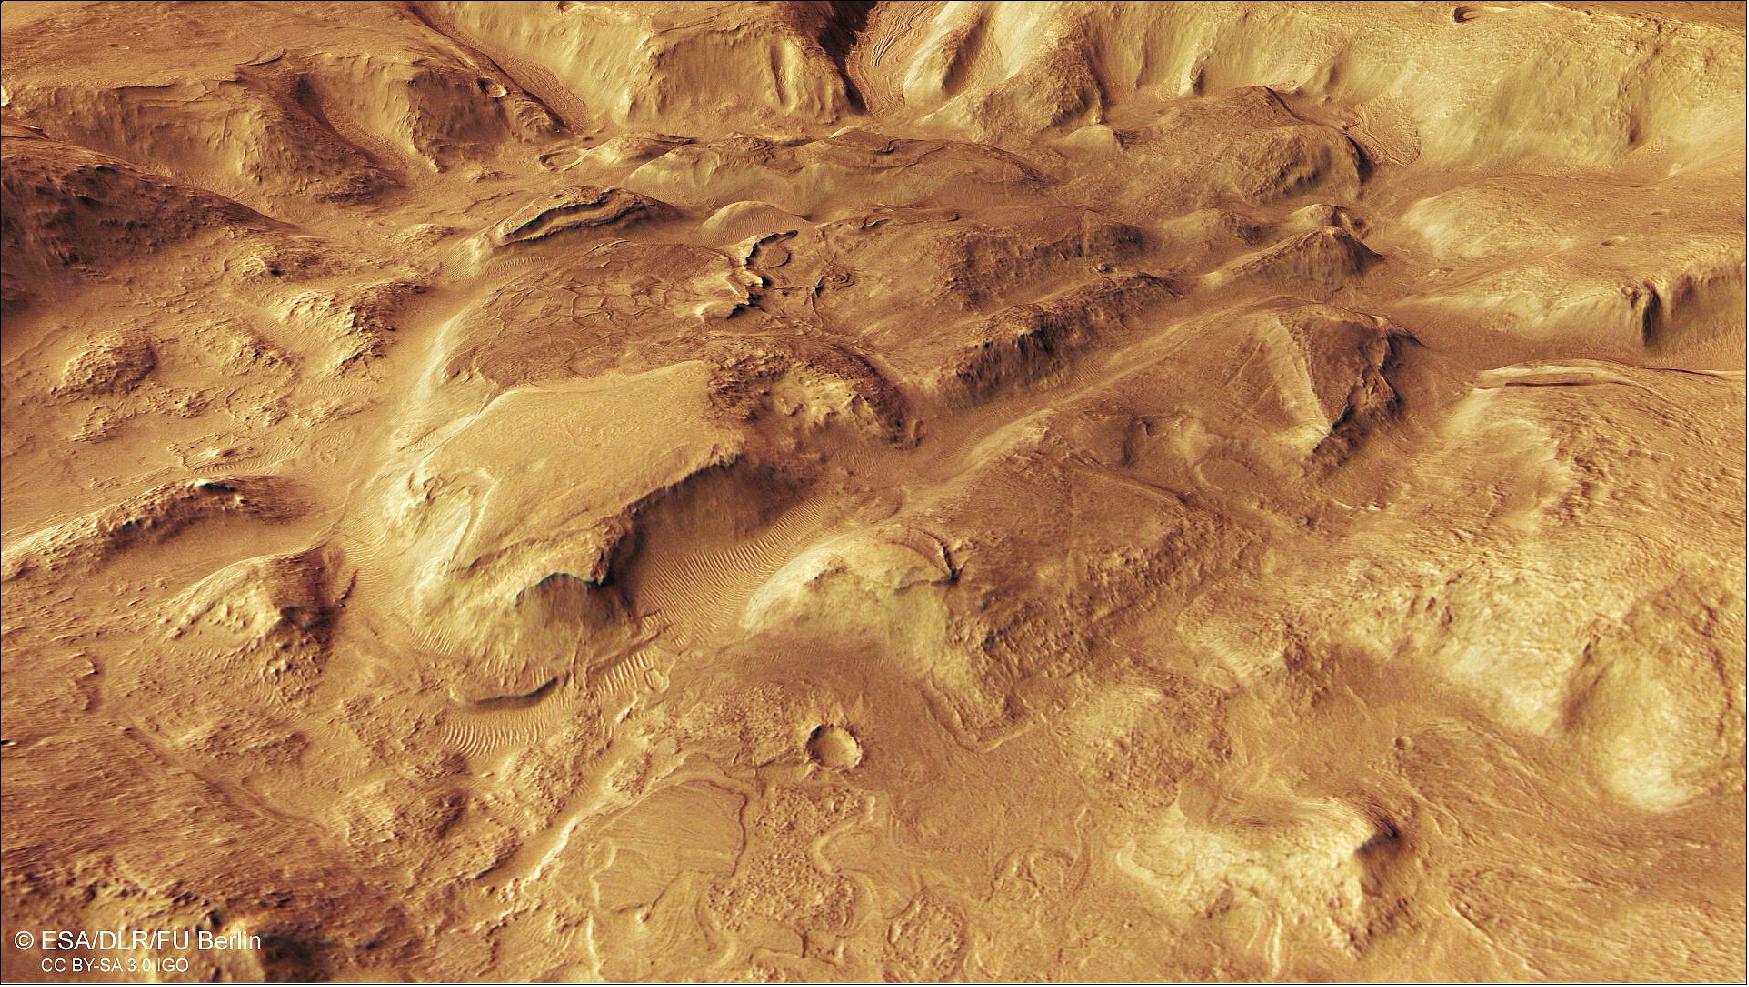
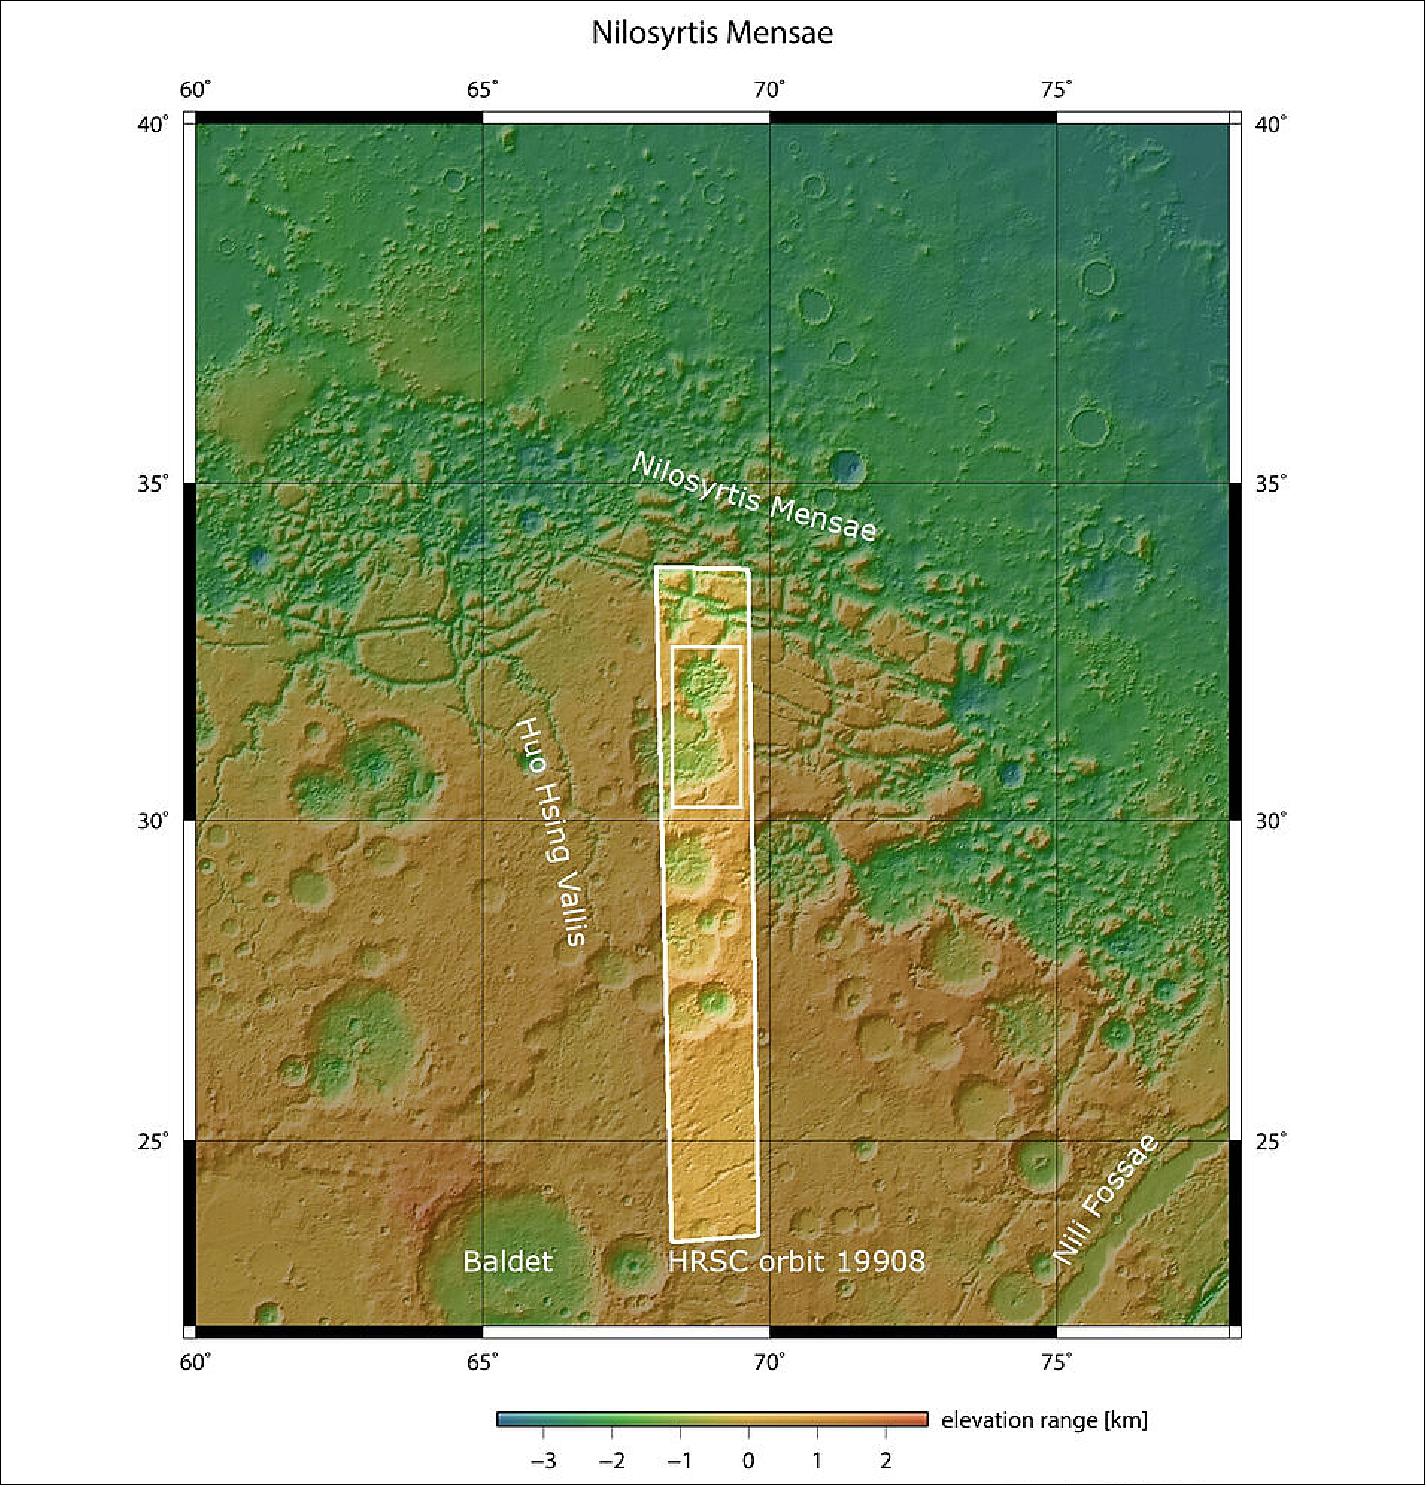
• January 13, 2020: ESA’s Mars Express has captured beautiful images of the icy cap sitting at Mars’ north pole, complete with bright swathes of ice, dark troughs and depressions, and signs of strong winds and stormy activity. 45)
- The poles of Mars are covered in stacked layers of ice that subtly shift in extent and composition throughout the year.
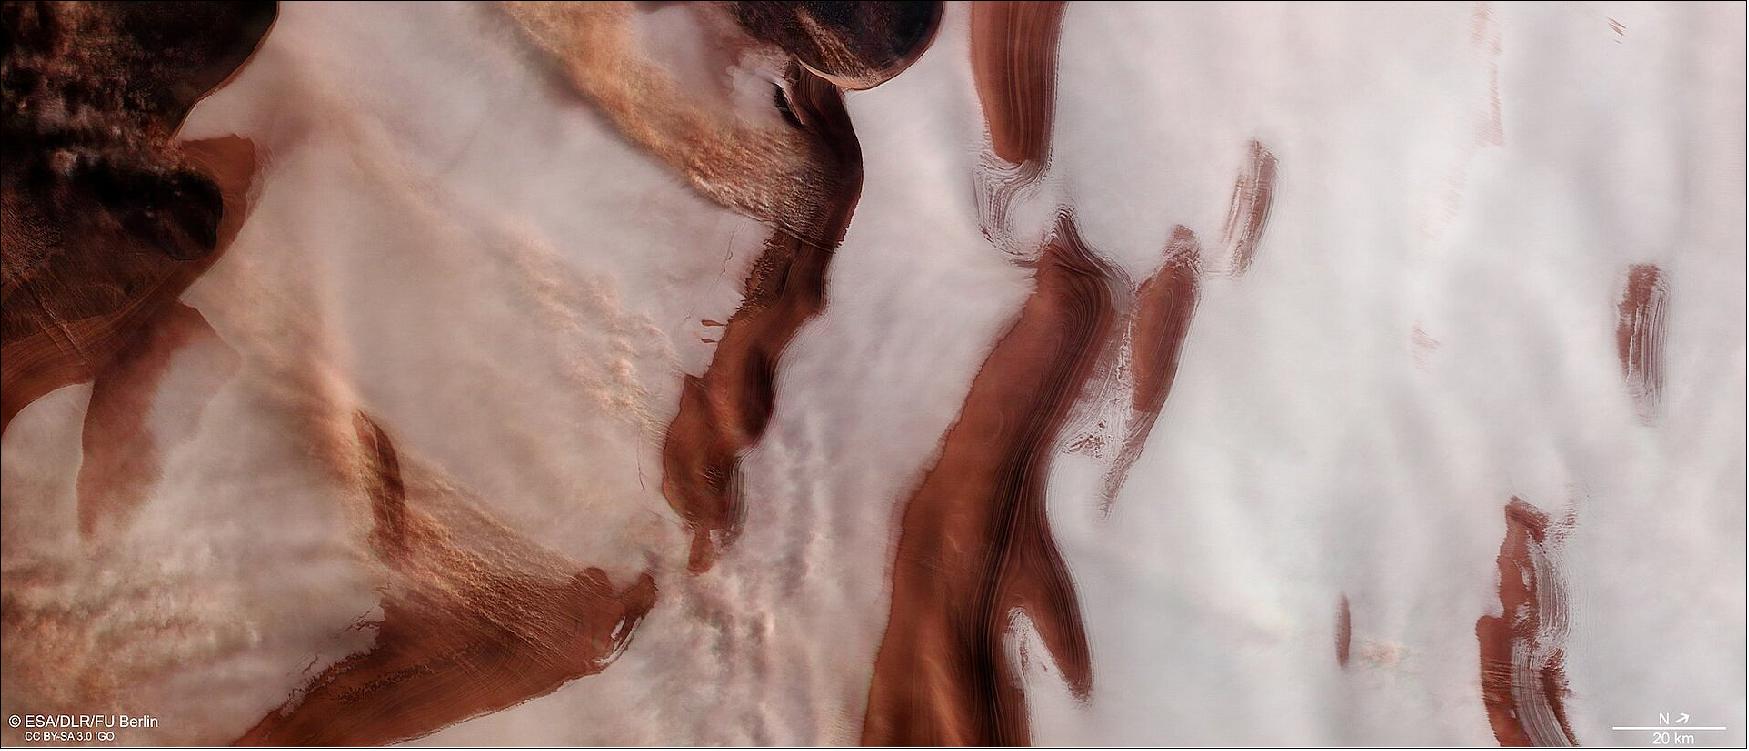
- During summer, the pole is permanently covered by thick layers of mostly water ice; during winter, temperatures plummet below -125º Celsius and carbon dioxide begins to precipitate and build up as ice, creating a thinner additional layer a couple of meters thick. Winter also brings carbon dioxide clouds, which can obscure the polar features below and make it difficult to see clearly from orbit.
- This view from Mars Express’ High Resolution Stereo Camera (HRSC) suffers from very little such cloud cover, and shows the northern polar cap during the summer of 2006.
- The landscape is a rippled mix of color, from the bright whites of water ice to the dark reds and browns of martian dust, and displays a number of interesting phenomena.
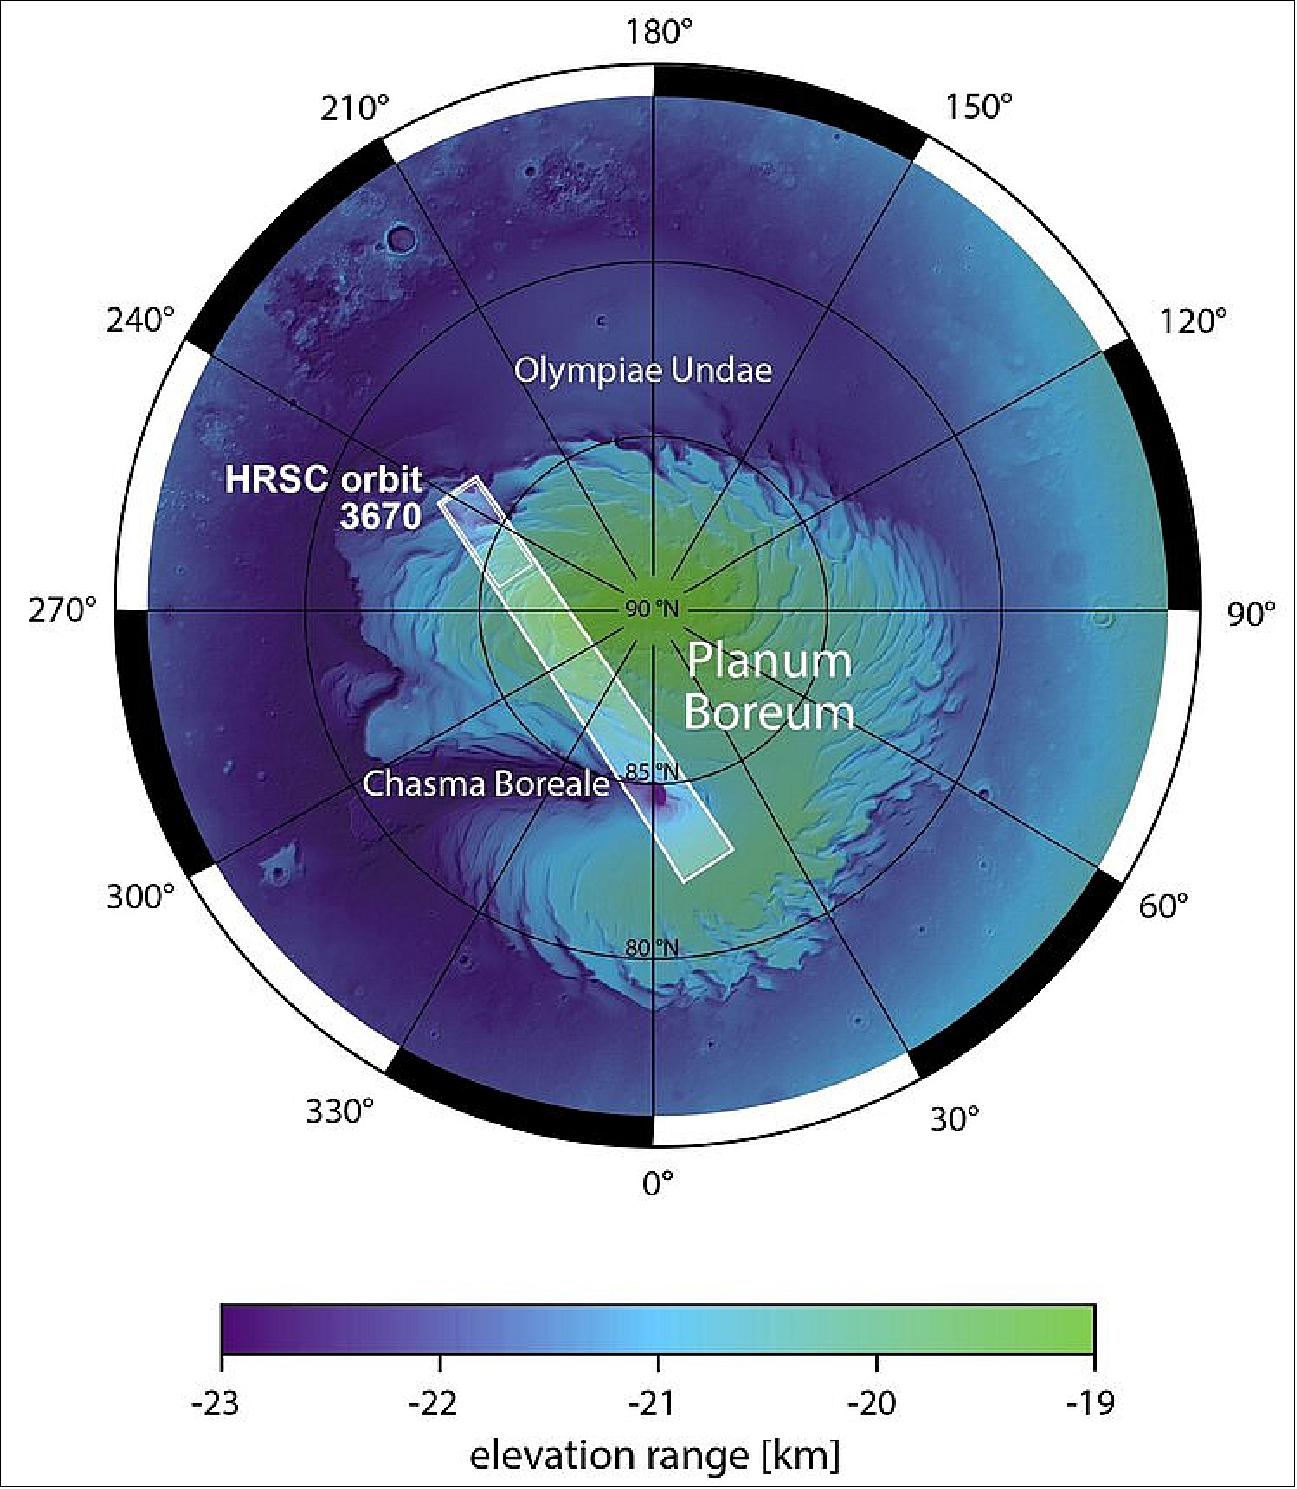
- Dark red and ochre-hued troughs appear to cut through the ice cap. These form part of a wider system of depressions that spiral outwards from the very center of the pole. When viewed on a larger scale, as in the context map, this pattern becomes evident: the rippling troughs curve and bend and slice outwards in an anti-clockwise orientation, wrapping around the pole and creating a pattern akin to zebra stripes.
- These spiralling features are thought to have formed via a mix of processes, the most significant one being wind erosion. It is thought that winds circle radially away from the center of the north pole, moving outwards cyclically to create the spiral pattern we see.
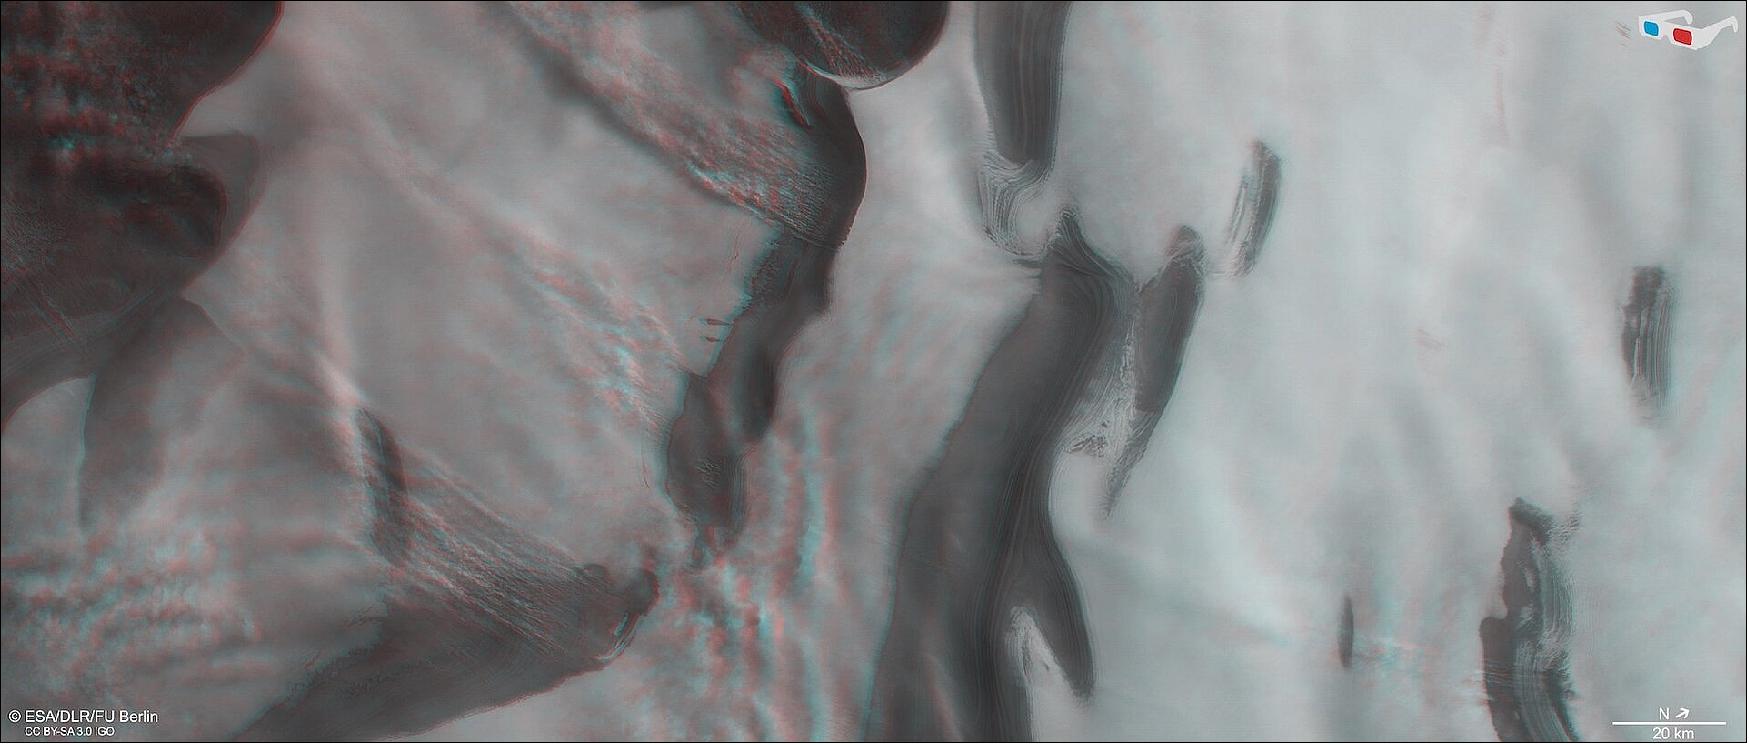
- These winds, known as katabatic winds, move cold, dry air downslope under the force of gravity, often originating in areas of higher elevation (such as glaciers or snow-covered plateaus) and flowing down into lower, warmer areas such as valleys and depressions. They are acted upon by the Coriolis force as they move, which causes them to deviate from a straight path and form the aforementioned spiral pattern we see.
- Visible to the left of the frame are a few extended streams of clouds, aligned perpendicularly to a couple of the troughs. These are thought to be caused by small local storms that kick up dust into the martian atmosphere, eroding scarps and slopes as they do so and slowly changing the appearance of the troughs over time.
- The poles, and any active processes taking place in these regions, are particularly interesting areas of Mars. These layers of ice hold information about Mars’ past, particularly concerning how its climate has evolved and changed in the last few millions of years: ice mixes with layers of surface dust and settles at the north and south poles, capturing a snapshot of the planet’s characteristics during that period of history.
- A key goal of HRSC is to explore the various phenomena occurring in the martian atmosphere, such as winds and storms, and the many intriguing geological processes that take place across – and below – the Red Planet’s surface.
- The camera has been returning impressively detailed views of Mars for many years. Mars Express arrived at the Red Planet in late 2003, and has revealed much about the planet and its history – including mapping its surface at resolutions of 10 m/pixel or greater, exploring how wet and humid early Mars may have been, characterizing its amazing volcanoes and bizarre surface features and geography, and probing deeper to determine the structure and components of its sub-surface.
- This aim of characterizing the entirety of the planet and its history will be continued and furthered by the ESA-Roscosmos ExoMars Trace Gas Orbiter, which arrived at Mars in 2016, and the ExoMars Rosalind Franklin rover and its accompanying surface science platform, which will arrive next year.
- This image is published to coincide with the Seventh International Conference on Mars Polar Science and Exploration, which is taking place in Argentina from 13 to 17 January 2020. This is the latest in a series of international and interdisciplinary conferences to share knowledge about the intriguing polar regions of the Red Planet.
Sensor Complement
Orbiter Instruments | PI (Principal Investigator) | Participating Countries |
HRSC (Super/High-Resolution Stereo Color Imager) | G. Neukum (DLR/FU (Freie Universität, Berlin) & Ralf Jaumann, DLR, Berlin, Germany | Germany, France, Russia, USA, Finland, Italy, UK |
OMEGA (IR Mineralogical Mapping Spectrometer) | J. P. Bebring, IAS, Orsay, France | France, Italy, Russia |
PFS (Planetary atmospheric Fourier Spectrometer) | V. Formisano, CNR, Frascati, Italy | Italy, Russia, Poland, Germany, France, Spain, USA |
MARSIS (Subsurface-Sounding Radar/Altimeter) | G. Picardi, Univ. of Rome, Italy | Italy, USA, Germany, Switzerland, UK, Denmark, France, Russia |
ASPERA-3 (Energetic Neutral Atoms Analyzer) | R. Lundin & S. Barabash, RFI, Kiruna, Sweden | Sweden, Germany, UK, France, Finland, Italy, USA, Russia, Ireland |
SPICAM (UV and IR Atmospheric Spectrometer) | J. L. Bertaux, CNRS, Verrières, France | France, Belgium, Russia, USA |
MaRS (Radio Science Instrument) | : Paetzold, University of Cologne, Germany | Germany, France, USA, Austria |
Lander Beagle 2 Instruments: |
|
|
Suite of imaging instruments, organic and inorganic chemical analysis, robotic sampling devices and meteorological sensors | C. Pillinger, Open University, UK | UK, Germany, USA, France, Switzerland, Russia, PRC (Peoples Republic of China), Austria, Spain |
The lander’s scientific payload totalled less than 10 kg, shared between six instruments and two dedicated tools to sample the surface and subsurface materials of Mars, plus a robotic sampling arm with 5 degrees-of-freedom. Two were mounted directly on the lander platform: the Gas Analysis Package and the Environmental Sensor Suite. The others were housed within an innovative structure called the Payload Adjustable Workbench (PAW) at the end of the robotic sampling arm: the Stereo Camera System, Microscope, X-ray Spectrometer and Mössbauer Spectrometer, together with a set of tools that included the Rock Corer Grinder, the PLanetary Underground TOol and other support equipment such as a sampling spoon, a torch and a wide-angle mirror. The PAW also carried one of the ESS sensors. The science-payload-to-landed-structure ratio is about 1/3, the highest so far of any planetary lander.
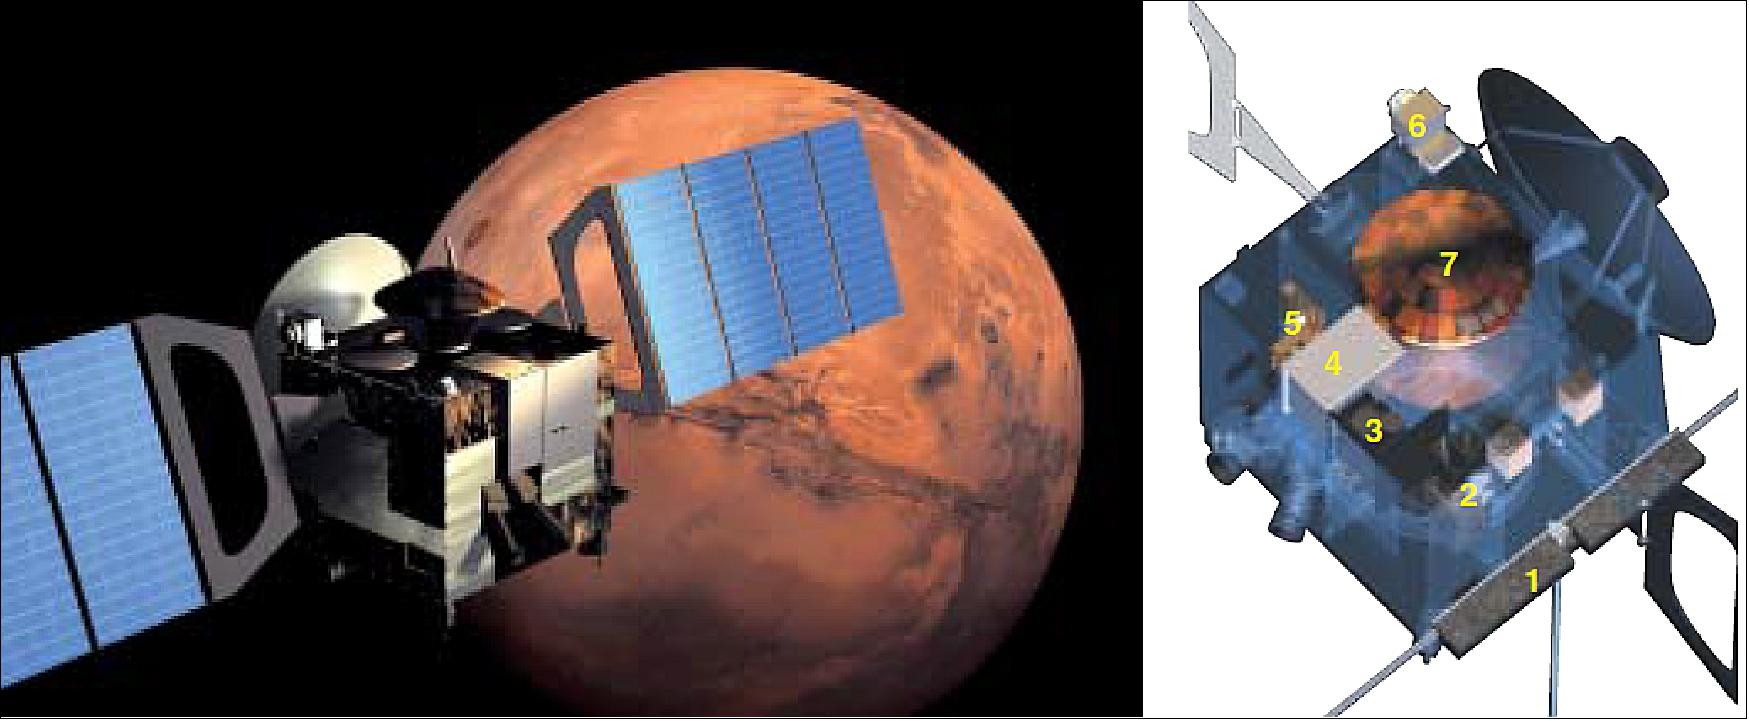
HRSC (High Resolution Stereo Camera)
The HRSC, originally developed for the Russian-led Mars-96 mission, was selected as part of the Orbiter payload for ESA’s Mars Express mission. The HRSC is a pushbroom scanning instrument with nine CCD line detectors mounted in parallel in the focal plane. Its unique feature is the ability to obtain near-simultaneous imaging data of a specific site at high resolution, with along-track triple stereo, four colors and five different phase angles, thus avoiding any time-dependent variations of the observational conditions. An additional Super-Resolution Channel (SRC) – a framing device – will yield nested images in the meter-resolution range for detailed photogeologic studies. The spatial resolution from the nominal periapsis altitude of 250 km will be 10 m/pixel, with an image swath of 53 km, for the HRSC and 2.3 m/pixel for the SRC. During the mission’s nominal operational lifetime of 1 martian year (2 Earth years) and assuming an average HRSC data transfer share of 40%, it will be possible to cover at least 50% of the martian surface at a spatial resolution of ≤ 15 m/ pixel. More than 70% of the surface can be observed at a spatial resolution of ≤ 30 m/pixel, while more than 1% will be imaged at better than 2.5 m/ pixel. The HRSC will thus close the gap between the medium- to low-resolution coverage and the very high-resolution images of the Mars Observer Camera on the Mars Global Surveyor mission and the in situ observations and measurements by landers. 46) 47) 48) 49)
The HRSC will make a major contribution to the study of martian geosciences, with special emphasis on the evolution of the surface in general, the evolution of volcanism, and the role of water throughout martian history. The instrument will obtain images containing morphologic and topographic information at high spatial and vertical resolution, allowing the improvement of the cartographic base down to scales of 1:50,000. The experiment will also address atmospheric phenomena and atmosphere-surface interactions, and will provide urgently needed support for current and future lander missions as well as for exobiological studies. The goals of HRSC on Mars Express will not be met by any other planned mission or instrument.
HRSC is a multi-sensor pushbroom instrument comprising multiple CCD (Charge Coupled Device) line sensors mounted in parallel for simultaneous high-resolution stereo, multicolor and multi-phase imaging of the martian surface. An additional Super Resolution Channel provides frame images embedded in the basic HRSC swath at five times greater resolution.
"The strength of HRSC is to perform high resolution digital terrain models of the martian surface in order to provide topographic context for the geoscientific evaluation of surface processes in space and time,” says Ralf Jaumann, HRSC Principal Investigator from the Institute of Planetary Research, DLR, Berlin, Germany.

Legend to Figure 107: The camera head is the light grey unit in the middle and the top rectangular aperture. The SRC (Super Resolution Channel) is the black cylindrical aperture at lower right. The camera head and SRC together measure 515 x 300 x 260 mm. The Digital Unit is the black box at the back. The complete HRSC has a mass of 20.4 kg and consumes about 48.7 W with both camera and SRC in operation.
The Camera Unit consists of: 50)
• The Instrument Frame, which is the supporting structure for the Camera Head and the SRC and provides thermal decoupling from the spacecraft and thermal stability
• The Camera Head, comprising the objective lens with its baffle and the optical bench, which serves as the central structure and connects the objective lens with the focal plate containing the Focal Plate Modules and the Front End Electronics
• The SRC (Super Resolution Channel), mounted within the Instrument Frame.
The Digital Unit comprises a power converter supplying the digital processing electronics and the sensor electronics, a signal interface to the spacecraft, an instrument control processor and a data compression unit, all mounted in a single enclosure.
High Resolution Camera Head: The High Resolution Camera Head contains the optics, the optical bench, the spectral filters, the CCD line sensors, the sensor electronics, and a thermal control system.
The optics are of Apo-Tessar objective design with a focal length of 175 mm and f = 5.6, and are mounted in a titanium housing. The transmissivity of the optics varies from 0.37 for the blue channel (440 nm) to 0.68 in the panchromatic range.
The HRSC Camera Head contains nine CCD line sensors mounted in parallel for operation in pushbroom mode. Pushbroom or linear array sensors image a line on the planet surface perpendicular to the ground track of the spacecraft and rely on the orbital motion of the spacecraft to reposition them as they record a sequence of images known as an image swath. HRSC simultaneously provides high-resolution stereo, multicolor and multi-phase images of the Martian surface by delivering nine superimposed image swaths.
The Camera Head sensor electronics consists of three Focal Plate Modules (FPM), each of which contains three CCDs including drivers and preamplifiers, and a Front End Electronics (FEE) unit comprising four signal chains, nine focal plate controllers and one power distribution unit.
Each of the nine CCD linear arrays is made up of 5184 seven-micron square pixels, which correspond to ten meter square pixels on-ground for a spacecraft altitude of 250 km. By multiplexing the nine CCD sensors, the signal can be switched into one of the four signal chains. Signal conditioning comprises low pass filtering, correlated double sampling and programmable attenuation and gain selection. The conditioned signals undergo analogue to digital conversion before being transmitted to the instrument's Digital Unit.
Super Resolution Channel: The Super Resolution Channel (SRC) consists of a set of optics, a CCD array detector and the associated signal electronics.
The SRC optical system is a Matsukov-Cassegrain telescope with a focal length of 972 mm, positioned with its axis parallel to the optical axis of the HRSC Camera Head. The SRC sensor is a CCD array of 1024 x 1032 with 9 µm square pixels, which correspond to 2.3 m square pixels on-ground for a spacecraft altitude of 250 km.
The SRC has a mechanical interface with the HRSC Camera Head and an electrical interface with the HRSC Digital Unit. It has no direct interface to Mars Express and is treated by the spacecraft as an additional HRSC channel.
Multi Sensor Concept: The multi sensor concept of the HRSC combines stereo, multispectral and multi-phase imaging. High-resolution images from the SRC can be embedded in the pushbroom images.
Stereo imaging is performed using nadir-directed, forward looking (+18.9°), and aft-looking (-18.9°) line sensors with a spectral range of 675 ± 90 nm. Known as triple panchromatic along-track stereo, this technique permits robust stereo reconstruction by on-ground digital processing and rectification through attitude reconstruction, feature matching and bundle adjustment, followed by the generation of digital terrain models and higher-level products. In general, the nadir-looking channel delivers the highest resolution images, while the two outer stereo channel images will be transmitted at lower resolution after pixel summation.
Multispectral imaging is implemented using four additional line sensors for the blue (440 ± 45 nm), green (530 ± 45 nm), red (750 ± 20 nm) and near infrared (970 ± 45 nm) color ranges. These color images cover the same areas as the panchromatic triple stereo images and will be matched geometrically to the nadir channel panchromatic swath by a process involving digital rectification through post-facto altitude reconstruction. In general, the multispectral images will be artificially decreased in spatial resolution by on-board pixel summation for lower data rates and better signal-to-noise characteristics, giving rise to data entities referred to as macro pixels.
Two additional panchromatic line sensors having inclined forward and backward viewing directions perform multi-phase imaging. These sensors complement the information contained in the triple stereo channels and allow the determination of photometric surface characteristics. The data from these channels will normally be transmitted at lower resolution by pixel summation.
The nine line sensing channels can be allocated to one of four signal chains. Each chain can be operated independently, offering great flexibility in the processing of the data.
When the SRC is operated, one of the four signal chains is dedicated exclusively to SRC and the line sensors use the remaining three signal chains.
Pushbroom Observations and Three Line Stereo Imaging: The Camera Head with its nine CCD line sensors is operated according to the pushbroom principle:
As the spacecraft moves along its ground track, all nine CCD line sensors are exposed for a chosen exposure time and at a selected scan frequency in such a way that a contiguous image strip, having no gaps between adjacent lines, is generated. The exposure time and the scan frequency are closely connected, with the readout time between adjacent lines being negligible. Nine independent image strips are generated. The size of an image strip is defined by the number of pixels per line and the acquisition duration. The cross track dimension (swath width) changes with spacecraft altitude whereas the along track size (strip length) is limited only by spacecraft resources such as memory available to store observation data and allocated downlink capacity.
In order to guarantee square pixels the scan frequency has to be varied with changing cross-track pixel size. Thus, the scan frequency depends on the cross track pixel size, which in turn depends on the spacecraft altitude. As a result the instrument data rate changes with spacecraft altitude, reaching its maximum at pericenter. The gain of the HRSC electronics is varied with the changing scan frequency in order to compensate for the variations in the amount of light reaching the CCDs as the exposure duration changes. For a spacecraft velocity over ground at pericenter of 4.3 km s-1 the scan frequency is 425 Hz. The scan frequency decreases as the spacecraft altitude increases.
During normal HRSC imaging, nadir pointing of the spacecraft is required. Off-track pointing, where the spacecraft is turned to position the instrument line-of-sight to one side of the ground track, may be used for the acquisition of special targets.
The nine CCD line sensors of the Camera Head are located behind a single optical system and each sensor sees the planetary surface with a different viewing angle, which forms the basis for stereo imaging.
Each image point is seen from three different viewing angles, forward-looking, nadir-direction and aft- looking. Given an accurate knowledge of the position and attitude of the spacecraft at the time of image acquisition, the absolute three-dimensional position of objects in the images can be calculated.
The distance on ground spanned by the stereo viewing angle (nadir to forward-looking or nadir to aft-looking, both 18.9º) is called base length. For in-track stereo reconstruction a minimum image strip length of three base lengths is required. At pericenter, this corresponds to an imaging duration of two minutes. To perform a robust stereo reconstruction over mosaics consisting of adjacent image swaths, a sideways overlap of about 20% of the swath width is required.
Parameter | HRSC | SRC | Remarks |
Mechanical and electrical parameters | |||
Instrument mass | 20.4 kg |
| |
Power consumption | 43.4 W | 5.3 W |
|
Electrooptical performance | |||
Optics | Apo-Tessar | Matsukov-Cassegrain telescope |
|
Focal length | 175 mm | 972 mm |
|
f number | 5.6 | 11 |
|
Stereo angle | -18.9º, 0º, +18.9º | - |
|
Along-track field of view | Stereo angle | 0.75º |
|
Across-track field of view | 11.9º | 0.75º |
|
Detector type | THX 7808B | Kodak KAI 1001 |
|
Detector pixel size | 7 x 7 µm | 9 x 9 µm |
|
Pixel size on ground | 10 x 10 m | 2.3 x 2.3 m | At 250 km altitude |
Pixel field of view | 8.25 arcsec | 2 arcsec |
|
Active pixels per sensor | 9 sensors x 5184 | 1024 x 1032 |
|
Image size on ground | 52.7 km swath x [time] | 2.4 km x 2.4 km | At 250 km altitude |
Radiometric resolution | 8 bits before compression | 14 bits or 8 bits |
|
Spectral filter wavelength ranges | |||
Panchromatic | 675±90 nm | - | Nadir, 2 stereo, 2 photometric |
Near-IR | 970±45 nm | - |
|
Red | 750±20 nm | - |
|
Green | 530±45 nm | - |
|
Blue | 440±45 nm | - |
|
Operations | |||
Pixel exposure time | 2.24 - 54.5 ms | 0.5 - 50,000 ms |
|
Image size | 53 x 330 km | 2.4 x 2.4 km | Typical value |
Data volume per image | 230 Mbit | 8 or 14 Mbit | Typical value |
Data volume per day | ~ 1 Gbit | Typical value | |
Operations duration | 3-40 minutes | Typical value | |
Planetary coverage | ≥ 50% at ~15 m pixel size | > 1% at ~ 2 - 3 m pixel size |
|
ASPERA-3 (Analyzer of Space Plasmas and Energetic Atoms)
The ASPERA-3 instrument of Mars Express is designed to study the solar wind-Mars atmosphere interaction and to characterize the plasma and neutral gas environment in near-Mars space through energetic neutral atom (ENA) imaging and local charged-particle measurements. The studies address the fundamental question: how strongly do the interplanetary plasma and electromagnetic fields affect the martian atmosphere? This question is directly related to the problem of martian dehydration. 51) 52)
The scientific objectives of the Mars Express Orbiter mission are to study the subsurface, surface and atmosphere of Mars, as well as the interaction of the atmosphere with the interplanetary medium. ASPERA-3 will fulfil the last objective by:
- remote measurements of energetic neutral atoms (ENAs) in order to (a) investigate the interaction between the solar wind and the martian atmosphere, (b) characterize quantitatively the impact of plasma processes on atmospheric evolution, and (c) obtain the global plasma and neutral gas distributions in the near-Mars environment;
- in situ measurements of ions and electrons to (a) complement the ENA images (electrons and multi-charged ions cannot be imaged), (b) study local characteristics of the plasma (dynamics and fine structure of boundaries), (c) provide the undisturbed solar wind parameters required for interpreting ENA images.
The ASPERA-3 (Analyzer of Space Plasmas and Energetic Atoms) instrument is made up of two components:
• the Main Unit, comprising the mechanical scanner, digital processing unit (DPU), Neutral Particle Imager (NPI), Neutral Particle Detector (NPD) and Electron Spectrometer (ELS)
• the Ion Mass Analyzer (IMA), mounted separately.
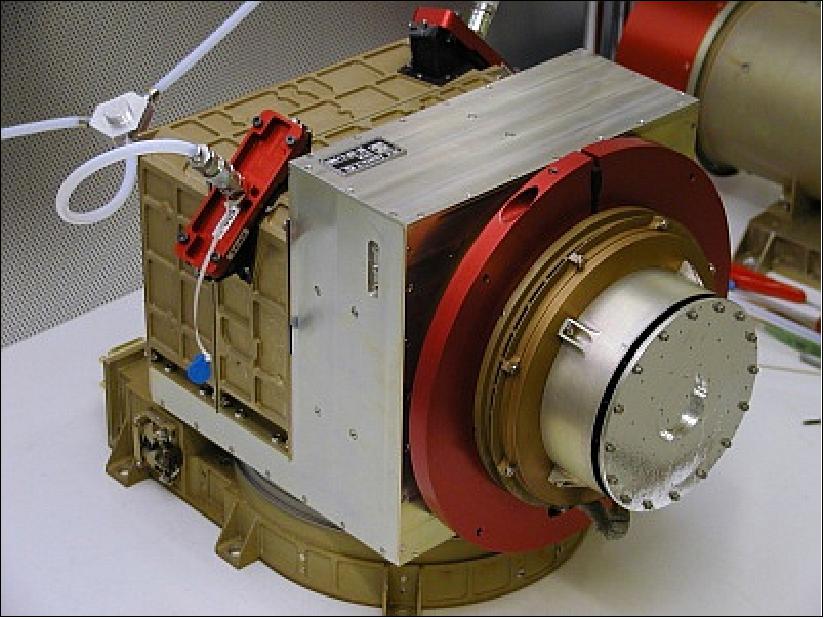
Mechanical Scanner: The mechanical scanner sweeps the three sensors mounted on it through 180 degrees to give the ASPERA-3 instrument 4π steradians (unit sphere) coverage when the spacecraft is 3-axis stabilized. The scanner is equipped with two stepper motors, which turn a worm screw. The screw drives a worm wheel, which is attached to the moving part of the scanner. The scanner payload can be turned to any arbitrary angle or perform continuous scanning. The operational rotation rates are 1.5, 3.0 and 6.0 degrees per second. The system offers an angular positioning accuracy of 0.2 degrees.
Digital Processing Unit: The Digital Processing Unit's main task is to control the sensors and the mechanical scanner. The DPU processes, compresses and stores the sensor data and forwards it (together with housekeeping data) to the spacecraft telemetry system. It also receives and implements commands sent to the ASPERA-3 instrument by the spacecraft telecommand system.
The primary design drivers for the Digital Processing Unit (DPU) are optimum use of the allocated telemetry rate and correct handling of telecommands. The ASPERA-3 instrument makes extensive use of sophisticated lossless data compression to enhance the scientific data yield. The principal compression method used is based on the Rice algorithm, an adaptive compression technique that remains efficient over a wide range of input data entropy conditions. This is achieved by employing multiple encoders, each of which is optimized to compress data in a particular entropy range. The structure of the algorithm also permits a simple interface to data packetization schemes, such as those used for space data communications, without the need to carry auxiliary information across packet boundaries.
Neutral Particle Imager: In the Neutral Particle Imager, incoming particles pass between two 150 mm diameter discs, which are separated by 3 mm and have a 5 kV potential between them. Charged particles are deflected by the electric field and captured, but neutral particles pass between the discs. The space between the discs is divided into 32 sectors by plastic spokes, forming 32 azimuth collimators with an aperture of 9 degrees by 18 degrees each. Neutrals that pass through the deflector system hit a 32-sided conical target at a grazing angle of incidence (20 degrees). The interaction between the neutral particles and the target results in production of secondary electrons and ions, and / or reflection of the primary neutrals. The particles leaving the target are detected by a Micro Channel Plate (MCP) stack with 32 anodes. The signal from the MCP gives the direction of the primary incoming neutral particle. The MCP is operated in such a way as to detect sputtered ions of the target material, ions resulting from stripping of the primary neutrals and neutrals reflected from the target surface. In order to improve the angular resolution and collimate the particles leaving the interaction surface, 32 separating walls are attached to the target, forming a star-like structure. This configuration allows the particles to experience multiple reflections and reach the MCP. The target is specially coated to prevent incoming ultraviolet photons that strike it from producing erroneous results.
The Neutral Particle Imager covers 4π steradians in one 180º sweep by the mechanical scanner and produces an image of the ENA distribution in the form of an azimuth x elevation matrix. The direction vector of 32 elements is read out once every 62.5 ms.
Neutral Particle Detector: The Neutral Particle Detector consists of two identical pinhole cameras each with a 90º Field of View (FoV) in the instrument azimuth plane and arranged to cover a FoV of 180º. Particles approaching the pinholes pass between a pair of quadrant deflector plates separated by 4.5 mm and with and 8 kV potential between them. Charged particles with energies up to 70 keV are deflected, while neutrals proceed into the camera. The deflector plates also function as a collimator in the instrument elevation direction.
The collimated Energetic Neutral Atom (ENA) beam emerging from the 4.5 x 4.5 mm pinhole hits a target at a grazing angle (20 º) and causes secondary electron emission. The secondary electrons are detected by one of two Micro Channel Plate (MCP) electron multiplier assemblies. The MCP output provides a start signal to the electronics that measures the time of flight of the ENAs over a fixed distance. The incoming ENAs are reflected from the target nearly specularly and travel to a second target. Again, secondary electrons are produced and detected by three more MCPs, which pass a stop signal to the time of flight electronics. The time of flight between the two targets gives the velocity of the incoming particle. Which of the three 'stop' MCPs detects the incoming particle determines its (instrument relative) azimuth direction.
Since secondary electron yield depends on both incident particle mass and velocity, the mass can be determined, given that the velocity is known, by analyzing the height distribution of the pulses from the MCPs.
The effects of ultraviolet radiation are suppressed by coating the targets appropriately and checking for coincidence between the start and stop signals used for the time of flight calculations.
As the mechanical scanner moves the NPD through 180º, a 2π steradians (half sphere) coverage of the incident particle field is obtained.
Electron Spectrometer: The Electron Spectrometer determines the energy spectrum of incoming electrons in each of sixteen 22.5º sectors.
The Electron Spectrometer is based around a spherical section electrostatic analyzer of 'top hat' design. The electrostatic analyzer consists of two concentric hemispherical electrodes, the outer of which has a central hole, through which electrons are admitted, covered by the 'top hat' and collimator. Electrons arriving from any azimuth angle and within the elevation field of view of the collimator pass under the 'top hat' and are deflected through the central hole in the outer hemisphere by a positive potential on the inner hemisphere. The electrostatic field between the hemispheres will deflect electrons having an energy in a particular range such that they travel between the electrodes. Electrons with energies outside the selected range will be captured.
These energy band filtered electrons exit the annular gap between the hemispheres and hit a Micro Channel Plate (MCP) electron multiplier. Beyond the MCP, the electrons strike one of sixteen anodes, each defining a 22.5º sector of incident azimuth angle.
By varying the electrostatic potential between the hemispheres of the electrostatic analyzer, the energy of the electrons selected by the filter can be changed. The voltage applied to the inner hemisphere is swept once every four seconds and the number of anode hits per sample interval is recorded to give an energy spectrum for the incoming electrons in each sector. As the ELS sensor is moved through 180º by the mechanical scanner, a complete 4π steradians (whole sphere) angular distribution of electrons is measured.
Ion Mass Analyzer: The Ion Mass Analyzer determines the mass spectrum of incoming ions in a selectable energy range. The mass range and resolution of the spectrum are also selectable.
Ions arriving at the IMA pass through an outer, grounded grid and enter the deflection system. The deflection system comprises two curved, charged plates that deflect ions arriving in the instrument elevation range from 45º above to 45º below instrument azimuth plane and from any azimuth angle into the entrance of the electrostatic analyzer.
The electrostatic analyzer consists of two concentric hemispheres with a variable electric field between them. Ions that lie within the energy pass band of the analyzer travel between the hemispheres, exit the annular space separating them, and travel on towards the magnetic mass analyzer. The electrostatic potential between the hemispheres determines the energy range of the ions that pass through the analyzer.
In the magnetic mass analyzer, the ions pass through a static, cylindrical magnetic field, which deflects light ions towards the center of the cylinder more than heavy ones. An electrostatic potential can be applied between the electrostatic analyzer and the magnet assembly to accelerate the ions. Varying this potential allows selection of the mass range to be analyzed and the mass resolution.
As the ions leave the magnetic mass analyzer they hit a Micro Channel Plate (MCP). The electrons exiting the MCP are detected by an imaging anode system. A system of 32 concentric rings measures the radial impact position, which corresponds to ion mass and 16 sector anodes measure azimuthal impact position, which corresponds to ion azimuth angle.
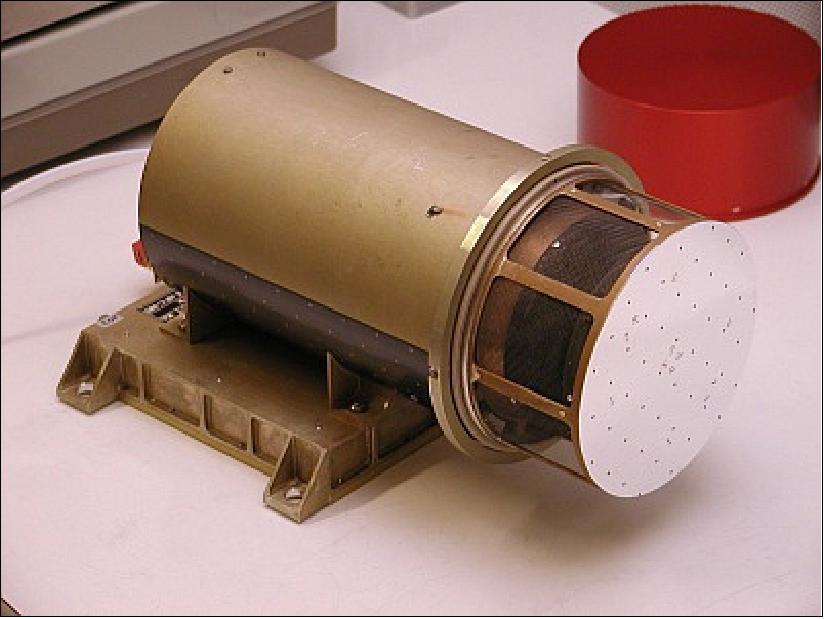
PFS (Planetary Fourier Spectrometer)
From space and Earth-based observations so far, we know that the Martian atmosphere is about one hundred times less dense than the Earth's at ground level, that it's composed almost entirely of carbon dioxide (CO2) with trace to small amounts of other gases, and that atmospheric temperatures range from 298 K (+25°C) at the equator to 140 K (-130° C) at the winter pole. We also know that the atmosphere contains a lot of dust. 53) 54)
But there are many gaps in our knowledge. We still don't know, for example, how temperature and pressure vary with altitude, what the global circulation patterns are, how the composition of the atmosphere varies with time and place, and what all the trace constituents are. We also don't know for sure how much dust there is in the atmosphere, how it's transported there, what it's made of and how it affects the Martian weather. The Planetary Fourier Spectrometer (PFS) on board Mars Express will help find the answers to some of these outstanding questions.
PFS is an infrared spectrometer optimized for atmospheric studies and covering the wavelength range 1.2 to 45 µm in two channels with a boundary at 5 µm. The spectral resolution of the instrument is better than 2 cm-1. The instrument field of view is about 2º FWHM (Full Width, Half Maximum) for the Short Wavelength (SW) channel and 4º FWHM for the Long Wavelength (LW) channel. These fields of view correspond to a spatial resolution of ten kilometers for the SW channel and 20 kilometers for the LW channel when Mars is observed from a height of 300 kilometers (the nominal height of the pericenter). 55)
PFS is equipped with a pointing device, which enables it to receive incoming radiation from the surface of Mars or to perform calibration measurements by pointing to a reference black body of known temperature or to deep space.
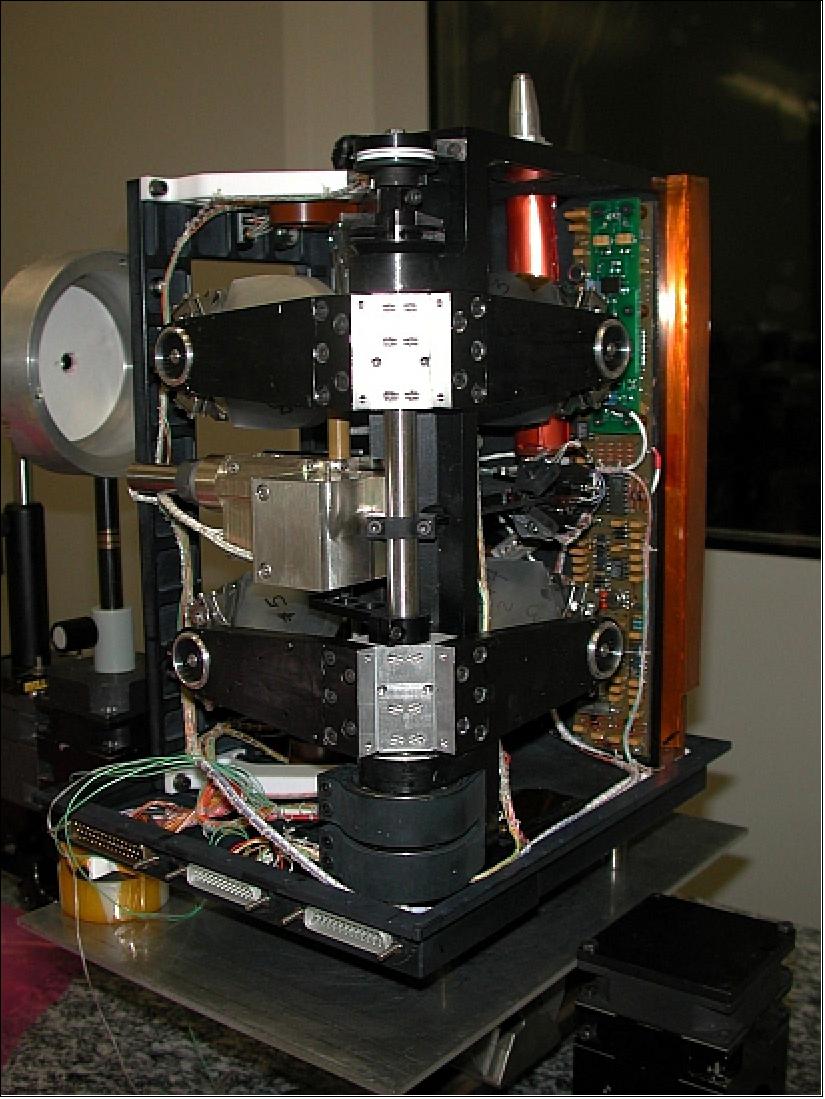
The incident radiation arrives from the pointing device and is divided into two beams by a dichroic mirror and then filtered before being directed into the two interferometers. The interferometers are of the double pendulum type and are positioned with their planes of operation one above the other so that a single motor can be used to move both pendulums. An optical reference channel controls the pendulum motion by passing light from a laser diode through the same optics as the radiation that is being analysed. The reference channel also generates the sampling signal for the analogue to digital converters that process the detector signals, triggering one sample for each 150 nm of retro-reflector motion. The interferometers are extremely sensitive to optomechanical distortions and the interferometer module must be very rigid and thermally stable to minimise these effects.
The instrument is able to perform real time Fast Fourier Transform computations in order to select the spectral range of interest for data transmission to Earth
Item | Parameter | Short Wavelength Channel | Long Wavelength Channel |
General | Spectral range | 1.2-5.0 µm | 5.0-45 µm |
| Spectral range | 2000-8000 cm-1 | 230-2000 cm-1 |
| Spectral resolution | 1.5 cm-1 | 1.5 cm-1 |
| FOV (Field of View) | 2º | 4º |
Detectors | Type | Photoconductor | Pyroelectric |
| Material | Lead selenide (PbSe) | Lithium tantalate (LiTaO3) |
| Shape/size | Square / 0.7 x 0.7 mm | Circular / 1.4 mm (diameter) |
| Operating temperature | 220 K | 290 K |
Interferometer | Type | Double pendulum | |
| Reflecting elements | Cubic corner reflectors | |
| Beam splitter | Calcium Fluoride (CaF2) | Caesium Iodide (CsI) |
| Max optical path difference | 5 mm | 5 mm |
| Reference source | Laser diode | |
Collecting optics | Type | Parabolic mirror | |
| Diameter | 49 mm | 38 mm |
| Focal length | 20 mm | 20 mm |
| Coating | Gold | |
| Channel separator | Thallium bromide/iodide (KRS-5) crystal with multi-layered | |
Interferogram | Type | Two sided | |
| Sampling number | 16384 | 4096 |
| Sampling step | 608 nm | 2432 nm |
| Dynamic range | ± 215 | |
OMEGA (Observatoire pour la Minéralogie, l'Eau, les Glaces et l'Activité)
The Visible and Infrared Mineralogical Mapping Spectrometer (OMEGA) builds up maps of the surface mineral composition from the visible and infrared light reflected from the planet's surface in the wavelength range of 0.5-5.2 µm. As the light reflected from the surface passes through the atmosphere before entering the instrument, OMEGA also measures the atmospheric composition.
"We want to know the iron content of the surface, the water content of the rocks and clay minerals and the abundance of non-silicate materials such as carbonates and nitrates. These measurements would allow us to reconstruct the history of the planet," says Jean-Pierre Bibring, OMEGA Principal Investigator from the Institut d’Astrophysique Spatiale, Orsay, France. 56) 57) 58)
OMEGA, derived from the Mars-96 spare model, is a visible and near-IR mapping spectrometer operating in the wavelength range 0.38-5.1 µm. It will provide global coverage of Mars by the end of the nominal mission at medium resolution (1-5 km) from orbital altitudes between 1000 km and 4000 km, and higher-resolution (a few hundred meters) snapshots of selected areas, amounting to at least a few percent of the surface. OMEGA is characterizing the composition of surface materials, studying the time and space distribution of atmospheric CO2, CO and H2O, identifying the aerosols and dust particles in the atmosphere, and monitoring the surface dust transport processes. It is contributing greatly to understanding the evolution of Mars from geological time scales to seasonal variations and is giving unique clues for understanding the H2O and CO2 cycles throughout martian evolution.
We have little more than a general knowledge of the surface composition of Mars. The north is made largely of a silica-rich volcanic rock (felsic) and the south of basaltic rock relatively poor in silica (mafic); the soil and surface layer of exposed rocks contains oxides of iron, which give the planet its reddish color. Going beyond this general description to identify particular minerals or elements at particular points on the surface, has so far proved beyond the scope of remote-sensing instruments. None has yet flown with sufficient spatial resolution for the task. That will change, however, when Mars Express carries the Infrared Mineralogical Mapping Spectrometer (OMEGA) into Martian orbit. 59)
Using the fact that different materials absorb and radiate light at different wavelengths, OMEGA will build up a map of surface composition by analyzing sunlight that has been absorbed and re-emitted by the surface. The instrument will also glean information on the composition from the wavelengths of infrared radiation given off as the surface cools. As radiation travelling from the surface to the instrument must pass through the atmosphere, OMEGA will also detect wavelengths absorbed by some atmospheric constituents, in particular dust and aerosols.
The OMEGA instrument has a mass of 29 kg.
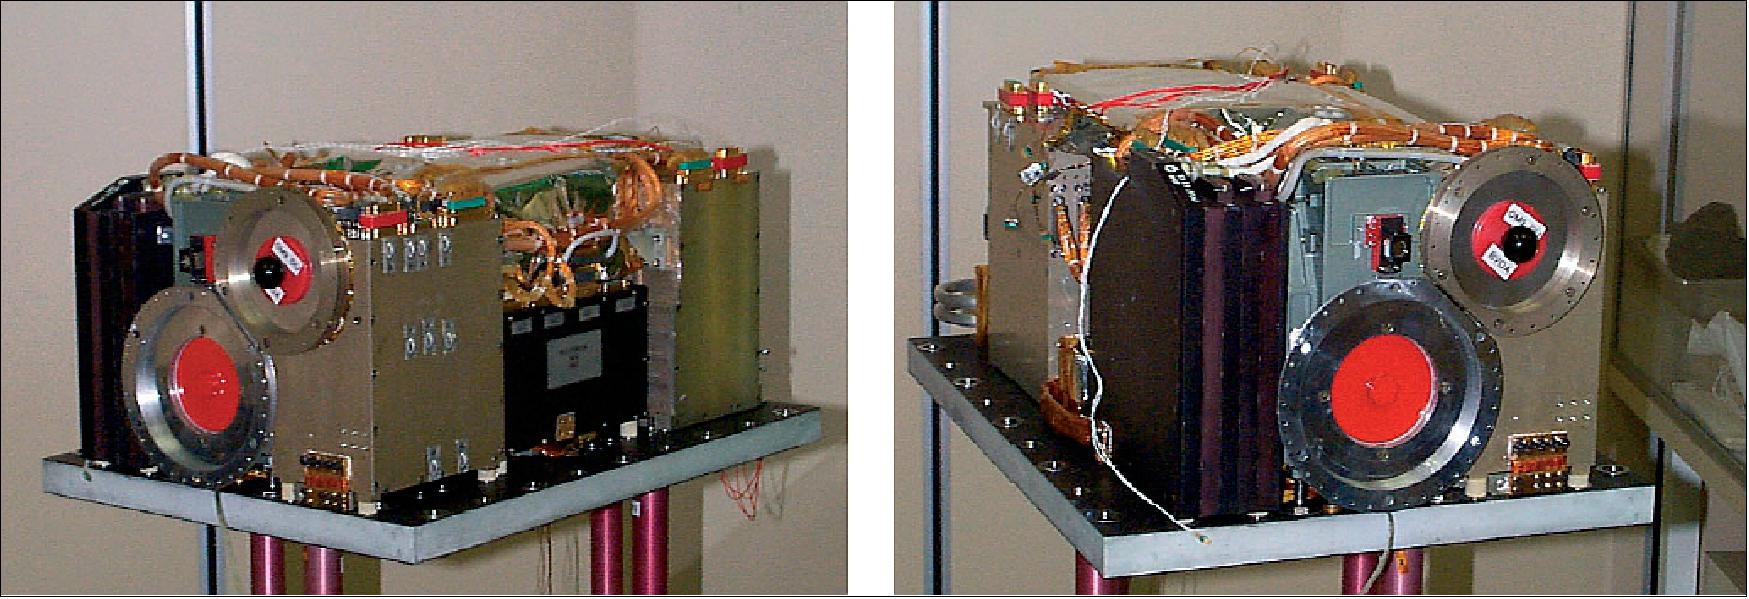
As Mars Express proceeds along its orbit, OMEGA will gradually build up a map of the planet in squares, or pixels, whose sides range from 4 km to 300 m in length. During the mission's lifetime, a spectral map of the entire surface will be generated at 1-4 km resolution and selected sites, making up 2-5% of the Martian surface, will be mapped at 300 m resolution. The higher resolution is available only when the spacecraft is at the lowest point in its orbit, hence its restriction to a limited area of the Martian surface. "In each channel, we make a spectrometer and an imager and couple the two. On each resolved pixel, we will have the entire spectrum from the visible to the IR," says Jean-Pierre Bibring from the IAS (Institut d'Astrophysique Spatiale), Orsay, France and Principal Investigator for OMEGA.
OMEGA's high spatial resolution is unprecedented. This and its spectral range give it the ability to pinpoint specific minerals on Mars more accurately than any instrument on a previous spacecraft. "We want to see not only that there are silicates, but to determine their class - whether they are in the form of feldspar, pyroxene, olivine, for example. We also want to know the iron content of the surface, the oxidation level of the iron, the hydration of the rocks and clay minerals and the abundance of non-silicate materials such as carbonates and nitrates. We'll be able to measure all these abundances to within a few per cent within a 100 m square," says Bibring.
Such knowledge of the composition will throw light on many of the outstanding puzzles about Mars. Our understanding of the tectonic history of the planet, for example, will deepen with more accurate knowledge of the whereabouts and composition of igneous rocks (rocks that have been molten in the interior of the planet). Accurate measurements of dust on the surface and in the atmosphere will illuminate present day wind patterns and patterns of dust transport. And climate history and present day weather patterns will be revealed in accurate measurements of the water and carbon dioxide content of the polar caps, which varies with the seasons. Some of the most interesting riddles OMEGA will help unravel, however, have to do with the history of water on the planet and the possibility that Mars was once hospitable to life.
"Two of the big questions we have about Mars are: where is the carbon dioxide? and what happened to the water? "says Bibring. "There's carbon dioxide in the atmosphere, but the pressure's very low. So either Mars has lost its carbon dioxide, or it is now in the rocks in the form of carbonates. If the carbon dioxide is in the rocks, there must have been liquid water in the past."
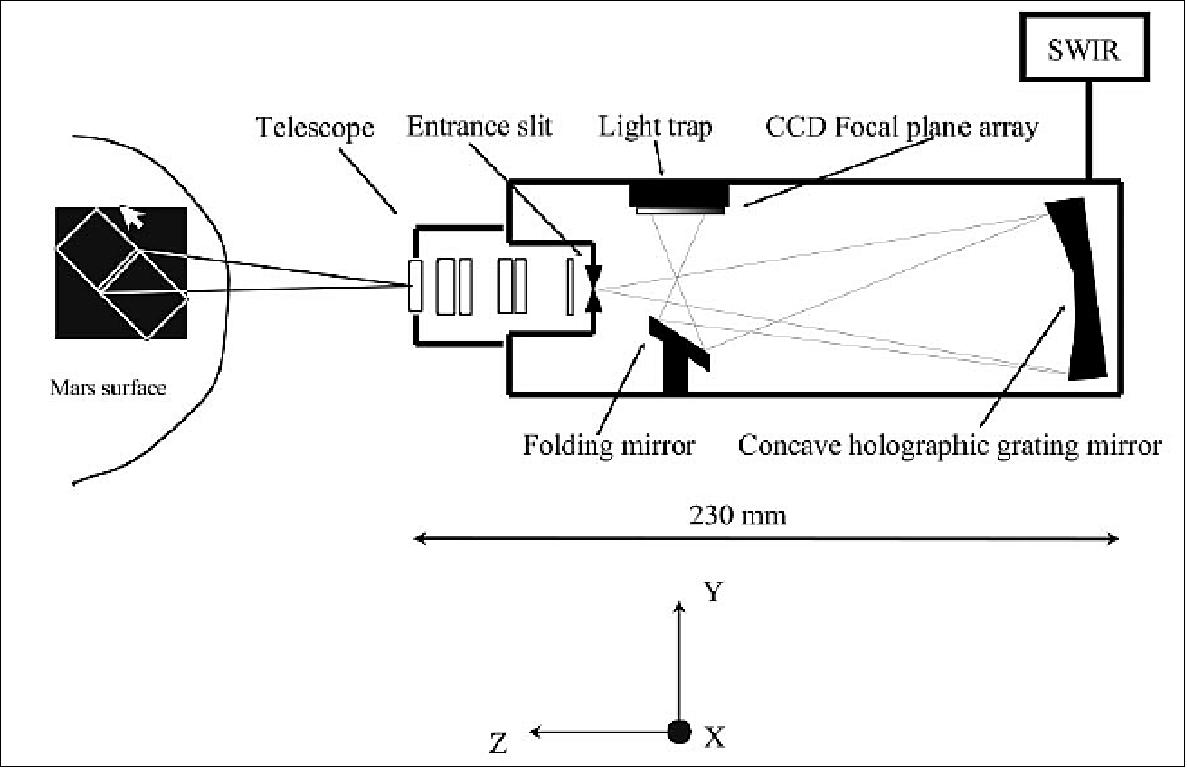
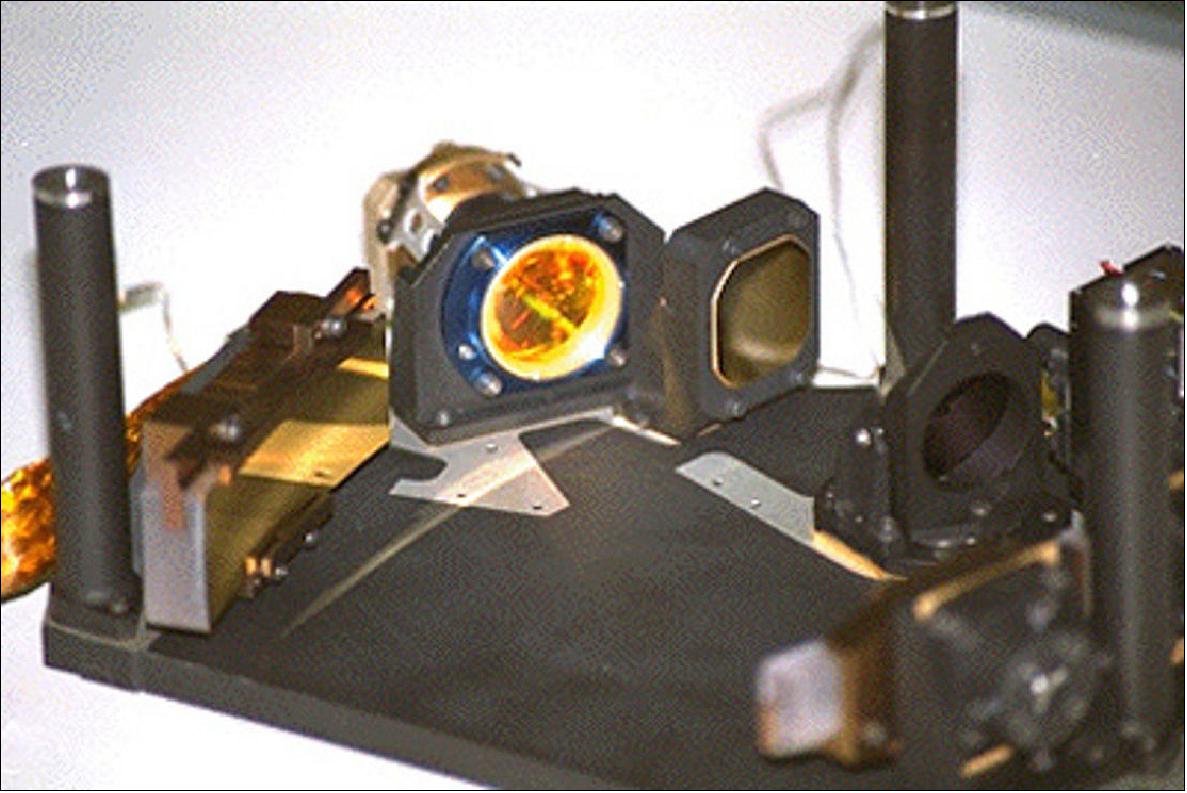
The instrument comprises two grating spectrographs, one working in the visible and near infrared range (VNIR channel), the other in the short wavelength infrared range (SWIR channel). 60)
The OMEGA instrument is made up of two main components:
• A Camera unit (OMEGA-CAMERA or OMEC) comprising the VNIR and SWIR spectrographs and their associated signal electronics
• A Main Electronics (OMEGA-ME or OMEM) module responsible for the control and management of the instrument
Imaging capability | 128 contiguous, across track fields of view, each of 1.2 mrad, corresponding to < 500 m at periapsis |
Spectral capability | 352 contiguous spectral channels to acquire the entire spectrum from 0.36 to 5.2 µm for each resolved pixel |
Photometric capability | SNR > 100 over the full spectral range, allowing the identification of percentage absorptions and thermal variations |
VNIR (Visible and Near Infrared) channel
The VNIR channel is based on a push-broom imaging concept with a two-dimensional silicon charge coupled device (CCD) detector and a telescope covering an 8.8° total field of view that is defined by a slit placed in the focal plane of the telescope. Target radiation leaving the slit is dispersed onto the detector by a concave holographic diffraction grating. The spectrum of a pixel area on the observed target is dispersed along a column of the detector array while spatial resolution in the direction of the spectrograph slit is obtained across the lines of the array. The spectrograph slit is oriented perpendicular to the spacecraft track so the motion of the spacecraft provides the second spatial dimension of the image. During one exposure interval, the full spectrum of every spatial pixel along the slit is obtained. Successive exposures are combined as the spacecraft moves, with the exposure times selected so that a contiguous image swath at the desired resolution is obtained.
Entrance optics | Telescope | Refractive, double Gauss objective |
Aperture | 15.6 mm | |
f number | 3.7 | |
FOV (Field of View) | 0.154 rad | |
Slit width | 50 µm | |
Spectrometer | Dispersive element | Concave holographic mirror grating |
Groove density | 65 mm-1 | |
Dispersion | 1071 Å mm-1 | |
Grating size | 40 x 10 mm | |
Detector | Type | Silicon CCD, Thomson TH 7863 |
Size | 384 x 288 pixels | |
Pixel size | 23 x 23 µm | |
Maximum spatial resolution per pixel | 0.4 mrad | |
Instrument | Spectral range | 0.36 - 1.05 µm |
Spectral resolution | 70 - 200 λ/Δλ | |
Dynamic range | 12 bit |
SWIR (Short Wavelength Infrared Range) channel
The SWIR channel of the camera has two sub-channels fed by a common telescope, slit and collimator. The collimator output beam is split into two parts by a dichroic filter, covering the 0.93 - 2.77 µm and 2.65 - 5.2 µm wavelength bands. The filtered collimator outputs are dispersed by two blazed, flat diffraction gratings operating at the first order. The dispersed slit images are re-imaged onto the detectors by two sets of optics (one per sub-channel), comprising spherical collecting mirrors, spherical field mirrors and objectives composed of four zinc selenide (ZnSe) lenses. Each sub-channel employs an indium antimonide (InSb) photovoltaic linear array detector with 128 pixels, cooled down to approximately 77 K by a Stirling cycle micro cooler.
The use of linear arrays as detectors leads to the use of a whiskbroom-imaging concept. A scanning mirror gives the cross-track field of view and the spacecraft along-track motion provides the second spatial dimension for the images.
|
| 0.93 - 2.77 µm sub-channel | 2.65 - 5.2 µm sub-channel |
Telescope | Type | Cassegrain | |
Focal length | 200 mm | ||
f number | 4 | ||
Primary mirror | Parabolic, 55 mm diameter | ||
Secondary mirror | Hyperbolic, 20.5 mm diameter | ||
Spectrometer | Dispersive element | Blazed reflective grating | Blazed reflective grating |
Groove density | 180 mm-1 | 120 mm-1 | |
Incidence angle | -6.5º | -10.6º | |
Blaze wavelength | 1.7 µm | 3.8 µm | |
Detectors | Type | Photovoltaic linear array | |
Material | Indium antimonide (InSb) | ||
Size | 128 pixels | ||
Pixel size | 90 x 120 µm | ||
Pixel pitch | 120 µm | ||
Instrument | Cross-track field of view | 8.8º | |
Spectral resolution | 13-20 nm | ||
Dynamic range | 12 bit | ||
MARSIS (Mars Advanced Radar for Subsurface and Ionosphere Sounding)
MARSIS is a low frequency, nadir-looking pulse limited radar sounder and altimeter with ground penetration capabilities, which uses synthetic aperture techniques and a secondary receiving antenna to isolate subsurface reflections. 61) 62) 63)
The operation altitudes for MARSIS are up to 800 km above the Martian surface for subsurface sounding and up to 1200 km for ionospheric sounding. In its standard operating mode, the instrument is capable of making measurements in 1 MHz wide bands centered at 1.8, 3.0, 4.0 and 5.0 MHz.
MARSIS functions by transmitting a linear frequency modulated chirp using a nadir-looking dipole antenna. The return signal is received on both the dipole antenna and a secondary monopole antenna oriented along the nadir axis. The secondary antenna has a null in the nadir direction and receives primarily the off-nadir surface reflections. This signal can be subtracted from the main received signal during ground processing to reduce surface clutter. Both received signals are down converted to range offset video signals before being passed to an analogue to digital converter. The resultant data are formatted by the MARSIS on-board digital processor and passed to the spacecraft for transmission to Earth.
MARSIS operates in the following modes:
• Subsurface Sounding
• Active Ionospheric Sounding
• Receive Only
• Calibration
MARSIS will perform Subsurface Sounding when the spacecraft is less than 800 km above the Martian surface. In the highly eccentric orbit selected for Mars Express, this corresponds to a period of about 26 minutes, allowing mapping of about 100 degrees of arc on the Martian surface per orbit. Over the nominal mission lifetime, extensive coverage at all latitudes will be possible. To achieve this global coverage MARSIS supports both dayside and nightside operations, although performance is maximized during the night (solar zenith angle above 80 degrees) when the ionosphere plasma frequency drops significantly and the lower frequency bands, which have greater ground penetration capabilities, can be used.
Active Ionospheric Sounding will be carried out during certain orbital passes when the orbiter is less than 1200 km above the surface, in order to gather scientific data on the Martian ionosphere.
Receive only mode will mainly be used to characterize, from an electromagnetic point of view, the environment in which MARSIS is working.
MARSIS will be operated in calibration mode periodically throughout the operational phase of the mission. The purpose of this mode is to acquire a limited amount of data in an unprocessed format. The unprocessed data is used to determine the characteristics of the adaptive matched filter computation that is used by the MARSIS processor to compress the dispersed echo signals from the planet surface and subsurface boundaries.
MARSIS is composed of three subsystems:
• The antennas
• The RF equipment (transmitter and receivers)
• The digital electronics
The receivers and digital electronics are housed together within the spacecraft. The transmitter electronics is housed in a separate box, also within the spacecraft.
The main transmit and receive antenna is a deployable dipole with two 20 meter elements, arranged so that its peak gain is in the spacecraft nadir direction. The clutter cancellation antenna is a seven meter long deployable monopole, arranged so that its gain null is in the spacecraft nadir direction. The clutter cancellation antenna is equipped with a low-noise preamplifier. Due to severe limitations on the available mass, the antennas are of a novel design, each consisting of a folding composite tube that supports a pair of wires constituting the conductive element of the antenna. The antennas are deployed by pyrotechnic release mechanisms.
The transmitter is connected to the primary antenna through an impedance matching network. The nominal operating frequency of the transmitter in the subsurface sounder modes is 1.3 to 5.5 MHz, with an instantaneous bandwidth of 1 MHz. For ionospheric sounding, the operating frequency varies between 0.1 and 5.4 MHz. The transmitter takes the chirp generated by the receiver/local oscillator electronics and amplifies it, delivering 5 W of RF power to the antenna.
The receiver electronics consists of the chirp generator/local oscillator and a dual channel receiver that down converts the received echoes. Each receiver channel has a selectable bandpass filter, a mixer, an amplifier chain, low-pass filtering and an analogue to digital converter. The output of the analogue to digital converters is passed to the digital electronics for processing prior to being sent to the ground station via the spacecraft's on-board data handling system.
The digital electronics is responsible for:
• Synthesis of the transmit chirp and local oscillator signals
• Control of the transmitter and receivers
• Processing of the digital data from the receivers
• Receipt and execution of telecommands from the spacecraft
• Transmission of formatted science, event and housekeeping data to the spacecraft.
MaRS (Mars Radio Science Experiment)
MaRS will perform the following experiments: 64) 65)
• Radio sounding of the neutral Martian atmosphere (occultation experiment) to derive vertical density, pressure and temperature profiles as a function of height, with a height resolution better than 100 meters.
• Radio sounding of the ionosphere (occultation experiment) to derive vertical ionospheric electron density profiles and to derive a description of the global behavior of the Martian ionosphere through its diurnal and seasonal variations depending also on solar wind conditions.
• Determination of dielectric and scattering properties of the Martian surface in specific target areas by a means of a bistatic radar experiment.
• Measurement of gravity anomalies in conjunction with simultaneous observations using the HRSC (High Resolution Stereo Camera) to construct a three-dimensional topographical model for the investigation of the structure and evolution of the Martian crust and lithosphere.
• Precise determination of the mass of the moon Phobos.
• Radio sounding of the solar corona during the superior conjunction of the planet Mars with the Sun.
The spacecraft Telemetry, Tracking and Command (TT&C) radio links between the orbiter and the Earth will be used for these investigations. A simultaneous and coherent dual-frequency downlink at X-band and S-band via the High Gain Antenna (HGA) is required to separate the contributions from the classical Doppler shift and the dispersive media effects caused by the motion of the spacecraft with respect to the Earth and the propagation of the signals through the dispersive media.
The experiment relies on the observation of the phase, amplitude, polarization and propagation times of radio signals transmitted from the spacecraft and received at ground station antennas on Earth. The radio signals are affected by the medium through which the signals propagate (atmospheres, ionospheres, interplanetary medium, solar corona), by the gravitational influence of the planet on the spacecraft and finally by the performance of the various systems involved both on the spacecraft and on ground.
Radio sounding of the atmosphere and ionosphere: As the spacecraft is entering and exiting occultation by Mars as seen from the Earth, the TT&C radio beam slices through the layers of the ionosphere and neutral atmosphere. The TT&C system is operating in the two-way mode, which means that the downlink frequencies are derived from the received uplink frequency. Changes in the received radio frequency measured with an accuracy of one part in 10-13 correspond to the detection of a change in the angle of refraction of radio rays in occultation experiments of the order of 10-8 radians.
The separation of the effects of the ionosphere and the neutral atmosphere on the radio link is feasible by using a dual-frequency downlink and due to the fortunate fact that the peak height of the ionosphere and the limit of the detectable neutral atmosphere are well separated in height.
Bistatic radar investigation of planetary surface properties: The bistatic radar configuration is distinguished from the monostatic by spatial separation of the transmitter (the spacecraft) and the receiver (ground station on Earth). It is a powerful tool for providing information about surface texture (roughness and slope) on scales comparable with the sensing wavelength (of the order of centimeters to meters). Bistatic radar may also be used to determine properties of the surface material, such as dielectric constant, through differential reflection of orthogonal polarizations. The bistatic radar geometry of an orbiting spacecraft is well suited to probing the surface of planets at a variety of latitude, longitude and incidence angles.
For a typical downlink bistatic radar experiment, the radio signal is transmitted from the spacecraft High Gain Antenna toward the planetary surface and is scattered from that surface. That part of the signal power that is reflected toward Earth is received at the ground station. Optimizing performance of the bistatic radar experiments requires accurate prediction of the orbiter trajectory for the formulation of antenna pointing strategies and prediction of signal parameters such as Doppler shift and signal amplitude. In a quasi-specular experiment the antenna is then programmed to follow a locus of points for which surface reflection would be specular if Mars were smooth. From the data recorded along these specular point paths, surface roughness can be inferred from Doppler dispersion of the echo signal; the dielectric constant of the surface material can be inferred from the echo amplitude and/or polarization properties.
In a bistatic backscatter experiment, the spacecraft antenna is aimed exactly opposite to the Earth direction, a configuration which is often much easier to implement than dynamically tracking either moving or fixed points. As the antenna beam illuminates regions on the surface, coherent backscatter enhancements will cause ice-covered areas to appear extremely bright. Repeated tracks over the polar region can be used to define the boundaries of icy polar deposits or to monitor their changes as a function of time. The spatial resolution of the measurements is approximately equal to the projection of the HGA beam on the surface. The radio echo signal is received in the open-loop mode in two orthogonal polarizations (for example, Left Circular Polarization, and Right Circular Polarization), down-converted, sampled, and stored for further processing at investigating institutions.
Determination of the mass of Phobos: The objective of this experiment is the precise determination of the mass of the Martian moon Phobos and, if feasible, also of the low degree spherical harmonics of its gravity field. The shape and volume of Phobos will be determined using observations made by the cameras carried on Mars Express, allowing the bulk density of the moon may be derived.
The method of mass determination during close encounters with small bodies is well established. The gravitational attraction of Phobos will slightly disturb the trajectory of Mars Express. The difference between predicted trajectory (without Phobos) and the actually observed trajectory will lead to the determination of the attractive forces acting on the spacecraft and from them the mass of the moon. To make these measurements, the spacecraft is operating in two-way link mode with an X-band uplink.
The observations will be performed each time the spacecraft encounters Phobos with a closest approach distance of less than 500 km.
Investigation of gravity anomalies: Gravity information can be obtained at all times when the spacecraft is using the two-way dual-frequency radio link and the spacecraft is close enough to the surface that gravity accelerations significantly affects the spacecraft velocity. Earth pointing of the HGA is required to maintain a continuous radio link. The coherent and simultaneous dual-frequency downlink allows the extraction of the dispersive effects on the downlink due to the interplanetary medium and the Earth's ionosphere. Doppler tracking data will be acquired at a rate of one sample per 10 seconds and ranging data will be collected at a rate of one point per 10 minutes.
Velocity contributions induced by attitude control movements of the spacecraft which result in a HGA motion relative to the line-of-sight to Earth may reach several mm s-1. Therefore, thruster activities and attitude control commands have to be recorded in order to reconstruct the attitude motion for later correction of derived LOS gravity accelerations.
The anticipated accuracy of an S/X-band two-way radio link is of the order of 10-5 ms-1. This translates into an accuracy of gravitational acceleration determination of the order of several mGal (one mGal = 10-5 ms-2 ~ 10-6 g), depending on the height and extent of the local topographic features.
Solar corona sounding: Solar corona sounding will be performed using a two-way radio link. A dual-frequency downlink at S-band and X-band will be used to separate the coronal dispersive effects from the classical Doppler shifts. The two-way link is a powerful tool for the derivation of electron density models from observed electron content when propagation time delay data (ranging) and dispersive Doppler shifts are compared. The two-way link can also be used as the basis for the derivation of solar wind speed by correlating uplink and downlink signals and a detector for rapidly outward propagating density enhancements originating from solar events.
Superior solar conjunctions of Mars will occur in mid-October 2004 and mid-October 2006 over the North Pole of the Sun in the plane of sky at an apparent distance from the solar disk of less than three solar radii. The dispersive effects of the solar corona on the radio link will dominate the classical and dispersive contributions from the Martian gravity field and atmosphere.
Solar coronal sounding will be performed when Mars Express is within ten degrees elongation on either side of the solar disk (40 solar radii), which will occur from mid-September to mid-November 2004 and 2006.
SPICAM (SPectroscopy for the Investigation of the Characteristics of the Atmosphere of Mars)
SPICAM is an imaging spectrometer for ultraviolet and infrared radiation. SPICAM is equipped with two channels, one for ultraviolet wavelengths and one for infrared. 66) 67)
Parameter | Ultraviolet (SUV) | Infrared (SIR) |
Spectral range | 0.118 - 0.32 µm | 1.1 - 1.7 µm |
Spectral sampling | 0.55 nm/pixel | 0.45 - 1.12 nm/pixel |
Operational Modes: The operational modes of SPICAM are Test mode (ground use only), Star mode, Sun mode, Limb mode and Nadir mode. The operational modes are derived from the scientific objectives and the related spacecraft attitudes.
Nadir mode | Used during spacecraft nominal nadir observation mode. SUV and SIR observing. |
Star mode | Requires dedicated spacecraft attitude. SUV observing. |
Limb mode | Requires dedicated spacecraft attitude. SUV and SIR observing. |
Sun mode | Requires dedicated spacecraft attitude. SUV and SIR observing. |
In Nadir mode, the instrument will point directly at the planet and will analyse solar radiation that has travelled through the atmosphere after being reflected from the planet surface. Nadir observations allow the measurement of total column abundance of atmospheric components. In star or Sun mode, the instrument will point tangentially through the atmosphere towards a star, or the Sun, which is observed through the atmosphere as it rises or sets. The instrument then analyses the light once components of it have been absorbed by the atmosphere, allowing derivation of vertical concentration profiles for atmospheric components. In limb pointing mode, the instrument will point across the atmosphere, as during Star mode, but without a target star, and the instrument will analyse the vertical profile of aeronomic emissions.
Ultraviolet Channel: The SPICAM ultraviolet channel (SUV) is based around a holographic diffraction grating.
Usable dimensions of primary mirror | 40 x 40 mm |
Slit width | 0.05 and 0.5 mm |
Slit length | 6.6 mm |
Wavelength range | 118-320 nm |
Spectral dispersion | 0.55 nm/pixel |
Transmission of optics (Telescope + grating) | 30% |
Pointing accuracy | Better than 0.2º |
Detector | Intensified charge coupled device (CCD) |
CCD dimensions | 384 x 288 pixels |
CCD pixel size | 23 x 23 µm |
Field of view of one pixel | 40 × 40 arcseconds |
The first optical element in the UV channel is an off-axis parabolic mirror, which collects the incident light entering through either the nadir or solar aperture and focuses it.
Off axis portion of parent with origin at center of parent paraboloid | x = 30 mm, y = 0 mm, z = 1.875 mm |
Focal length | 120 mm |
Dimensions | 44 x 52 mm |
Entrance pupil dimensions | 40 x 40 mm |
Usable field of view | 1º x 3.16º |
Material | Aluminum |
Coating | Magnesium Fluoride, MgF2 |
In the focal plane of the mirror, there is a slit, which can be moved in and out of the field of view by a mechanical actuator, providing two configurations:
• Slit absent, for observation of stellar occultations with a field of view of 1° x 3.16°
• Slit present, for the observation of extended sources.
The slit has two parts, with two different widths, to give different flux resolutions.
The focal plane is the entrance of the spectrometer, a holographic concave grating, which collects the incoming light and directs it to the detector block.
Type | Holographic |
Shape | Toroidal |
Coating | Magnesium Fluoride, MgF2 |
Dimensions | 50 x 50 mm |
Radius of curvature | 148.94 mm |
Grooves per mm | 280 |
Blaze wavelength | 170 mm |
Incidence angle | ~6.5º |
The detection block consists of a CCD detector equipped with an image intensifier tube. The spectrum of a single source point in the focal plane is dispersed along the lines of the CCD. The usable spectral band is 118 to 320 nm, chosen so as to offer good resolution (~1 nm) for stellar observations and to cover the CO2 and O3 bands. The lower wavelength was selected to be just below the Lyman α wavelength and the upper wavelength was chosen to reject visible light. The quantum efficiency of the photocathode is zero beyond 320 nm and the detector is therefore solar blind. The detector has a large dynamic range - by varying the gain of the image intensifier, the spectrometer can perform individual photon counting and deal with very high input intensities.
To observe the Sun, a five-millimeter diameter mirror is positioned so as to reflect the light from the Sun via a dedicated entrance aperture onto the parabolic mirror.
Infrared Channel: The SPICAV infrared channel (SIR) is based around a scanning acousto-optical tuneable filter (AOTF)
Diameter of primary lens | 30 mm |
Field of view | 1º (3 x 10⁻⁴ steradians) |
Slit width | 1 mm |
Wavelength range | 1.1-1.7 µm |
Sampling per pixel | 0.45 nm to 1.12 nm |
Transmissivity of optics | 25% |
Detector | InGaAs PIN photodiode |
Resolution at nadir | 5 x 5 km |
The entrance optical system comprises a lens telescope with a diameter of 30 mm and a collimator lens, which collect the incoming radiation and direct it onto the AOTF.
The AOTF consists of a tellurium oxide (TeO2) crystal to which an acoustic wave is applied. The acoustic wave propagating in the crystal causes it to act in a similar way to a diffraction grating. A radio-frequency synthesizer drives a piezo-electric crystal attached to the TeO2 crystal to produce the wave. The frequency of excitation determines the wavelength of the acoustic waves and hence the select wavelength of the AOTF. The frequency range of the synthesizer corresponds to an AOTF passband of 1.1 - 1.7 µm.
The two output beams from the AOTF are collimated by another lens and detected by two indium gallium arsenide PIN photodiodes.
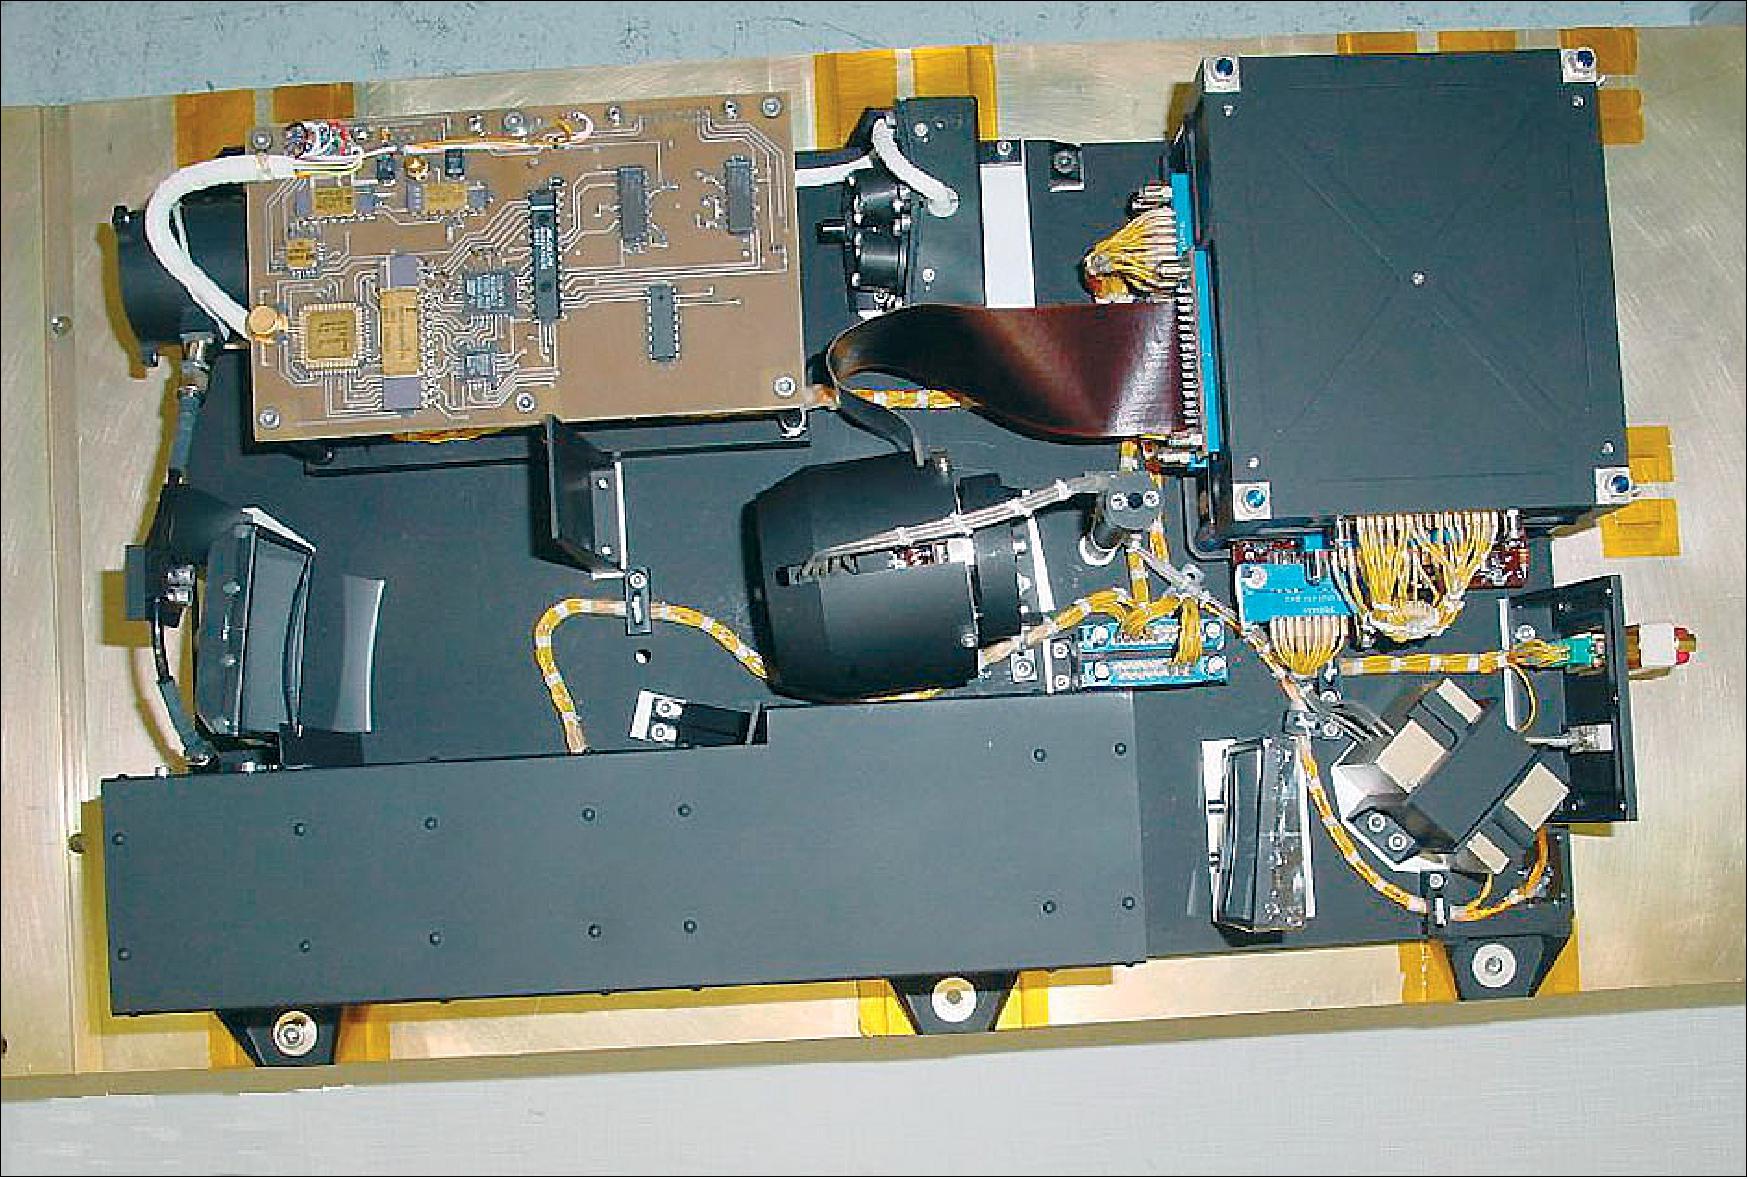
SPICAM is a low mass (4.7 kg) UV-IR spectrometer on the Mars Express orbiter, is dedicated to recovering most of the atmospheric science that was lost with Mars-96 and its set of SPICAM sensors. The new configuration of SPICAM includes a 2-channel optical sensor (3.8 kg) and an electronics block (0.9 kg).
Space Segment
The Mars Express Orbiter Radio Science (MaRS) experiment makes use of the radio link between the orbiter and the ground station(s) on Earth. Frequency, amplitude and polarization information will be extracted from the radio signal received in the ground station.
The S-band uplink is received via the Low Gain Antennas (LGA) or the High gain Antenna (HGA). In coherent, two-way mode the received frequency is used to derive the downlink frequencies using the transponder frequency ratios 880/221 and 240/221 for the X-band and S-band downlinks, respectively.
The X-band uplink is received via the HGA only. In the coherent two-way mode, the received frequency is used to derive the downlink frequencies using the transponder frequency ratios 880/749 and 240/749 for X-band and S-band downlinks, respectively. An X-band uplink will enhance the performance of the experiment because X-band is less sensitive to the effect of interplanetary plasma along the propagation path.
The simultaneous and phase coherent dual-frequency downlink at X-band and S-band is transmitted via the HGA. The X-band and S-band frequencies are related by a factor of 11/3. If an uplink exists, the downlinks are also coherent with the uplink in their respective transponding ratios. The dual-frequency downlink is required in order to separate the classical Doppler shift, due to the relative motion of the spacecraft and the ground station, from the dispersive media effects, due to the propagation of the radio waves through the ionosphere and interplanetary medium. It is also required that both frequencies are transmitted via the High Gain Antenna to maximize the signal-to-noise ratio.
Ground Segment
The ground stations will include the tracking complexes near Perth, Australia (ESA, 35 m antenna), and the Deep Space Network in California, Spain and Australia (NASA, 34 m antenna). A tracking pass consists of typically eight to ten hours of visibility. Measurements of the spacecraft range and carrier Doppler shift can be obtained whenever the spacecraft is visible. In the two-way mode the ground station transmits an uplink radio signal at S-band or X-band and receives the dual-frequency simultaneous downlink at X-band and S-band. The information about signal amplitude, received frequency and polarization is extracted and stored, together with the time of receipt.
The ground stations will employ a hydrogen maser frequency standard to achieve frequency stability of the order of one part in 10-15 over a long integration time (> 100 seconds). This stability is required for precise two-way tracking in order to achieve velocity measurement accuracies better than 10-4 ms-1 with a one second integration time.
References
1) A. Chicarro, P. Martin & R. Trautner, ”The Mars Express Mission: An Overview,” SP-1249, August 2004, URL: https://www.esa.int/esapub/sp/sp1240/sp1240web.pdf
2) ”Mars Express,” ESA, 19 October 2004, URL: https://www.esa.int/Our_Activities/Space_Science/Mars_Express/Industry
3) ”Mars Express Fact Sheet,” 04 October 2017, ESA, URL: http://sci.esa.int/mars-express/47364-fact-sheet/
4) ”Mars Express Operations,” ESA, URL: https://www.esa.int/Our_Activities/Operations/Mars_Express_operations
5) ”Mars Express peers into Mars' 'Grand Canyon',” ESA Science & Exploration, 20 July 2022, URL: https://www.esa.int/Science_Exploration/Space_Science/Mars_Express/Mars_Express_peers_into_Mars_Grand_Canyon
6) ”Software upgrade for 19-year-old martian water-spotter,” ESA Enabling & Support, 21 June 2022, URL: https://www.esa.int/Enabling_Support/Operations/Software_upgrade_for_19-year-old_martian_water-spotter
7) ”Mars sleeps with one eye open,” ESA Science & Exploration, 8 June 2022, URL: https://www.esa.int/Science_Exploration/Space_Science/Mars_sleeps_with_one_eye_open
8) ”Tantalising tectonics,” ESA Science & Exploration, 28 April 2022, URL: https://www.esa.int/Science_Exploration/Space_Science/Mars_Express/Tantalising_tectonics
9) ”Martian brain freeze,” ESA Science & Exploration, 30 March 2022, URL: https://www.esa.int/Science_Exploration/Space_Science/Mars_Express/Martian_brain_freeze
10) ”Caution! Martian wind at work,” ESA Science & Exploration, 23 February 2022, URL: https://www.esa.int/Science_Exploration/Space_Science/Mars_Express/Caution!_Martian_wind_at_work
11) ”Making a splash in a lava sea,” ESA Science & Exploration, 26 January 2022, URL: https://www.esa.int/Science_Exploration/Space_Science/Mars_Express/Making_a_splash_in_a_lava_sea
12) ”An icy spring at the Martian South Pole,” DLR News, 21 December 2021, URL: https://www.dlr.de/content/en/articles/news/2021/04/20211221_an-icy-spring-at-the-martian-south-pole.html
13) ”ESA’s Mars Express unravels mystery of martian moon using 'fake' flybys,” ESA Science & Exploration, 02 December 2021, URL: https://www.esa.int/Science_Exploration/Space_Science/Mars_Express/ESA_s_Mars_Express_unravels_mystery_of_martian_moon_using_fake_flybys
14) ”A one-way phone call at Mars,” ESA Enabling & Support, 01 December 2021, URL: https://www.esa.int/Enabling_Support/Operations/A_one-way_phone_call_at_Mars
15) ”Better understanding of Earth’s atmospheric chemistry from studying Mars?,” ESA Science & Exploration, 23 July 2021, URL: https://www.esa.int/Science_Exploration/Space_Science/Mars_Express/Better_understanding_of_Earth_s_atmospheric_chemistry_from_studying_Mars
16) F. Lefèvre, A. Trokhimovskiy, A. Fedorova, L. Baggio, G. Lacombe, A. Määttänen, J.-L. Bertaux, F. Forget, E. Millour, O. Venot, Y. Bénilan, O. Korablev, F. Montmessin, ”Relationship Between the Ozone and Water Vapor Columns on Mars as Observed by SPICAM and Calculated by a Global Climate Model,” Journal of Geophysical Research, Volume126, Issue4, Published: 8 April 2021, e2021JE006838, https://doi.org/10.1029/2021JE006838
17) ESA Science & Exploration, ”Unique use of ESA spacecraft ‘housekeeping’ data reveals cosmic ray behavior,” 28 June 2021, URL: https://www.esa.int/Science_Exploration/Space_Science/Mars_Express/Unique_use_of_ESA_spacecraft_housekeeping_data_reveals_cosmic_ray_behaviour
18) Elise Wright Knusten, Olivier Witasse, Beatriz Sanchez-Cano, Mark Lester, Robert Wimmer-Schweingruber, Michel Denis, James Godfrey, and Andrew Johnstone, “Galactic cosmic ray modulation at Mars and beyond measured with EDACs on Mars Express and Rosetta,” EGU General Assembly 2021, online, 19–30 April 2021, EGU21-11158, published in Astronomy & Astrophysics, https://doi.org/10.5194/egusphere-egu21-11158
19) ”Mars water loss shaped by seasons and storms,” ESA Science & Exploration, 22 March 2021, URL: https://www.esa.int/Science_Exploration/Space_Science/Mars_Express/Mars_water_loss_shaped_by_seasons_and_storms
20) Anna Fedorova, Franck Montmessin, Oleg Korablev, Franck Lefèvre, Alexander Trokhimovskiy, Jean‐Loup Bertaux, ”Multi‐Annual Monitoring of the Water Vapor Vertical Distribution on Mars by SPICAM on Mars Express,” Journal of Geophysical Research, Volume126, Issue1, January 2021, e2020JE006616, https://doi.org/10.1029/2020JE006616
21) J.-Y. Chaufray, F. Gonzalez-Galindo, M. A. Lopez-Valverde, F. Forget, E. Quémerais, J.-L. Bertaux, F. Montmessin, M. Chaffin, N. Schneider, J. T. Clarke, F. Leblanc, R. Modolo, R. V. Yelle, ”Study of the hydrogen escape rate at Mars during martian years 28 and 29 from comparisons between SPICAM/Mars express observations and GCM-LMD simulations,” Icarus, Volume 353, 1 January 2021, 113498, https://doi.org/10.1016/j.icarus.2019.113498
22) ”Mars Express unlocks the secrets of curious cloud,” ESA Science & Exploration, 09 March 2021, URL: https://www.esa.int/Science_Exploration/Space_Science/Mars_Express/Mars_Express_unlocks_the_secrets_of_curious_cloud
23) J. Hernández‐Bernal, A. Sánchez‐Lavega, T. del Río‐Gaztelurrutia, E. Ravanis, A. Cardesín‐Moinelo, K. Connour, D. Tirsch, I. Ordóñez‐Etxeberria, B. Gondet, S. Wood, D. Titov, N. M. Schneider, R. Hueso, R. Jaumann, E. Hauber, ”An Extremely Elongated Cloud Over Arsia Mons Volcano on Mars: I. Life Cycle,” Journal of Geophysical Research, Volume 126, March 2021, e2020JE006517, https://doi.org/10.1029/2020JE006517
24) ”Jezero crater through the eyes of Mars Express,” ESA Science & Exploration, 16 February 2021, URL: https://www.esa.int/Science_Exploration/Space_Science/Mars_Express/Jezero_crater_through_the_eyes_of_Mars_Express
25) ”ESA Mars orbiters support NASA Perseverance landing,” ESA / Enabling & Support / Operations, 11 February 2021, URL: https://www.esa.int/Enabling_Support/Operations/ESA_Mars_orbiters_support_NASA_Perseverance_landing
26) ”Happy new Mars year,” ESA Science & Exploration, 8 February 2021, URL: https://www.esa.int/ESA_Multimedia/Images/2021/02/Happy_new_Mars_year
27) ”Happy New Year on Mars,” ESA Science & Exploration, 3 February 2021, URL: https://www.esa.int/Science_Exploration/Human_and_Robotic_Exploration/Happy_New_Year_on_Mars
28) ”Dreaming of a red Christmas: Festive features spotted near Mars’ south pole,” ESA Science & Exploration, 17 December 2020, URL: https://www.esa.int/Science_Exploration/Space_Science/Mars_Express/Dreaming_of_a_red_Christmas_Festive_features_spotted_near_Mars_south_pole
29) ”Creating chaos: Craters and collapse on Mars,” ESA Science & Exploration, 19 November 2020, URL: https://www.esa.int/Science_Exploration/Space_Science/Mars_Express/Creating_chaos_Craters_and_collapse_on_Mars
30) ”An ancient crater triplet on Mars,” ESA Science & Exploration, 29 October 2020, URL: https://www.esa.int/Science_Exploration/Space_Science/Mars_Express/An_ancient_crater_triplet_on_Mars
31) ”Explore the data behind ESA’s Mars webcam,” ESA Science & Exploration, 16 October 2020, URL: https://www.esa.int/ESA_Multimedia/Images/2020/10/Explore_the_data_behind_ESA_s_Mars_webcam
32) ”The topography of Jezero crater – landing site of NASA's Mars 2020 mission,” DLR News, 29 September 2020, URL: https://www.dlr.de/content/en/articles/news/2020/03/20200929_topography-of-jezero-crater.html
33) ”Mars Express finds more underground water on Mars,” ESA science & exploration, 28 September 2020, URL: https://www.esa.int/ESA_Multimedia/Videos/2020/09/Mars_Express_finds_more_underground_water_on_Mars
34) ”Mars Express captures Nereidum Mountain Range,” ESA Science & Exploration, 3 September 2020, URL: https://www.esa.int/About_Us/Week_in_images/Week_in_images_31_August_-_04_September_2020
35) ”Flight over the Mars 2020 Perseverance rover landing site,” ESA Science & Exploration, 29 July 2020, URL: https://www.esa.int/ESA_Multimedia/Videos/2020/07/Flight_over_the_Mars_2020_Perseverance_rover_landing_site
36) ”DLR’s High Resolution Stereo Camera ‘flies’ over a future Mars landing site – Jezero Crater,” DLR, 29 July 2020, URL: https://www.dlr.de/content/en/articles/news/2020/03/20200729_dlr-hrsc-flies-over-jezero-crater-landing-site.html
37) ”Return of the extremely elongated cloud on Mars,” ESA Enabling & Support, 29 July 2020, URL: https://www.esa.int/ESA_Multimedia/Images/2020/07/Return_of_the_extremely_elongated_cloud_on_Mars
38) ”Flight over Korolev Crater on Mars,” ESA Science & Exploration, 2 July 2020, URL:https://www.esa.int/ESA_Multimedia/Videos/2020/06/Flight_over_Korolev_Crater_on_Mars
39) ”The ancient lakeshore of Jezero crater on Mars,” ESA Science & Exploration, 1 July 2020, URL: http://www.esa.int/ESA_Multimedia/Images/2020/07/The_ancient_lakeshore_of_Jezero_crater_on_Mars
40) ”Lava-like mud flows on Mars,” DLR, 18 May 2020, URL: https://www.dlr.de/content/en/articles/news/2020/02/20200518_lava-like-mud-flows-on-mars.html
41) Petr Brož, Ondřej Krýza, Lionel Wilson, Susan J. Conway, Ernst Hauber, Adriano Mazzini, Jan Raack, Matthew R. Balme, Matthew E. Sylvest & Manish R. Patel, ”Experimental evidence for lava-like mud flows under Martian surface conditions,” Nature Geoscience, Volume 279, Published: 18 May 2020, https://doi.org/10.1038/s41561-020-0577-2
42) ”Sculpted by nature on Mars,” ESA / Science & Exploration / Space Science / Mars Express, 14 May 2020, URL: http://www.esa.int/Science_Exploration/Space_Science/Mars_Express/Sculpted_by_nature_on_Mars
43) ”The dark dunes of Mars: Moreux crater,” ESA / Science & Exploration / Space Science / Mars Express, 5 March 2020, URL: http://www.esa.int/Science_Exploration/Space_Science/Mars_Express/The_dark_dunes_of_Mars_Moreux_crater
44) ”Two halves of a whole,” ESA / Science & Exploration / Space Science / Mars Express, 13 February 2020, URL: http://www.esa.int/Science_Exploration/Space_Science/Mars_Express/Two_halves_of_a_whole
45) ”Rippling ice and storms at Mars’ north pole,” ESA / Science & Exploration / Space Science / Mars Express, 13 January 2020, URL: http://www.esa.int/Science_Exploration/Space_Science/Mars_Express/Rippling_ice_and_storms_at_Mars_north_pole
46) G. Neukum, R. Jaumann and the HRSC Co-Investigator and Experiment Team, ”HRSC: the High Resolution Stereo Camera of Mars Express,” ESA, SP-140, URL: http://sci.esa.int/science-e/www/object/doc.cfm?fobjectid=34967
47) K.Gwinner, R. Jaumann, E. Hauber, H. Hoffmann, C. Heipke, J. Oberst, G. Neukum, V. Ansan, J. Bostelmann, A. Dumke, S. Elgner, G. Erkeling, F. Fueten, H. Hiesinger, N. M. Hoekzema, E. Kersten, D. Loizeau, K.-D. Matz, P. C. McGuire, V. Mertens, G. Michael, A. Pasewaldt, P. Pinet, F. Preusker, D. Reiss, T. Roatsch, R. Schmidt, F. Scholten, M. Spiegel, R. Stesky, D. Tirsch, S. van Gasselt, S. Walter, M.Wählisch, K. Willner, ”The High Resolution Stereo Camera (HRSC) of Mars Express and its approach to science analysis and mapping for Mars and its satellites,” Planetary and Space Science, Volume 126, July 2016, Pages 93-138, URL of abstract: https://doi.org/10.1016/j.pss.2016.02.014
48) ”HRSC - High Resolution Stereo Camera,” DLR, 06 July 2017, URL: https://www.dlr.de/dlr/en/desktopdefault.aspx/tabid-10364/548_read-400/#/gallery/657
49) T. B. McCord, J. B. Adams, G. Bellucci, J.‐P. Combe, A. R. Gillespie, G. Hansen, H. Hoffmann, R. Jaumann, G. Neukum, P. Pinet, F. Poulet, K. Stephan, ”Mars Express High Resolution Stereo Camera spectrophotometric data: Characteristics and science analysis,” Journal of Geophysical Research: Planets Volume 112, Issue E6, 16 June 2007, https://doi.org/10.1029/2006JE002769
50) ”HRSC: High Resolution Stereo Camera,” ESA Mars Express, 04 October 2017, URL: http://sci.esa.int/mars-express/34826-design/?fbodylongid=1597
51) S. Barabash, R. Lundin, H. Andersson, J. Gimholt, M. Holmström, O. Norberg, M. Yamauchi, K. Asamura, A. J. Coates, D. R. Linder, D. O. Kataria, C. C. Curtis, K. C. Hsieh, B. R. Sandel, A. Fedorov, A. Grigoriev, E. Budnik, M. Grande, M. Carter, D. H. Reading, H. Koskinen, E. Kallio, P. Riihela, T. Säles, J. Kozyra, N. Krupp, S. Livi, J. Woch, J. Luhmann, S. McKenna-Lawlor, S. Orsini, R. Cerulli-Irelli, M. Maggi, A. Morbidini, A. Mura, A. Milillo, E. Roelof, D. Williams, J.-A. Sauvaud, J.-J. Thocaven, T. Moreau, D. Winningham, R. Frahm, J. Scherrer, J. Sharber, P. Wurz & P. Bochsler, ”ASPERA-3: Analyzer of Space Plasmas and Energetic Ions for Mars Express, ESA, SP-1240, URL: http://sci.esa.int/science-e/www/object/doc.cfm?fobjectid=34920
52) ”ASPERA-3: Analyser of Space Plasmas and Energetic Atoms,” ESA, 04 October 2017, URL: http://sci.esa.int/mars-express/34826-design/?fbodylongid=1596
53) ”PFS: Planetary Fourier Spectrometer, Studying the composition of the atmosphere,” ESA Mars Express, 25 October 2017, URL: http://sci.esa.int/mars-express/31033-objectives/?fbodylongid=659
54) V. Formisano, D. Grassi, R. Orfei, D. Biondi, E. Mencarelli, A. Mattana, F. Nespoli, A. Maturilli, M. Giuranna, M. Rossi, M. Maggi, P. Baldetti, G. Chionchio, B. Saggin, F. Angrilli, G. Bianchini, G. Piccioni, A. Di Lellis, P. Cerroni, F. Capaccioni, M.T. Capria, A. Coradini, S. Fonti, V. Orofino, A. Blanco, L. Colangeli, E. Palomba, F. Esposito, D. Patsaev, V. Moroz, L. Zasova, N. Ignatiev, I. Khatuntsev, B. Moshkin, A. Ekonomov, A. Grigoriev, V. Nechaev, A. Kiselev, Y. Nikolsky, V. Gnedykh, D. Titov, P. Orleanski, M. Rataj, M. Malgoska, A. Jurewicz, M.I. Blecka, H. Hirsh, G. Arnold, E. Lellouch, A. Marten, T. Encrenaz, J. Lopez Moreno, S. Atreya & P. Gobbi, ”The Planetary Fourier Spectrometer (PFS) for Mars Express,” ESA, SP-1240, URL: http://sci.esa.int/science-e/www/object/doc.cfm?fobjectid=34919
55) ”PFS: Planetary Fourier Spectrometer,” ESA, 04 October 2017, URL: http://sci.esa.int/mars-express/34826-design/?fbodylongid=1599
56) J-P. Bibring, A. Soufflot, M. Berthé, Y. Langevin, B. Gondet, P. Drossart, M. Bouyé, M. Combes, P. Puget, A. Semery, G. Bellucci, V. Formisano, V. Moroz, V. Kottsov and the OMEGA Co-I team: G. Bonello, S. Erard, O. Forni, A. Gendrin, N. Manaud, F. Poulet, G. Poulleau, T. Encrenaz, T. Fouchet, R. Melchiori, F. Altieri, N. Ignatiev, D. Titov, L. Zasova, A. Coradini, F. Capacionni, P. Cerroni, S. Fonti, N. Mangold, P. Pinet, B. Schmitt, C. Sotin, E. Hauber, H. Hoffmann, R. Jaumann, U. Keller, R. Arvidson, J. Mustard & F. Forget, ”OMEGA: Observatoire pour la Minéralogie, l’Eau, les Glaces et l’Activité,” ESA, SP-1240, URL: http://sci.esa.int/science-e/www/object/doc.cfm?fobjectid=34883
57) ”Omega Instrument,” CNES, 13 July 2016, URL: https://mars-express.cnes.fr/en/MEX/omega.htm
58) G. Bellucci, F. Altieri, J. P. Bibring and the OMEGA Team, ”The OMEGA Instrument on board Mars Express: First Results,” Memorie della Società Astronomica Italiana Supplement, Vol. 5, 27, 2004, URL: http://sait.oat.ts.astro.it/MSAIS/5/PDF/27.pdf
59) ”Instrument objectives - OMEGA: IR Mineralogical Mapping Spectrometer, Mapping the surface composition of Mars” ESA, 25 October 2017, URL: http://sci.esa.int/mars-express/31033-objectives/?fbodylongid=661
60) ”OMEGA instrument design,” ESA Mars Express, 04 October 2017, URL: http://sci.esa.int/mars-express/34826-design/?fbodylongid=1598
61) MARSIS: Mars Advanced Radar for Subsurface and Ionosphere Sounding,” ESA Mars Express, 04 October 2017, URL: http://sci.esa.int/mars-express/34826-design/?fbodylongid=1601
62) Melissa Mirino, Alessandro Frigieri, Roberto Orosei, Angelo Pio Rossi, Federico Cantini, ”MARSIS radar data interpretation to characterize the deeper layers in the North Polar cap on Mars,” Proceedings of the 69th IAC (International Astronautical Congress) Bremen, Germany, 1-5 October 2018, paper: IAC-18.A3.IP.51, URL: https://iafastro.directory/iac/proceedings/IAC-18/IAC-18/A3/IP/manuscripts/IAC-18,A3,IP,51,x42064.pdf
63) G. Picardi, D. Biccari, R. Seu, J. Plaut, W. T. K. Johnson, R. L. Jordan, A. Safaeinili, D. A. Gurnett, R. Huff, R. Orosei, O. Bombaci, D. Calabrese & E. Zampolini, ”MARSIS: Mars Advanced Radar for Subsurface and Ionosphere Sounding,” ESA, SP-1240, URL: ftp://ssols01.esac.esa.int/pub/workshops/07_MEX_DW_June_2008/Background_documentation/Marsis_subsurface/PicardiWeb.pdf
64) ”MaRS: Mars Radio Science,” ESA, 04 October 2017, URL: http://sci.esa.int/mars-express/34826-design/?fbodylongid=1600
65) M. Pätzold, B. Häusler, G. L. Tyler, T. Andert, S. W Asmar, M. K. Bird, V. Dehant,D. P.Hinson, P. Rosenblatt, R. A.Simpson, S. Tellmann, P. Withers, M. Beuthe, A. I. Efimov, M.Hahn, D.Kahan, S. Le Maistre, J. Oschlisniok, K. Peter, S. Remus, ”Mars Express 10 years at Mars: Observations by the Mars Express Radio Science Experiment (MaRS),” Planetary and Space Science, Volume 127, August 2016, Pages 44-90, URL of abstract: https://doi.org/10.1016/j.pss.2016.02.013
66) ”SPICAM: Spectroscopy for Investigation of Characteristics of the Atmosphere of Mars,” ESA Mars Express, 04 October 2017, URL: http://sci.esa.int/mars-express/34826-design/?fbodylongid=1602
67) J.-L. Bertaux, D. Fonteyn, O. Korablev, E. Chassefière, E. Dimarellis, J. P. Dubois, A. Hauchecorne, F. Lefèvre, M. Cabane, P. Rannou, A.C. Levasseur-Regourd, G. Cernogora, E. Quemerais, C. Hermans, G. Kockarts, C. Lippens, M. De Maziere, D. Moreau, C. Muller, E. Neefs, P. C. Simon, F. Forget, F. Hourdin, O. Talagrand, V.I. Moroz, A. Rodin, B. Sandel & A. Stern, ”SPICAM: Studying the Global Structure and Composition of the Martian Atmosphere,” ESA, SP-1240, URL: http://sci.esa.int/science-e/www/object/doc.cfm?fobjectid=34882
The information compiled and edited in this article was provided by Herbert J. Kramer from his documentation of: ”Observation of the Earth and Its Environment: Survey of Missions and Sensors” (Springer Verlag) as well as many other sources after the publication of the 4th edition in 2002. - Comments and corrections to this article are always welcome for further updates (eoportal@symbios.space).