Mars Express 2019-2004
Exploration
Mars Express Mission — Imagery in the period 2019-2004
• December 12, 2019: ESA's Mars Express has captured detailed views of the small, scarred and irregularly shaped moon Phobos from different angles during a unique flyby. 1)
- Mars has two moons: Phobos and the smaller and more distant Deimos, named after the Greek mythological personifications of fear (Phobos – hence ‘phobia') and terror (Deimos).
- Mars Express has explored this duo since it began observing the Red Planet in 2004: it has viewed Phobos with the beautiful rings of Saturn in the background, skimmed past the moon at a distance of just 45 km, used its High Resolution Stereo Camera to take incredibly detailed 360-degree images of Phobos and its intriguingly marked surface, and approached Deimos to produce an array of images and pin down the moon's location and motions.
- A new image sequence from Mars Express now captures Phobos' motions and surface in detail. The movie comprises 41 images taken on 17 November 2019, when Phobos passed Mars Express at a distance of 2400 km. Mars Express is currently the only spacecraft capable of close encounters with Phobos.
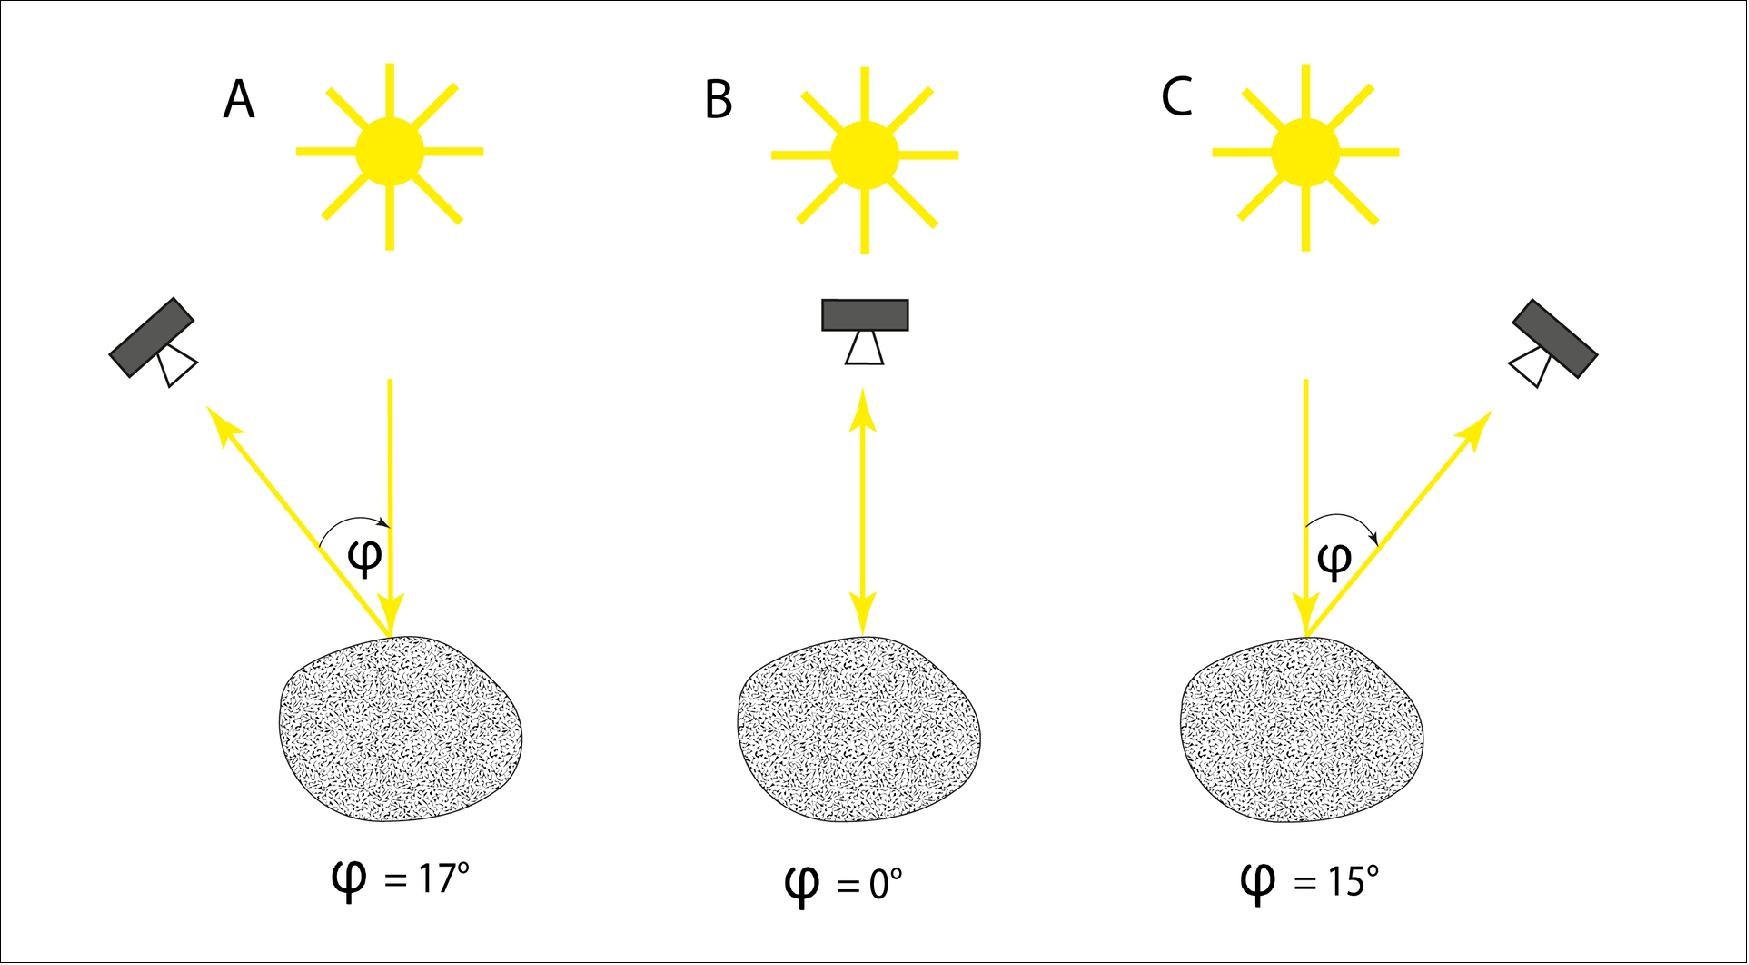
- These data nicely illustrate the concept of ‘phase angle': the angle between a light source (in this case, the Sun) and the observer (Mars Express), as viewed from the target object itself (Phobos). The initial phase angle is 17 degrees, drops to almost 0 degrees mid-way through (when Phobos is at its brightest), and then rises to 15 degrees by the end of the animation.
- To gain a mental image of this trajectory, one can imagine Mars Express observing Phobos from one side, slowly moving across to draw level with it, and then moving away to the other side, drawing an arc in the sky between Phobos and the Sun.
- Images acquired across a range of phase angles, as shown here, are incredibly useful for scientists. Different shadows are cast as the Sun's position changes relative to the target object: this illuminates and highlights the surface features and enables calculations of feature height, depth and relief, and reveals much about the roughness, porosity and reflectivity of the surface material itself.
- A phase angle of zero degrees occurs when the Sun is directly behind the observer. In this alignment, all of the light illuminating Phobos hits the surface vertically and is thus largely reflected back into space, causing the target object to brighten up noticeably, as seen in the animation, and shadows to disappear. The lowest phase angle in this animation is not precisely zero, but 0.92 degrees.
- This arrangement – of the Sun, Mars Express and Phobos where the latter is observed at a phase angle of near zero – is very rare, and happens only three times a year at most. Other chances to achieve a phase angle of under one will not occur until April and September 2020 (in the latter case, Mars Express may achieve a phase angle of precisely zero).
- As such, Mars Express takes every opportunity to view this small and intriguing moon from this angle, to shed light on its properties, behavior, possible origin, orbital characteristics and location in space – and to probe its potential as a mission destination.
- Phobos may be an unfamiliar world, but the phenomenon shown in the movie is familiar to anyone who has seen a full Moon. To create a full Moon, the Sun, Earth and Moon align in a roughly straight line (although, due to orbital inclinations, an exact line-up is rare, and results in a lunar eclipse). Here the phase angle – the angle between the light source (the Sun) and observer on the surface of the Earth, as viewed from the Moon – is zero, just as in the movie of Phobos. Today, 12 December, marks the last full Moon of 2019. So look up, and think of Mars' tiny moon Phobos!
• November 21, 2019: Where the two hemispheres of Mars meet, the planet is covered in broken-up terrain: a sign that slow-but-steady flows of icy material once forged their way through the landscape, carving out a fractured web of valleys, cliffs and isolated mounds of rock. 2)
- Mars is a planet of two halves. Its hemispheres are drastically different; the smooth northern lowlands sit up to three kilometers below the rugged southern highlands, and the surface in Mars' northern regions appears to be far younger than the ancient swaths of the south.
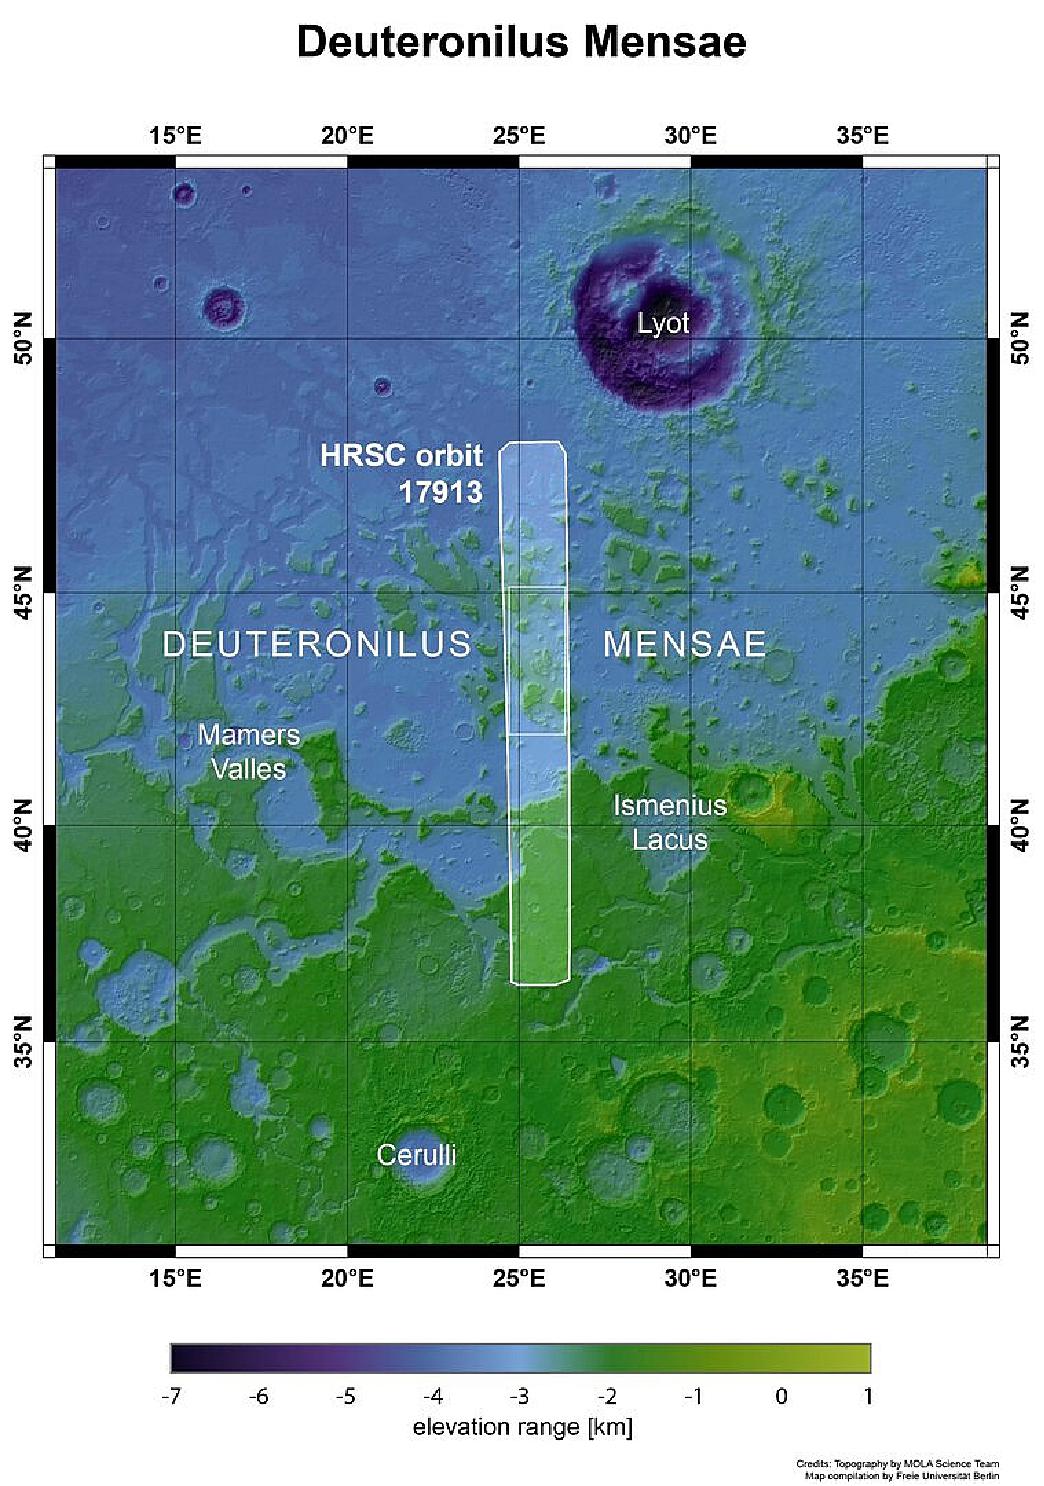
- Where these regions meet, they sometimes form a transition area filled with a wide range of intriguing geological features, patterns and processes: a type of landscape unique to Mars known as fretted terrain. Fretted terrain is found in a couple of key areas on Mars, and an especially good example, named Deuteronilus Mensae, can be seen in these images from Mars Express' High Resolution Stereo Camera (HRSC).
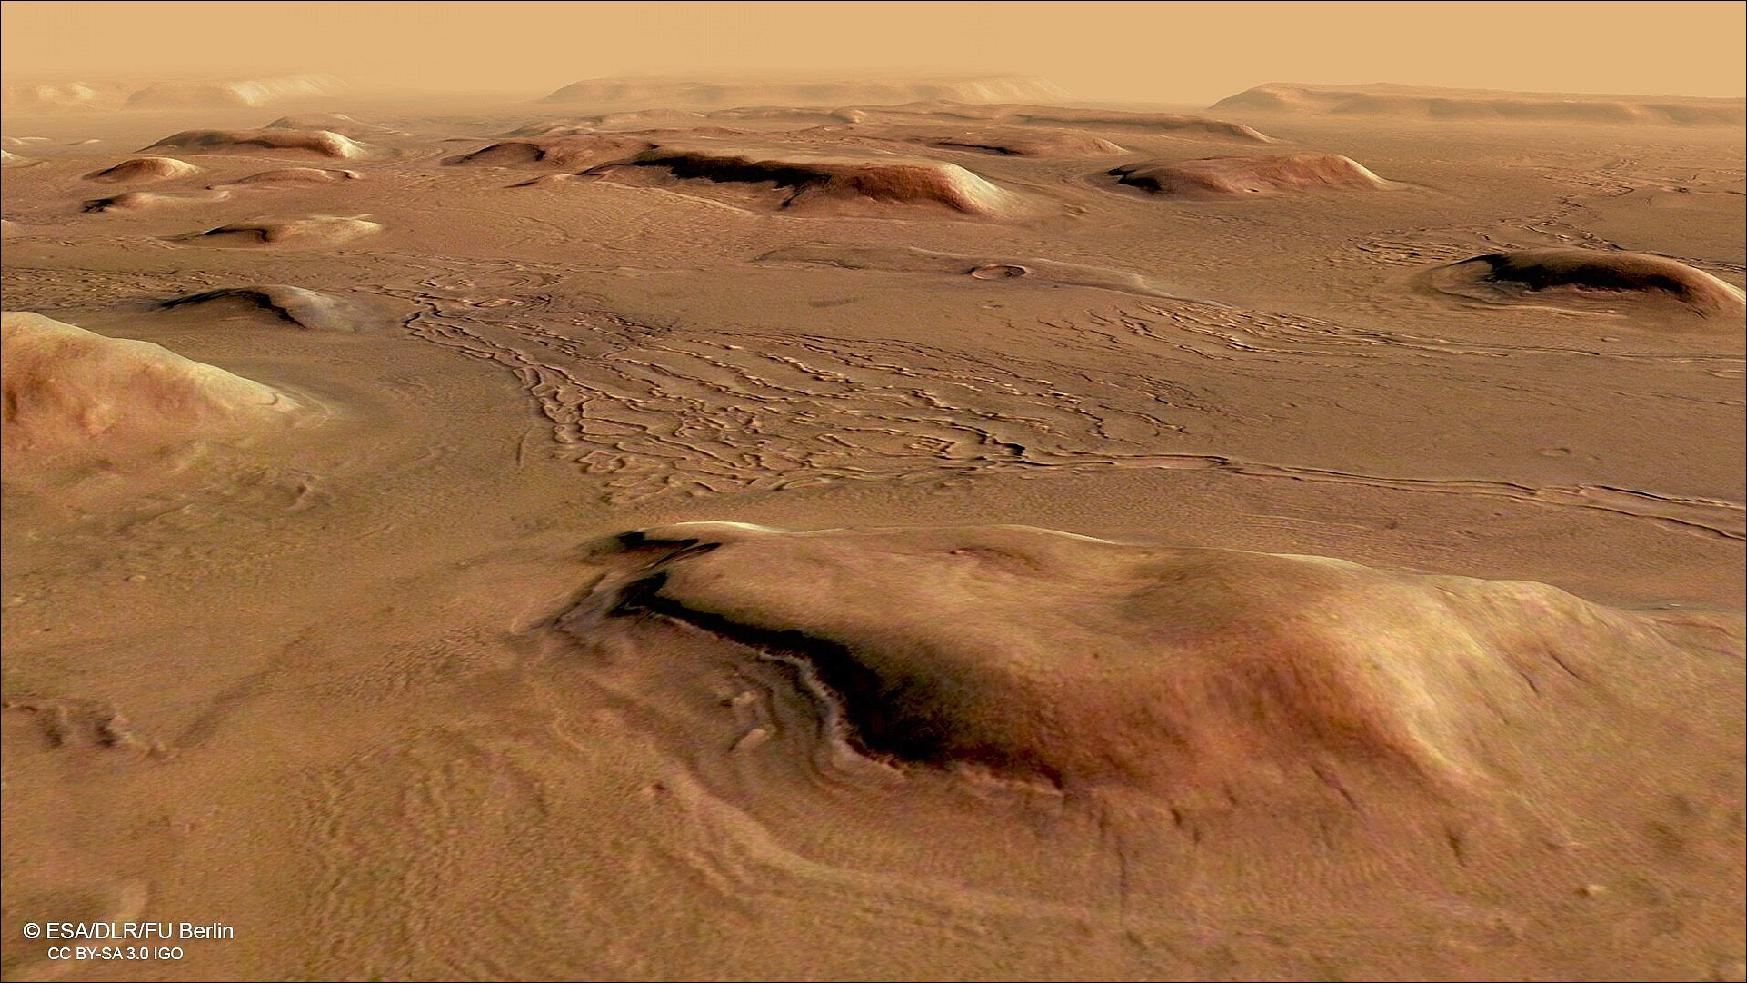
- This landscape shows clear and widespread signs of significant, lasting erosion. As is common with fretted terrain, it contains a mix of cliffs, canyons, scarps, steep-sided and flat-topped mounds (mesa), furrows, fractured ridges and more, a selection of which can be seen dotted across the frame.
- These features were created as flowing material dissected the area, cutting through the existing landscape and carving out a web of winding channels. In the case of Deuteronilus Mensae, flowing ice is the most likely culprit. Scientists believe that this terrain has experienced extensive past glacial activity across numerous martian epochs.
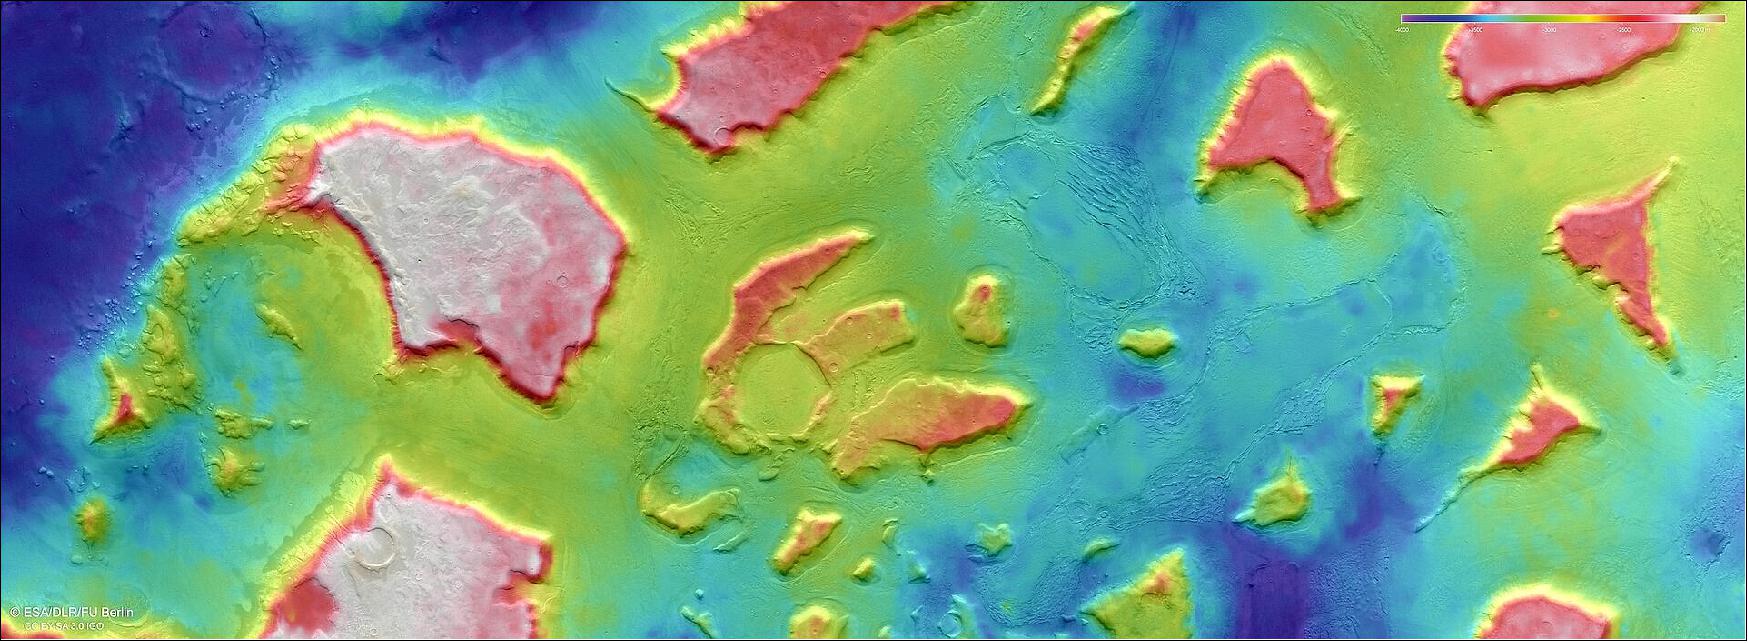
- It is thought that glaciers slowly but surely ate away at the plains and plateaus that once covered this region, leaving only a scattering of steep, flat, isolated mounds of rock in their wake.
- Smooth deposits cover the floor itself, some marked with flow patterns from material slowly moving downhill – a mix of ice and accumulated debris that came together to form and feed viscous, moving flows of mass somewhat akin to a landslide or mudflow here on Earth.
- Studies of this region by NASA's Mars Reconnaissance Orbiter have shown that most of the features seen here do indeed contain high levels of water ice. Estimates place the ice content of some glacial features in the region at up to 90%. This suggests that, rather than hosting individual or occasional icy pockets and glaciers, Deuteronilus Mensae may actually represent the remnants of an old regional ice sheet. This ice sheet may once have covered the entire area, lying atop the plateaus and plains. As the martian climate changed this ice began to shift around and disappear, slowly revealing the rock beneath.
- Overall, the features seen in these Mars Express images are reminiscent of the rock- and debris-covered glaciers found in cold regions of Earth. Glaciers may actually be relatively common on both past and present-day Mars; recent studies suggest that the planet may have belts of glacial activity above and below its equator, containing huge amounts of ice covered in thick protective layers of dust, and many other areas show signs of having hosted glaciers in the past – just like Deuteronilus Mensae.
- Mars Express has been orbiting the Red Planet since 2003. Using the HRSC, which obtained these new images, the mission has continually mapped the martian surface and characterized various key properties of and phenomena on the planet – from the presence of a planet-wide groundwater system to intricate old river systems, various intriguing surface deposits, giant regional dust storms, spikes of tell-tale gases in the planet's atmosphere, and much more.
- The mission will continue to explore the Red Planet in collaboration with the ESA-Roscosmos ExoMars Trace Gas Orbiter, which arrived at Mars in 2016, and the ExoMars Rosalind Franklin rover and its accompanying surface science platform, which will arrive in 2021.
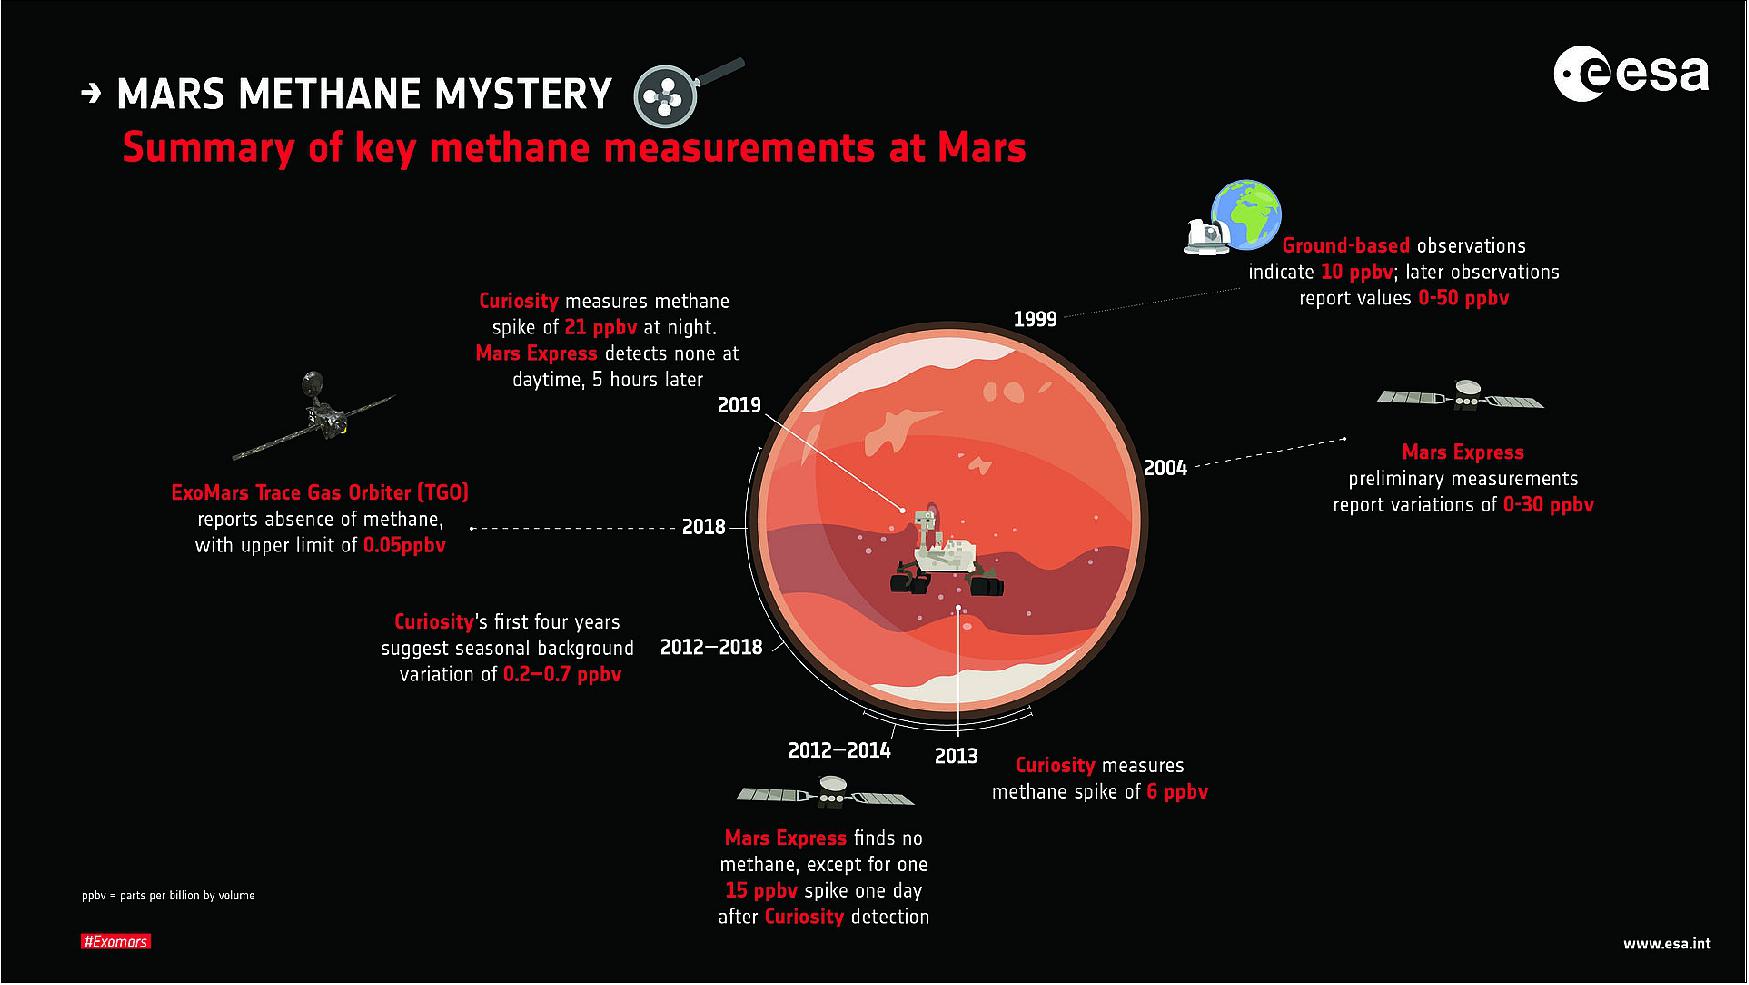
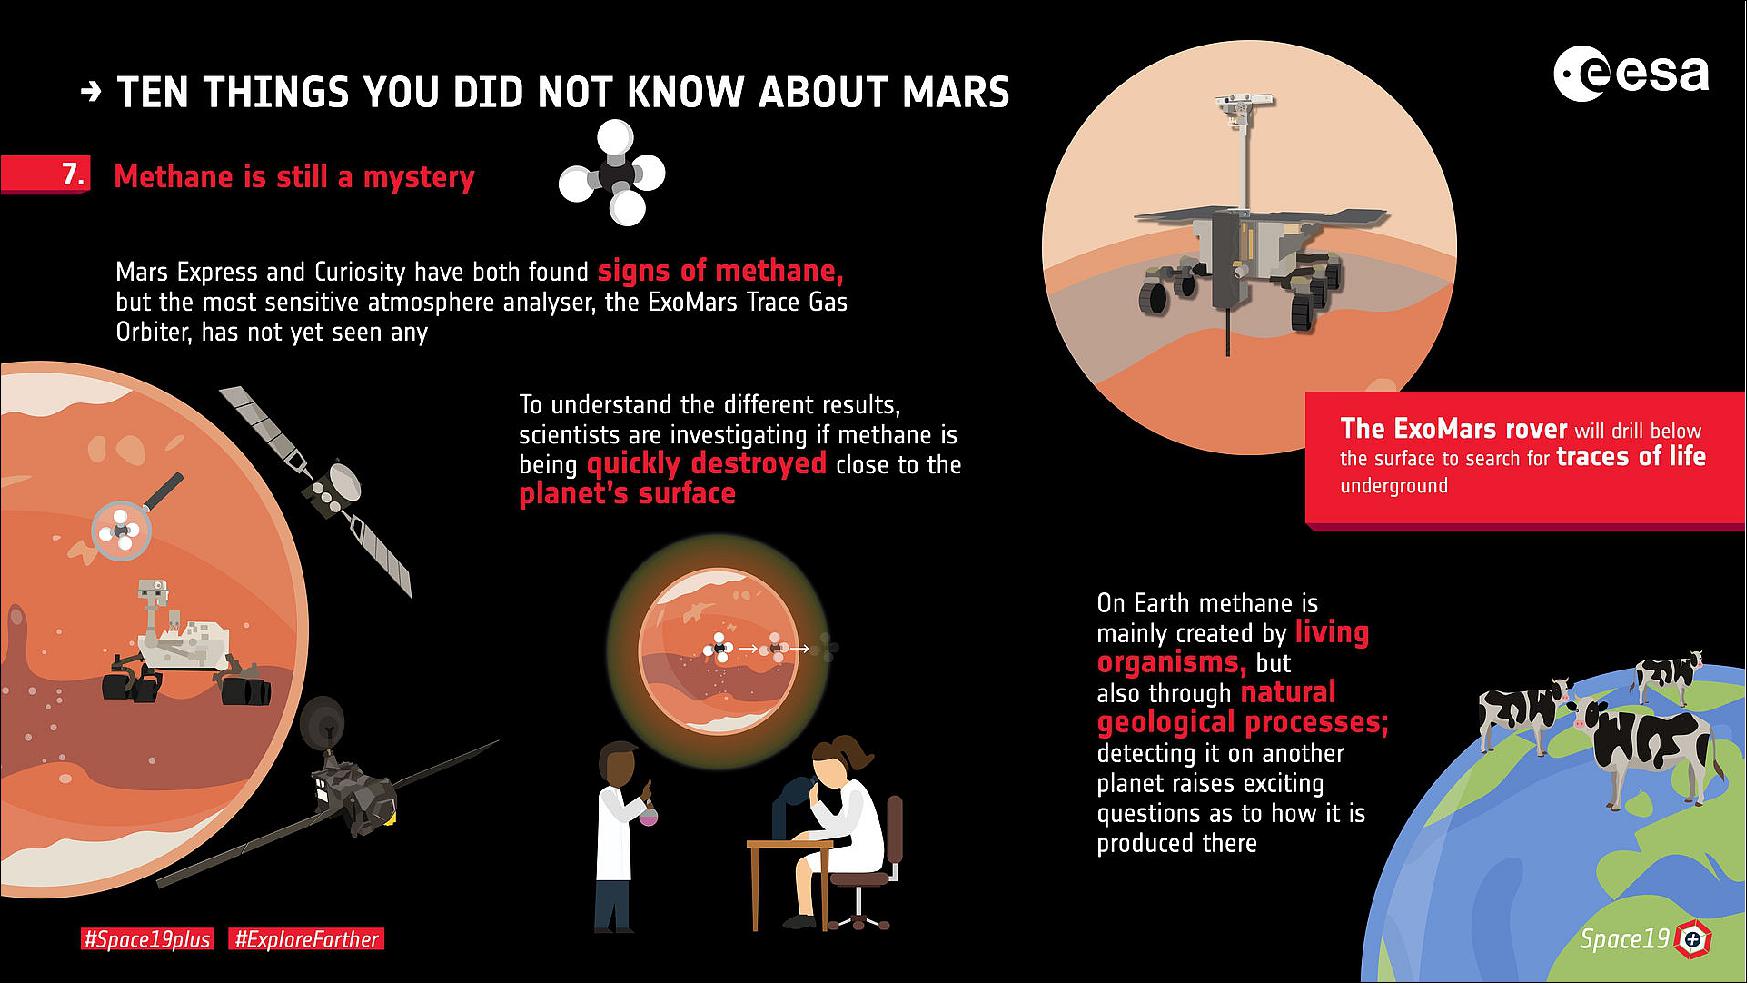
• November 13, 2019: In June, NASA's Curiosity rover reported the highest burst of methane recorded yet, but neither ESA's Mars Express nor the ExoMars Trace Gas Orbiter recorded any signs of the illusive gas, despite flying over the same location at a similar time. 3)
- Methane is of such fascination because on Earth a large proportion is generated by living things. It is known that methane has a lifetime of several hundred years before it is broken down by the Sun's radiation, so the fact that it is detected on Mars suggests it has been released into the atmosphere recently – even if the gas itself was generated billions of years ago.
- The methane mystery on Mars has had many twists and turns in recent years with unexpected detections and non-detections alike. Earlier this year it was reported that ESA's Mars Express had detected a signature that matched one of Curiosity's detections from within Gale Crater.
- A recent spike by Curiosity, measured on 19 June 2019, and the highest yet at 21 ppbv, adds to the mystery because preliminary analysis suggest that Mars Express did not detect any on this occasion. (For comparison, the concentration of methane in Earth's atmosphere is around 1800 ppbv, meaning that for every billion molecules in a given volume, 1800 are methane.)
- The Mars Express measurements were taken in the martian daytime about five hours after Curiosity's nighttime measurements; data collected by Mars Express over one day before also did not reveal any signatures. Meanwhile Curiosity's readings had returned to background levels when further measurements were taken in the following days.
- The Mars Express measurement technique allowing data to be inferred right down to the martian surface with its limit of detection around 2 ppbv.
- The ESA-Roscosmos Trace Gas Orbiter (TGO), the most sensitive detector for trace gases at Mars, also did not detect any methane while flying nearby within a few days before and after Curiosity's detection.
- In general, TGO is capable of measuring at parts per trillion levels and accessing down to about 3 km altitude, but this can depend on how dusty the atmosphere is. When measurements were taken at low latitudes on 21 June 2019, the atmosphere was dusty and cloudy, resulting in measurements accessing 20-15 km above the surface with an upper limit of 0.07 ppbv.
- The global lack of methane recorded by TGO is adding to the overall mystery, and corroborating the results of the different instruments is keeping all teams busy.
• 28 October 2019: Mars Express, ESA's first planetary mission, is a true marathon runner among spacecraft. Launched on 2 June 2003, the spacecraft arrived at Mars during the night of 25 December that same year. On 26 October 2019, this spacecraft completed its twenty-thousandth orbit around Mars. Mars Express is in good company in Martian orbit: NASA's Mars 2001 Odyssey and Mars Reconnaissance Orbiter have also been studying the Red Planet for more than 10 years. Odyssey has been in orbit since 2001 and the Reconnaissance Orbiter since March 2006. 4)
- The HRSC (High Resolution Stereo Camera) developed and built by the German Aerospace Center (Deutsches Zentrum für Luft- und Raumfahrt; DLR) in collaboration with German industry, has been photographing the planet's surface on board Mars Express since January 2004 – at resolutions of up to 10 m per pixel, in color and in three dimensions. This is the first global topographic collection of image data for a planet other than Earth. In total, the resistant stereo scanner has recorded 363 GB (GigaByte) of raw data that have been pre-processed on Earth to produce 5.5 GB of scientifically useful image data. The HRSC has recorded 75 percent of the planet's approximately 150 million km2 surface at image resolutions of 10 to 20 m/pixel.
- The topographic image maps generated using the HRSC are of great scientific benefit. Digital HRSC terrain models are also used when selecting landing sites, such as for NASA's InSight geophysical observatory or the ExoMars (ESA, due to launch in 2020), Curiosity and Mars 2020 (NASA) rovers.
- The orbit of Mars Express is highly elliptical, passing from pole to pole and taking the spacecraft to distances between 240 km to over 10,000 km from the Martian surface. The 'anniversary' of the twenty-thousandth orbit gave researchers in the HRSC experiment team, led by Ralf Jaumann at the DLR Institute of Planetary Research in Berlin, the opportunity to visit Mars during a simulated overflight of various 'chaotic areas', outflow channels and craters to the east of the Valles Marineris canyon, just north of the equator.
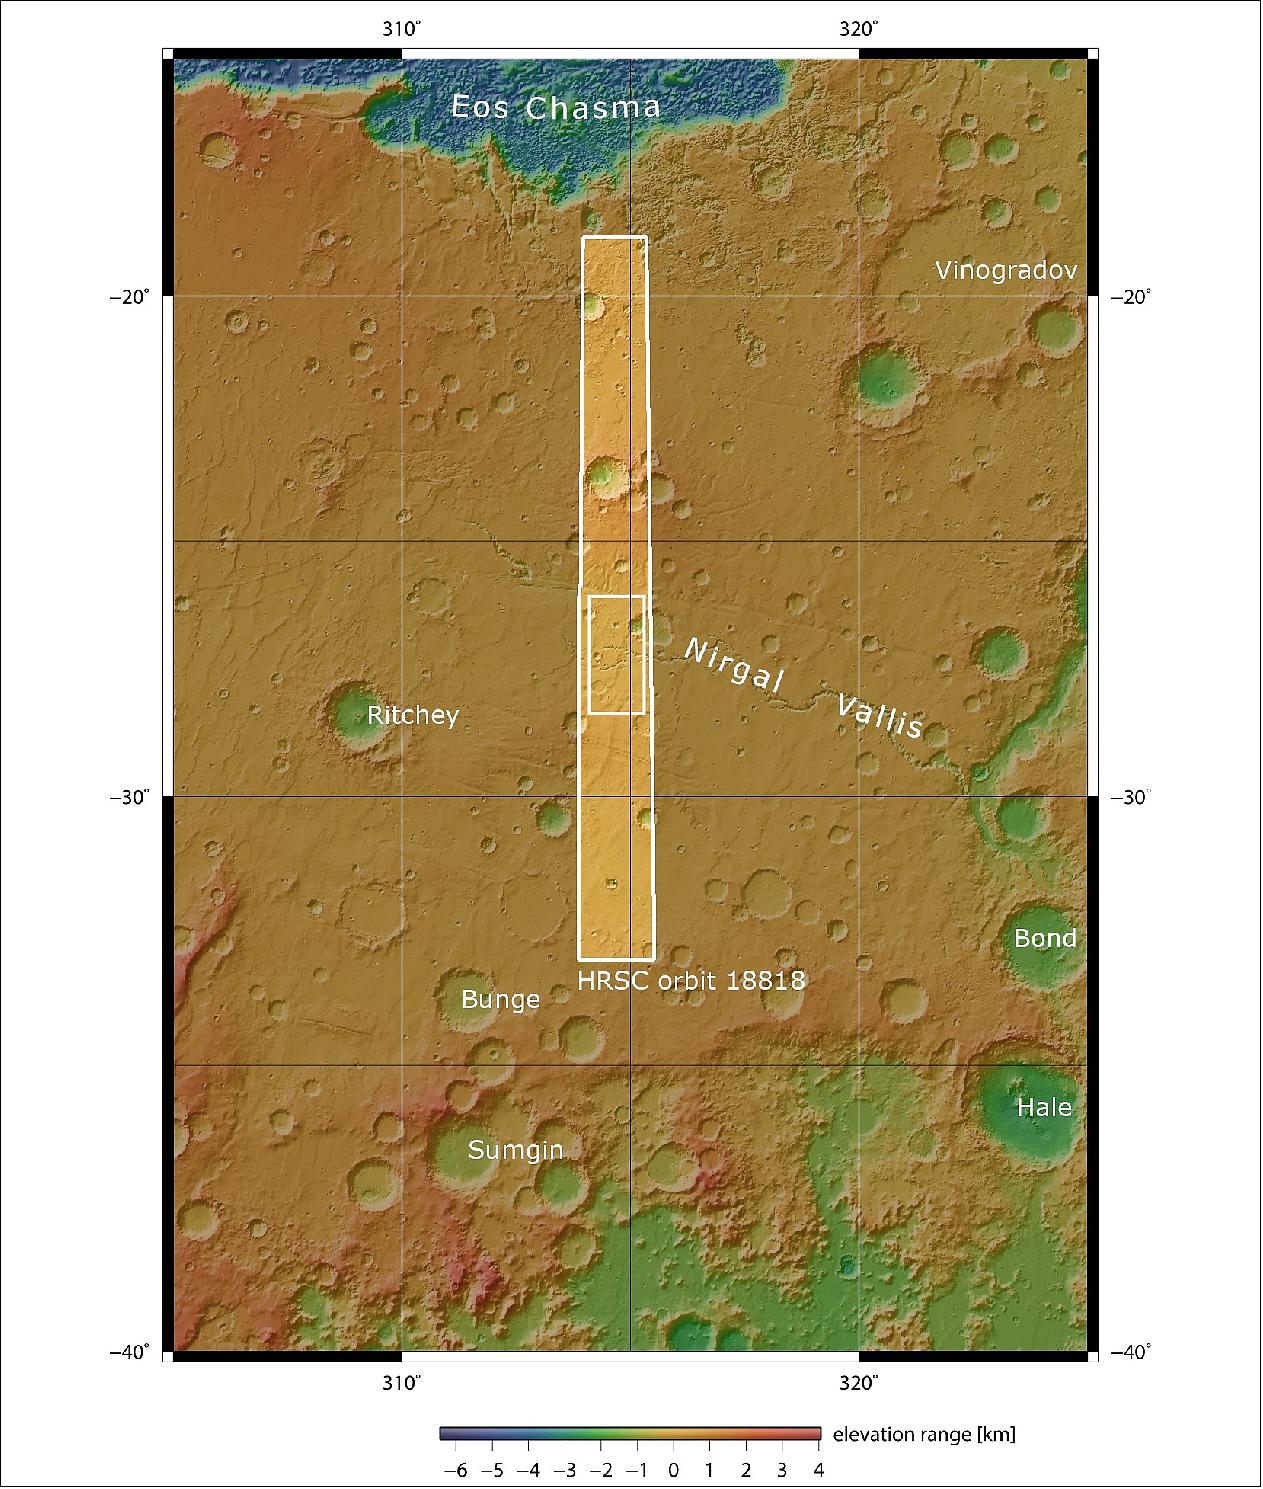
• 10 October 2019: Mars may seem to be an alien world, but many of its features look eerily familiar – such as this ancient, dried-up river system that stretches out for nearly 700 km across the surface, making it one of the longest valley networks on the planet. 5)
- The area of Mars shown in these new images from ESA's Mars Express spacecraft lies just south of the planet's equator, and is known to have been shaped by a mix of flowing water and impacts: events where rocks sped inwards from space to collide with the martian surface.
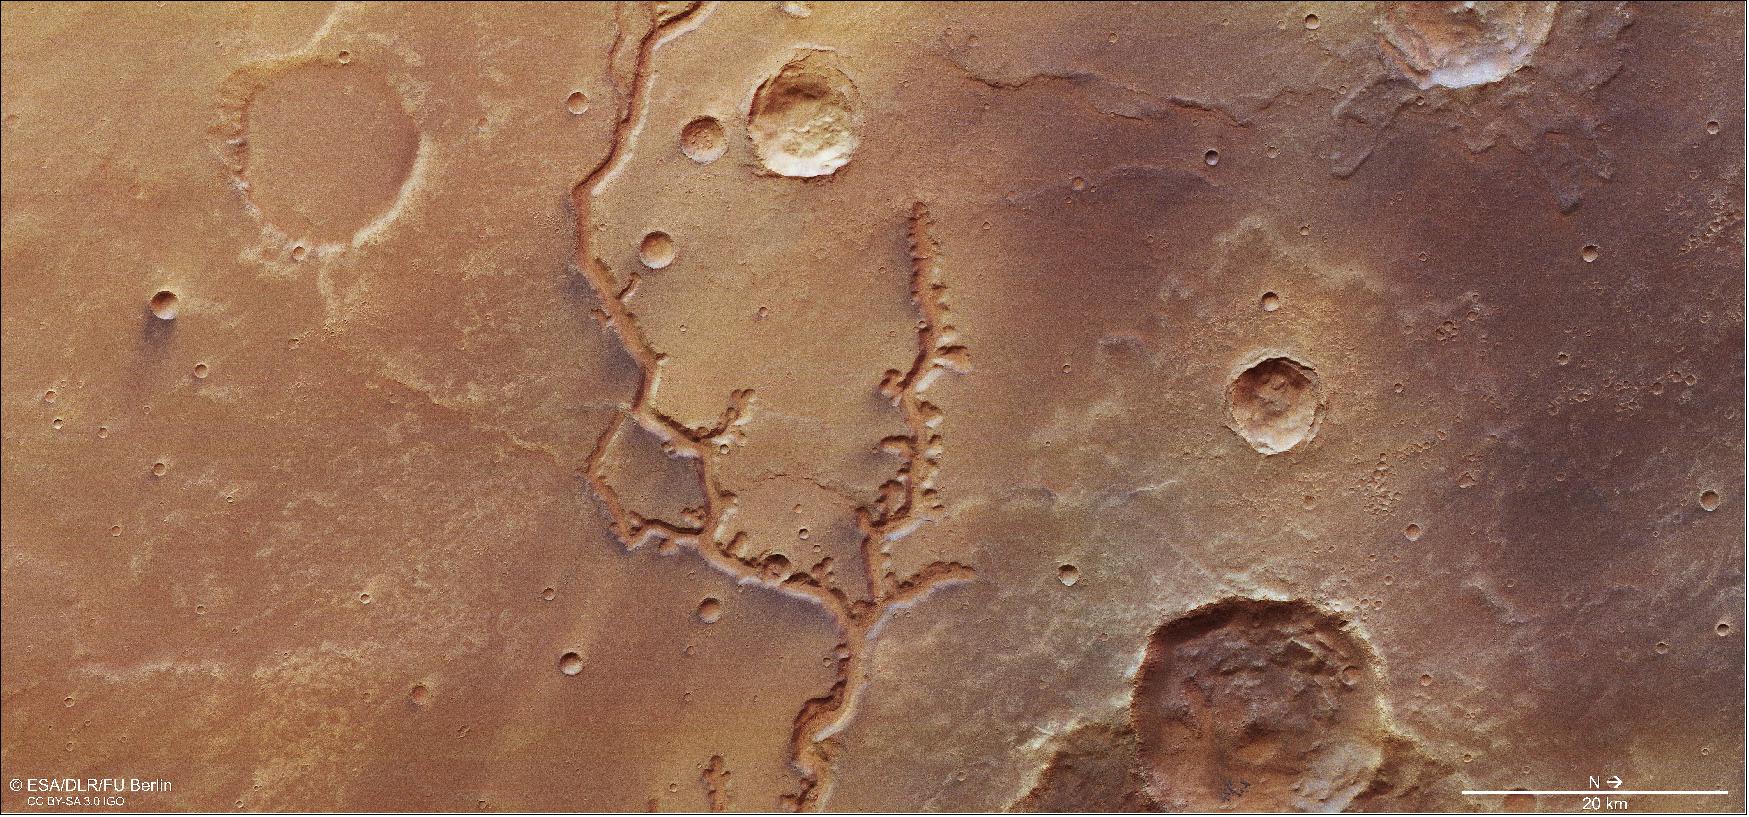
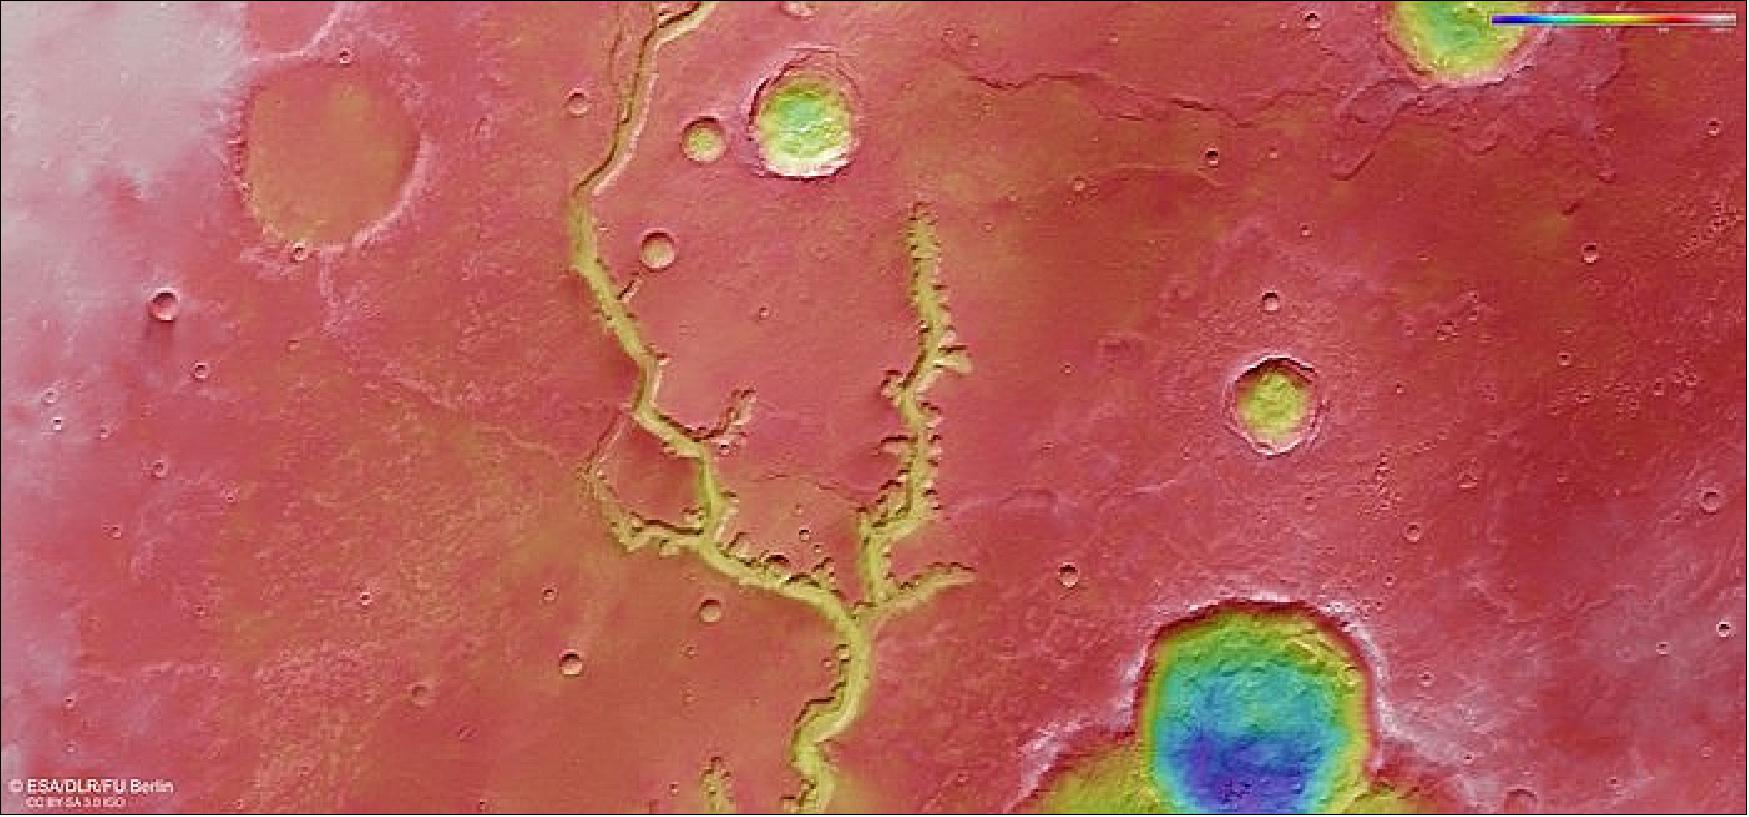
- Both of these mechanisms are visible here: a number of impact craters, some large and some small, can be seen speckled across the ochre, caramel-hued surface, and a tree-like, forked channel cuts prominently through the center of the frame.
- This ancient valley system is named Nirgal Vallis, and was once filled with running water that spread across Mars. By exploring the characteristics of the surrounding craters, scientists estimate the system's age to be between 3.5 and 4 billion years old.
- The part of Nirgal Vallis captured in these images lies towards the western end of the river system, where it is slowly spreading out and dissipating; the eastern end is far less branched and more clearly defined as a single valley, and opens out into the large Uzboi Vallis – the suspected location of a large, ancient lake that has long since dried up.
- Nirgal Vallis is a typical example of a feature known as an amphitheatre-headed valley. As the name suggests, rather than ending bluntly or sharply, the ends of these tributaries have the characteristic semi-circular, rounded shape of an Ancient Greek amphitheatre. Such valleys also typically have steep walls, smooth floors, and, if sliced through at a cross-section, adopt a ‘U' shape. The valleys pictured here are about 200 m deep and 2 km wide, and their floors are covered in sandy dunes; the appearance of these dunes indicates that martian winds tend to blow roughly parallel to the valley walls.
- We see valleys like this often on Earth, including valleys found in the Chilean Atacama Desert, the Colorado Plateau, and on the islands of Hawaii. Mars also hosts a few of them, with Nanedi Valles and Echus Chasma joining Nirgal Vallis as clear examples of this intriguing feature. Both of these features also resemble terrestrial drainage systems, where meandering, steep-sided valleys – thought to have been formed by free-flowing water – have carved their way through hundreds of kilometers of martian rock, forging through old volcanic plains, lava flows, and material deposited by strong martian winds over time
- Valleys such as Nirgal Vallis are ubiquitous in the low-latitude regions surrounding the martian equator, indicating that these areas once experienced a far milder and more Earth-like climate. Despite the arid, hostile world we see today, Mars is thought to have once been a far warmer and wetter planet – and we see signs of this in the diverse mix of features and minerals found across its surface.
- Scientists believe that Nirgal Vallis formed in a similar way to morphologically similar valleys we see on Earth. As there appear to be no branching, tree-like tributaries feeding into the main valley of Nirgal Vallis, it is likely that water was replenished on ancient Mars by a mix of precipitation and overland flow from the surrounding terrain.
- The system may also have its roots in a process known as groundwater sapping: when water struggles to travel vertically through a medium, and so instead continually seeps laterally through material in layers beneath the surface. We see this kind of mechanism on Earth in environments where surface material is very fine and loose and thus difficult for water to penetrate – largely silty, sandy, unconsolidated, and fine-grained environments, where lower layers of the surface are permeable and friendlier to water than those above.
- The spacecraft captured these observations using its HRSC, an instrument that is mapping the whole surface Mars in full color and at high resolution. Its aim – of characterizing and understanding the Red Planet in its entirety – will be supported and continued by the ESA-Roscosmos ExoMars Trace Gas Orbiter, which arrived at Mars in 2016, and the ExoMars Rosalind Franklin rover and its accompanying surface science platform, which will arrive next year. Together, this ground-breaking fleet will help unlock the mysteries of Mars.
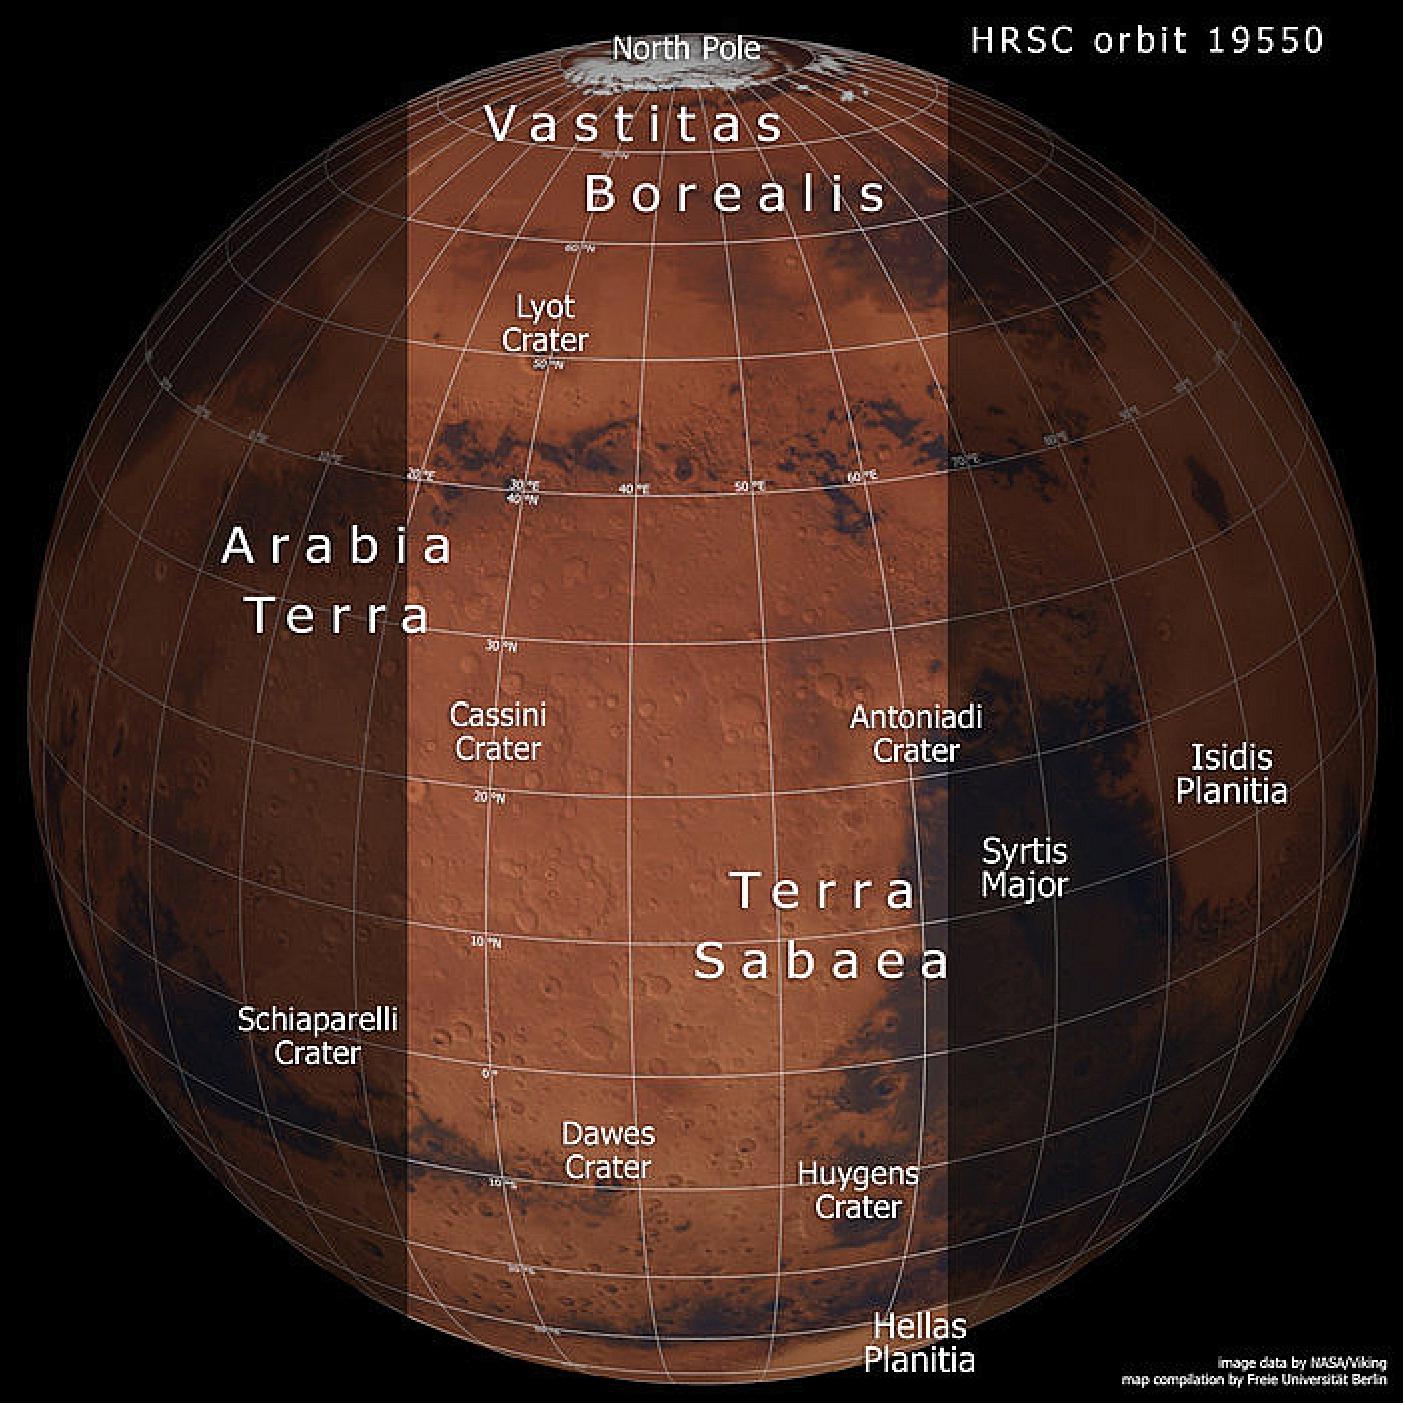
• 19 September 2019: This beautiful view from ESA's Mars Express stretches from the bright, cloud-covered north pole of Mars to the contrasting hues of the northern hemisphere and the cratered terrain in the south. 6)
- Mars Express has been orbiting Mars since 2003. The spacecraft has sent back myriad breathtaking images of our planetary neighbor in the past decade and a half, captured by the probe's on-board HRSC (High Resolution Stereo Camera) – and this image is no different.
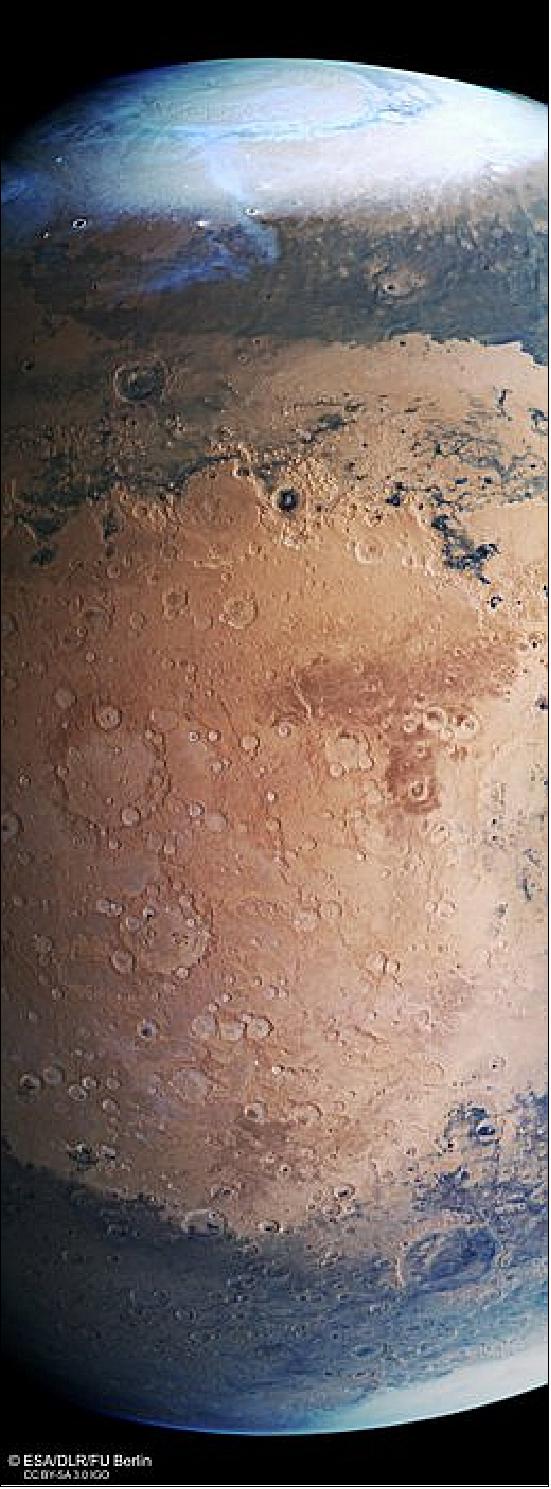
- he spacecraft imaged this slice across the planet's surface in June 2019, when the camera took several global views. Visible at the top of the frame is Mars' ethereal north pole: this is permanently covered by a cap of frozen water and carbon dioxide, which thickens in the northern martian winter and thins in the summer.
- The northern polar cap is seen here encircled by bright, eye-catching clouds, tendrils of which snake downwards from the polar region to obscure some of the planet's northern hemisphere. As this image shows, this patch of Mars is a mix of different tones and colors – a reflection of the different chemical and physical characteristics of the material that makes up the surface. Mars' two hemispheres are very different in a number of ways.
- Most notably, the northern hemisphere sits several kilometers lower than the southern, and the two are separated by a distinctive, rugged boundary formed of canyons, cliffs and scarps, fractures, valleys, flat-topped mounds known as mesas, and many other features. The northern hemisphere is also characterized by low-lying plains that are largely unmarked by impact craters and thus thought to be relatively young, while the southern hemisphere is ancient, showing signs of intense cratering.
- This separation can be seen here, and is shown especially clearly in the accompanying topographic context map.
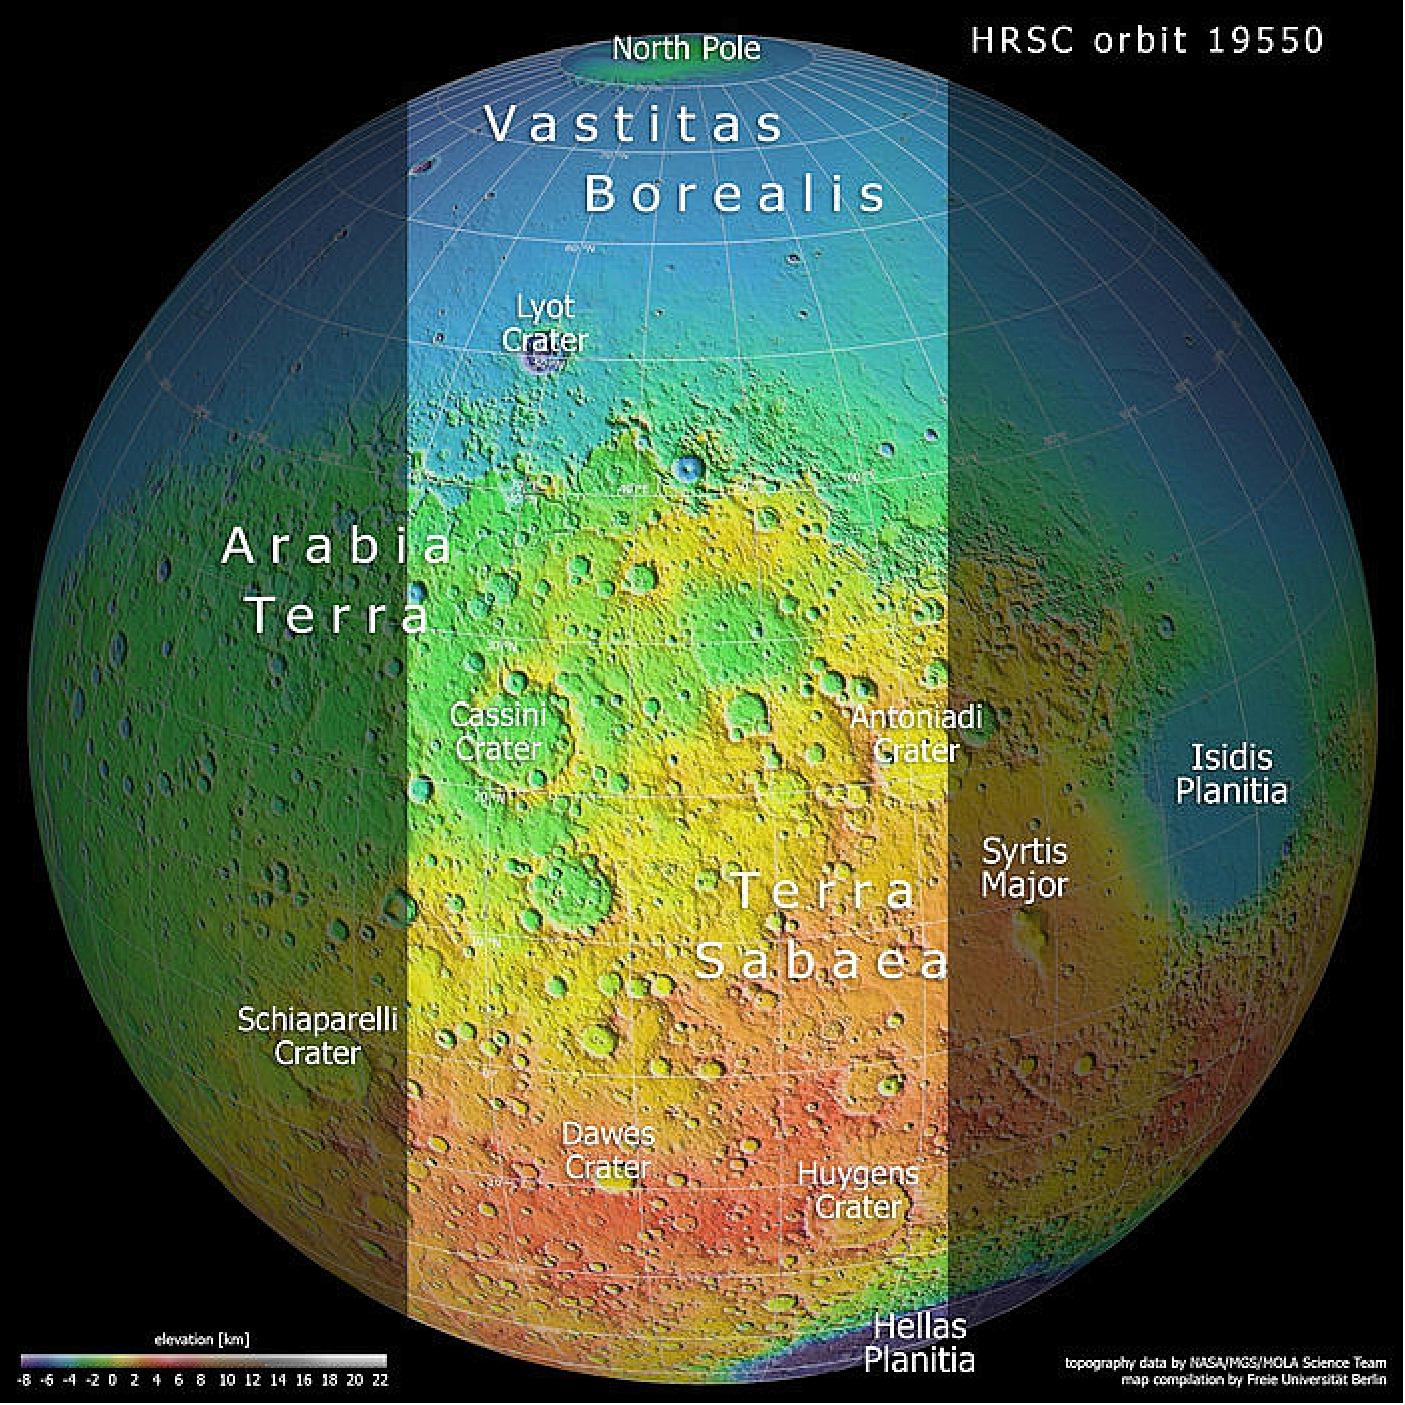
- The dark and dusty young plains of the northern hemisphere sit just below the white northern cap; these meet and merge with a prominent escarpment that slices across the planet, creating a dark scar on the tan-colored surface. Below this, in tones ranging from rusty orange to pale butterscotch, are the southern highlands, featuring more craters than it is possible to count.
- Two main regions are shown here: Arabia Terra (towards the upper left) and Terra Sabaea (to the middle and lower right, forming the main bulk of the highlands visible in this slice).
- The light region stretching out of frame to the bottom right is Hellas Planitia, a plain that is home to the Hellas basin: one of the largest basins identified on Mars – and, in fact, in the Solar System – at 2300 km across.
- The split between Mars' two hemispheres is known as the martian dichotomy, and remains one of the greatest mysteries about the planet.
- Was it formed due to geological processes within Mars' mantle? Did the planet's crust once comprise various moving tectonic plates, as we see on Earth, that pushed against one another to form the dichotomy? Could it have been created by one or more colossal past impacts – or by another process entirely?
- Observations of the boundary zone between the two hemispheres show that this region has been altered over time by wind and water, including by glaciers. Mars is thought to have seen various bursts of glacial activity over the years, where deposits of ice – sometimes hidden beneath layers of soil or dust – form viscous flows that slowly move across the surface, altering it as they go.
- Mars Express was recently joined at Mars by the ESA-Roscosmos ExoMars Trace Gas Orbiter (TGO), which arrived in 2016 and has since been analyzing the martian atmosphere and mapping the planet's surface. Mars Express and the TGO will soon welcome the ExoMars Rosalind Franklin rover and its accompanying surface science platform, which are scheduled for launch in July of 2020.
- This growing fleet will continue ESA's long-standing presence at Mars, and further our understanding of the planet and its many remaining scientific mysteries – including the martian dichotomy.
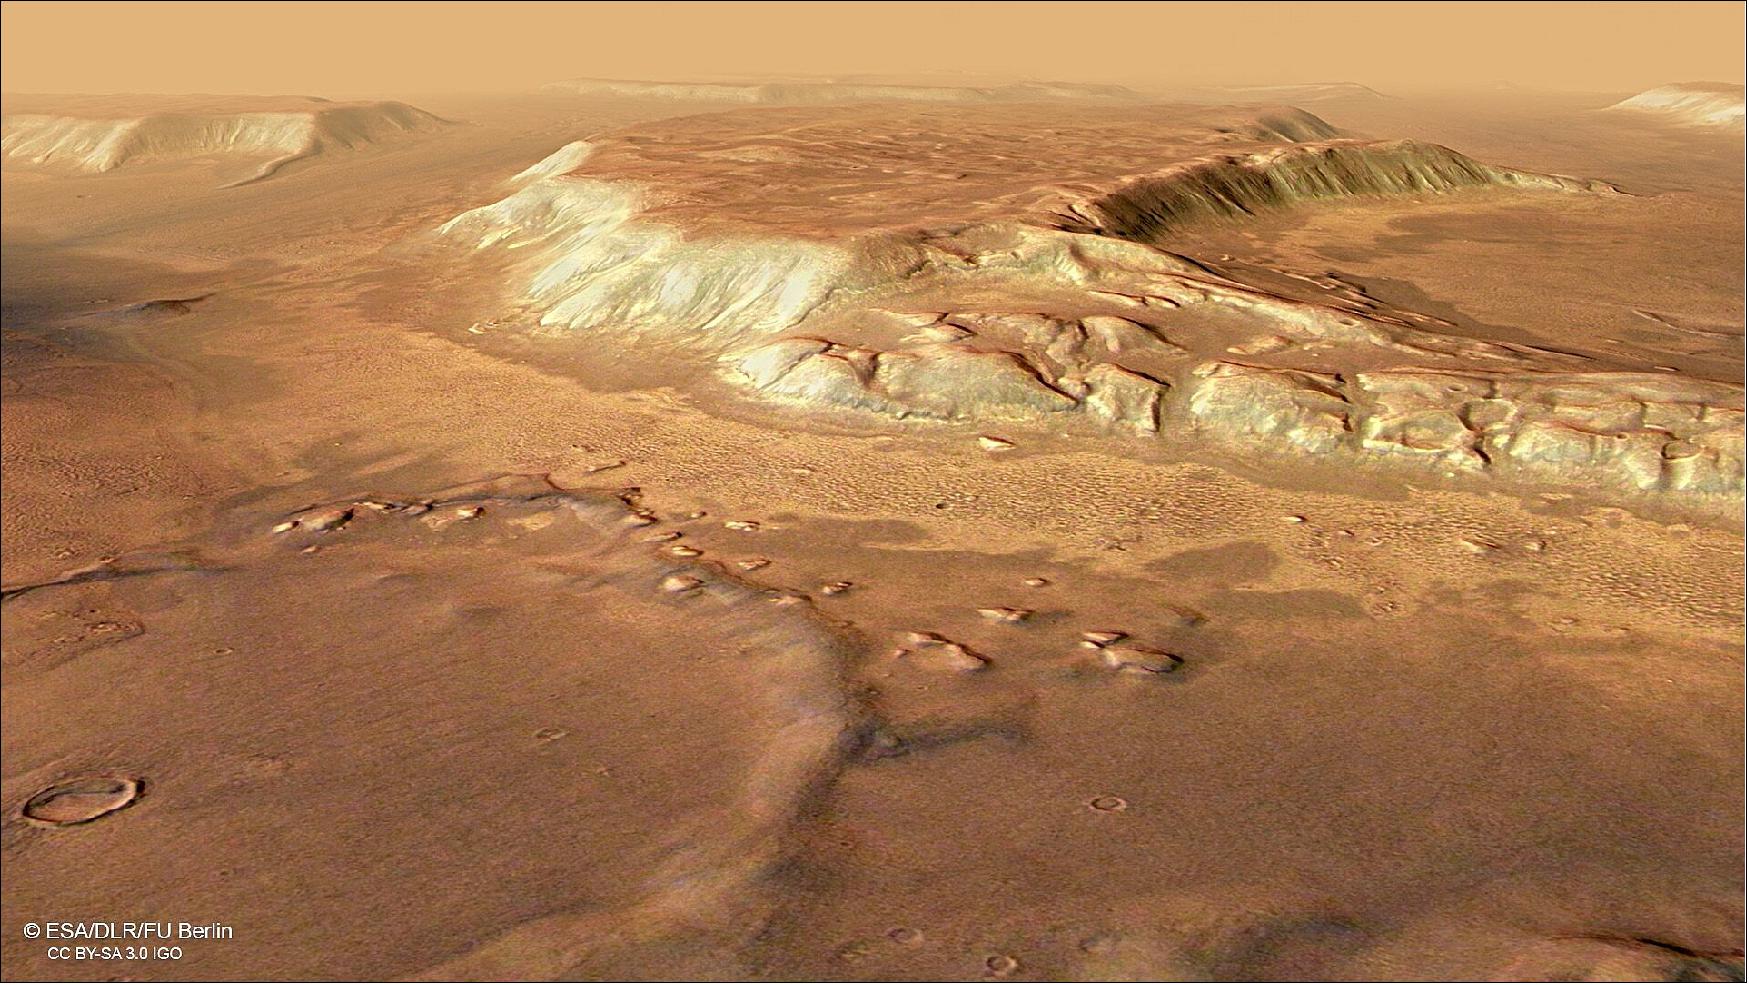
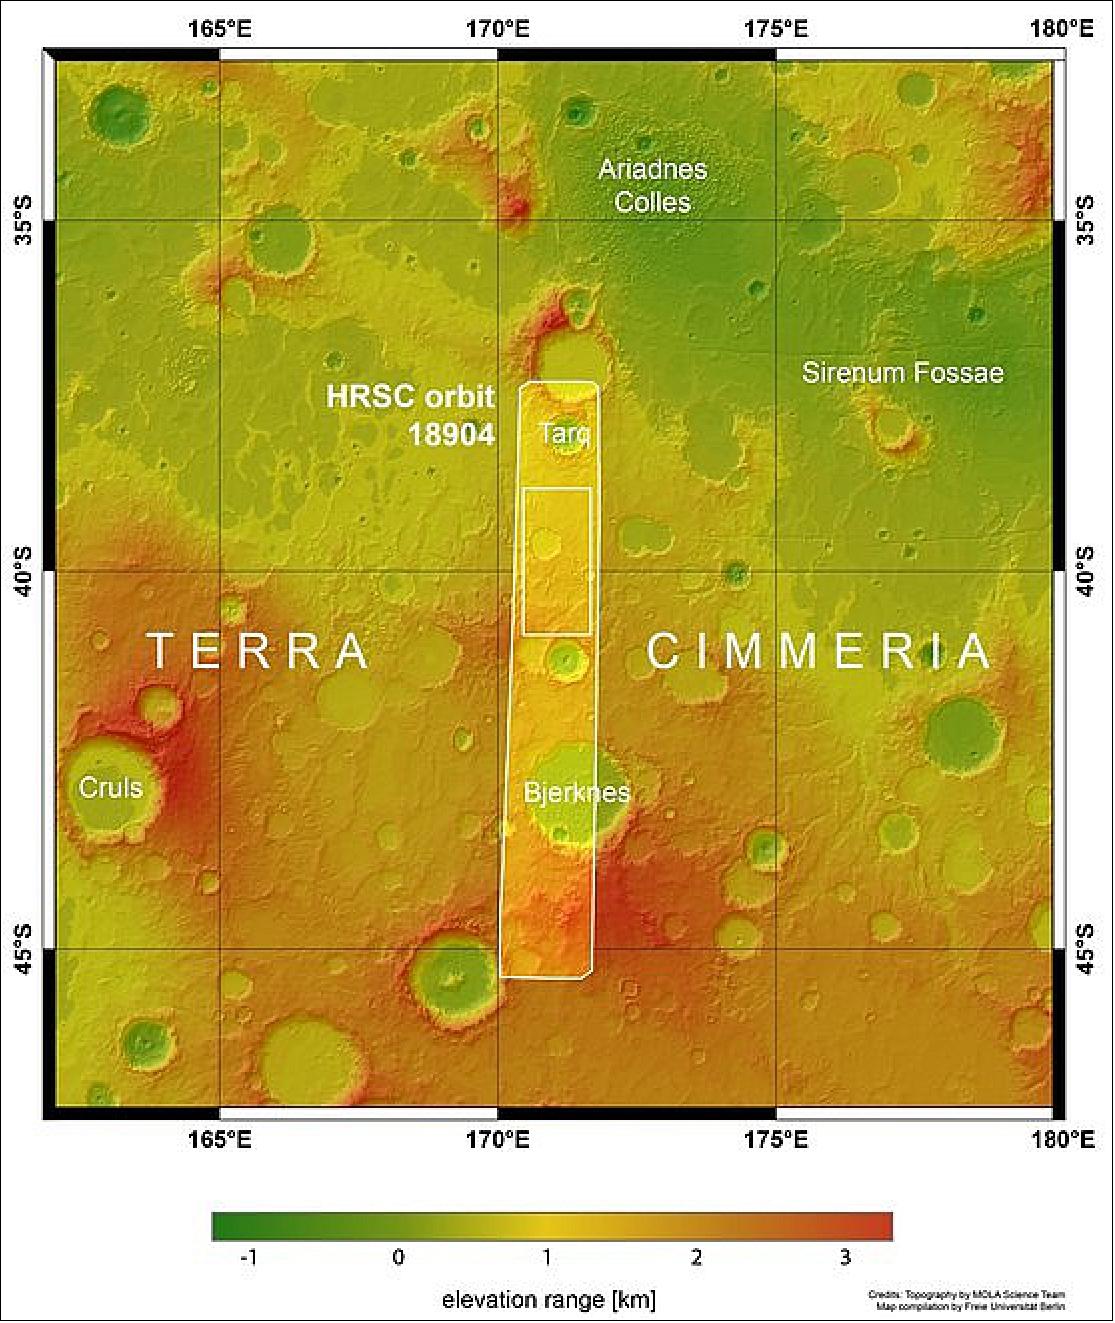
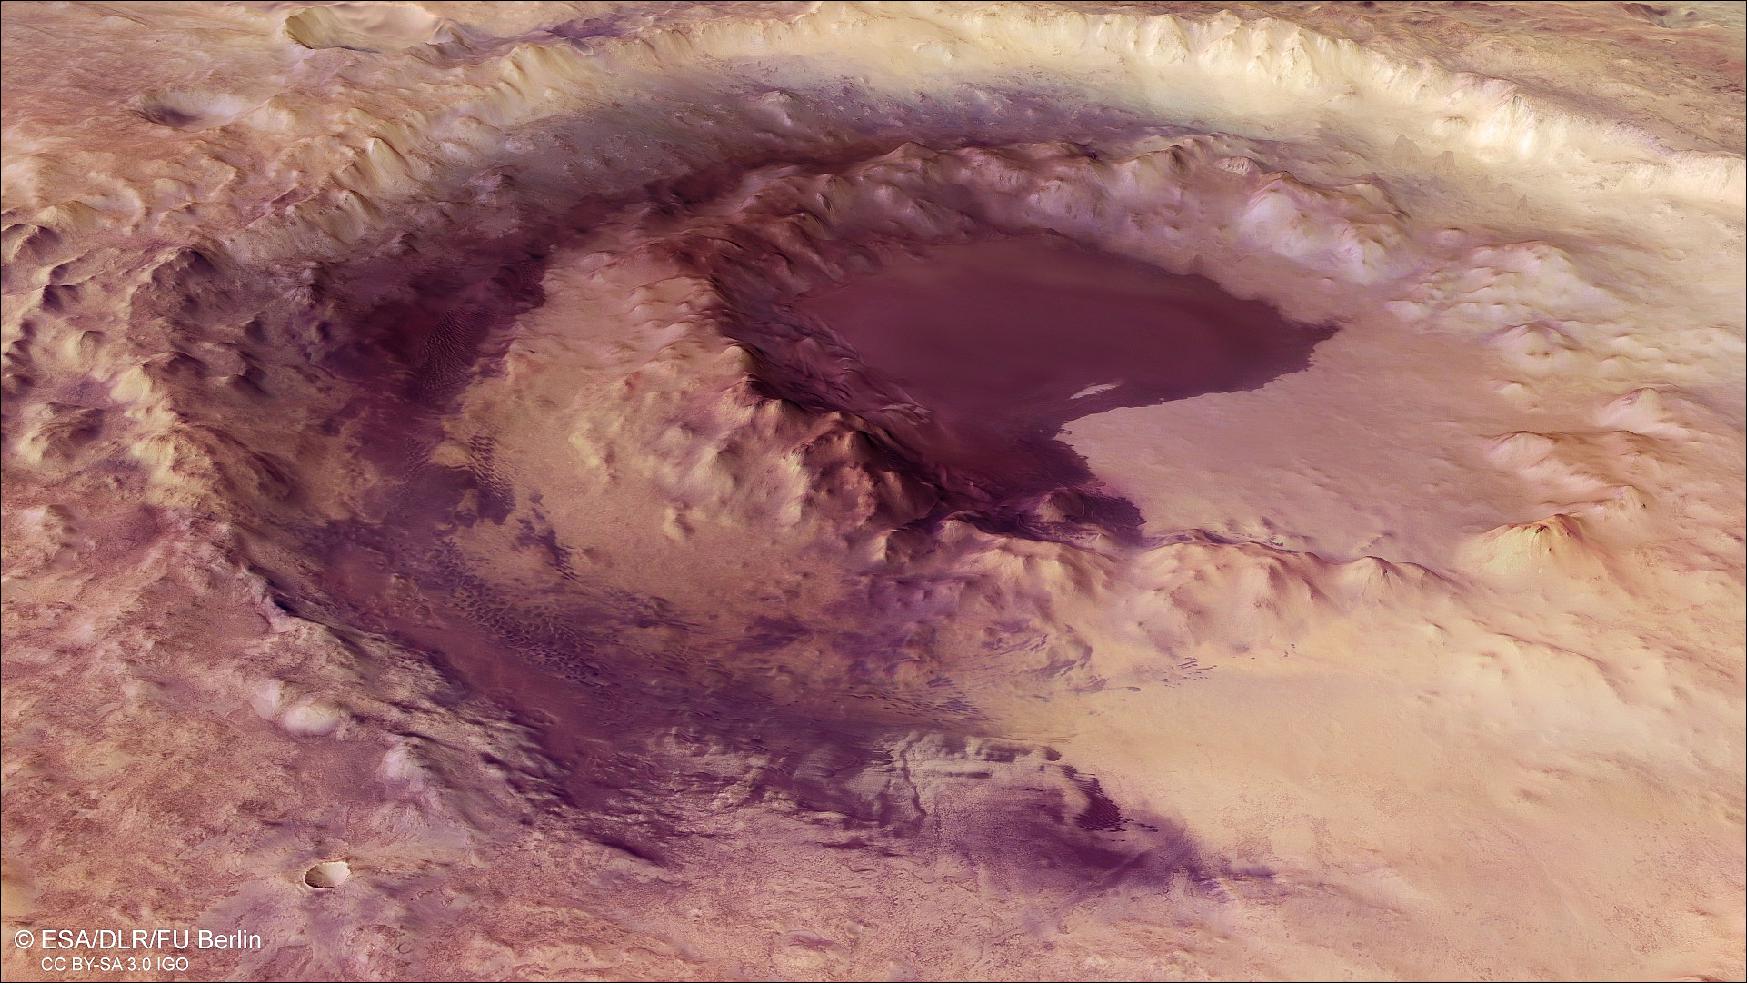
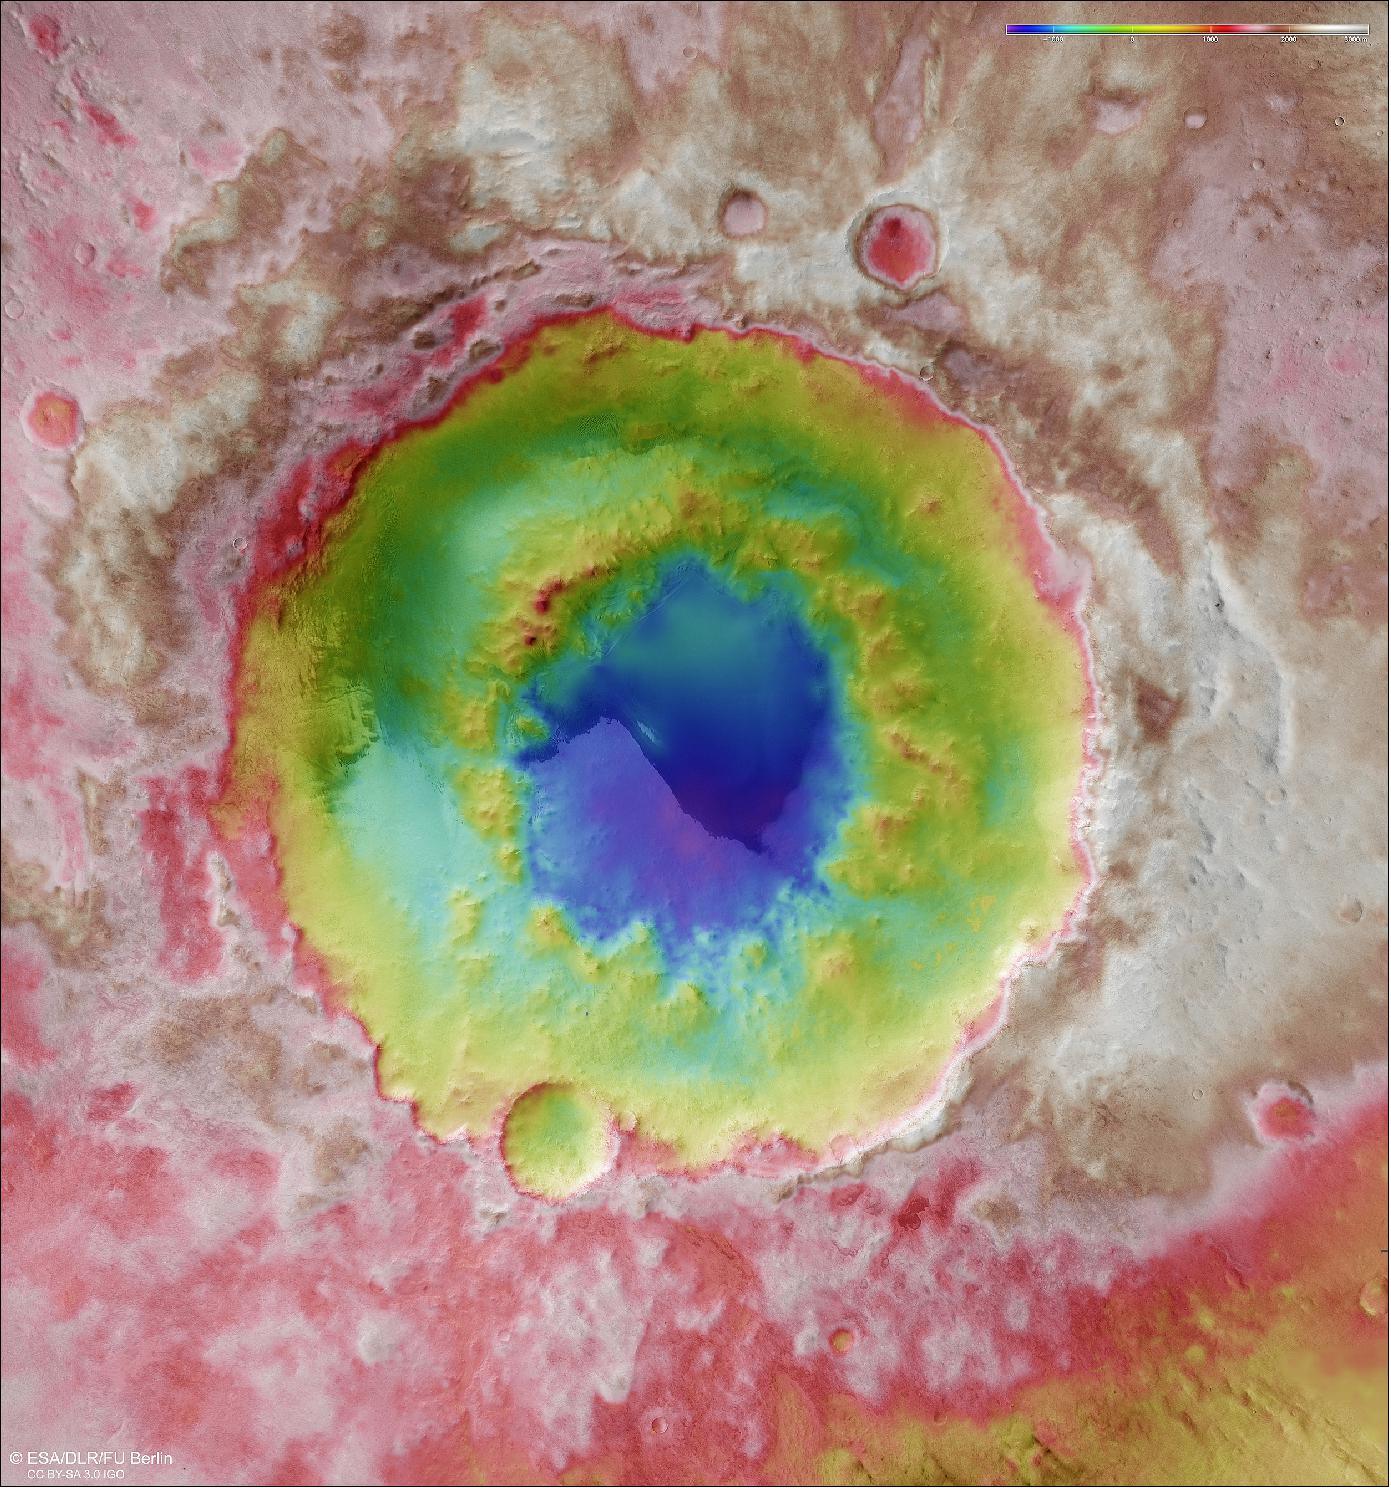
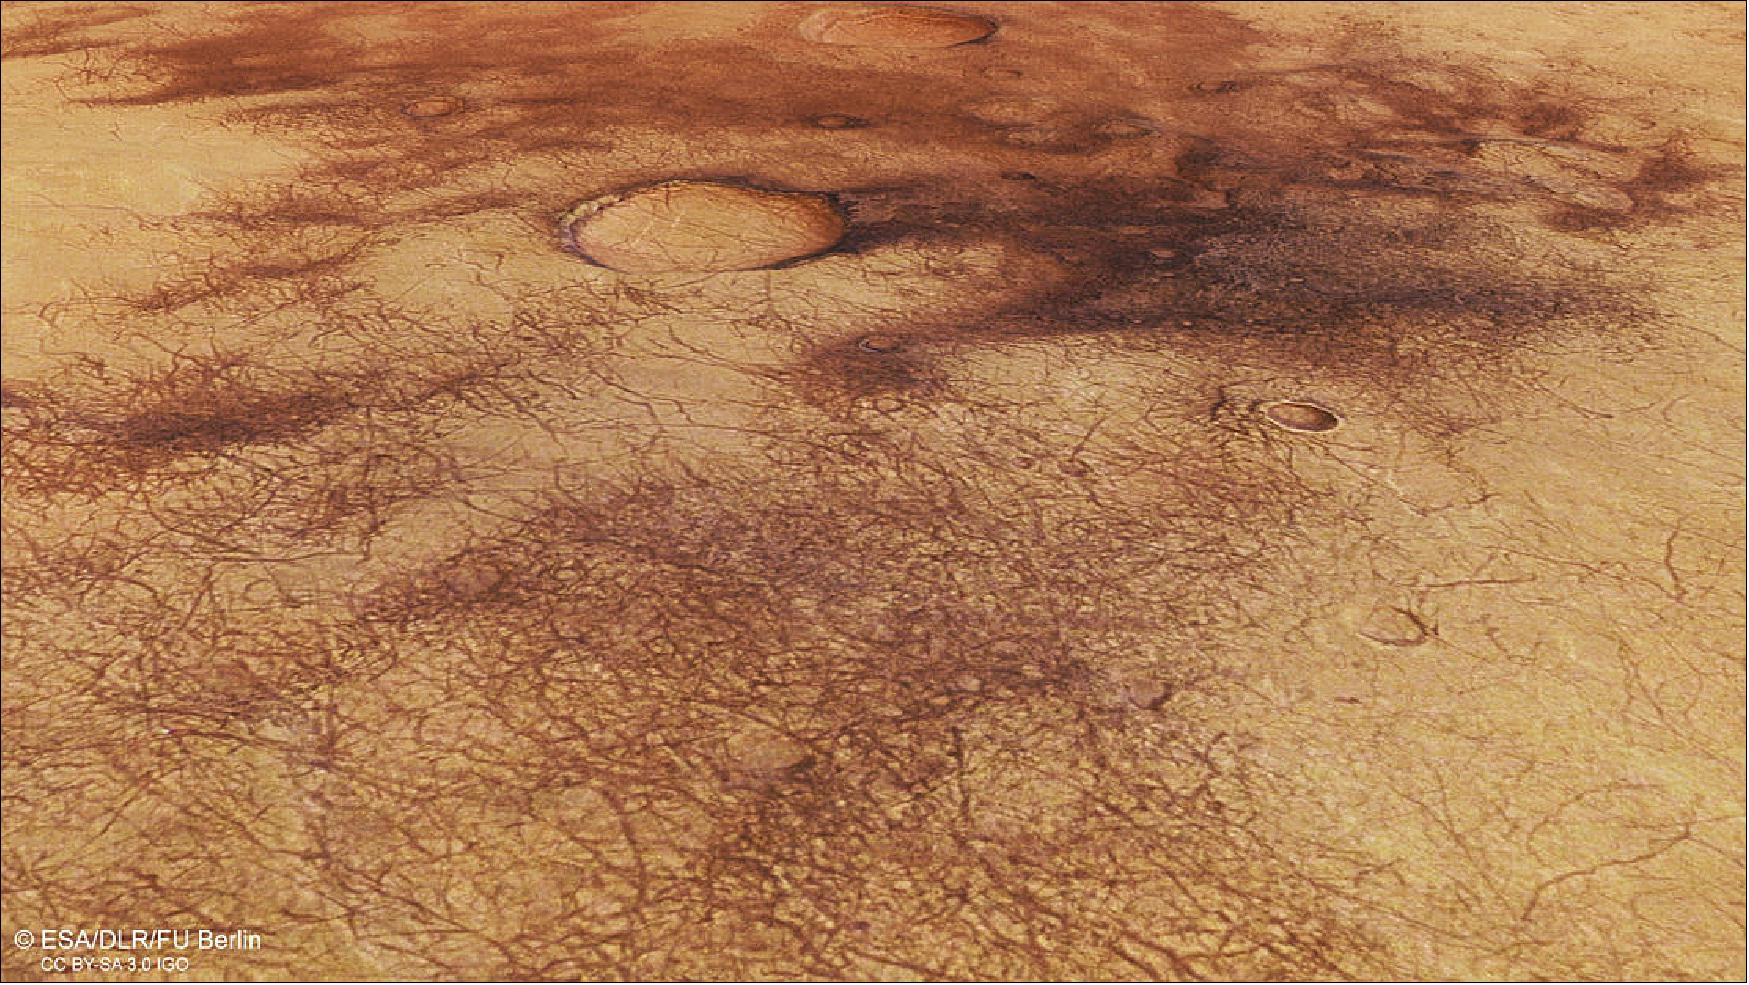
• 08 August 2019: ESA's Mars Express has captured the cosmic contrast of Terra Cimmeria, a region in the southern highlands of Mars marked by impact craters, water-carved valleys, and sand and dust in numerous chocolate and caramel hues. 7)
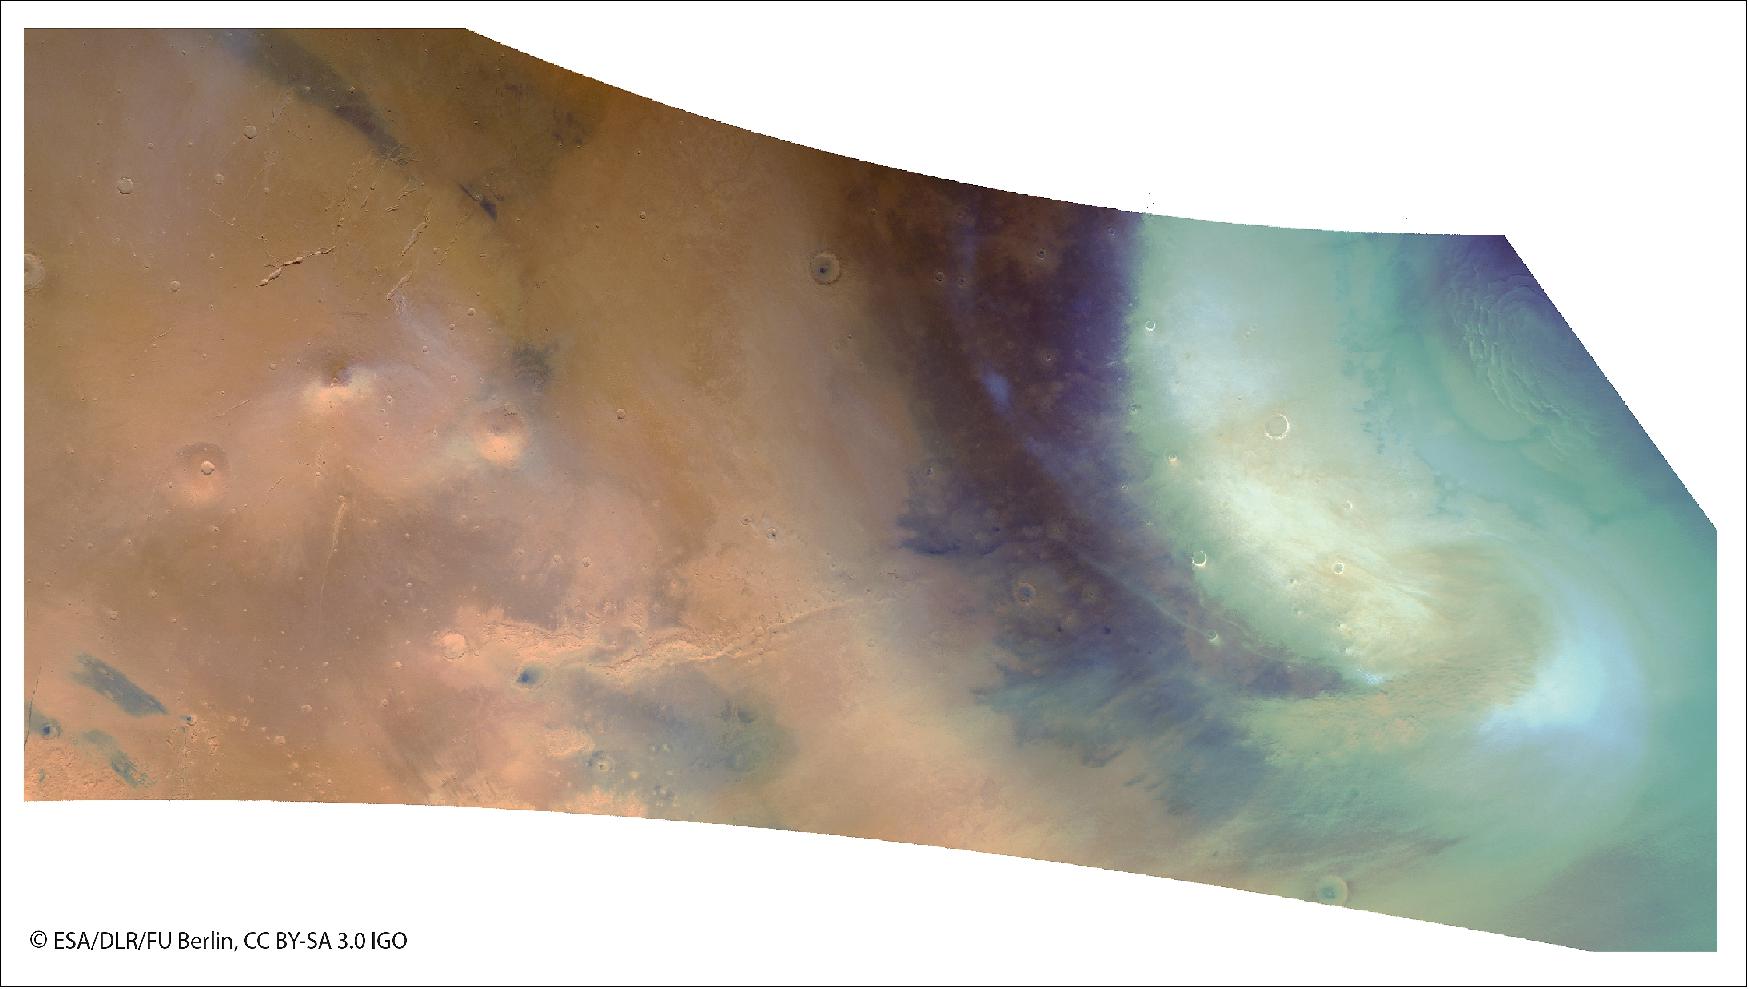
- Mars is often referred to as the Red Planet, due to the characteristic hue of its orb in the sky. Up close, however, the planet is actually covered in all manner of colors – from bright whites and dark blacks to yellows, reds, greens, and the cappuccino tones seen here.
- These differences in color are visible from telescopes on Earth. They are undeniably visually striking, but also reveal a significant amount about the composition and properties of the surface material itself.
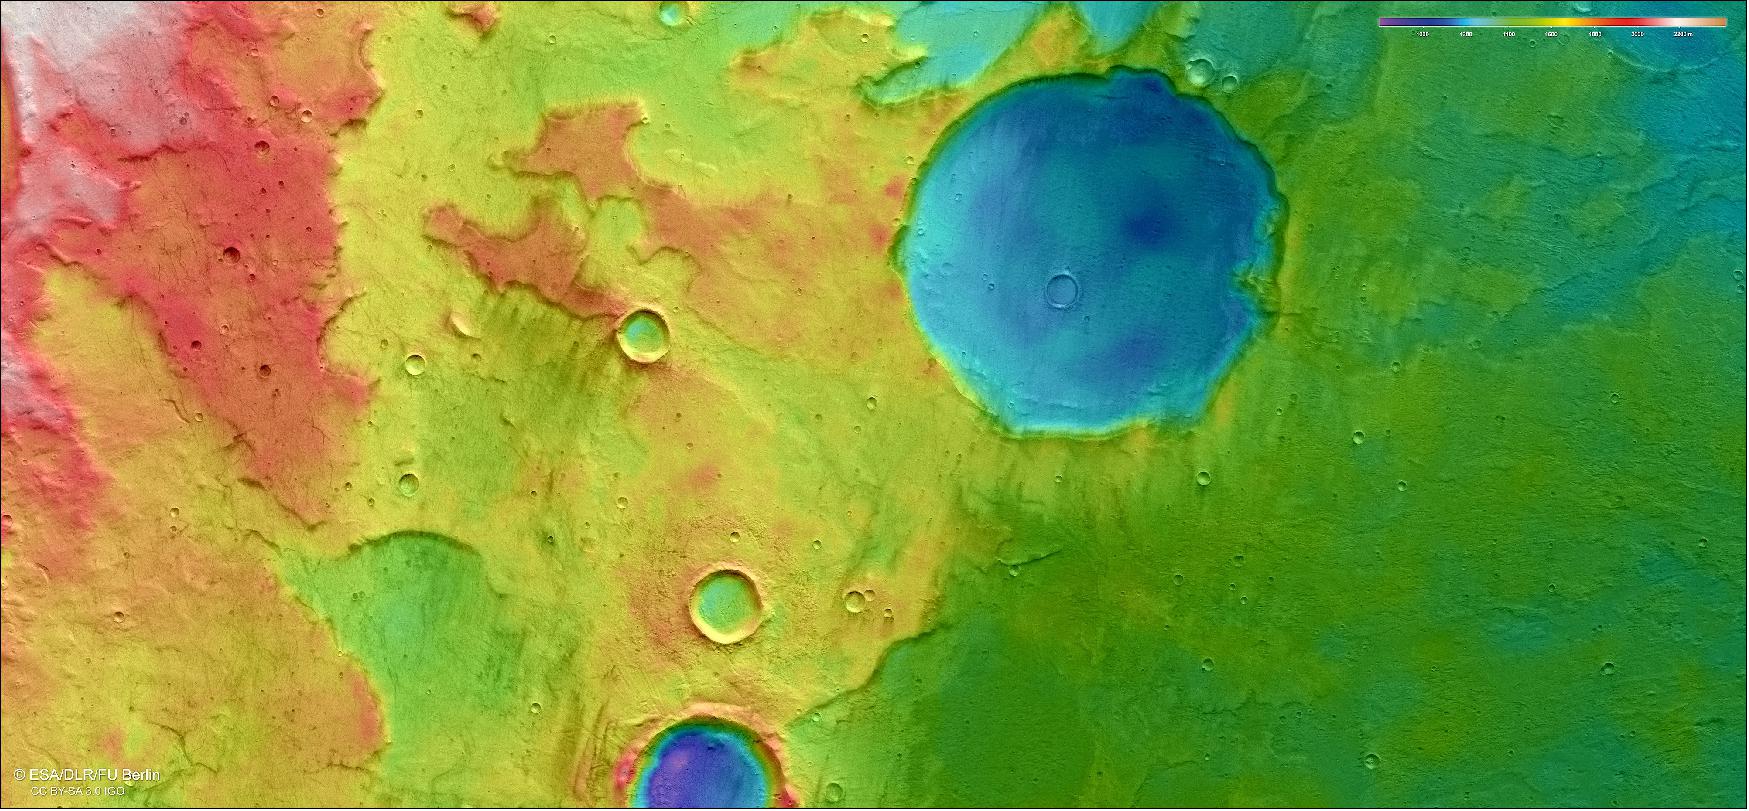
- These views, based on Mars Express data are a great example of the diversity found on the martian surface: the darker regions towards the right (north) in the image at the top of this page are rich in minerals of volcanic origin, the most common of which found on Mars is basalt. The lighter patches to the left (south) are instead largely covered in fine silicate dust.
- Mars is thought to have once seen significant volcanic activity. The planet hosts some of the largest volcanoes in the Solar System, including the very biggest, Olympus Mons, and has several notable volcanic provinces (two of which are Tharsis and Elysium). The volcanoes within these regions once released ash and dust that covered and coated the surface of Mars, forming dark basaltic sands that were swept around and covered up by other material over time.
- The largest crater in the image measures 25 km across and is 300 m deep – this relatively shallow depth is likely due to the crater being filled up with other material since its formation. Surrounding this crater are various plains, valleys, and ‘mesas' – steep-sided mounds rising up from the martian surface.
- Some of these features are the remnants of a former water-filled valley system, seen most clearly to the upper right of the frame. These valleys spread across Terra Cimmeria, once moving water and material throughout the area.
- This water was locked up within surface ice and snow, but recent research points towards several episodes of melting that unlocked the water from glaciers and sent it flowing across Mars in liquid form.
- To the left of the frame, thin dark trails can be seen snaking and sweeping across Terra Cimmeria – a tell-tale sign that ‘dust devils' were once present here. Dust devils form as eddies of wind that displace the top layer of dust from the martian surface, sending it swirling up into the air. This in turn reveals a deeper layer of material that is different in color, creating a sharp visible contrast.
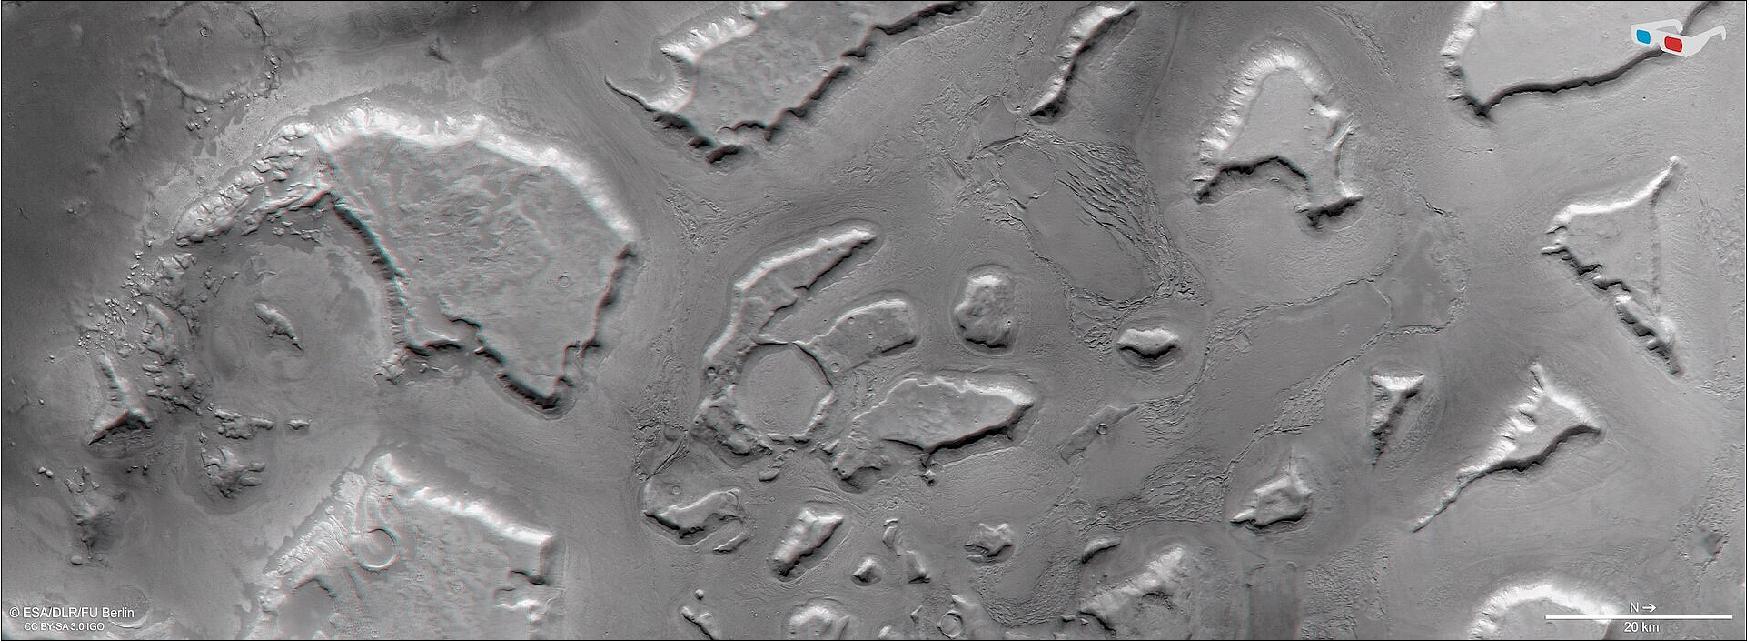
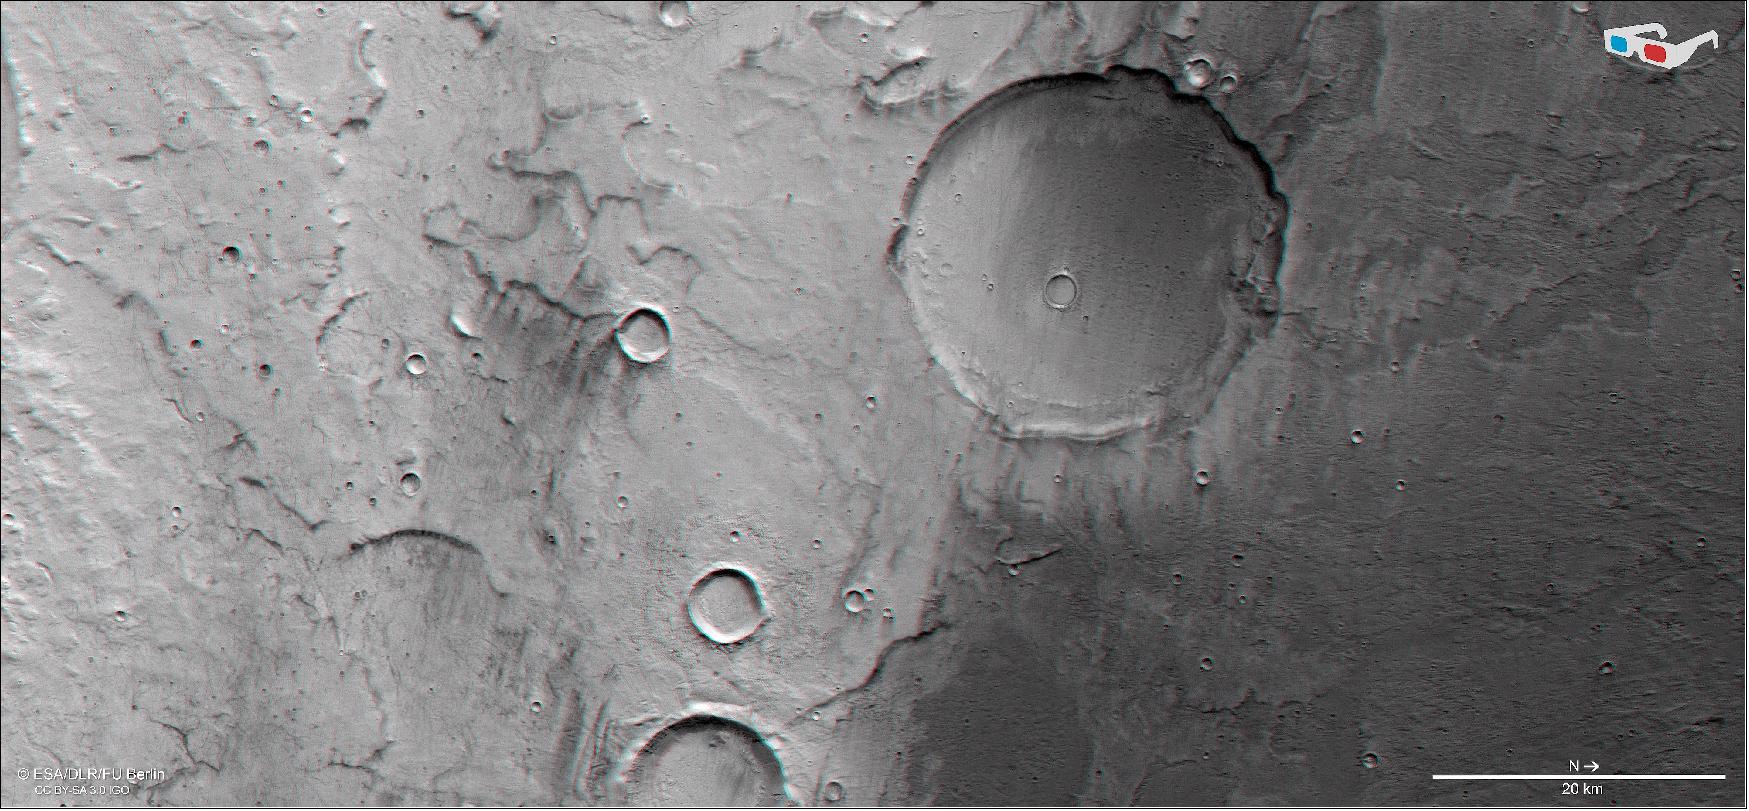
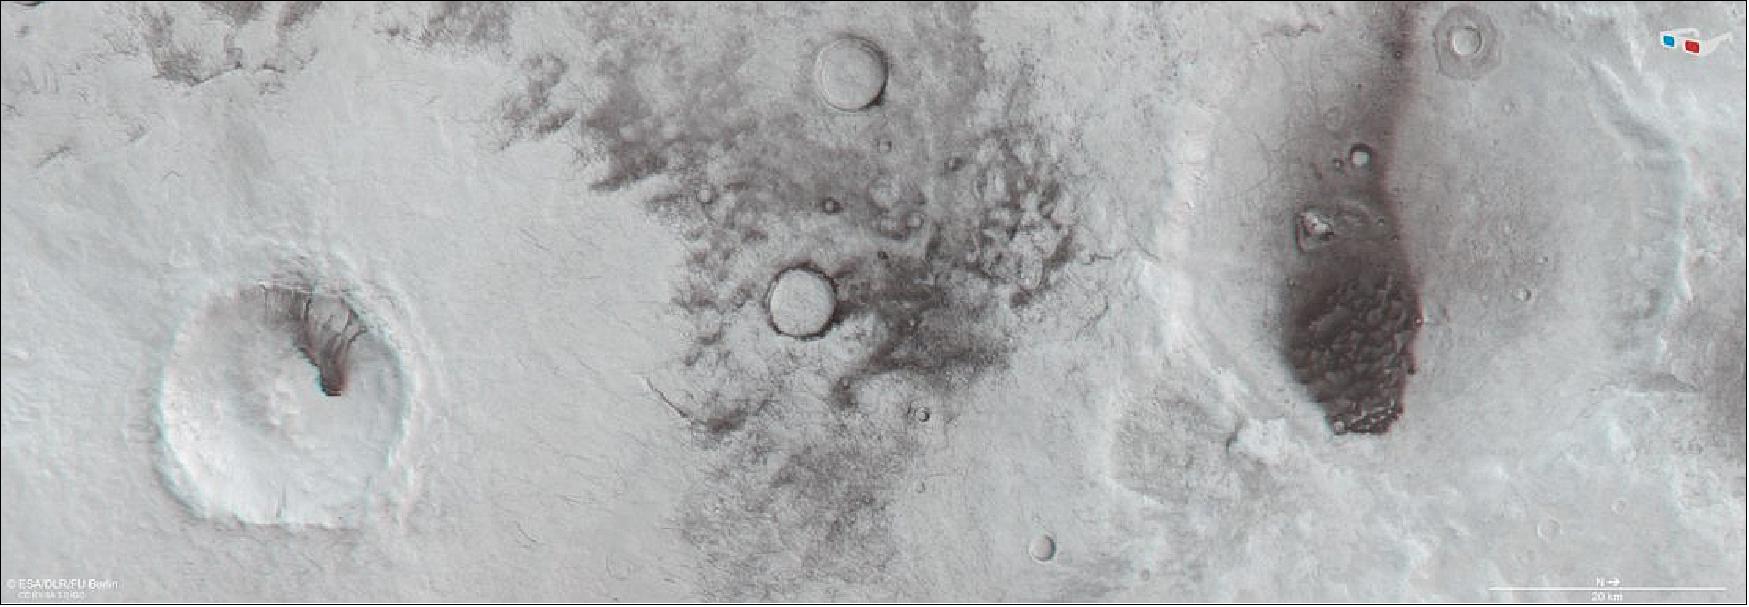
- Another group of dark, but larger, wind-formed features known as ‘wind streaks' can be seen near the center-left of the image at the top of the page – shown below also as an anaglyph. These form in a similar way to dust devil tracks, except that they are caused not by eddies, but by local winds being forced over topographic features such as craters or cliffs.
- Because of this, streaks can appear to emanate from these features. Wind streaks are useful indicators in atmospheric studies; for instance, the wind that formed the streaks in this image was blowing in a roughly south-easterly direction (given that north is to the right).
- Whether altered by water, wind, impact or other means, the surface of Mars is a dynamic environment – and ESA's Mars Express, in orbit around Mars since 2003, has managed to capture all manner of phenomena on the Red Planet in the past 16 years.
- Using instruments including its High Resolution Stereo Camera, responsible for these new images, the spacecraft has watched as giant dust storms kicked up material into the air to obscure wide regions of the surface from view; spotted signs of ancient sub-surface water systems that hint at the planet's wetter past; and probed the martian atmosphere for signs of molecules we know to be linked to life on Earth.
- It has found signs of tectonic activity at far more recent timescales than previously thought; watched strange clouds form and dissipate with the seasons; explored the patches of ice found at Mars' northern and southern poles; and characterized the planet's two small, mysterious moons, Phobos and Deimos.
- ESA's fleet at Mars grew with the arrival of the ESA-Roscosmos ExoMars Trace Gas Orbiter in 2016, which has been making a detailed analysis of the planet's atmosphere and mapping its surface. Next year, the ExoMars Rosalind Franklin rover and its accompanying surface science platform will be launched to further our understanding of Mars from the planet's intriguing surface.
• 04 July 2019: ESA's Mars Express has been keeping an eye on local and regional dust storms brewing at the north pole of the Red Planet over the last month, watching as they disperse towards the equator. 8)
- Local and regional storms lasting for a few days or weeks and confined to a small area are common place on Mars, but at their most severe can engulf the entire planet, as experienced last year in a global storm that circled the planet for many months.
- It is currently spring in the northern hemisphere of Mars, and water-ice clouds and small dust-lifting events are frequently observed along the edge of the seasonally retreating ice cap.
- Many of the spacecraft at Mars return daily weather reports from orbit or from the surface, providing global and local impressions of the changing atmospheric conditions. ESA's Mars Express observed at least eight different storms at the edge of the ice cap between 22 May and 10 June, which formed and dissipated very quickly, between one and three days.
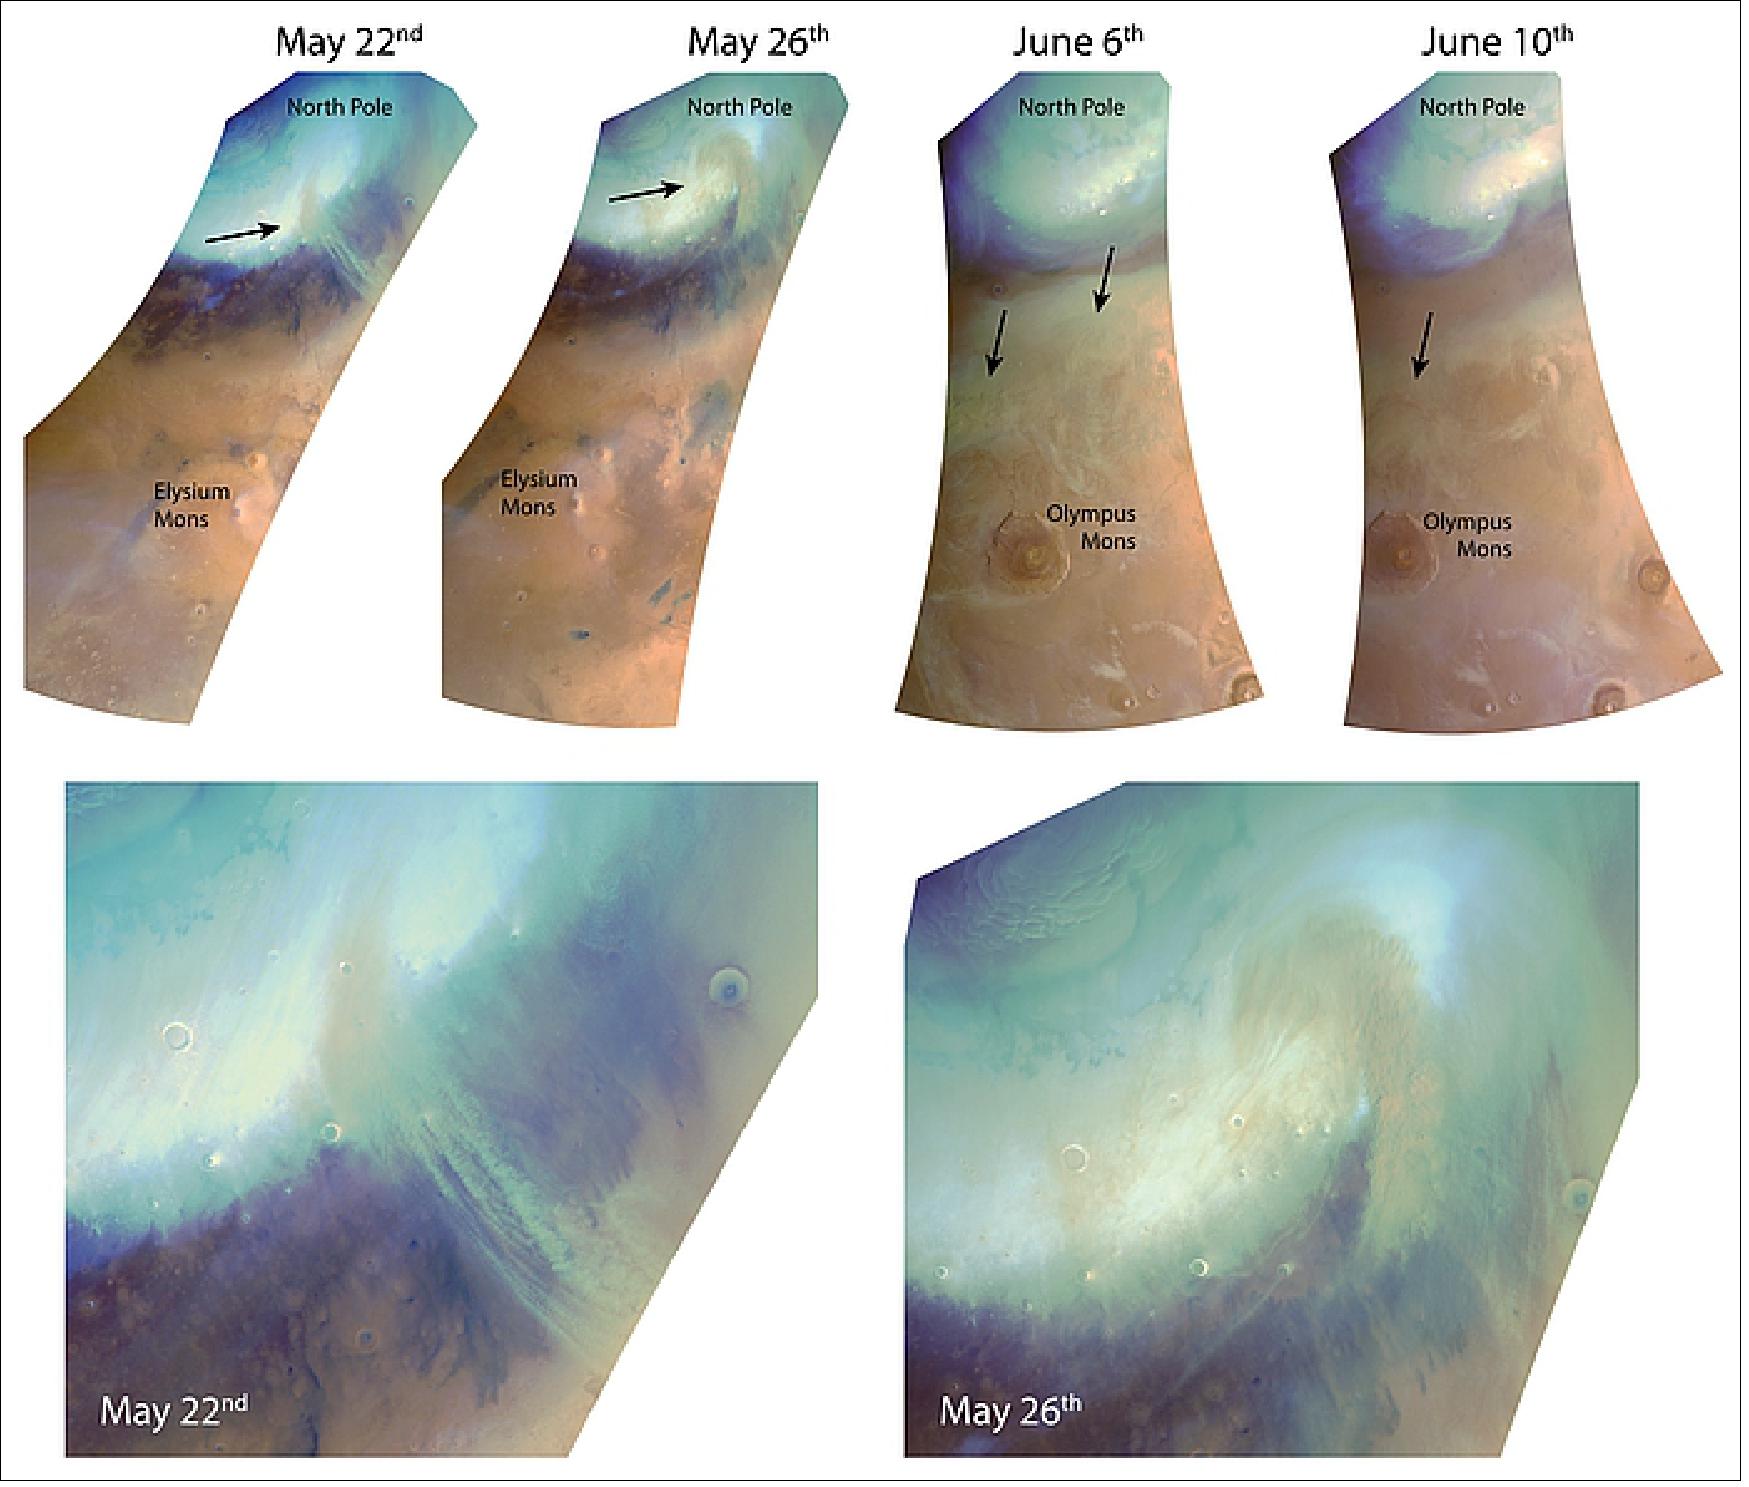
- The two cameras onboard the spacecraft, the High Resolution Stereo Camera (HRSC) and the Visual Monitoring Camera (VMC), have been monitoring the storms over the last weeks. The image of Figure 26, taken by HRSC on 26 May, captures a spiral-shaped dust storm, its brown color contrasting against the white ice of the north polar ice cap below.
- Meanwhile the animated sequence (Figure 27) was compiled from images of a different storm captured by the VMC over a period of 70 minutes on 29 May. This particular storm started on 28 May and continued to around 1 June, moving towards the equator during that time.
- The montage of images (Figure 28) shows three different storms developing on 22 May, on 26 May, and between 6 and 10 June. In the latter case, the cameras watched the storm evolve for several days as it moved in an equatorward direction.
- At the same time, wispy patches of light-colored clouds can be seen at the outer margin of the polar cap and also several thousand kilometers away, close to the volcanoes Elysium Mons and Olympus Mons.
- Together with the MARCI camera onboard NASA's Mars Reconnaissance Orbiter, Mars Express observed that when the dust storms reached the large volcanoes, orographic clouds – water ice clouds driven by the influence of the volcano's leeward slope on the air flow – that had previously been developing started to evaporate as a result of the air mass being heated by the influx of dust.
- These regional dust storms only last a few days; the elevated dust is transported and spread out by global circulation into a thin haze in the lower atmosphere, around 20–40 km altitude. Some traces of dust and clouds remained in the volcanic province into mid-June.
• 27 June 2019: The cracked, uneven, jumbled landscape seen in this image from ESA's Mars Express forms an intriguing type of terrain that cannot be found on Earth: chaotic terrain. 9)
- The feature visible here, Aurorae Chaos, is located in the ancient and equatorial Margaritifer Terra region of Mars. The terrain here is heavily cratered, and shows signs of myriad fascinating features – many of which are thought to be linked to past water activity.
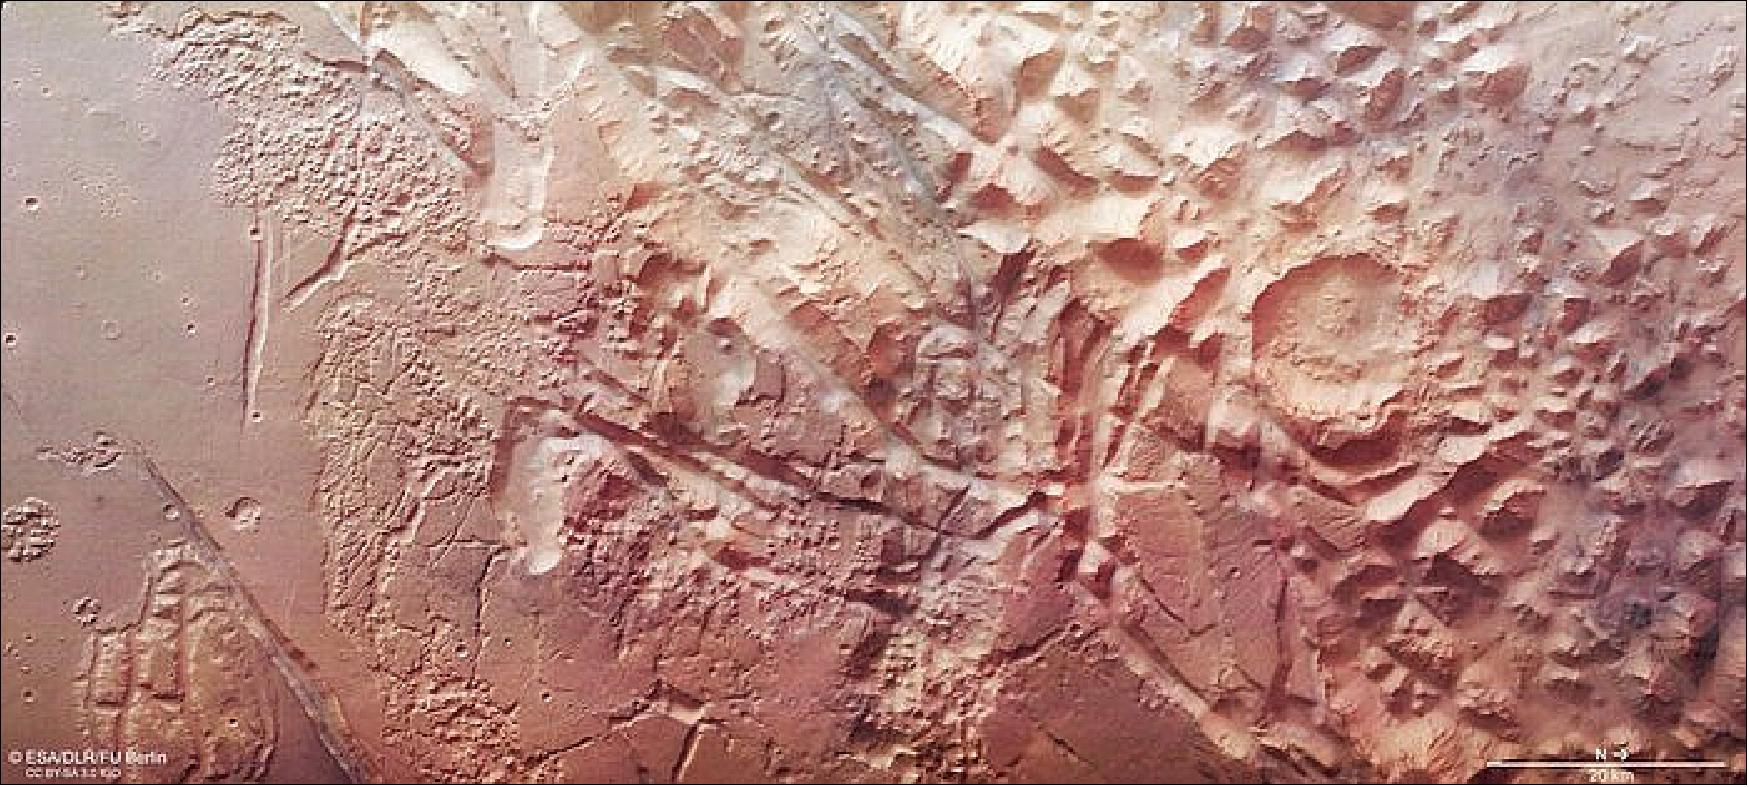
- These images show the southern part of Aurorae Chaos in detail, highlighting various swathes of fractured rock, mismatched peaks, flat-topped mounds (mesas), scarps, jumbled cliffs, and eroded craters.
- These characteristic features sweep across the surface, and connect to a number of small outflow channels that spread into this image from beyond the top of the frame in the main color image. These channels form the eastern end of one of Mars' most famous features – a giant valley system called Valles Marineris, which cuts deep into the surface and spans thousands of kilometers.
- This canyon is colossal: about 10 times as long, 20 times as wide, and 4.5 times as deep as Arizona's Grand Canyon here on Earth. The Grand Canyon was carved out by running water, and is thus an excellent example of fluvial erosion – although this kind of erosion is different to that which formed Aurorae Chaos. At its eastern end, the martian canyon runs into a large network of steep-sided depressions that sit roughly four kilometers below the surrounding plains and host numerous chaotic terrains.
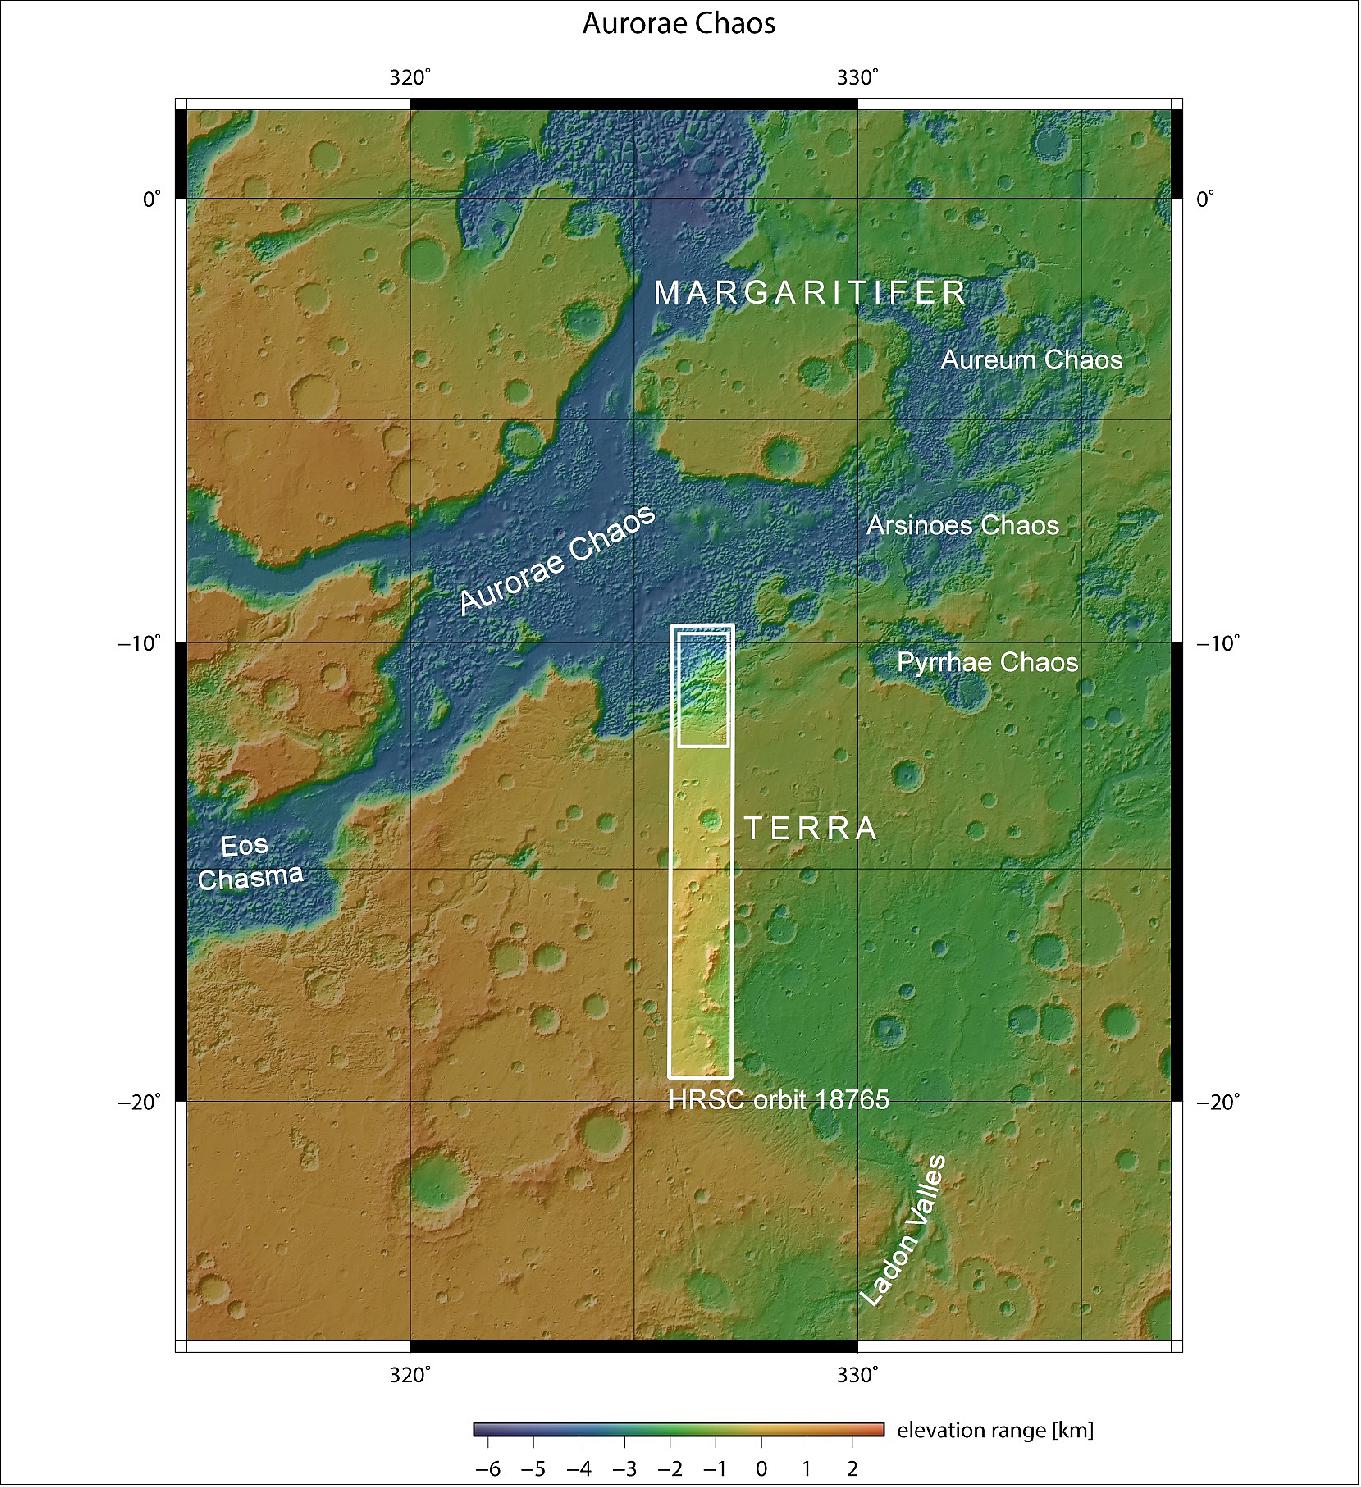
- These differences in height are well illustrated in the accompanying topographic, perspective, and 3D views of this region, while the position of Aurorae Chaos with respect to surrounding valleys and chaotic terrain can be seen in the contextual view.
- The division between the chaotic terrain and plains can also be seen clearly in these images. The left (south) side of the image is notably smoother and more featureless than the jumbled right (north) side, and the two regions are split by a prominent line carving diagonally across the frame. The transition area around this scarp is especially broken and fractured; this is thought to be caused as the martian crust stretched and moved.
- The ancient chaotic terrain we see on Mars holds information about how water once permeated and interacted with the planetary surface, including how it was transported, stored, and released.
- Chaotic terrain is thought to have formed as chunks of the martian surface collapsed in dramatic events triggered by the heating of material containing ice or water-bearing minerals – possibly due to climatic or volcanic heat sources, or an impact from an asteroid or comet. This released large amounts of water, causing the terrain above to subside. The water then drained away quickly, leaving behind the messy, broken patterns seen in regions such as Aurorae Chaos, which is thought to have formed some 3.5 billion years ago.
- However, it is not just visual evidence that suggests that water had a large role to play here. The wider region of Margaritifer Terra has been found to contain various sulphates and ancient clay deposits, indicating the past presence of evaporative processes and water-related outflows; some clays are even thought to require standing water in order to form, suggesting that large pools of liquid water may once have existed in this region.
- Over the past 15 years Mars Express has imaged various chaos terrains on Mars, including Iani Chaos and Ariadnes Colles, using its High Resolution Stereo Camera, and continues to study the martian surface from orbit today. Our ability to explore Mars will be aided by the arrival of the ESA-Roscosmos ExoMars rover, named Rosalind Franklin, and an accompanying surface science platform in 2021. Together with the ExoMars Trace Gas Orbiter, which entered Mars orbit in 2016, they will continue our quest to explore the secrets of the Red Planet from orbit and from the ground.
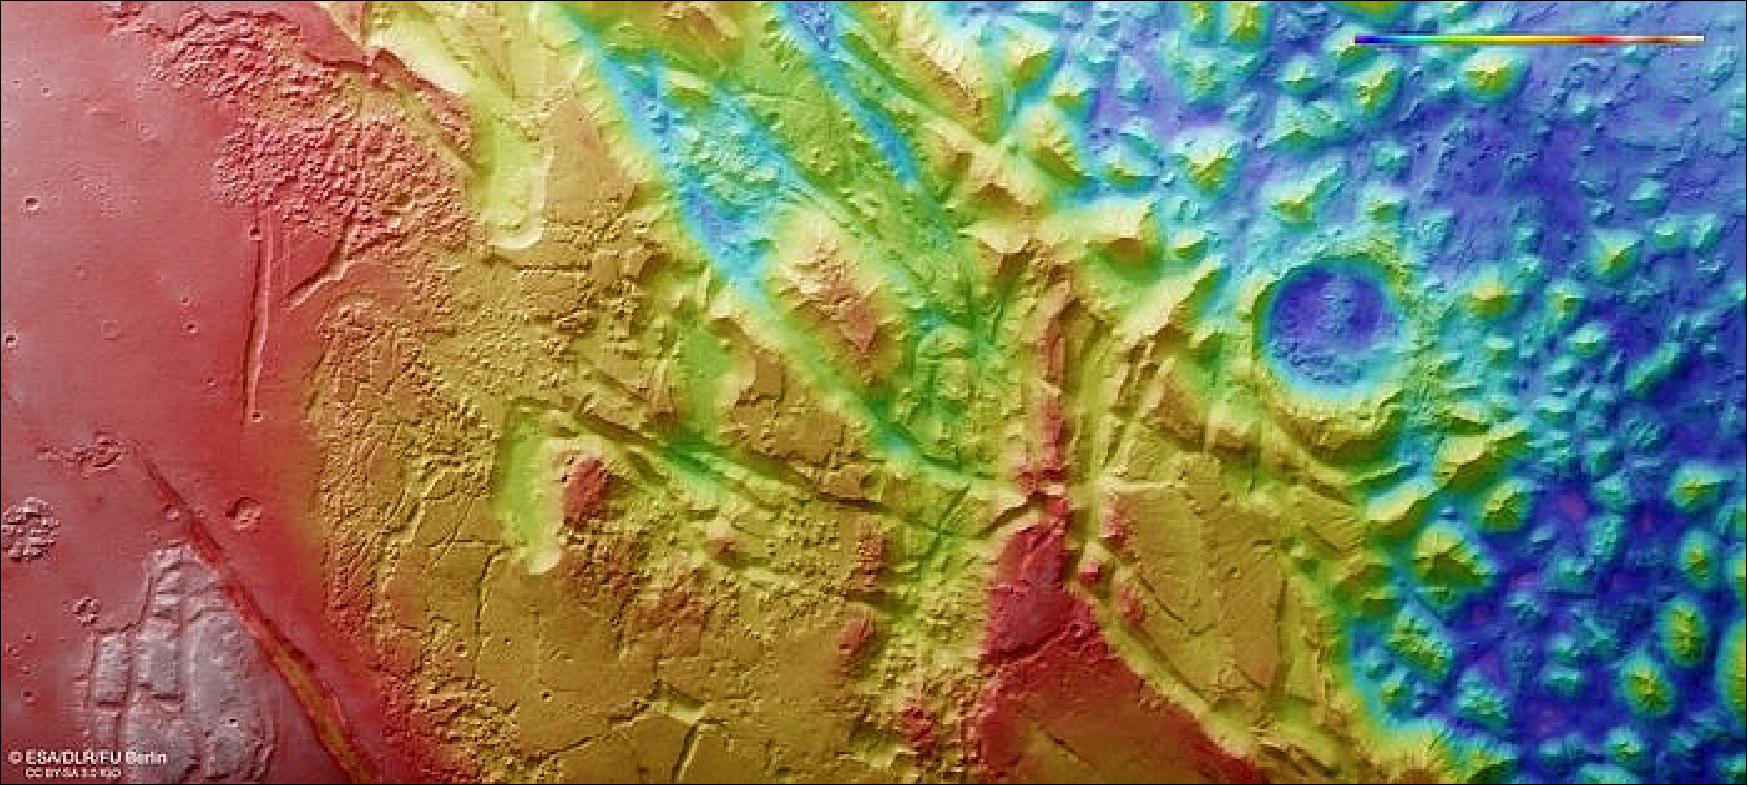
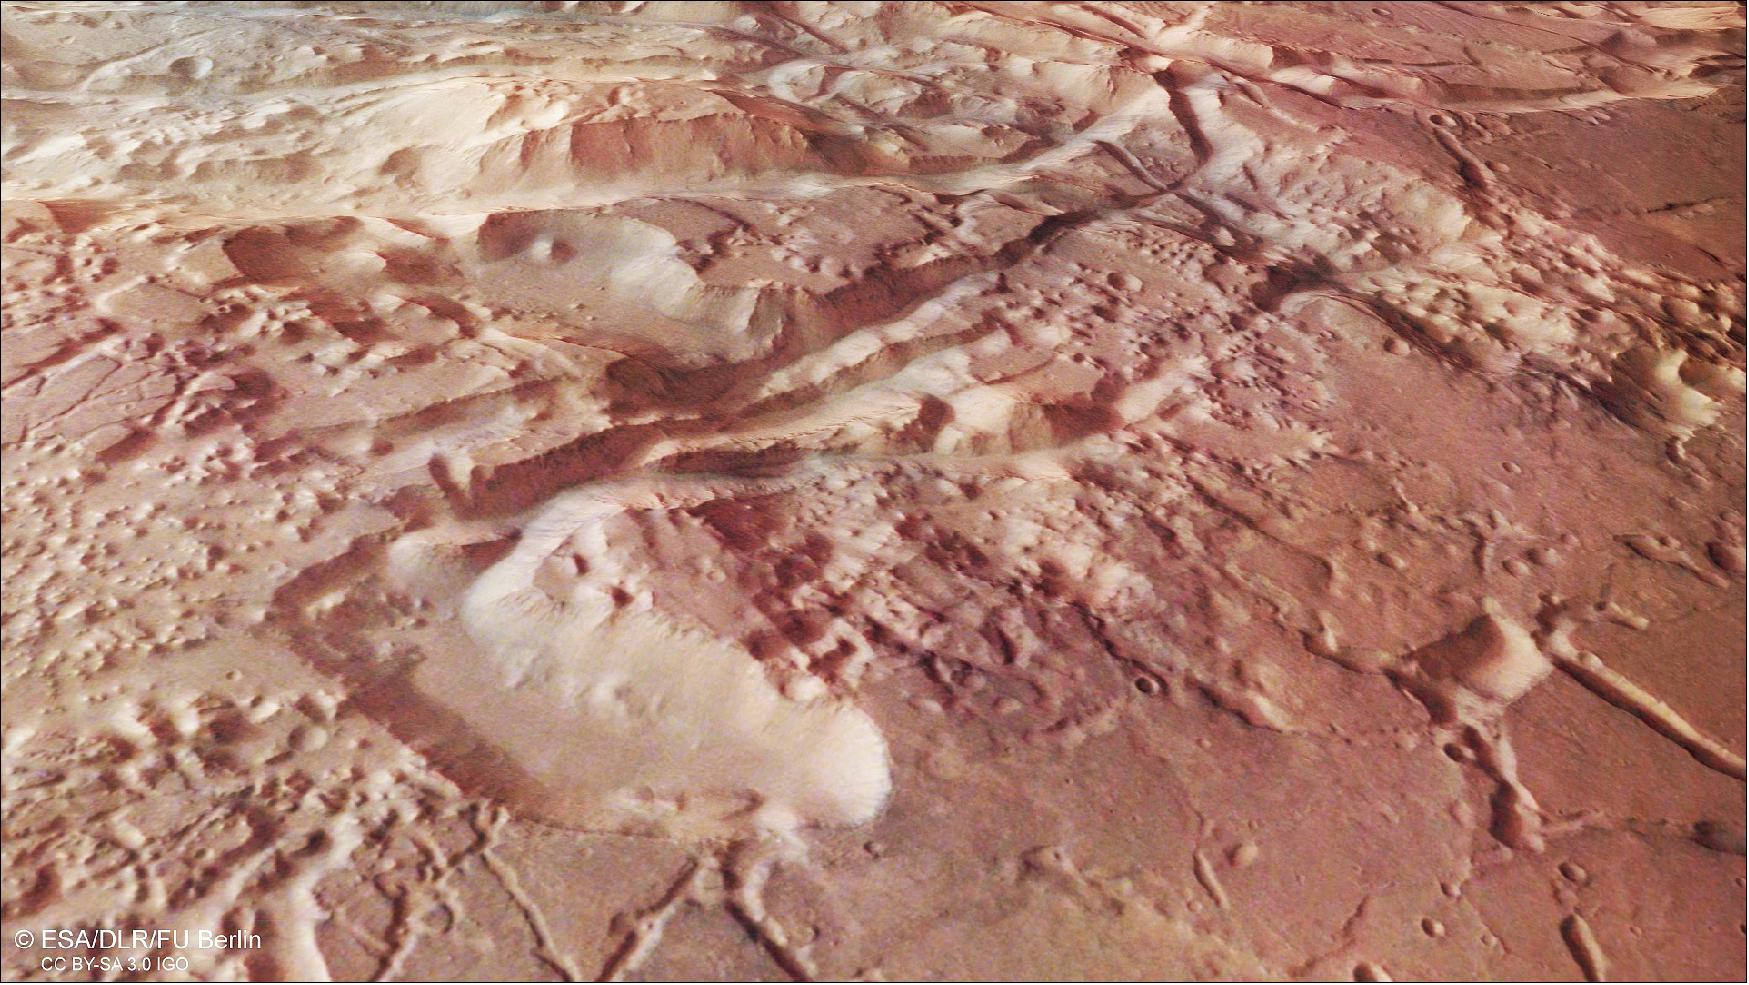
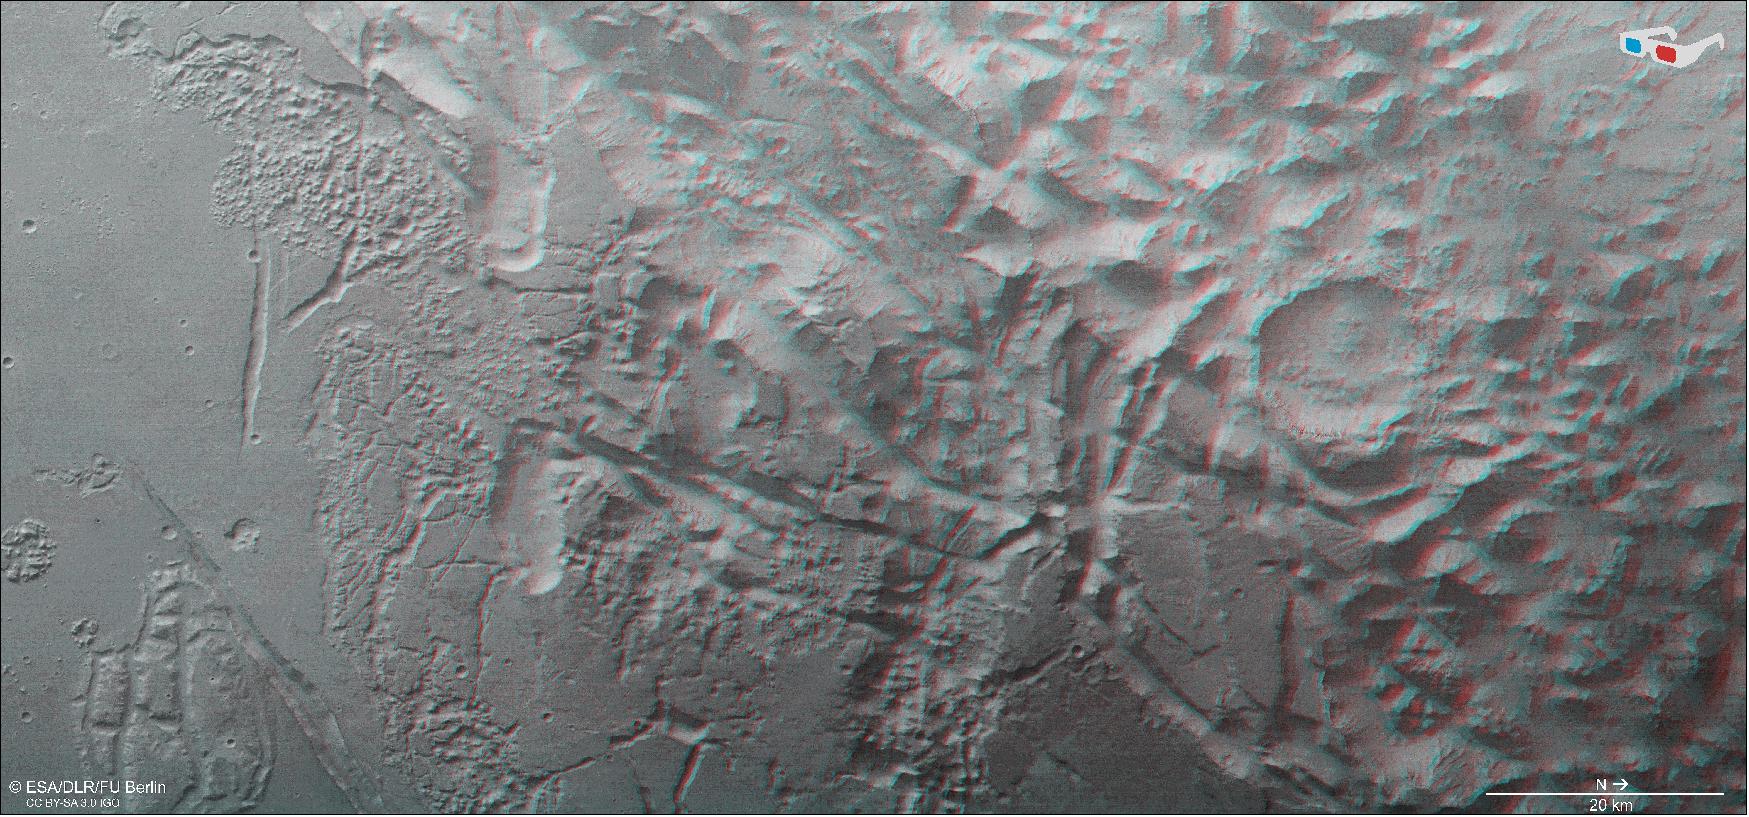
• 16 May 2019: Mars was once believed to be crisscrossed by a system of irrigation canals – dark troughs that sliced across the planet's surface, excavated by an intelligent society of thirsty martians. The astronomer who promoted this idea lends his name to the crater shown in this image from ESA's Mars Express: Lowell crater. 10) 11)
- American astronomer and author Percival Lowell is perhaps best known for popularizing this canal theory in the late 1800s and early 1900s; the idea was initially proposed by Italian scientist Giovanni Schiaparelli, who noted the presence of dark lines on Mars in observations from the 1870s. Schiaparelli described these features as canali, later translated not as ‘channels' or ‘gullies', but as ‘canals' – a phrase that hinted at a somewhat more artificial origin.
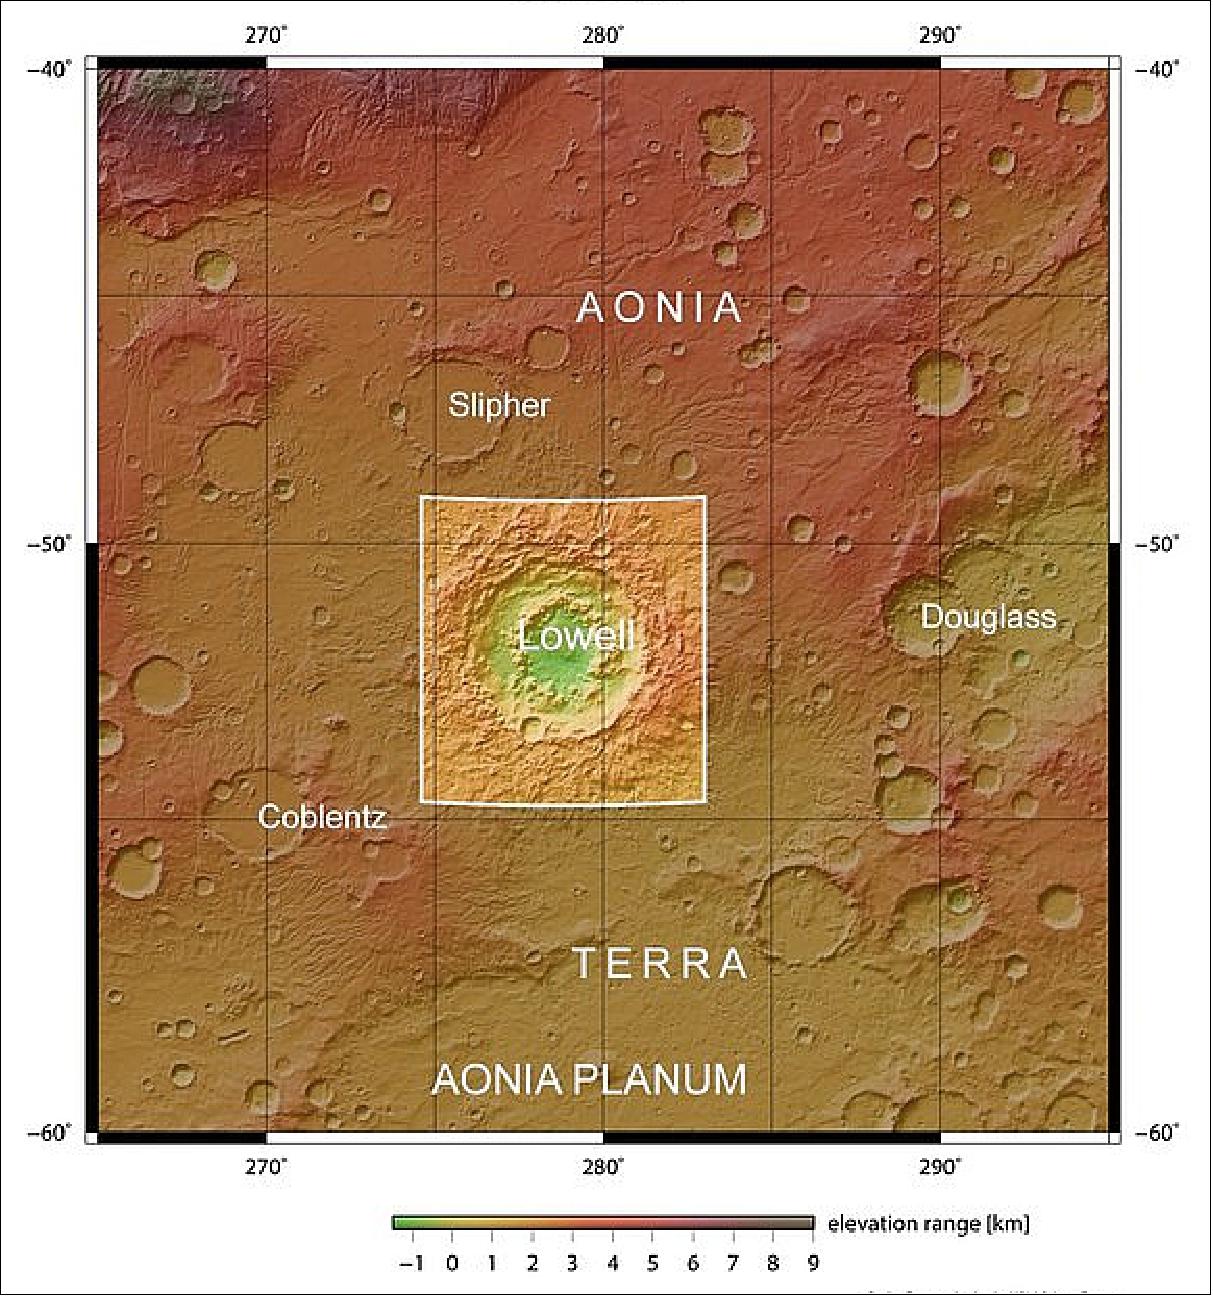
- Lowell crater is roughly 200 km in diameter and located in a region of Mars known as Aonia Terra, within the planet's ancient southern highlands. The impact that created it is thought to have taken place between 3.7 and 3.9 billion years ago; it has endured erosion and infilling since. Its crater floor has become covered and flattened by various layers of sediment, and its outer rim is marked by small dunes and gullies.
- The image also highlights a ring of mountains rising up from the crater floor and spanning 90 km across. This so-called ‘peak ring' is thought to have formed along with the crater. The immense energy of a large impact event causes material to surge upwards before collapsing down again, forming the kind of complex morphology seen here, with an irregular mountain range encircling the crater's center, inside the main crater rim.
- Such features are also seen in craters here on Earth, and on Venus, Mercury, and the Moon. One notable terrestrial crater that displays this kind of peak ring is Chicxulub crater – famous for its role in the extinction of the dinosaurs some 66 million years ago. Studies and simulations of Chicxulub, which is around the same size as Lowell crater, have shown a peak ring that formed as a huge, unstable central peak later collapsed.
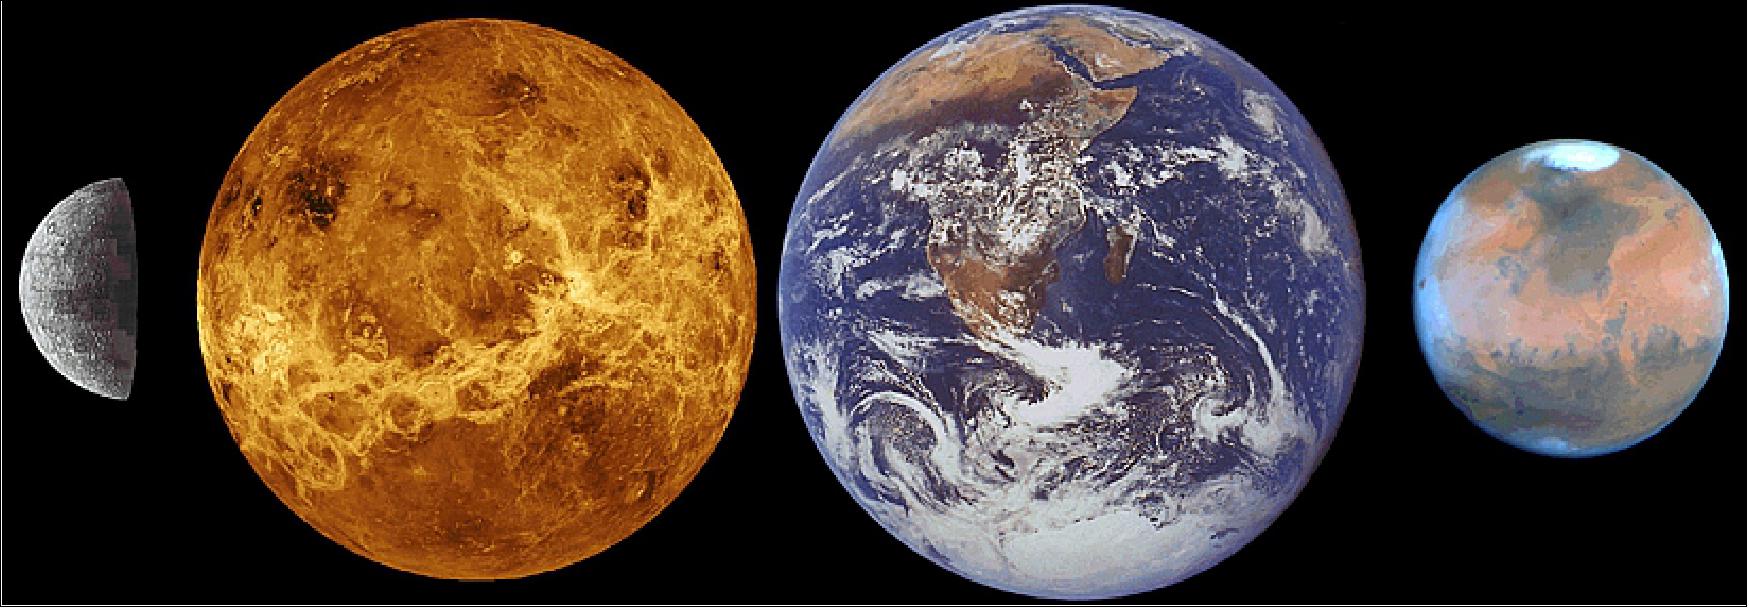
• 13 May 2019: One has a thick poisonous atmosphere, one has hardly any atmosphere at all, and one is just right for life to flourish – but it wasn't always that way. The atmospheres of our two neighbors Venus and Mars can teach us a lot about the past and future scenarios for our own planet. 12)
- Rewind 4.6 billion years from the present day to the planetary construction yard, and we see that all the planets share a common history: they were all born from the same swirling cloud of gas and dust, with the newborn Sun ignited at the center. Slowly but surely, with the help of gravity, dust accumulated into boulders, eventually snowballing into planet-sized entities.
- Rocky material could withstand the heat closest to the Sun, while gassy, icy material could only survive further away, giving rise to the innermost terrestrial planets and the outermost gas and ice giants, respectively. The leftovers made asteroids and comets.
- The atmospheres of the rocky planets were formed as part of the very energetic building process, mostly by outgassing as they cooled down, with some small contributions from volcanic eruptions and minor delivery of water, gases and other ingredients by comets and asteroids. Over time the atmospheres underwent a strong evolution thanks to an intricate combination of factors that ultimately led to the current status, with Earth being the only known planet to support life, and the only one with liquid water on its surface today.
- We know from space missions such as ESA's Venus Express, which observed Venus from orbit between 2006 and 2014, and Mars Express, investigating the Red Planet since 2003, that liquid water once flowed on our sister planets, too. While the water on Venus has long since boiled away, on Mars it is either buried underground or locked up in ice caps. Intimately linked to the story of water – and ultimately to the big question of whether life could have arisen beyond Earth – is the state of a planet's atmosphere. And connected to that, the interplay and exchange of material between the atmosphere, oceans and the planet's rocky interior.
Planetary Recycling
- Back at our newly formed planets, from a ball of molten rock with a mantle surrounding a dense core, they stated to cool down. Earth, Venus and Mars all experienced outgassing activity in these early days, which formed the first young, hot and dense atmospheres. As these atmospheres also cooled, the first oceans rained down from the skies.
- At some stage, though, the characteristics of the geological activity of the three planets diverged. Earth's solid lid cracked into plates, in some places diving below another plate in subduction zones, and in other places colliding to create vast mountain ranges or pulling apart to create giant rifts or new crust. Earth's tectonic plates are still moving today, giving rise to volcanic eruptions or earthquakes at their boundaries.
- Venus, which is only slightly smaller than Earth, may still have volcanic activity today, and its surface seems to have been resurfaced with lavas as recently as half a billion years ago. Today it has no discernible plate tectonics system; its volcanoes were likely powered by thermal plumes rising through the mantle – created in a process that can be likened to a ‘lava lamp' but on a gigantic scale.
- Mars, being a lot smaller, cooled off more quickly than Earth and Venus, and when its volcanoes became extinct it lost a key means of replenishing its atmosphere. But it still boasts the largest volcano in the entire Solar System, the 25 km high Olympus Mons, likely too the result of continuous vertical building of the crust from plumes rising from below. Even though there is evidence for tectonic activity within the last 10 million years, and even the occasional marsquake in present times, the planet is not believed to have an Earth-like tectonics system either.
- It is not just global plate tectonics alone that make Earth special, but the unique combination with oceans. Today our oceans, which cover about two-thirds of Earth's surface, absorb and store much of our planet's heat, transporting it along currents around the globe. As a tectonic plate is dragged down into the mantle, it warms up and releases water and gases trapped in the rocks, which in turn percolate through hydrothermal vents on the ocean floor.
- Extremely hardy lifeforms have been found in such environments at the bottom of Earth's oceans, providing clues as to how early life may have begun, and giving scientists pointers on where to look elsewhere in the Solar System: Jupiter's moon Europa, or Saturn's icy moon Enceladus for example, which conceal oceans of liquid water beneath their icy crusts, with evidence from space missions like Cassini suggesting hydrothermal activity may be present.
- Moreover, plate tectonics helps to modulate our atmosphere, regulating the amount of carbon dioxide on our planet over long timescales. When atmospheric carbon dioxide combines with water, carbonic acid is formed, which in turn dissolves rocks. Rain brings the carbonic acid and calcium to the oceans – carbon dioxide is also dissolved directly in oceans – where it is cycled back into the ocean floor. For almost half of Earth's history the atmosphere contained very little oxygen. Oceanic cyanobacteria were the first to use the Sun's energy to convert carbon dioxide into oxygen, a turning point in providing the atmosphere that much further down the line allowed complex life to flourish. Without the planetary recycling and regulation between the mantle, oceans and atmosphere, Earth may have ended up more like Venus.
Extreme Greenhouse Effect
- Venus is sometimes referred to as Earth's evil twin on account of it being almost the same size but plagued with a thick noxious atmosphere and a sweltering 470ºC surface. Its high pressure and temperature is hot enough to melt lead – and destroy the spacecraft that dare to land on it. Thanks to its dense atmosphere, it is even hotter than planet Mercury, which orbits closer to the Sun. Its dramatic deviation from an Earth-like environment is often used as an example of what happens in a runaway greenhouse effect.
- The main source of heat in the Solar System is the Sun's energy, which warms a planet's surface up, and then the planet radiates energy back into space. An atmosphere traps some of the outgoing energy, retaining heat – the so-called greenhouse effect. It is a natural phenomenon that helps regulate a planet's temperature. If it weren't for greenhouse gases like water vapor, carbon dioxide, methane and ozone, Earth's surface temperature would be about 30 degrees cooler than its present +15ºC average.
- Over the past centuries, humans have altered this natural balance on Earth, strengthening the greenhouse effect since the dawn of industrial activity by contributing additional carbon dioxide along with nitrogen oxides, sulphates and other trace gases and dust and smoke particles into the air. The long-term effects on our planet include global warming, acid rain and the depletion of the ozone layer. The consequences of a warming climate are far-reaching, potentially affecting freshwater resources, global food production and sea level, and triggering an increase in extreme-weather events.
- There is no human activity on Venus, but studying its atmosphere provides a natural laboratory to better understand a runaway greenhouse effect. At some point in its history, Venus began trapping too much heat. It was once thought to host oceans like Earth, but the added heat turned water into steam, and in turn, additional water vapor in the atmosphere trapped more and more heat until entire oceans completely evaporated. Venus Express even showed that water vapor is still escaping from Venus' atmosphere and into space today.
- Venus Express also discovered a mysterious layer of high-altitude sulphur dioxide in the planet's atmosphere. Sulphur dioxide is expected from the emission of volcanoes – over the mission's duration Venus Express recorded large changes in the sulphur dioxide content of the atmosphere. This leads to sulfuric acid clouds and droplets at altitudes of about 50-70 km – any remaining sulphur dioxide should be destroyed by intense solar radiation. So it was a surprise for Venus Express to discover a layer of the gas at around 100 km. It was determined that evaporating sulfuric acid droplets free gaseous sulfuric acid that is then broken apart by sunlight, releasing the sulphur dioxide gas.
- The observation adds to the discussion what might happen if large quantities of sulphur dioxide are injected into Earth's atmosphere – a proposal made for how to mitigate the effects of the changing climate on Earth. The concept was demonstrated from the 1991 volcanic eruption of Mount Pinatubo in the Philippines, when sulphur dioxide ejected from the eruption created small droplets of concentrated sulfuric acid – like those found in Venus' clouds – at about 20 km altitude. This generated a haze layer and cooled our planet globally by about 0.5ºC for several years. Because this haze reflects heat it has been proposed that one way to reduce global temperatures would be to inject artificially large quantities of sulphur dioxide into our atmosphere. However, the natural effects of Mt Pinatubo only offered a temporary cooling effect. Studying the enormous layer of sulfuric acid cloud droplets at Venus offers a natural way to study the longer term effects; an initially protective haze at higher altitude would eventually be converted back into gaseous sulfuric acid, which is transparent and allows all the Sun's rays through. Not to mention the side-effect of acid rain, which on Earth can cause harmful effects on soils, plant life and water.

Global Freezing
- Our other neighbor, Mars, lies at another extreme: although its atmosphere is also predominantly carbon dioxide, today it hardly has any at all, with a total atmospheric volume less than 1% of Earth's.
- Mars' existing atmosphere is so thin that although carbon dioxide condenses into clouds, it cannot retain sufficient energy from the Sun to maintain surface water – it vaporises instantly at the surface. But with its low pressure and relatively balmy temperatures of -55ºC (ranging from -133ºC at the winter pole to +27ºC during summer), spacecraft don't melt on its surface, allowing us greater access to uncover its secrets. Furthermore, thanks to the lack of recycling plate tectonics on the planet, four billion year old rocks are directly accessible to our landers and rovers exploring its surface. Meanwhile our orbiters, including Mars Express, which has been surveying the planet for more than 15 years, are constantly finding evidence for its once flowing waters, oceans and lakes, giving a tantalizing hope that it might have once supported life.
- The Red Planet too would have started out with a thicker atmosphere thanks to the delivery of volatiles from asteroids and comets, and volcanic outgassing from the planet as its rocky interior cooled down. It simply couldn't hold on to its atmosphere most likely because of its smaller mass and lower gravity. In addition, its initial higher temperature would have given more energy to gas molecules in the atmosphere, allowing them to escape more easily. And, having also lost its global magnetic field early in its history, the remaining atmosphere was subsequently exposed to the solar wind – a continuous flow of charged particles from the Sun – that, just as on Venus, continues to strip away the atmosphere even today.
- With a decreased atmosphere, the surface water moved underground, released as vast flash-floods only when impacts heated the ground and released the subsurface water and ice. It is also locked up in the polar ice caps. Mars Express also recently detected a pool of liquid water buried within two kilometers of the surface. Could evidence of life also be underground? This question is at the heart of Europe's ExoMars rover, scheduled to launch in 2020 and land in 2021 to drill up to two meters below the surface to retrieve and analyze samples in search for biomarkers.
- Mars is thought to be currently coming out of an ice age. Like Earth, Mars is sensitive to changes in factors such as the tilt of its rotational axis as it orbits the Sun; it is thought that the stability of water at the surface has varied over thousands to millions of years as the axial tilt of the planet and its distance from the Sun undergo cyclical changes. The ExoMars Trace Gas Orbiter, currently investigating the Red Planet from orbit, recently detected hydrated material in equatorial regions that could represent former locations of the planet's poles in the past.
- The Trace Gas Orbiter's primary mission is to conduct a precise inventory of the planet's atmosphere, in particular the trace gases which make up less than 1% of the planet's total volume of atmosphere. Of particular interest is methane, which on Earth is produced largely by biological activity, and also by natural and geological processes. Hints of methane have previously been reported by Mars Express, and later by NASA's Curiosity rover on the surface of the planet, but the Trace Gas Orbiter's highly sensitive instruments have so far reported a general absence of the gas, deepening the mystery. In order to corroborate the different results, scientists are not only investigating how methane might be created, but also how it might be destroyed close to the surface. Not all lifeforms generate methane, however, and the rover with its underground drill will hopefully be able to tell us more. Certainly the continued exploration of the Red Planet will help us understand how and why Mars' habitability potential has changed over time.

Exploring Farther
- Despite starting with the same ingredients, Earth's neighbors suffered devastating climate catastrophes and could not hold on to their water for long. Venus became too hot and Mars too cold; only Earth became the ‘Goldilocks' planet with the just-right conditions. Did we come close to becoming Mars-like in a previous ice age? How close are we to the runaway greenhouse effect that plagues Venus? Understanding the evolution of these planets and the role of their atmospheres is tremendously important for understanding climatic changes on our own planet as ultimately the same laws of physics govern all. The data returned from our orbiting spacecraft provide natural reminders that climate stability is not something to be taken for granted.
- In any case, in the very long term – billions of years into the future – a greenhouse Earth is an inevitable outcome at the hands of the aging Sun. Our once life-giving star will eventually swell and brighten, injecting enough heat into Earth's delicate system to boil our oceans, sending it down the same pathway as its evil twin.
- We are changing our natural world faster than at any other time in history. Understanding the intricacies of how Earth works as a system and the impact that human activity is having on natural processes are huge environmental challenges. Satellites are vital for taking the pulse of our planet, delivering the information we need to understand and monitor our precious world, and for making decisions to safeguard our future. Earth observation data is also key to a myriad of practical applications to improve everyday life and to boost economies. This week we focus on the world's biggest conference on Earth observation where thousands of scientists and data users discuss the latest results and look to the future of Earth observation (Ref. 12) .
• 08 April 2019: Bacterial resistance to antibiotics is one of humankind's major long-term health challenges. Now research into helping humans live on Mars could help address this looming problem. 14)
- Dennis Claessen, associate professor at the Institute of Biology at Leiden University, the Netherlands works in synthetic biology, in which bacteria are engineered to solve problems that cannot be tackled – or are not tackled well – by ‘wild' bacteria. A team of his students entered the iGEM (International Genetically Engineered Machine) competition with a solution to the problem of growing non-toxic plants on Mars, but needed ‘Martian' gravity to test their ideas.
![Figure 40: This perspective view shows the central part of Nicholson Crater, at approximately 0.0º South and 195.5º East, looking west. Nicholson Crater, measuring approximately 100 km wide, is located at the southern edge of Amazonis Planitia, north-west of a region called Medusae Fossae. The HRSC on board ESA's Mars Express obtained this image during orbit 1104 around Mars with a ground resolution of approximately 15.3 m/pixel. The image was released on 14 July 2000 [image credit: ESA/DLR/FU Berlin (G. Neukum), CC BY-SA 3.0 IGO)]](https://eoportal.org/ftp/satellite-missions/m/MarsExpress2019-2004_010322/MarsExp.2019-2004_Auto34.jpeg)
- "The soil on Mars has perchlorate chemical compounds in it, which can be toxic for humans," explains Prof. Claessen. High doses of perchlorate can inhibit the thyroid gland's uptake of iodine and interfere with foetal development. - Our students started ‘building' a bacterium that would degrade the perchlorate to chlorine and oxygen, but they needed to know whether that bacterium would behave the same way in the partial gravity of Mars as it would on Earth."
- The challenge was to find a way to reproduce Mars gravity on Earth, and the students solved it using the RPM.
- The first recorded experiment on living systems using machines to manipulate gravity was done in 1806 using a rotating waterwheel. Two hundred years later the RPM, designed by the Netherlands-based Airbus team for ESA, is the latest instrument developed to experiment in zero or reduced gravity without going into space.
- As its name suggests, the RPM continually changes its orientation at random, so that items placed within it have no opportunity to adjust to a steady gravity direction. The original design could successfully simulate zero gravity while the newer RPM 2.0 can additionally simulate partial gravity, the stages between normal Earth gravity and the weightless environment.

- "The RPM machines offer a great alternative to organizations looking to do experiments in zero and partial gravity," says Derk Schneemann at Verhaert Netherlands. Derk is the Dutch broker in the network of ESA Innovation Partners that facilitates the re-use of space technology in other sectors and which is part of ESA's Business Applications and Space Solutions Program.

- "During their experiments they noticed that when bacteria grew in partial gravity, they became stressed as they accumulated waste around them that they couldn't get rid of. This holds great potential because when microbes belonging to the Streptomyces family become stressed, they usually start making antibiotics.
- "Seventy percent of all the antibiotics humans use are derived from Streptomyces bacteria and we know they have the potential to produce even more. Using the RPM to stress them in new ways may help us to find ones we've never seen before."
Detoxifying Soil on Mars and Earth
- Prof. Claessen is now building a Dutch consortium to investigate soil detoxification on a larger scale. This will have applications on Earth. For example, there is a lot of perchlorate in Chile's Atacama Desert, where the soil is believed to resemble that on Mars. Atacama soil was previously used as fertilizer in the US, but later it was found that perchlorate had been washed from this fertilizer into groundwater used for drinking.
- Once the Dutch team is in place and has funding, research into Streptomyces microbes (which are naturally found in Earth's soil, where they play a vital role in breaking down organic matter) and antibiotics could also be done with the RPM.
- "To find that they hold the potential for discovering new antibiotics as well is even more exciting, as antibiotic resistance is something we need to tackle urgently," adds Derk Schneemann.
Space for Health
- The United Nations World Health Organization marks World Health Day on 7 April every year. The third Sustainable Development Goal underlines the right to health: Ensure healthy lives and promote well-being for all at all ages. On-orbit research, space technology and space applications can help improve health on Earth by monitoring our environment, helping track disease, improving diagnostics, and working on new medicines among other things. The UN is also focusing particularly this year on universal health coverage.
• 01 April 2019: A reanalysis of data collected by ESA's Mars Express during the first 20 months of NASA's Curiosity mission found one case of correlated methane detection, the first time an in-situ measurement has been independently confirmed from orbit. 15)
- Reports of methane in the martian atmosphere have been intensely debated, with Mars Express contributing one of the first measurements from orbit in 2004, shortly after its arrival at the Red Planet.
- The molecule attracts such attention because on Earth methane is generated by living organisms, as well as geological processes. Because it can be destroyed quickly by atmospheric processes, any detection of the molecule in the martian atmosphere means it must have been released relatively recently – even if the methane itself was produced millions or billions of years ago and lay trapped in underground reservoirs until now.
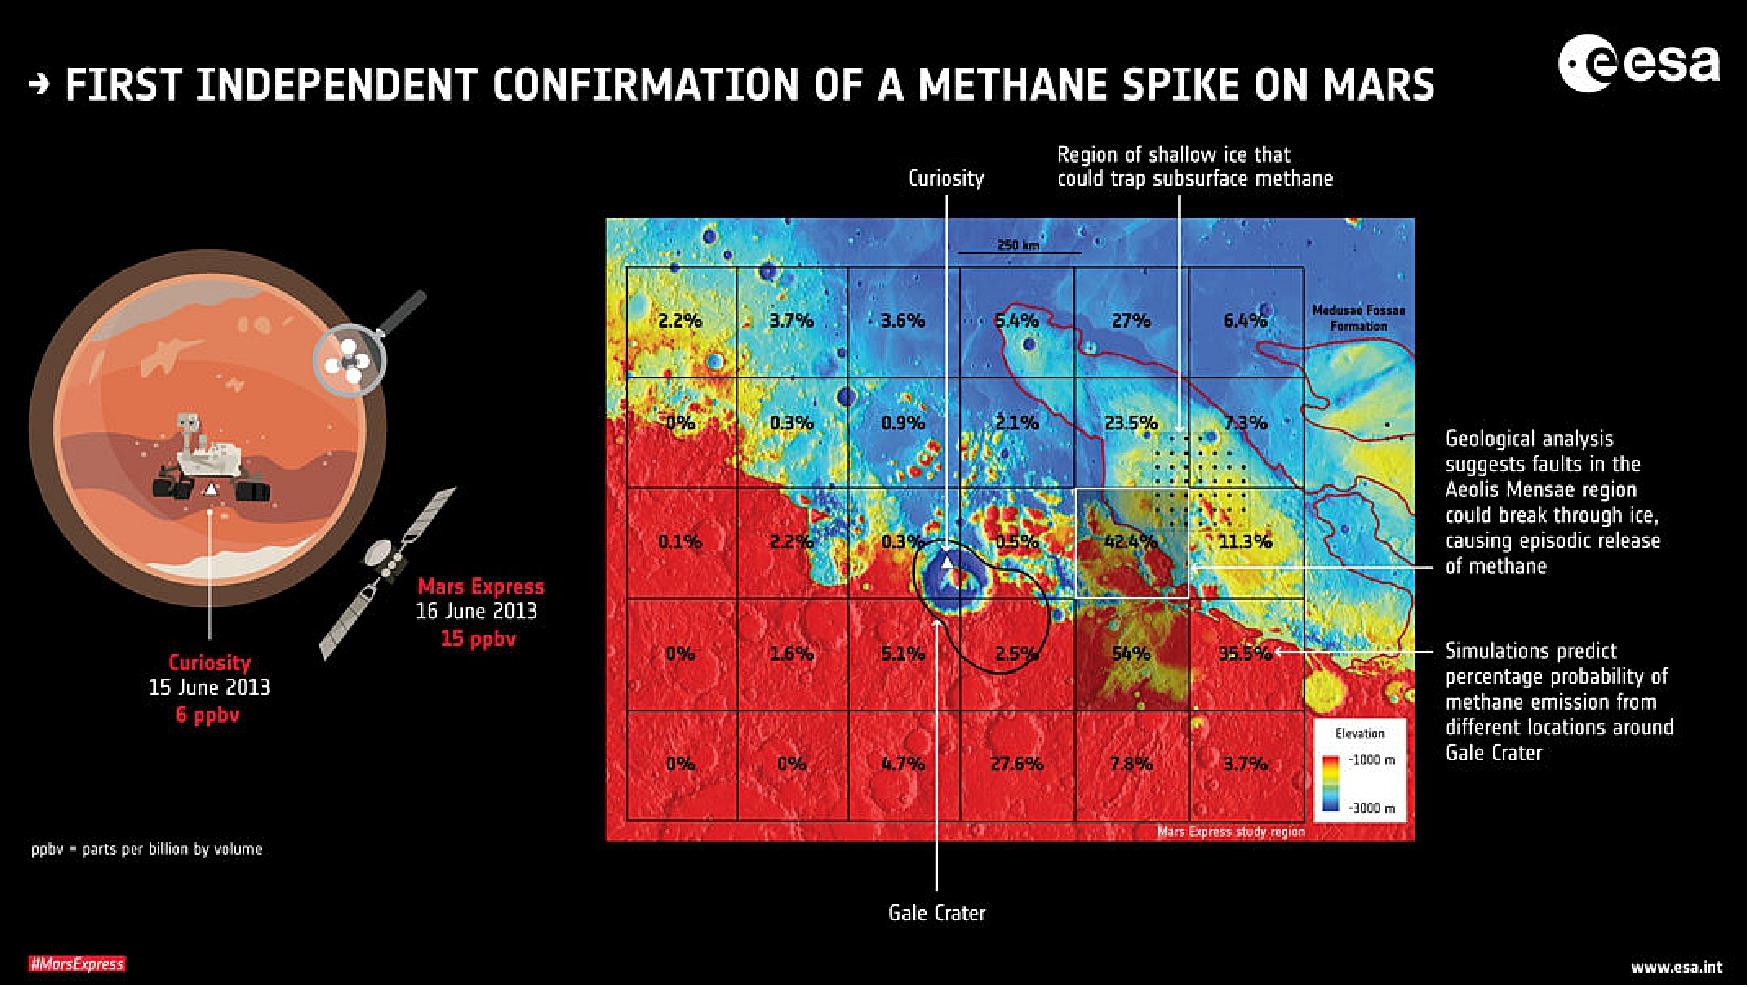
Legend to Figure 44: The details of the methane spike are illustrated in this graphic – the Mars Express detection was made one day after the elevated reading recorded by Curiosity, which is exploring Gale Crater, just south of the martian equator. Taken together, the two results can be used to examine the possible source region for the methane.
Two independent analyses were made, by examining a wide region around Gale Crater. The region was divided into grids of about 250 x 250 km2, and in one study, computer simulations were used to predict the probability of methane emission from each square (indicated by the numbers in each square). The simulations took into account the measured data, expected atmospheric circulation patterns, and methane release intensity and duration based on the geological phenomenon of ‘gas seepage'. In the other study, geologists scrutinized the region for features where gas seepage is expected – these are the kind of features that might be associated with methane release.
The geological analysis pointed to one of the regions that the computer simulations predicted would be the most likely region for methane release. The area marked by the black dots is thought to contain shallow ice that could easily trap subsurface methane, and tectonic faults in the grid square between this region and Gale Crater are thought to extend below the surface and break through the ice, causing the episodic release of methane.
- While spacecraft and telescopic observations from Earth have in general reported no or very low detections of methane, or measurements right at the limit of the instruments' capabilities, a handful of spurious spikes, along with Curiosity's reported seasonal variation at its location in Gale Crater, raise the exciting question of how it is being generated and destroyed in present times.
- Now, for the first time, a strong signal measured by the Curiosity rover on 15 June 2013 is backed up by an independent observation by the Planetary Fourier Spectrometer (PFS) onboard Mars Express the next day, as the spacecraft flew over Gale Crater.
- The study exploited a new observation technique, allowing the collection of several hundred measurements in one area over a short period of time. The teams also developed a refined analysis technique to get the best out of their data.
- "In general we did not detect any methane, aside from one definite detection of about 15 parts per billion by volume of methane in the atmosphere, which turned out to be a day after Curiosity reported a spike of about six parts per billion," says Marco Giuranna from the Institute for Space Astrophysics and Planetology in Rome, Italy, the principal investigator for the PFS experiment, and lead author of the paper reporting the results in Nature Geoscience today. 16)
- "Although parts per billion in general means a relatively small amount, it is quite remarkable for Mars – our measurement corresponds to an average of about 46 tons of methane that was present in the area of 49,000 km2 observed from our orbit."
- Ten other observations in the Mars Express study period that reported no detections at the limit of the spectrometer's sensitivity corresponded to a period of low measurements reported by Curiosity.
Pinpointing the Source
- At the time of the Curiosity detection, it was speculated that the methane originated north of the rover, because the prevailing winds were southward, and that the release likely occurred inside the crater.
- "Our new Mars Express data, taken one day after Curiosity's recording, change the interpretation of where the methane originated from, especially when considering global atmospheric circulation patterns together with the local geology," adds Marco. "Based on geological evidence and the amount of methane that we measured, we think that the source is unlikely to be located within the crater."
- Marco and his colleagues made two independent analyses to home in on potential source regions of the methane, dividing up a wide region around Gale Crater into grids of about 250 x 250 km2.
- In one study, collaborators from the Royal Belgian Institute for Space Aeronomy in Brussels applied computer simulations to create one million emission scenarios for each square, in order to predict the probability of methane emission for each of those locations. The simulations took into account the measured data, expected atmospheric circulation patterns, and methane release intensity and duration based on the geological phenomenon of ‘gas seepage'.
- In the other parallel study, geologists from the National Institute of Geophysics and Volcanology in Rome, Italy and the Planetary Science Institute in Tucson, Arizona, scrutinized the region around Gale Crater for features where gas seepage is expected – these are the kind of features that might be associated with methane release.
- This process is well known on Earth to occur along tectonic faults and from natural gas fields, with a variety of release intensities. For example, on Earth, gas emission from active mud volcanoes is typically continuous with background variations, but also with sudden strong bursts, while other seeps might release gas intermittently.
- Episodic gas release, that is, generally long quiescence with no emission in between short-duration bursts, is typical of the expulsion of gas from small or ‘dying' seeps or due to seismic events. On Mars, episodic gas expulsions could also be created during a meteorite impact, liberating gas trapped below the surface.
- "We identified tectonic faults that might extend below a region proposed to contain shallow ice. Since permafrost is an excellent seal for methane, it is possible that the ice here could trap subsurface methane and release it episodically along the faults that break through this ice," says co-author Giuseppe Etiope from the National Institute of Geophysics and Volcanology in Rome.
- "Remarkably, we saw that the atmospheric simulation and geological assessment, performed independently of each other, suggested the same region of provenance of the methane."
- "Our results support the idea that methane release on Mars might be characterized by small, transient geological events rather than a constantly replenishing global presence, but we also need to understand better how methane is removed from the atmosphere, and how to reconcile the Mars Express data with results from other missions," adds co-author Frank Daerden from the Royal Belgian Institute for Space Aeronomy in Brussels.
- "We will re-analyze more of the data collected by our instrument in the past, while continuing our ongoing monitoring efforts, including coordinating some observations with the ExoMars Trace Gas Orbiter," concludes Marco.
- The ESA-Roscosmos ExoMars Trace Gas Orbiter, which is designed to make the most detailed inventory of the martian atmosphere yet, began its science observations in April 2018.
- "Mars Express was the first to report a significant detection of methane from orbit around Mars, and now, fifteen years later, we can announce the first simultaneous and co-located detection of methane with a rover on the surface," says Dmitri Titov, ESA's Mars Express project scientist.
- "With the spacecraft and its payload still operative, Mars Express is one of the most successful space missions to be sent to Earth's planetary neighbor. We expect more exciting science from joint efforts by both ESA orbiters at Mars."
- The Mars Express detections were made by the Planetary Fourier Spectrometer (PFS). The Curiosity measurements were made by the Tunable Laser Spectrometer – Sample Analysis at Mars instrument (TLS-SAM).
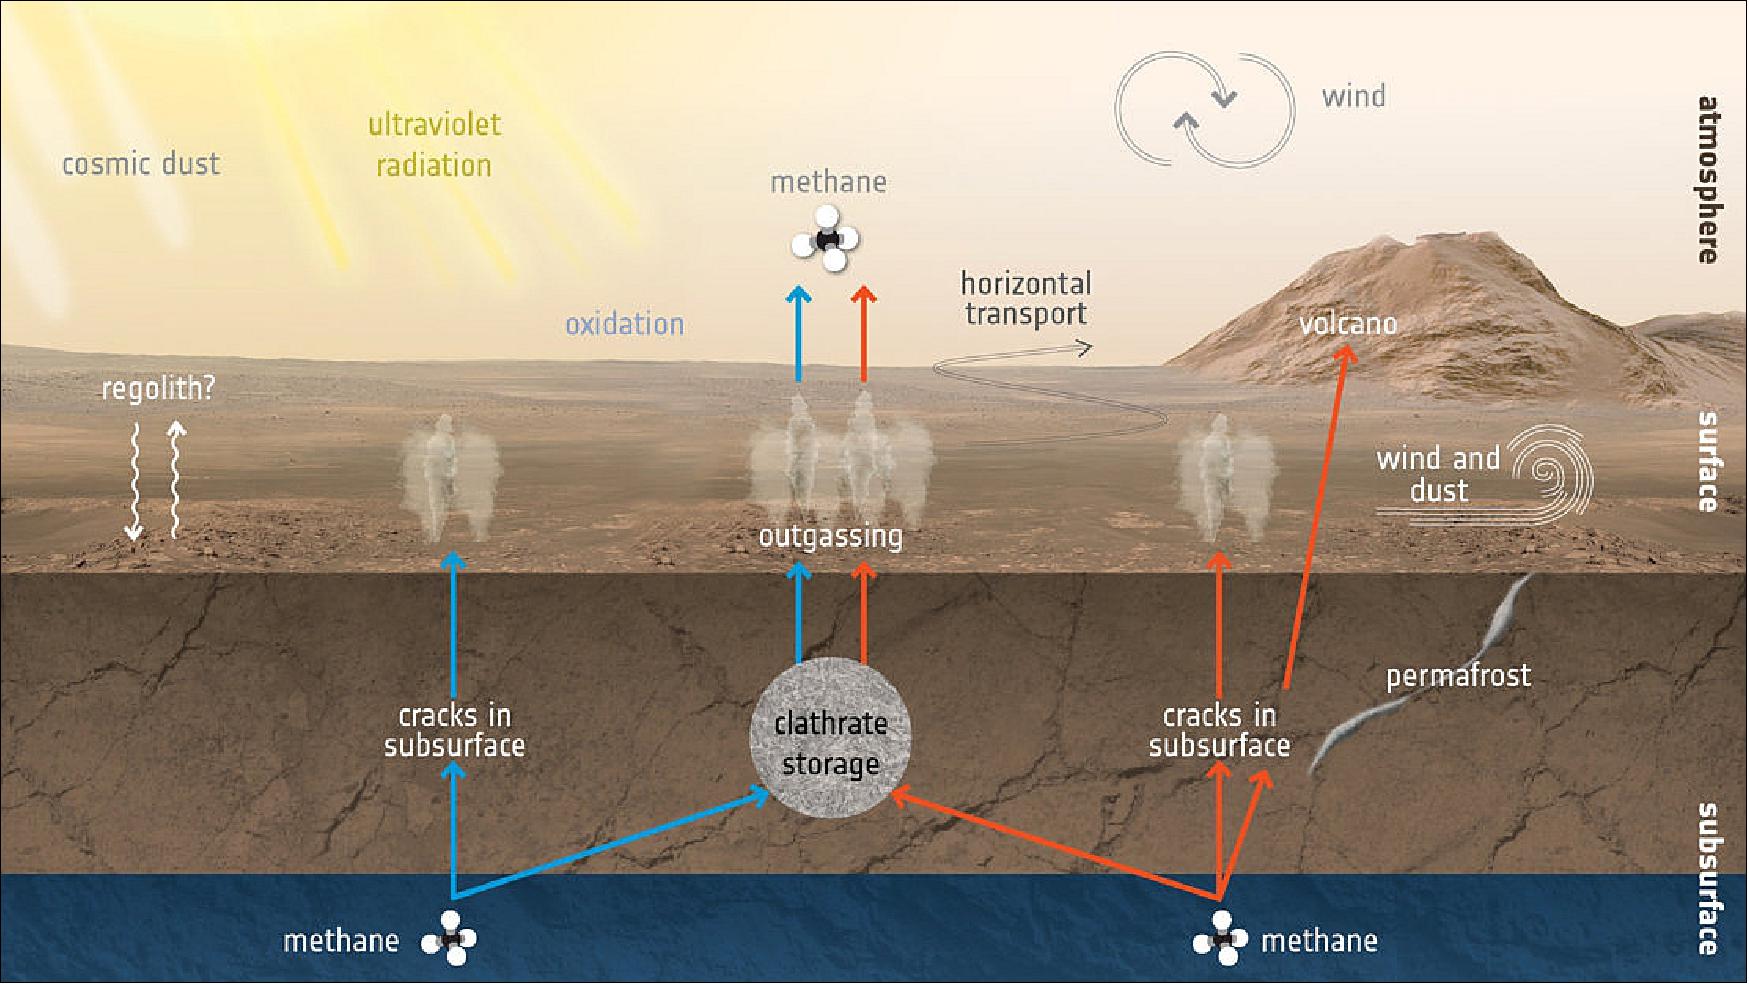
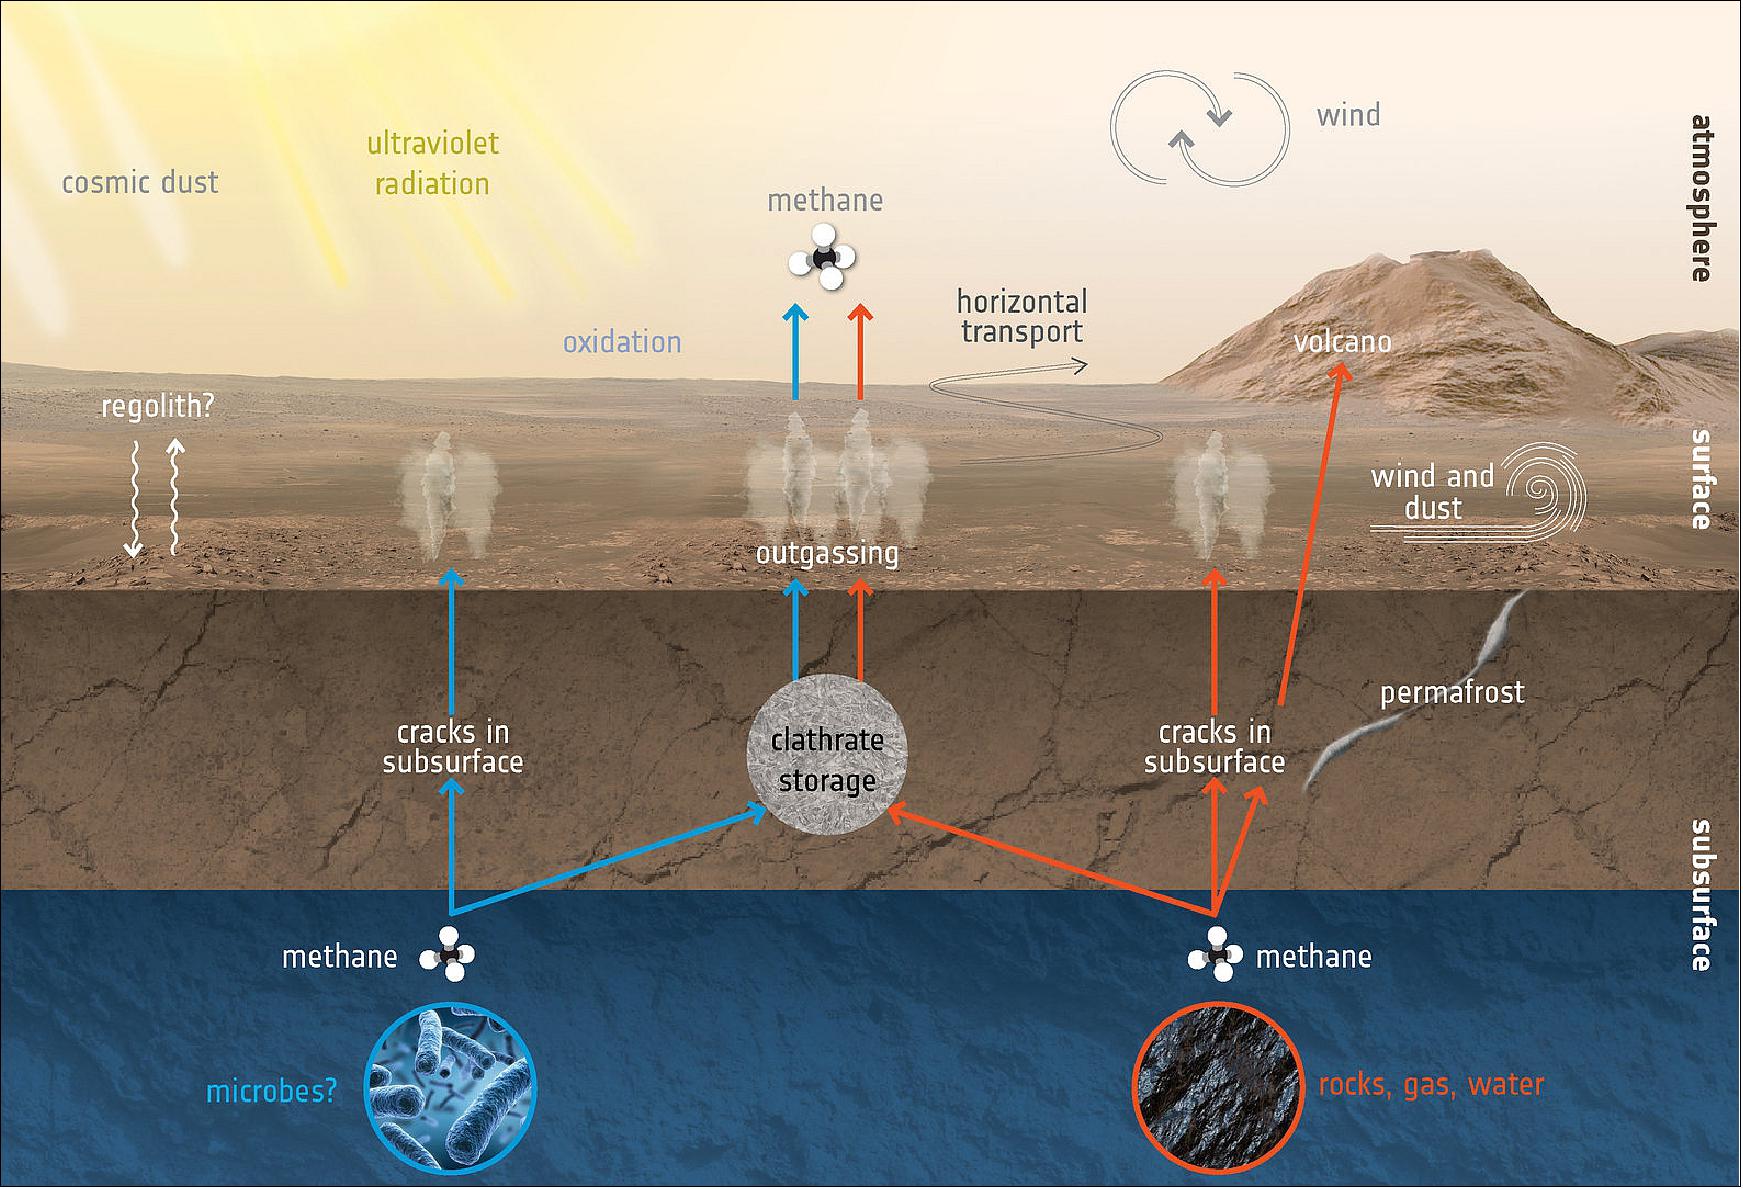
Legend to Figure 45: Methane can also be generated by reactions between carbon dioxide and hydrogen (which, in turn, can be produced by reaction of water and olivine-rich rocks), by deep magmatic degassing or by thermal degradation of ancient organic matter. Again, this could be stored underground and outgassed through cracks in the surface. Methane can also become trapped in pockets of shallow ice, such as seasonal permafrost.
Ultraviolet radiation can both generate methane – through reactions with other molecules or organic material already on the surface, such as comet dust falling onto Mars – and break it down. Ultraviolet reactions in the upper atmosphere (above 60 km) and oxidation reactions in the lower atmosphere (below 60 km) acts to transform methane into carbon dioxide, hydrogen and water vapor, and leads to a lifetime of the molecule of about 300 years.
Methane can also be quickly distributed around the planet by atmospheric circulation, diluting its signal and making it challenging to identify individual sources. Because of the lifetime of the molecule when considering atmospheric processes, any detections today imply it has been released relatively recently.
But other generation and destruction methods have been proposed which explain more localized detections and also allow a faster removal of methane from the atmosphere, closer to the surface of the planet. Dust is abundant in the lower atmosphere below 10 km and may play a role, along with interactions directly with the surface. For example, one idea is that methane diffuses or ‘seeps' through the surface in localized regions, and is adsorbed back into the surface regolith. Another idea is that strong winds eroding the planet's surface allows methane to react quickly with dust grains, removing the signature of methane. Seasonal dust storms and dust devils could also accelerate this process.
Continued exploration at Mars – from orbit and the surface alike – along with laboratory experiments and simulations, will help scientists to better understand the different processes involved in generating and destroying methane.
• 28 March 2019: The winds of Mars are responsible for myriad features across the planet's surface – including the dark dunes and wispy, filament-like streaks seen in this image from ESA's Mars Express. 17)
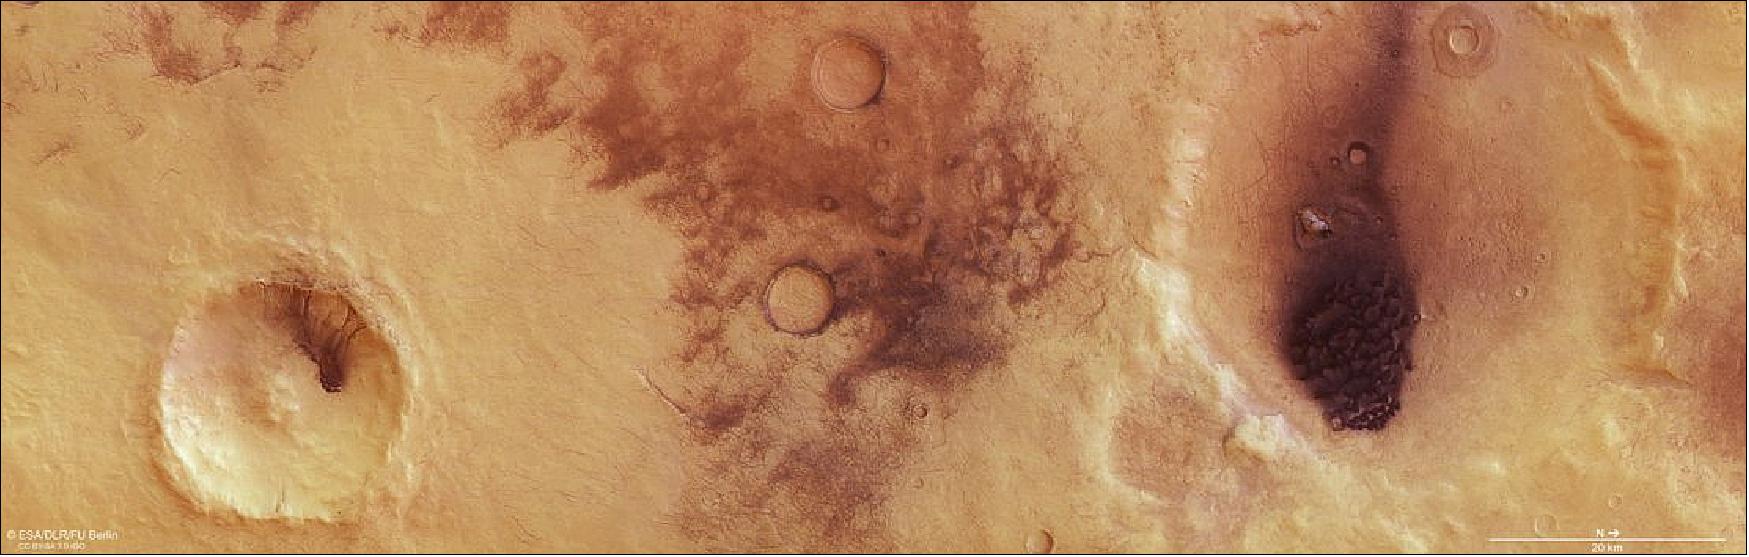
- The intriguing features shown here are ‘dust devil' tracks: as the Sun heats up the martian ground during the day, vortices form that lift warm air from near the surface, whipping up dust as they do so, shaping and sculpting it into swirling, column-shaped, tornado-like whirlwinds (click here for videos of dust devils made by NASA's Mars rover Spirit).
- These dust devils range across the entire planet, lifting the top, brighter layer of dust from the surface, and leaving darker paths in their wake. They are most often seen in the martian spring and summer, lasting for a few months at most before their tracks become obscured by dust that has been buffeted around by storms and winds.
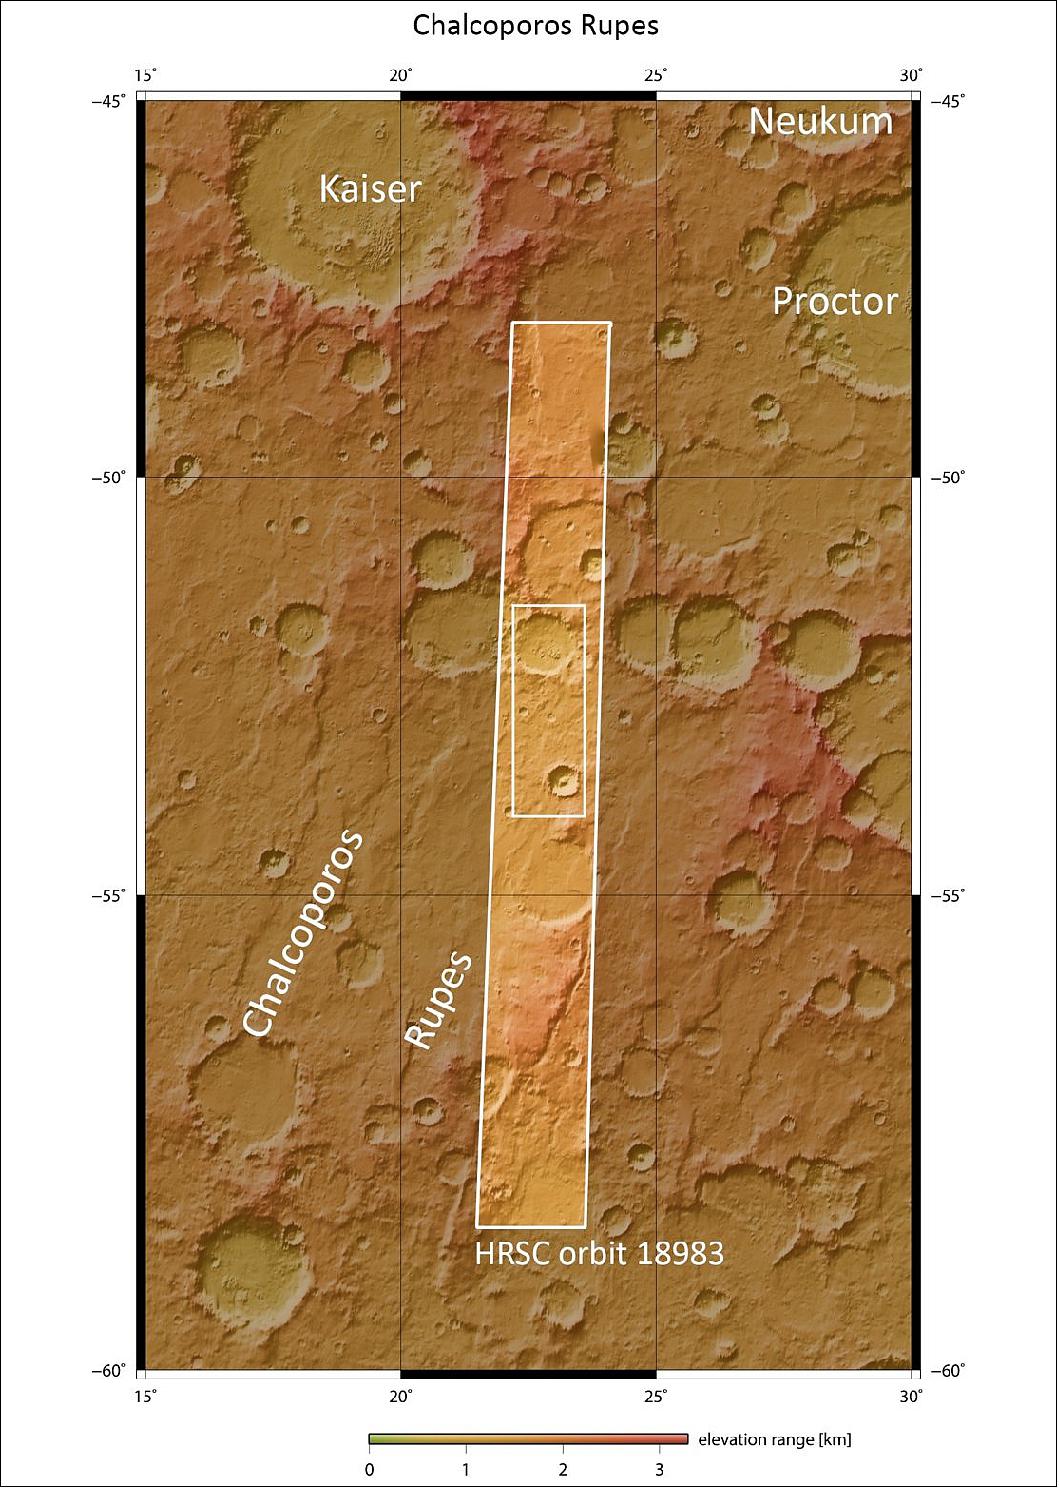
- These Mars Express images show a curving, looping, crisscrossing web of dust devil tracks in the southern hemisphere of the planet, around an escarpment feature known as Chalcoporos Rupes. This area is covered in a thick layer of dust and is not infrequently home to wind-related activity.
- Areas of Mars that most regularly see dust devils include Amazonis Planitia, Argyre Planitia, Hellas Basin, and two impact craters that lie close to the region shown here: Proctor and Russell.
- Proctor, Russell, and Chalcoproros Rupes are based in Mars' Noachis quadrangle, an area so thickly pockmarked with impact craters that it is thought to be one of the oldest parts of the planet.
- Both the craters visible in this frame boast dense, dark, eye-catching patches of rippling sand dunes, while the surrounding terrain is decorated with a broad web of dunes and signs of past dust devil activity.
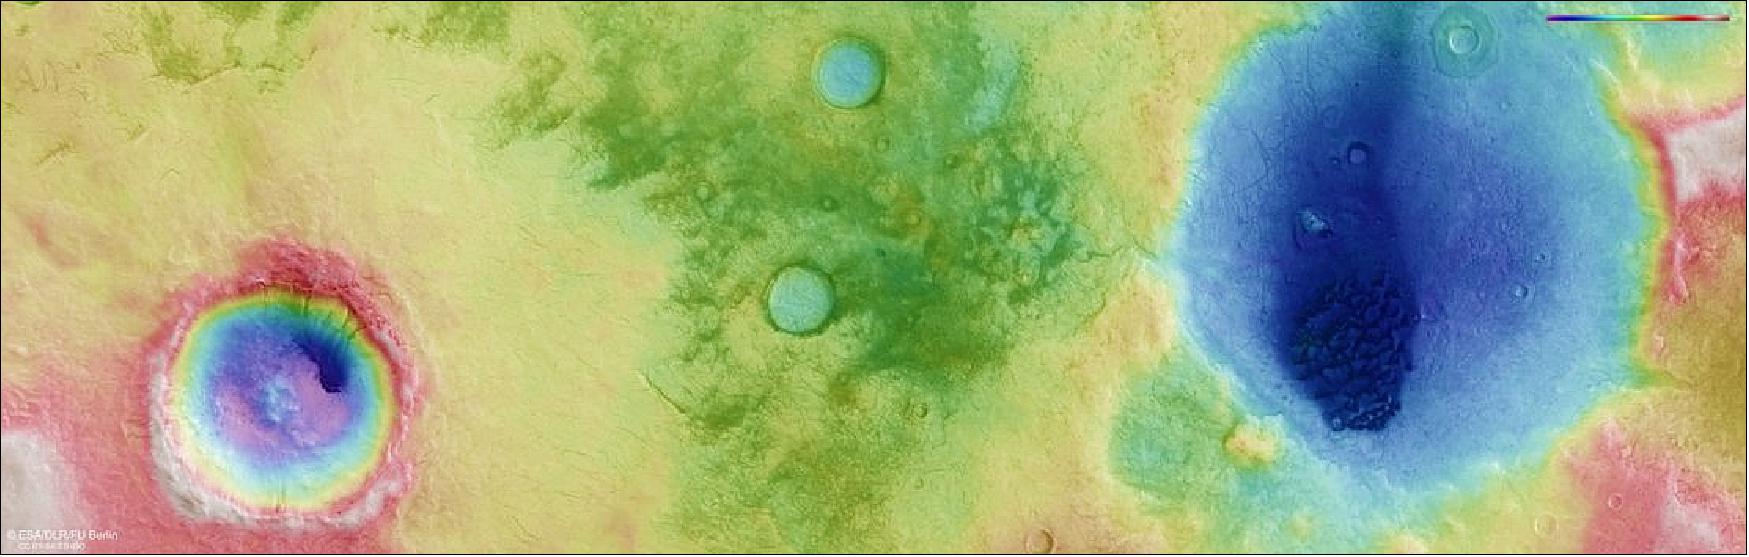
- Martian dust devils are similar to those seen on Earth in especially dry, arid, desert landscapes – but they are far larger. They can tower up to eight kilometers high on the Red Planet, creating paths that are hundreds of meters wide and stretch out for a few kilometers.
- Their colossal size makes them highly effective at carrying dust high up into Mars' atmosphere – in fact, these devils may lift as much material as a martian global dust storm does at its peak.
- Such dust storms are immense and impressive. Mars Express captured signs of a burgeoning storm near Mars' north pole in April of last year, highlighting an intense boundary between the planet's usual, calm, ochre-hued surface and an incoming wall of dust clouds – and this was a somewhat modest dust storm compared to those that blanket the entirety of Mars and rage on for months.
- Dust devils have been seen often on Mars, both by Mars Express and other missions – including the ESA-Roscosmos ExoMars Trace Gas Orbiter, which recently imaged an impressive pattern of dust devil tracks in the Terra Sabaea region of Mars that may be the result of hundreds or even thousands of small martian tornadoes coming together and leaving their mark on the planet's surface.
- The Trace Gas Orbiter will be joined by a rover – recently named Rosalind Franklin – and a surface science platform, due to launch in 2020. These will allow the ExoMars mission to explore the Red Planet in even greater detail in coming years.
• 28 February 2019: Mars Express has revealed the first geological evidence of a system of ancient interconnected lakes that once lay deep beneath the Red Planet's surface, five of which may contain minerals crucial to life. 18)
- Mars appears to be an arid world, but its surface shows compelling signs that large amounts of water once existed across the planet. We see features that would have needed water to form – branching flow channels and valleys, for example – and just last year Mars Express detected a pool of liquid water beneath the planet's south pole.
- A new study now reveals the extent of underground water on ancient Mars that was previously only predicted by models.
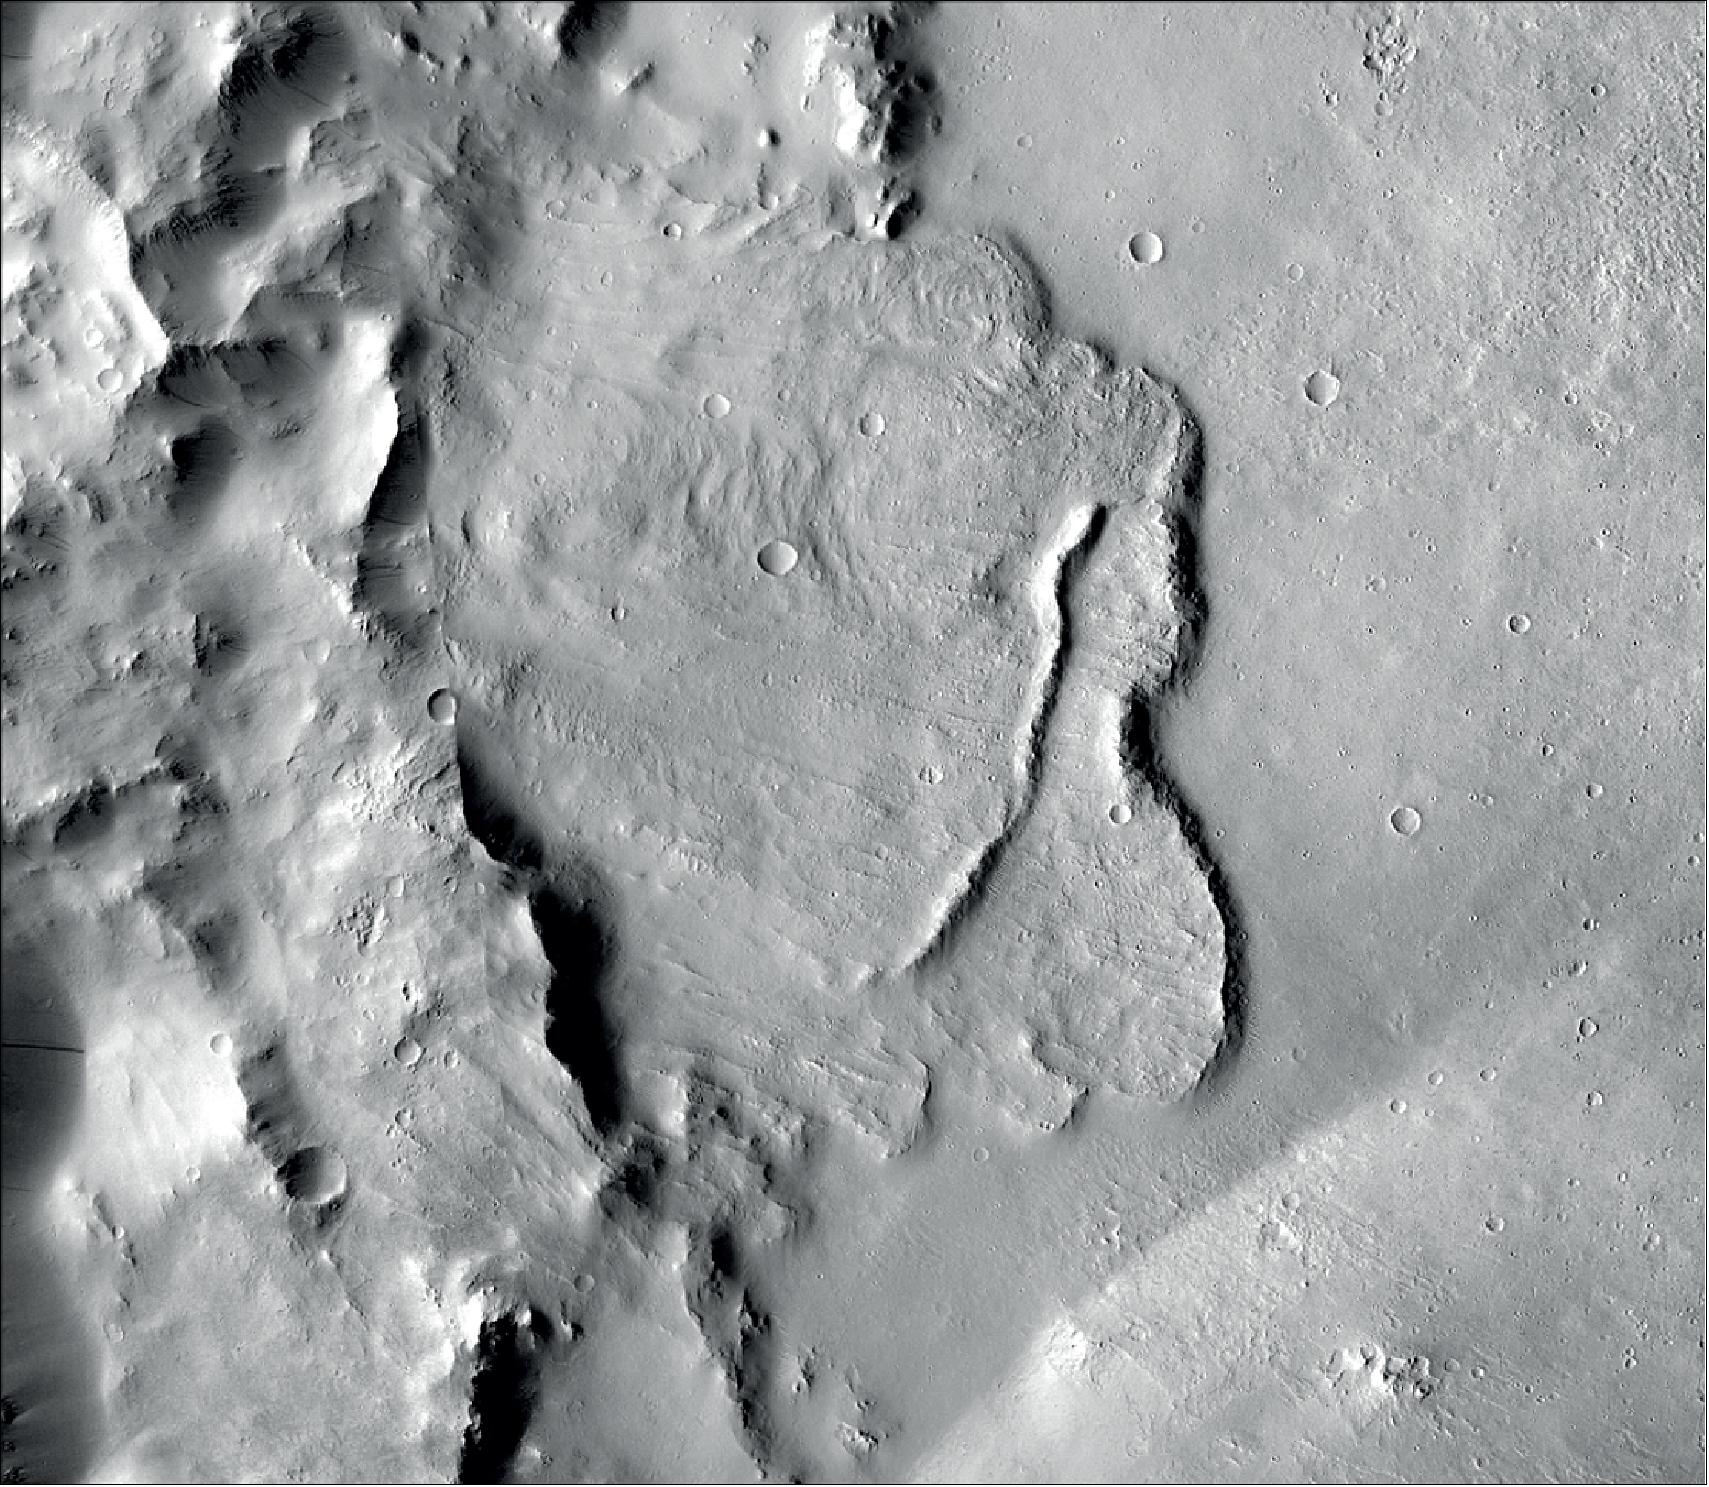
Figure 51: Example of features identified in a deep basin on Mars that show it was influenced by groundwater billions of years ago (image credit: NASA/JPL-Caltech/MSSS)
![Figure 52: This image shows the distribution of a number of deep craters (marked as dots) recently explored as part of a study into groundwater on Mars. The background image is shown in colors representing topography: reds and oranges are lower elevations, and blues and greens are higher ones. The study found that the floors of the basins, which sit over 4000 m deep, show signs of past water – the first geological evidence that the Red Planet once had a system of interconnected groundwater-fed lakes that spanned the entire planet [image credit: Topography: NASA/MGS/MOLA; Crater distribution: F. Salese et al (2019)]](https://eoportal.org/ftp/satellite-missions/m/MarsExpress2019-2004_010322/MarsExp.2019-2004_Auto29.jpeg)
- “Early Mars was a watery world, but as the planet’s climate changed this water retreated below the surface to form pools and ‘groundwater’,” says lead author Francesco Salese of Utrecht University, the Netherlands. “We traced this water in our study, as its scale and role is a matter of debate, and we found the first geological evidence of a planet-wide groundwater system on Mars.” 19)
- Salese and colleagues explored 24 deep, enclosed craters in the northern hemisphere of Mars, with floors lying roughly 4000 m below martian ‘sea level’ (a level that, given the planet’s lack of seas, is arbitrarily defined on Mars based on elevation and atmospheric pressure).
- They found features on the floors of these craters that could only have formed in the presence of water. Many craters contain multiple features, all at depths of 4000 to 4500 m – indicating that these craters once contained pools and flows of water that changed and receded over time.
![Figure 53: This diagram shows a model of how crater basins on Mars evolved over time and how they once held water. This model forms the basis of a new study into groundwater on Mars, which found that a number of deep basins – with floors sitting over 4000 km deep – show signs of having once contained pools of water. Images (from the context camera onboard NASA’s Mars Reconnaissance Orbiter) show examples of the different features observed in the basins. — There are three main stages: in the first (top), the crater basin is flooded with water and water-related features – deltas, sapping valleys, channels, shorelines, and so on – form within. In the second stage (middle), the planet-wide water level drops and new landforms emerge as a result. In the final stage (bottom), the crater dries out and becomes eroded, and features formed over the previous few billions of years are revealed [image credit: Images: NASA/JPL-Caltech/MSSS; Diagram adapted from F. Salese et al. (2019)]](https://eoportal.org/ftp/satellite-missions/m/MarsExpress2019-2004_010322/MarsExp.2019-2004_Auto28.jpeg)
- Features include channels etched into crater walls, valleys carved out by sapping groundwater, dark, curved deltas thought to have formed as water levels rose and fell, ridged terraces within crater walls formed by standing water, and fan-shaped deposits of sediment associated with flowing water.
- The water level aligns with the proposed shorelines of a putative martian ocean thought to have existed on Mars between three and four billion years ago.
- “We think that this ocean may have connected to a system of underground lakes that spread across the entire planet,” adds co-author Gian Gabriele Ori, director of the Universita D’Annunzio’s International Research School of Planetary Sciences, Italy.
- “These lakes would have existed around 3.5 billion years ago, so may have been contemporaries of a martian ocean.”
- The history of water on Mars is a complex one, and is intricately linked to understanding whether or not life ever arose there – and, if so, where, when, and how it did so.
- The team also spotted signs of minerals within five of the craters that are linked to the emergence of life on Earth: various clays, carbonates, and silicates. The finding adds weight to the idea that these basins on Mars may once have had the ingredients to host life. Moreover, they were the only basins deep enough to intersect with the water-saturated part of Mars’ crust for long periods of time, with evidence perhaps still buried in the sediments today.
- Exploring sites like these may thus reveal the conditions suitable for past life, and are therefore highly relevant to astrobiological missions such as ExoMars – a joint ESA and Roscosmos endeavor. While the ExoMars Trace Gas Orbiter is already studying Mars from above, the next mission will launch next year. It comprises a rover – recently named after Rosalind Franklin – and a surface science platform, and will target and explore martian sites thought to be key in the hunt for signs of life on Mars.
- “Findings like this are hugely important; they help us to identify the regions of Mars that are the most promising for finding signs of past life,” says Dmitri Titov, ESA’s Mars Express project scientist.
- “It is especially exciting that a mission that has been so fruitful at the Red Planet, Mars Express, is now instrumental in helping future missions such as ExoMars explore the planet in a different way. It’s a great example of missions working together with great success.”
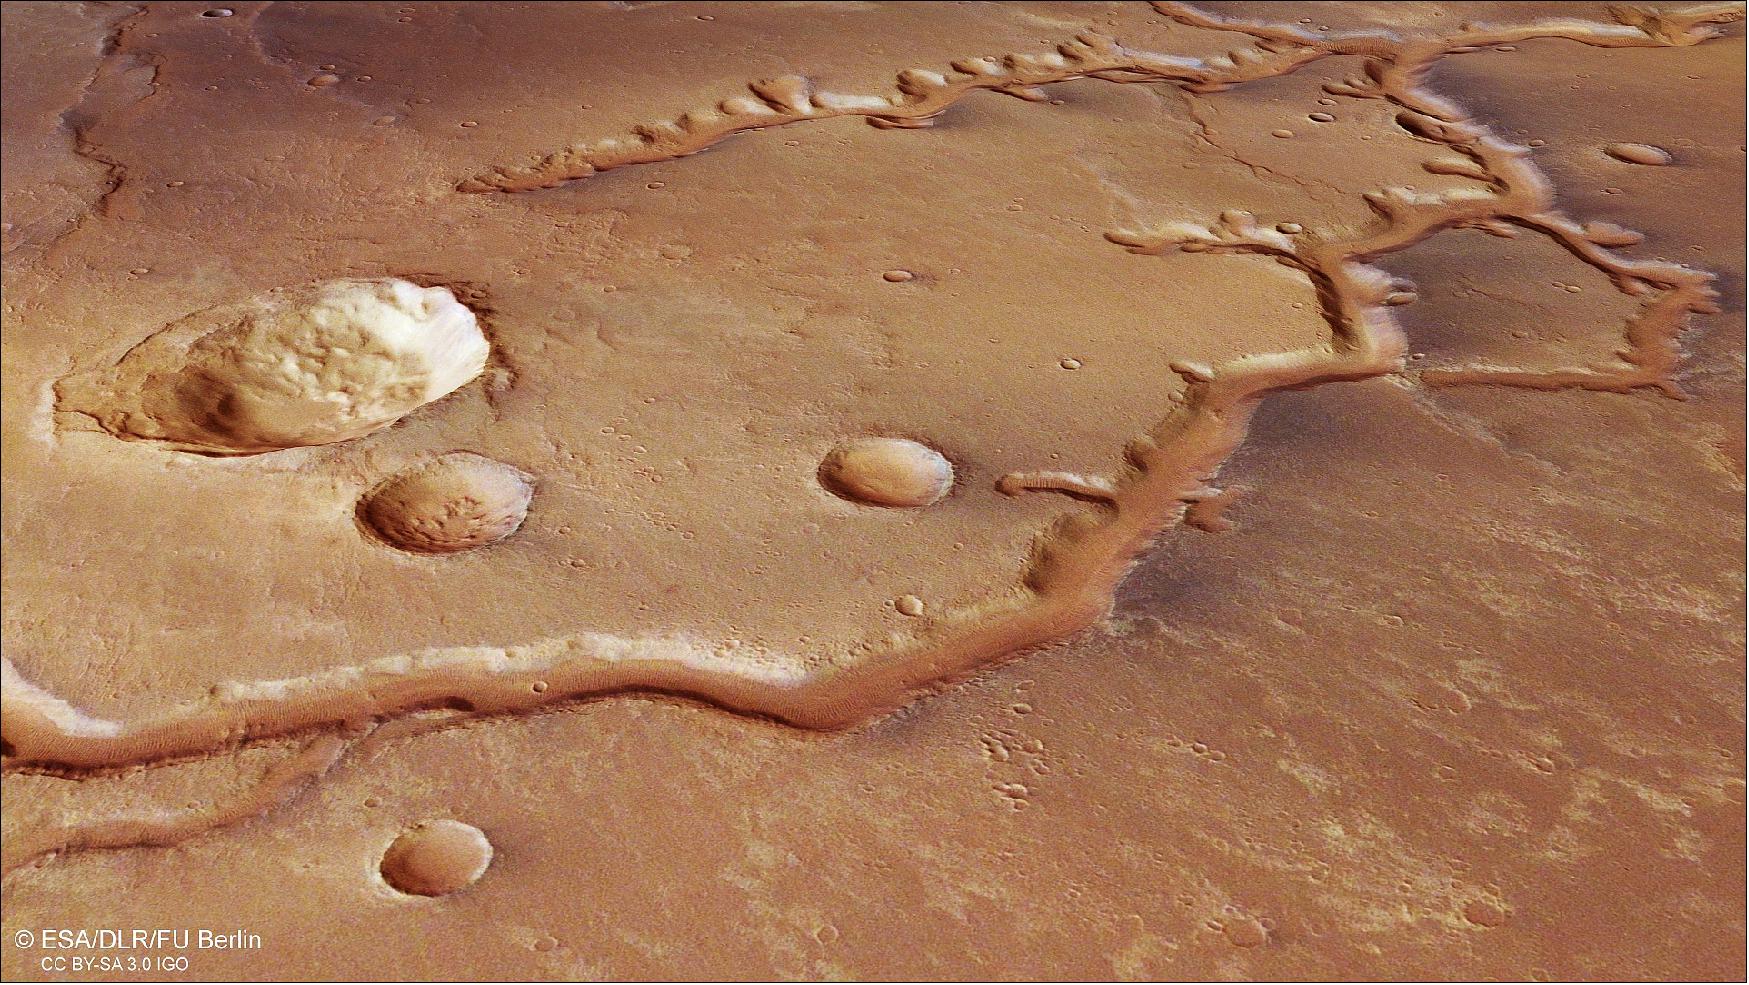
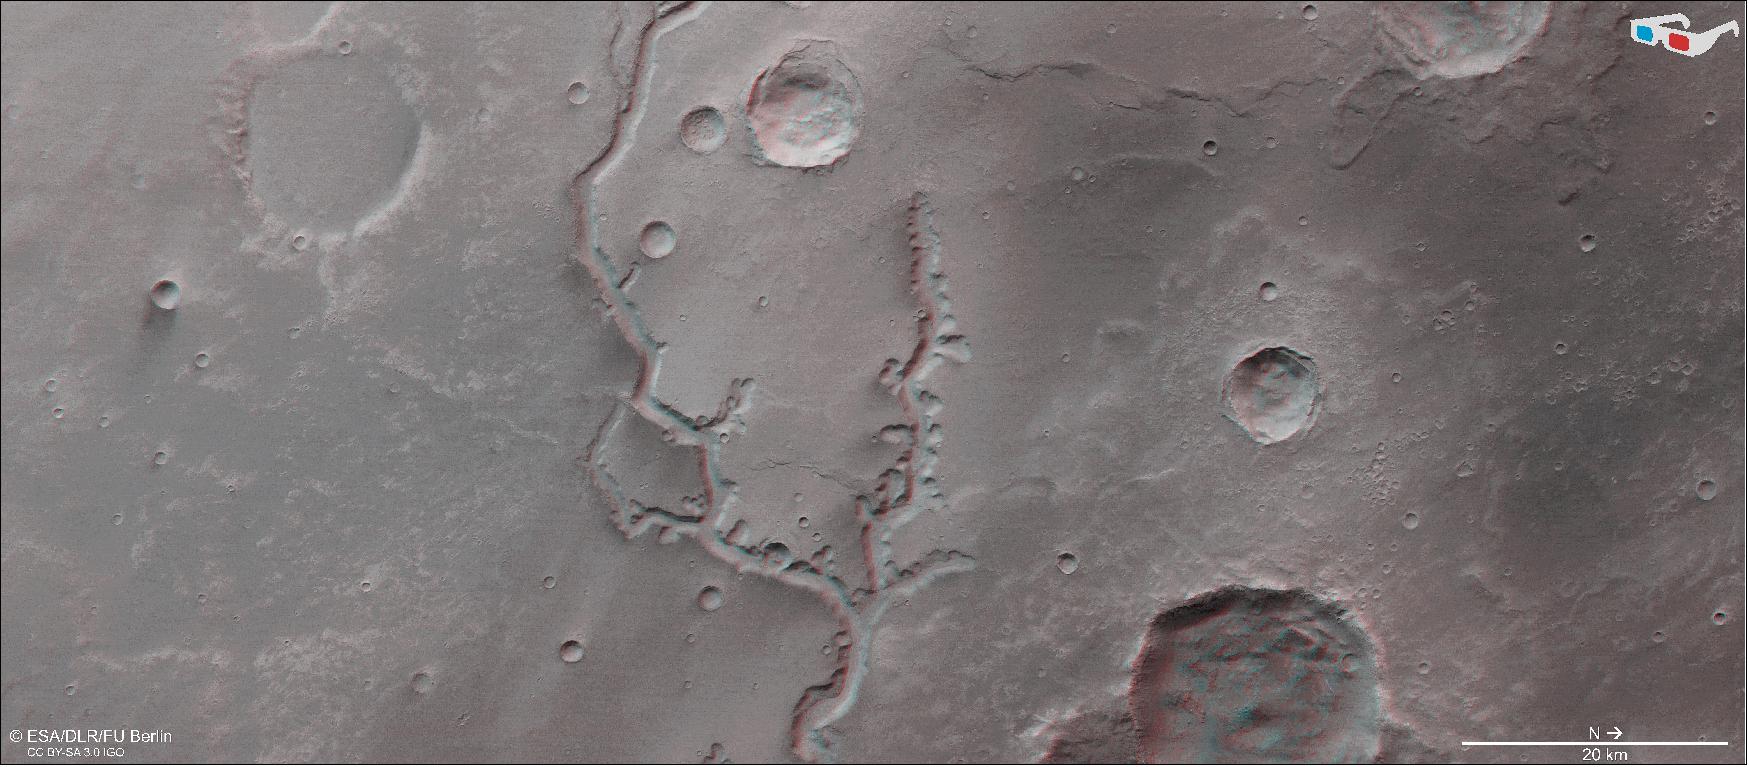
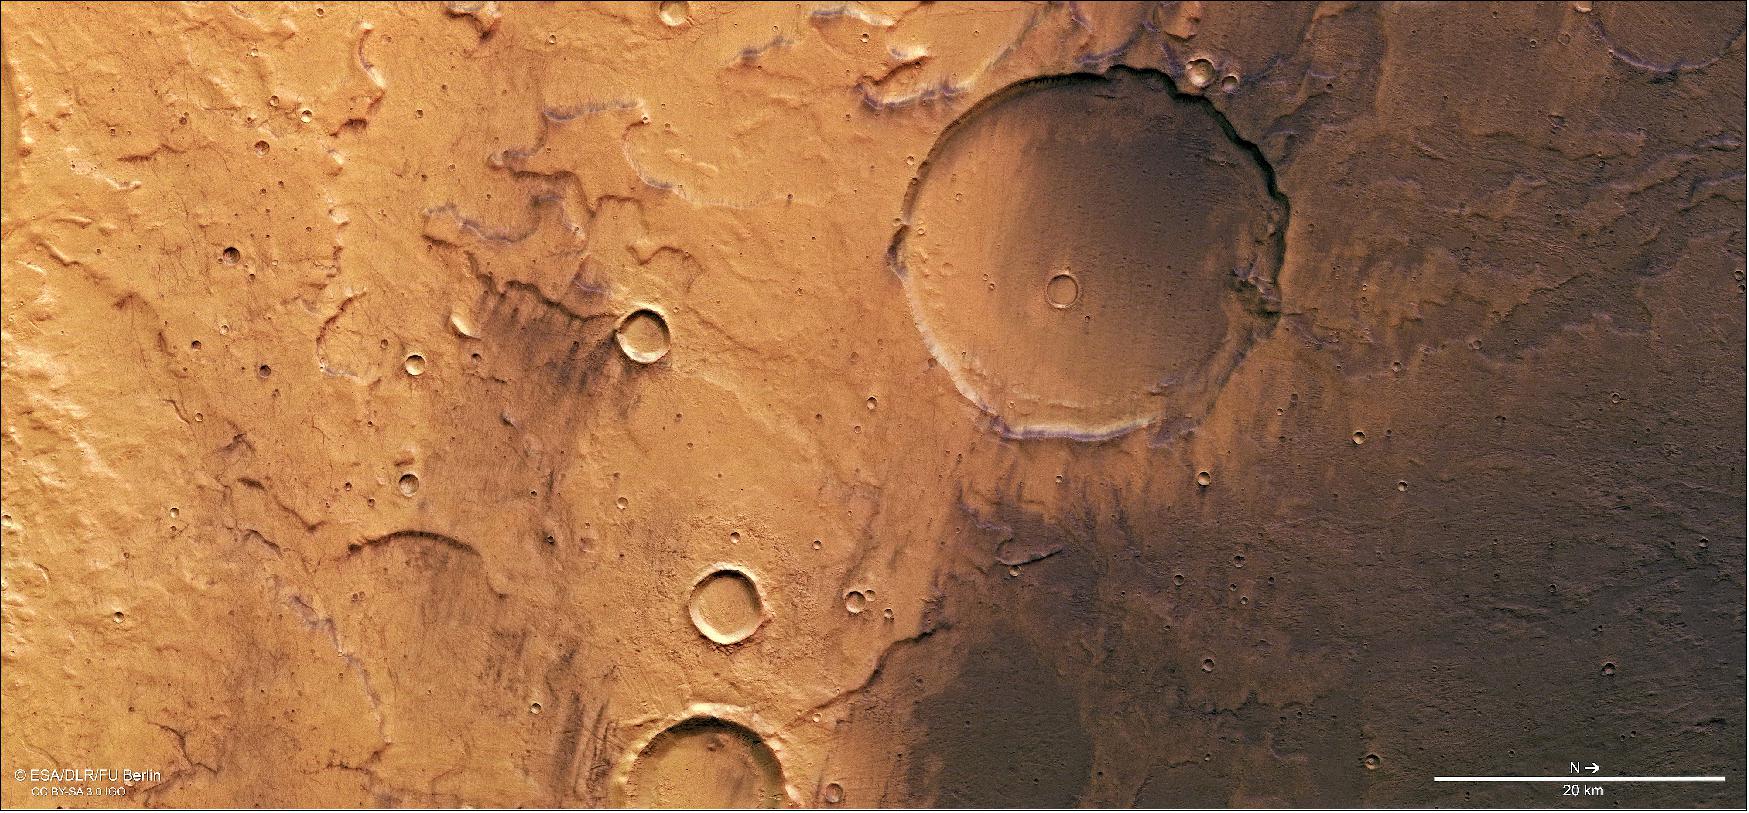
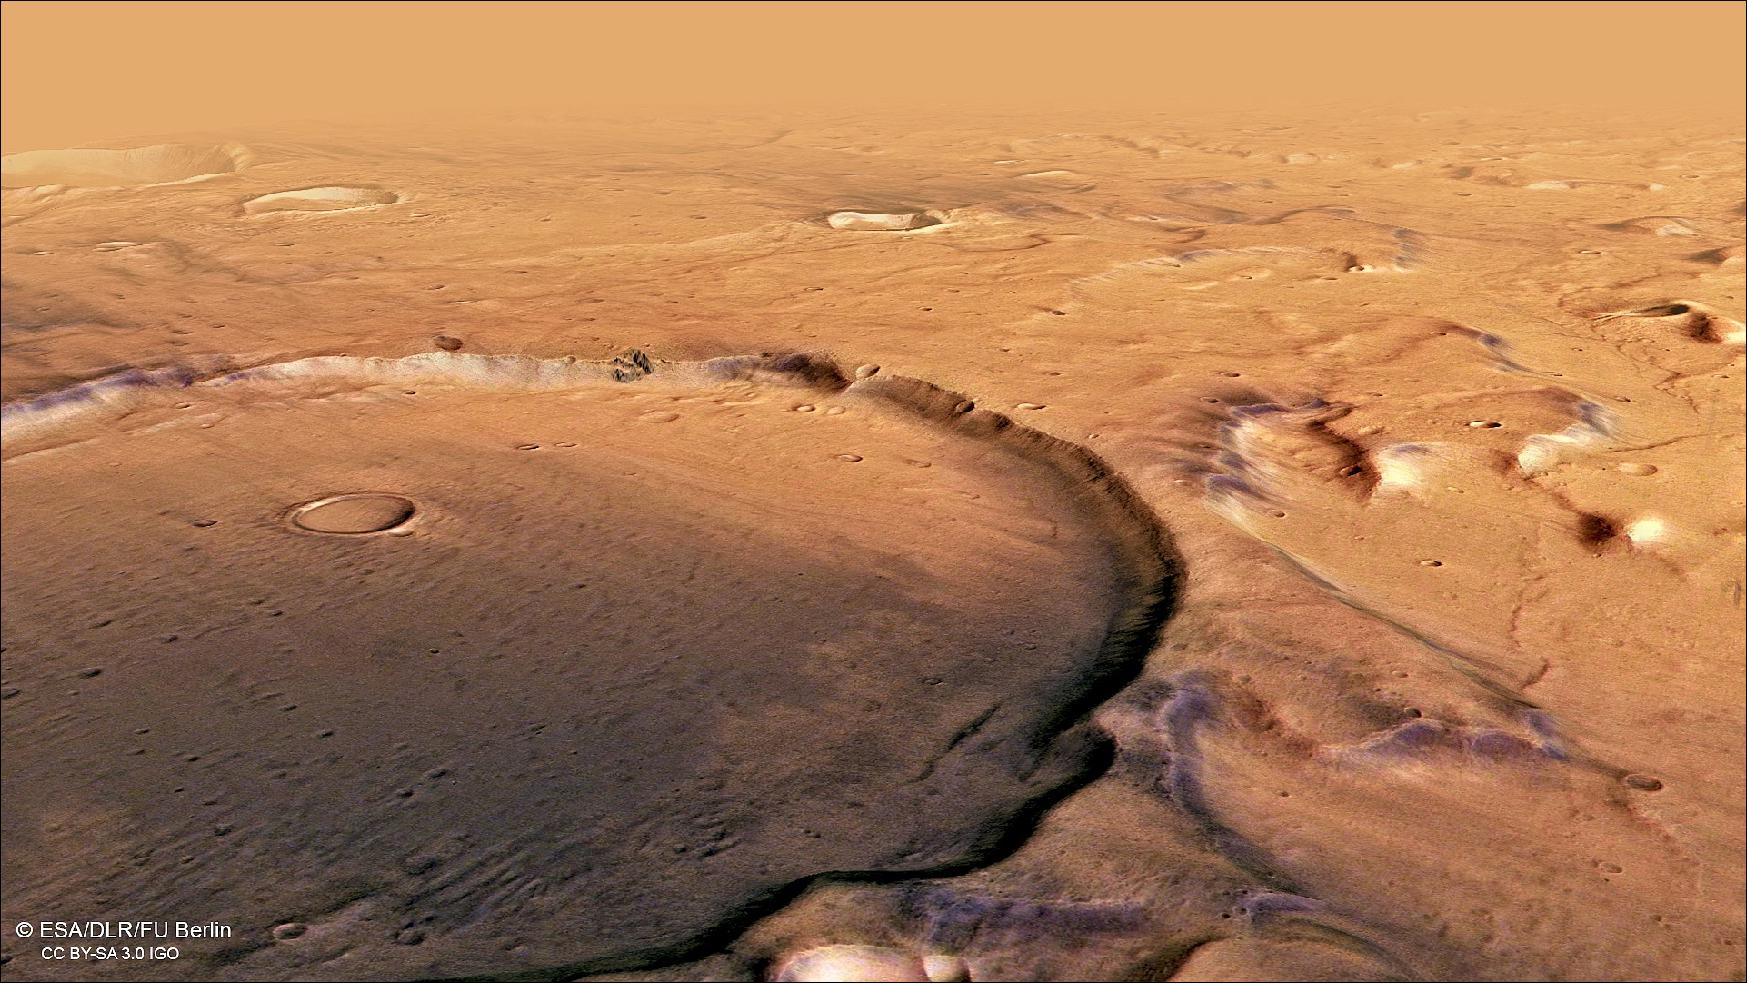
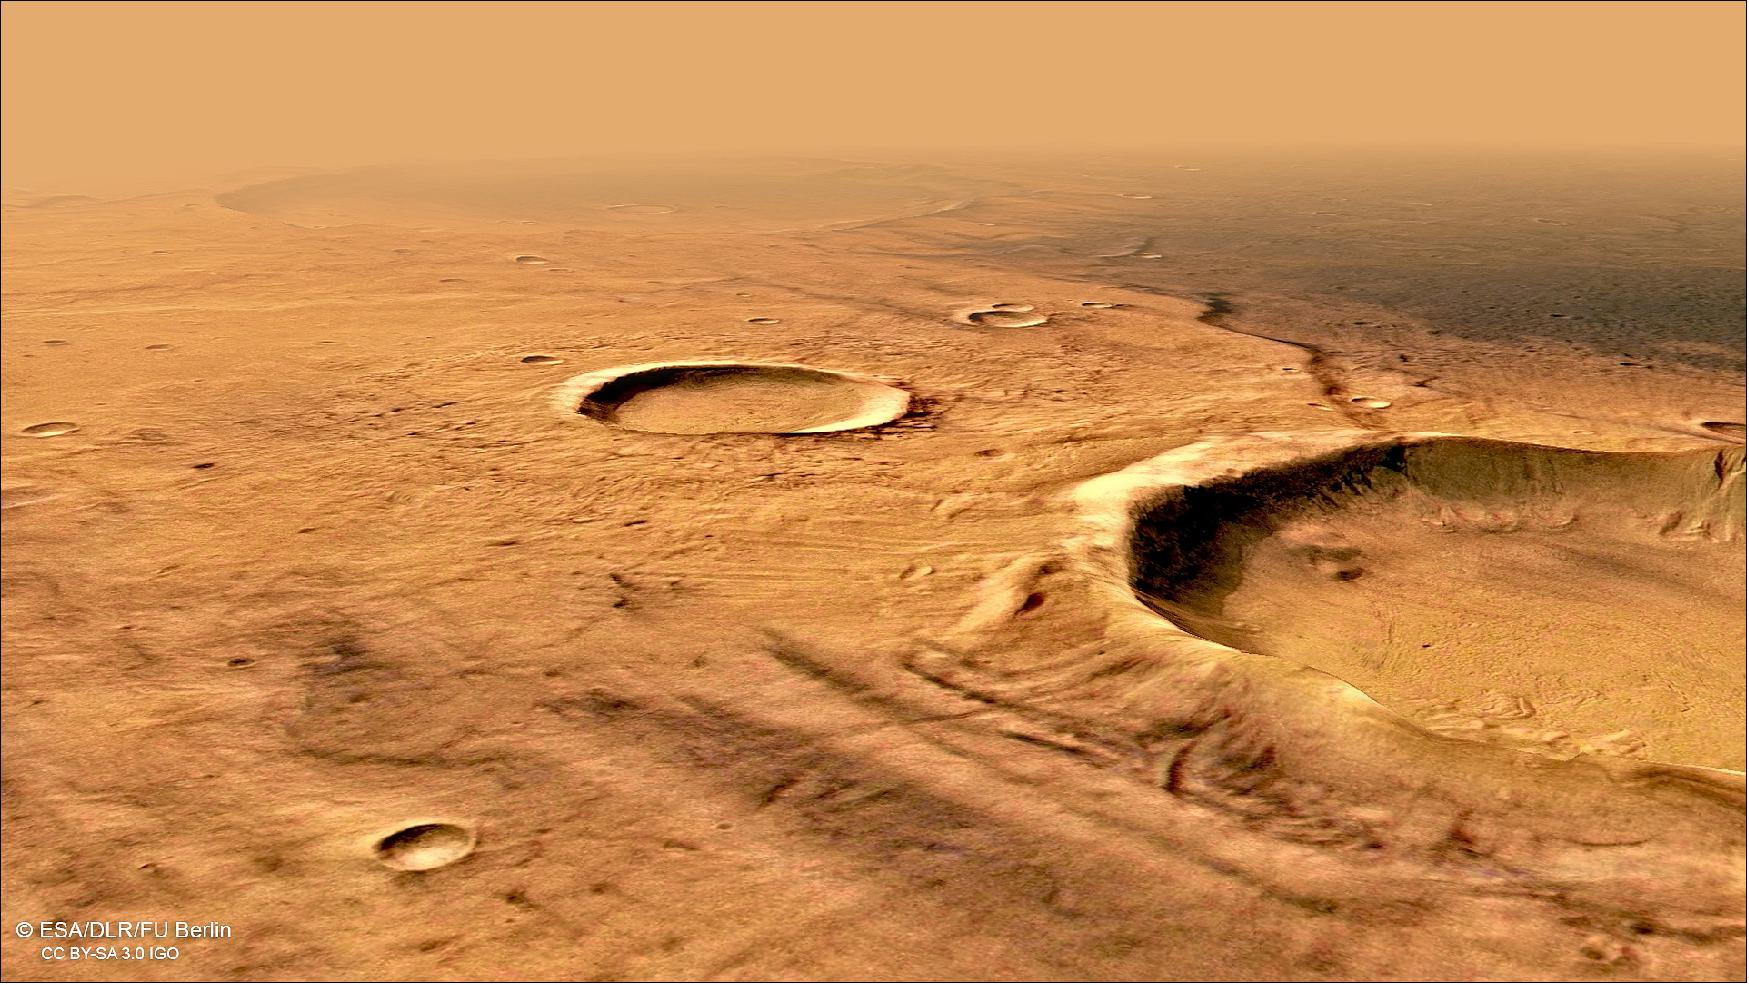
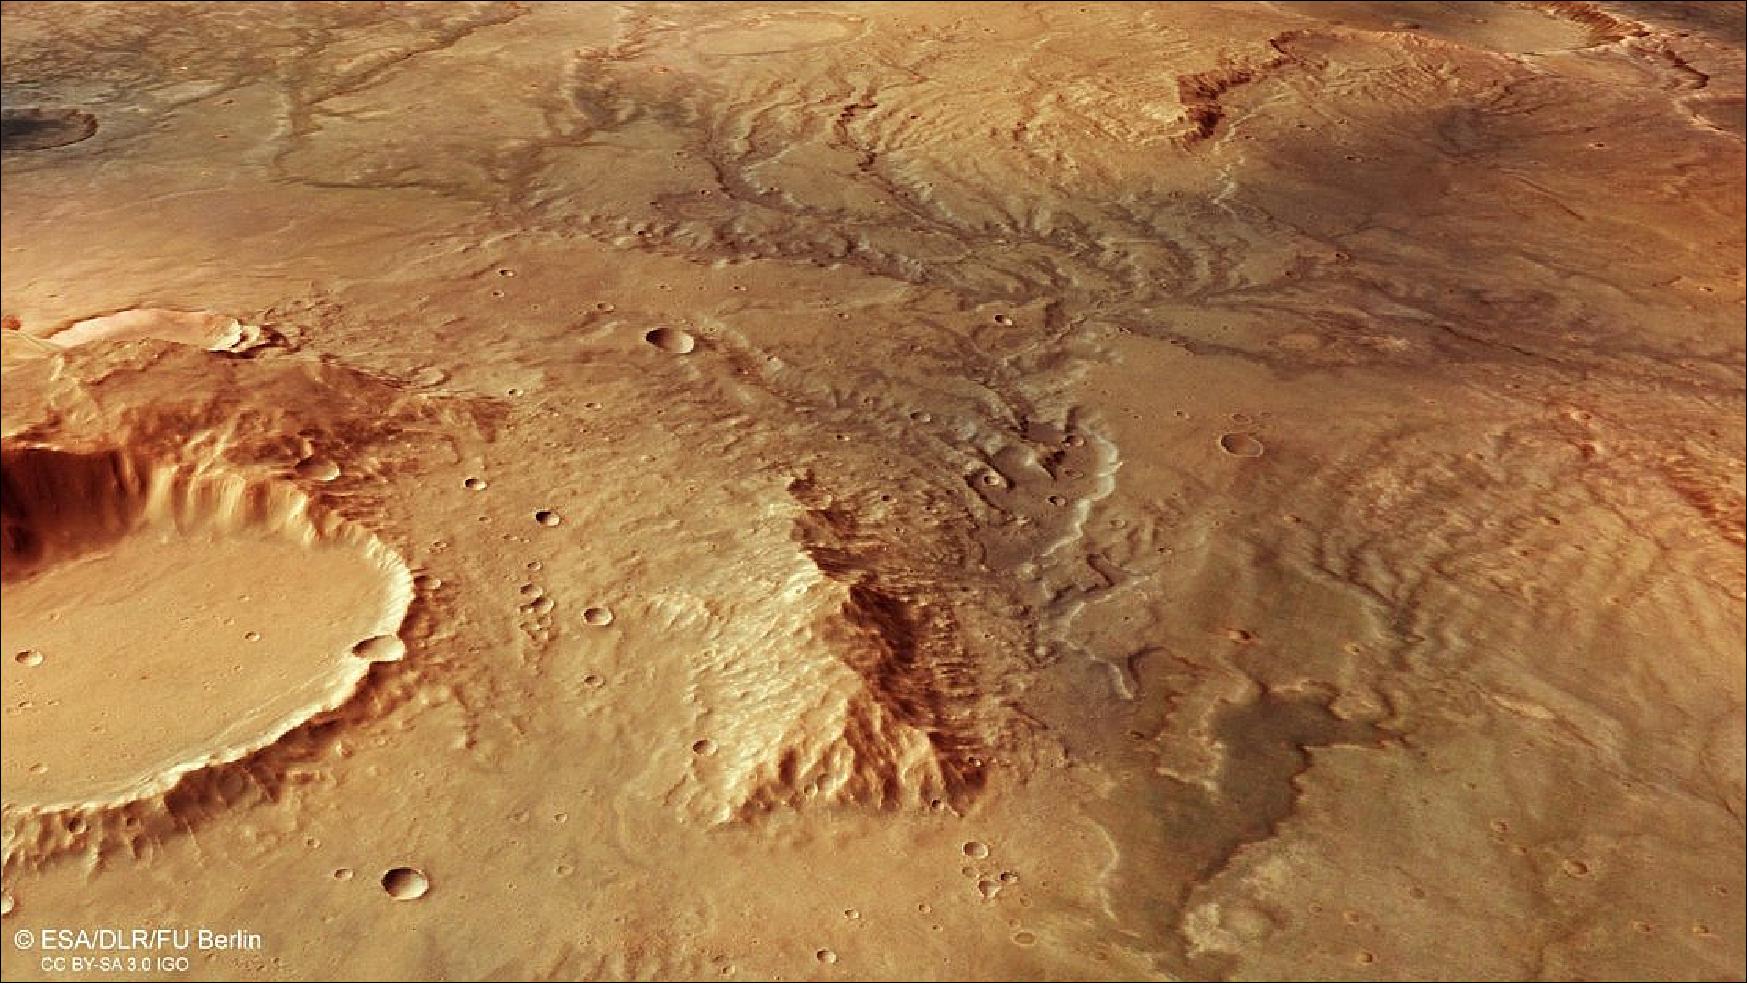
• 21 February 2019: These images from ESA’s Mars Express satellite show a branching, desiccated system of trenches and valleys, signs of ancient water flow that hint at a warmer, wetter past for the Red Planet. 20)
- We see Mars as a cold, dry world, but plenty of evidence suggests that this was not always the case. Research in past years instead increasingly indicates that the planet once had a thicker, denser atmosphere that was able to lock in far greater amounts of warmth, and therefore facilitate and support the flow of liquid water on the surface below.
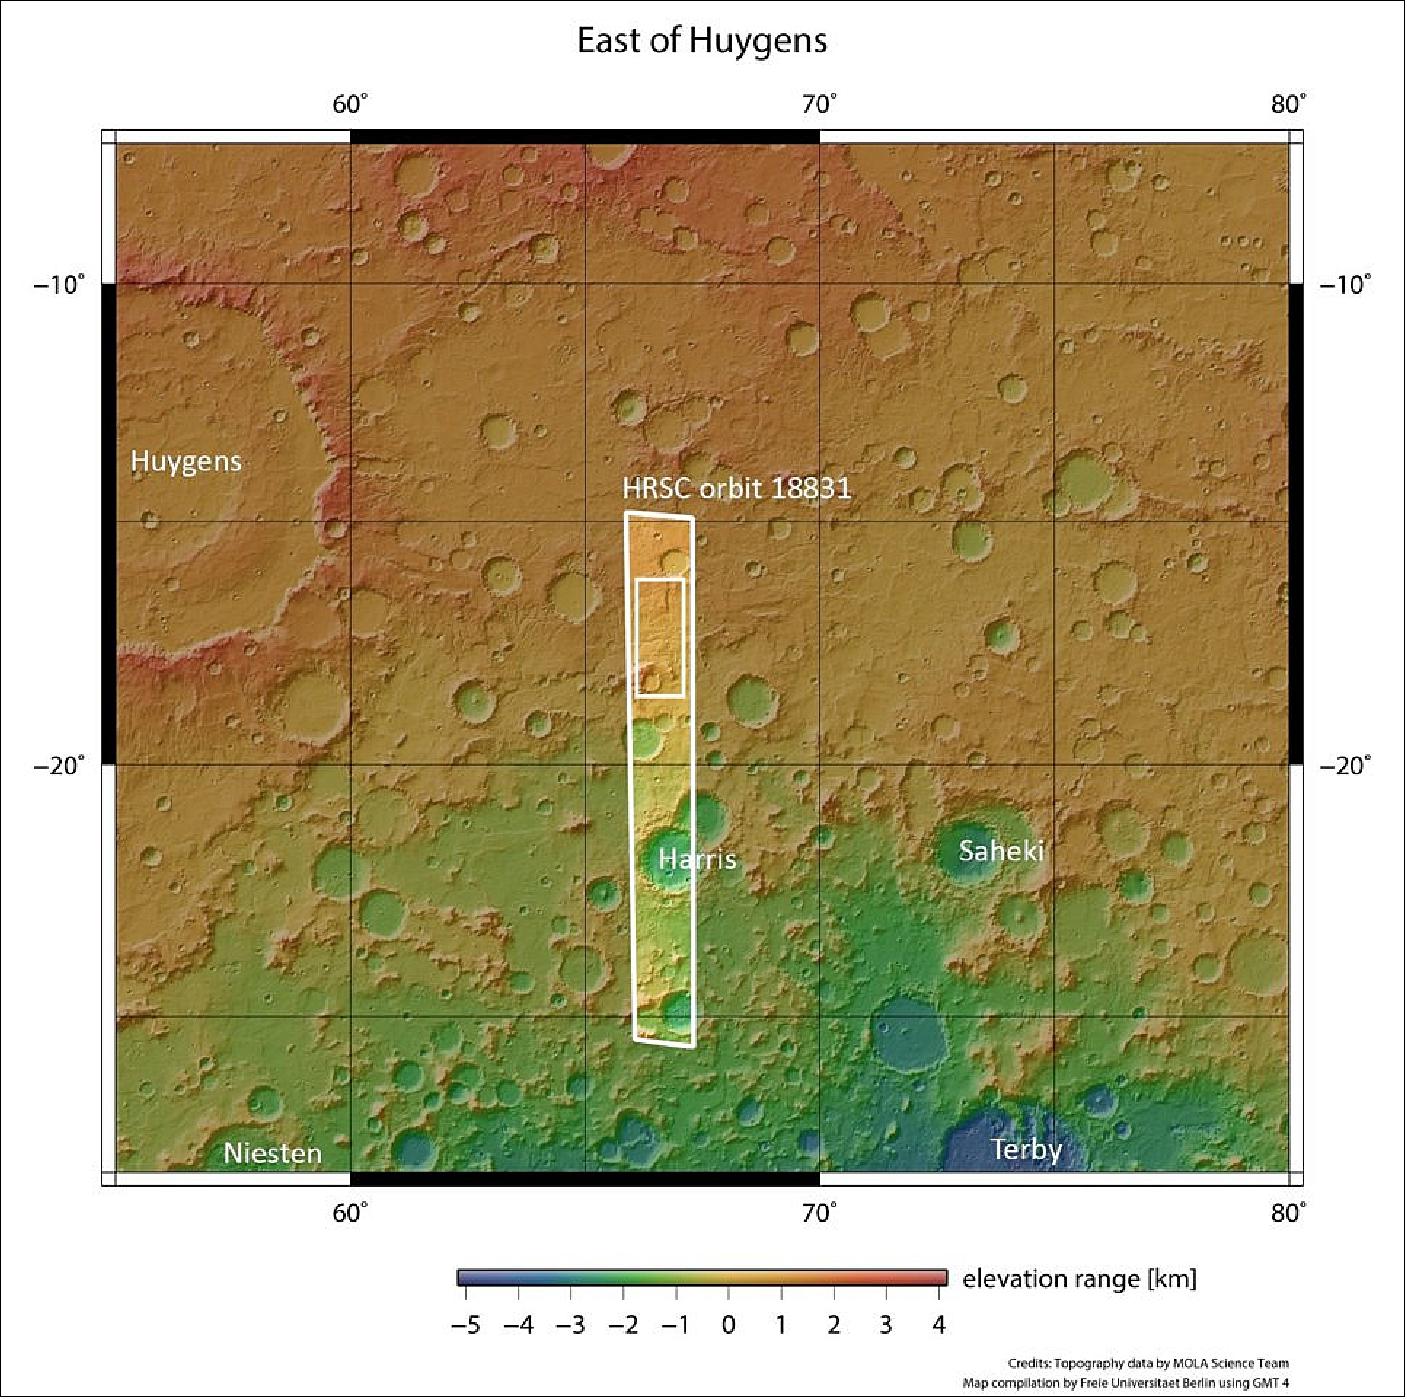
- While this is no longer the case, we see clear signs of past water activity tracing across the martian surface. This image shows one such region: a system of valleys in the southern highlands of Mars, located east of a large, well-known impact crater called Huygens and north of Hellas, the largest impact basin on the planet. At 3.5 to four billion years old, the southern highlands are some of the oldest and most heavily cratered parts of Mars, with many signs of ancient water flow observed here.
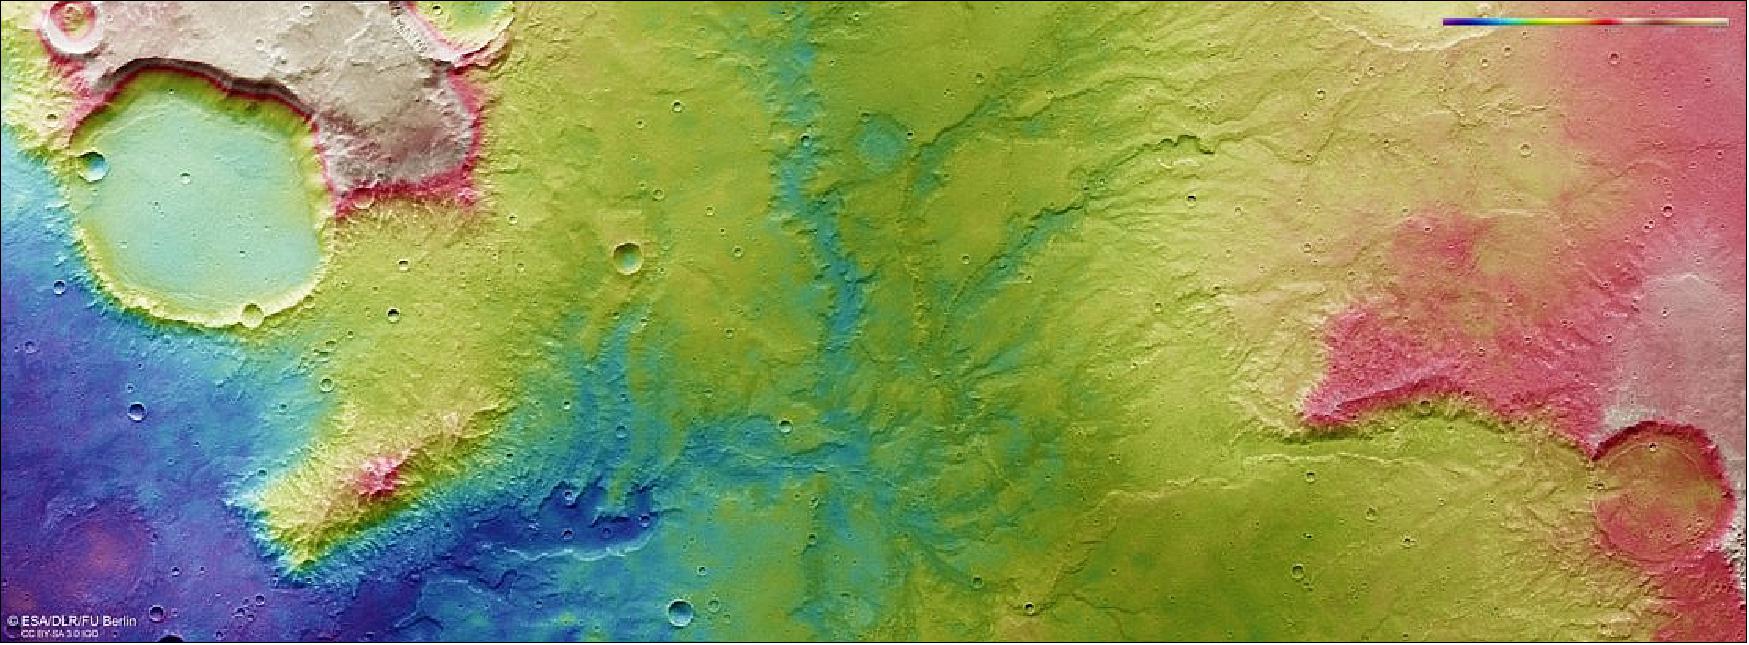
- The topography of this region suggests that water flowed downhill from the north (right in the main color, topography and 3D images) to the south (left), carving out valleys up to two kilometers across and 200 meters deep as it did so. We see these valleys as they stand today, having undergone significant and heavy erosion since they were formed. This erosion is visible in the form of broken down, smoothed, fragmented and dissected valley rims, especially in the valleys cutting from east to west.
- Overall, the valley system appears to branch out significantly, forming a pattern a little like tree branches stemming from a central trunk. This kind of morphology is known as ‘dendritic’ – the term is derived from the Greek word for tree (dendron), and it is easy to see why. Various channels split off from the central valley, forming little tributaries that often split again on their journey outwards.
- This kind of dendritic structure is also seen in drainage systems on Earth. A particularly good example is that of the Yarlung Tsangpo river, which snakes its way from its source in western Tibet down through China, India, and Bangladesh. In the case of this image of Mars, these branching channels were likely formed by surface water runoff from a once-strong river flow, combined with extensive rainfall. This flow is thought to have cut through existing terrain on Mars, forging new paths and carving a new landscape.
- While it is unclear where all of this water came from originally – precipitation, groundwater, melting glaciers? – all of this required a far warmer and more watery past for Mars than the planet we see today.
- A tantalizing question raised by this warmer and wetter climate is whether conditions would have been suitable for life – a topic at the heart of Mars exploration. Next year, ESA and Roscosmos will launch the ExoMars mission comprising a rover – recently named Rosalind Franklin – and a surface science platform. The rover will drive to interesting locations to drill below the surface in search for signs of life – the first mission of its kind. Meanwhile, the ExoMars Trace Gas Orbiter continues to analyze the atmosphere in greater detail than ever, with a particular interest for gases potentially related to biological or geological activity, and to identify subsurface locations where water-ice or hydrated minerals are present.
- This succession of spacecraft at Mars – both in orbit and on the surface – ensures ESA’s long-term presence in Mars science and exploration. The next step that ESA together with international partners are considering is returning a sample of Mars to Earth – an ambitious task that will provide scientific treasures for generations to come.
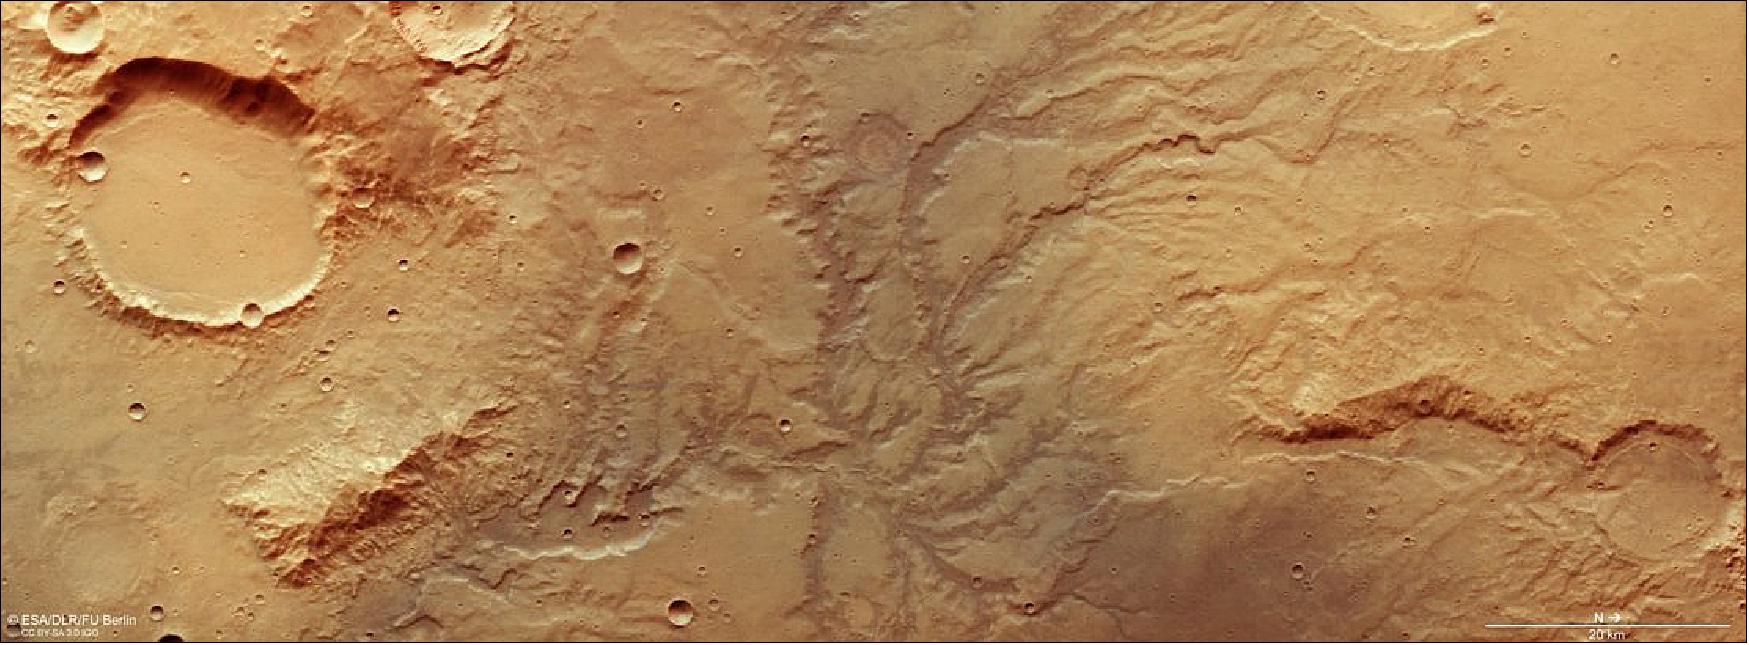
• 11 January 2019: Fifteen years ago, early on the evening of Saturday 10 January 2004, over a dozen scientists crammed into a tiny, somewhat austere room at the German Aerospace Center (Deutsches Zentrum für Luft- und Raumfahrt; DLR) research center in Berlin Adlershof to stare intently at two monitors. They were awaiting the first images from 'their' experiment, the High Resolution Stereo Camera (HRSC). Just over two weeks earlier, the Mars Express spacecraft, launched by the European Space Agency (ESA), had reached its destination and maneuvered into a stable, elliptical orbit over the poles of the planet. As planned, the experiments were now set to begin. Despite an initial unsatisfactory test, HRSC showed its full potential during the tenth orbit. Mars Express transmitted razor-sharp high-definition image data with a perfect brightness distribution via ESA's ground stations to the ESOC (European Space Operations Center) in Darmstadt. In Berlin the images were greeted with boundless enthusiasm. This was the beginning of a success story that has lasted one-and-a-half decades. 21)
- HRSC is a German camera experiment developed by DLR and carried on board ESA's Mars Express orbiter; it is operated by the DLR Institute of Planetary Research. The spacecraft has been orbiting Mars since Christmas 2003. This week, on 8 January 2019, the orbiter, dubbed 'MEX' by the scientists and engineers involved in the project, completed its 19,000th orbit of Mars. ESA's first planetary mission is a true 'marathon runner'. In total, the probe has travelled approximately 950 million km around Mars, in addition to its almost 500-million-kilometer journey from Earth to Mars. The total distance travelled is roughly the same as the distance from the Sun to Saturn.
- The high-resolution image data, in stereo and color, form the basis for the global mapping of Mars and the creation of digital terrain models that reveal the planet's topography. HRSC has acquired image data during more than 5000 orbits around Mars and thus provided more data than any other German experiment investigating objects within the Solar System. To date, approximately 360 GB of compressed raw data have been acquired and transmitted to Earth. After 'unpacking' the data packets and putting them through the first stage of processing, the researchers have 5400 GB of data, which form the basis for further processing into image data suitable for cartography.
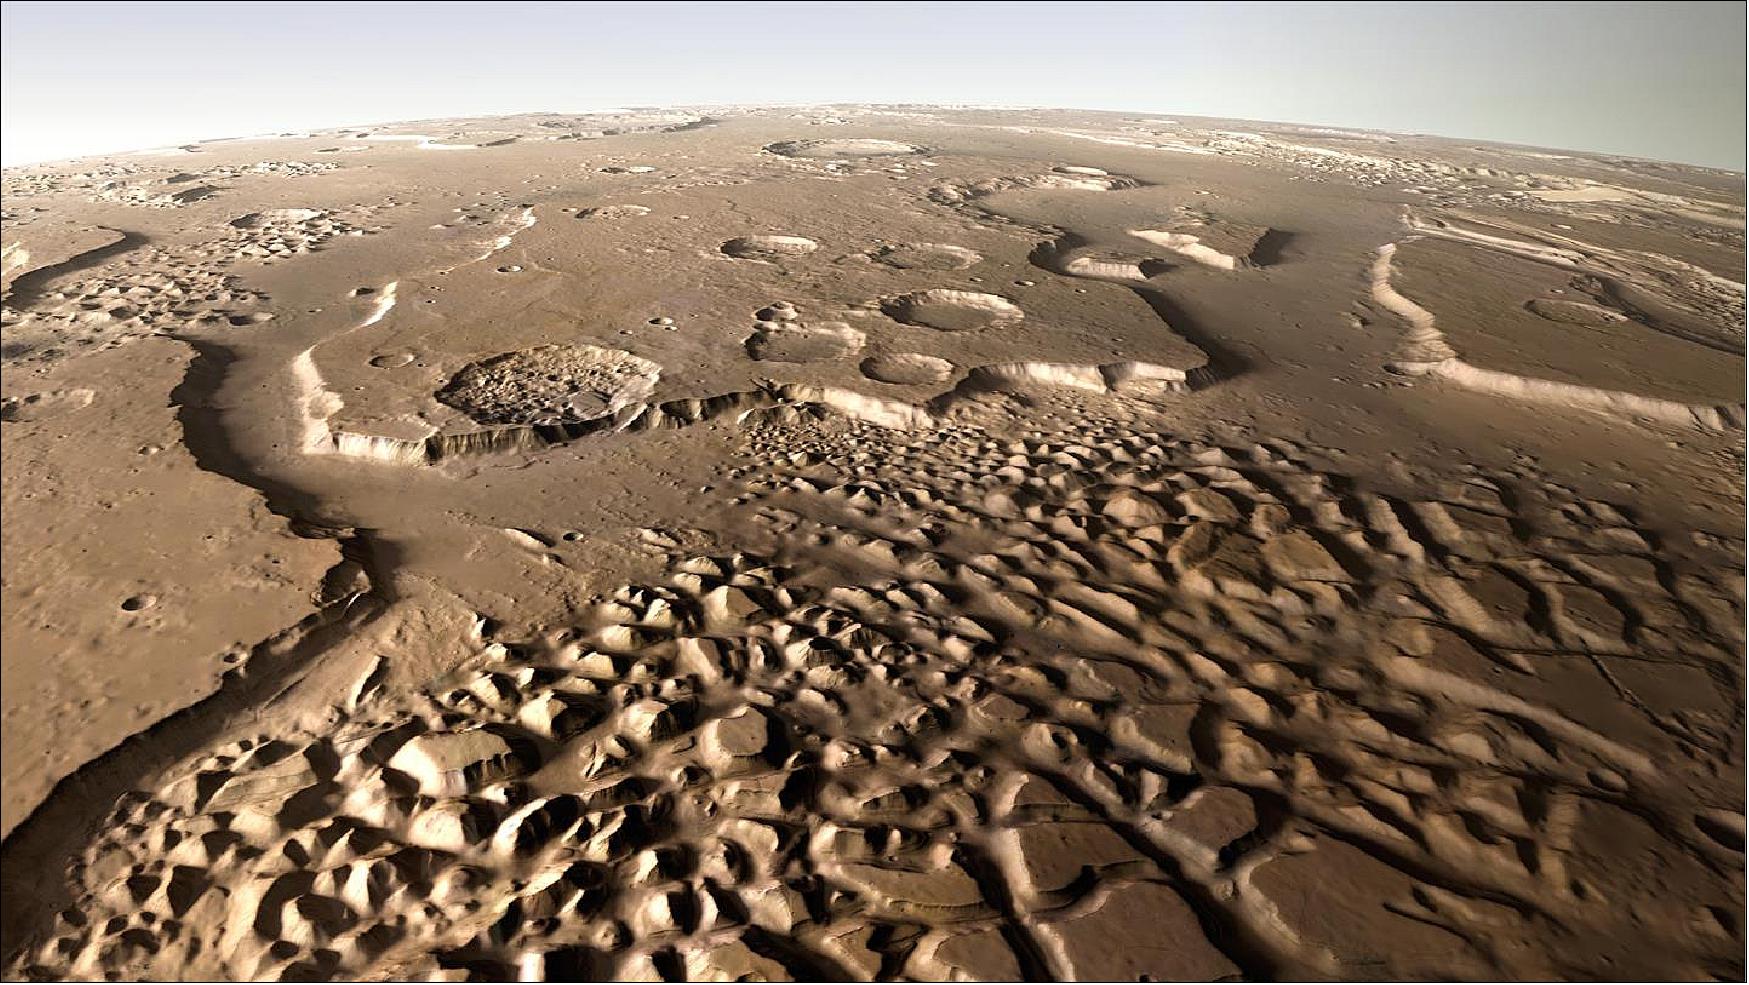
- The images have resulted in an ever-growing collection of spectacular views of the diverse Martian landscape – from image and terrain model mosaics to animations that can be derived from the digital landscape models. The camera has provided coverage of 80 percent of the Martian surface at high resolution (better than 20 m/pixel). Originally, Mars Express was intended to last only one Martian year, which equates to two Earth years. Due to its success, ESA has already extended the mission seven times, and it is now set to run until the end of 2022. Ralf Jaumann from the DLR Institute of Planetary Research in Berlin-Adlershof is the Principal Investigator for the experiment; the science and engineering team includes 51 co-investigators. Hundreds of scientists worldwide are now working with the data from the experiment. The systematic processing of the camera data is performed at the DLR Institute of Planetary Research. Staff in the Department of Planetary Science and Remote Sensing at the Freie Universität Berlin create the image products that are published monthly.
The German Space Industry Implements a DLR Concept for Mapping Mars
- HRSC, which was developed by DLR in conjunction with German industry, represented, at the time, a completely new camera concept that had never previously been used for planetary mapping. Its unique optics – an Apo-Tessar telescope built by Jena-Optronik GmbH – illuminate nine line sensors positioned transverse to the direction of flight that, due to the forward motion of the orbiter, image the same strip of the Martian surface – like a scanner – working line-by-line, one after the other. In doing so, each sensor images the same area on the surface from a different angle. Back on Earth, the four stereo image strips and the nadir channel, which is oriented perpendicular to Mars and provides the highest image resolution at 10 to 12 m/pixel, are used to create 3D models of the planet's surface. The remaining four of the nine line sensors are equipped with special color filters for acquiring multispectral data. The focal plane with the nine sensors forms the heart of the camera and was developed by DLR. Lewicki Microelectronic GmbH built the camera's electronics. Dornier (later Astrium and now Airbus Defence and Space) in Friedrichshafen assembled the complete instrument. The camera system was originally developed for use on the Russian Mars 96 mission, but it was lost shortly after launch on 17 November 1996. The flight spare camera, which is of identical construction, was then used on Mars Express instead – after the incorporation of a number of improvements.
• 10 January 2019: ESA’s Mars Express entered orbit around the Red Planet on 25 December 2003. The spacecraft began returning the first images from orbit using its HRSC (High Resolution Stereo Camera) just a couple of weeks later, and over the course of its fifteen year history has captured thousands of images covering the globe. 22)
• 20 December 2018: The image of Figure 60 shows what appears to be a large patch of fresh, untrodden snow – a dream for any lover of the holiday season. However, it’s a little too distant for a last-minute winter getaway: this feature, known as Korolev crater, is found on Mars, and is shown here in beautiful detail as seen by Mars Express. 23) 24)
- ESA’s Mars Express mission launched on 2 June 2003, and reached Mars six months later. The satellite fired its main engine and entered orbit around the Red Planet on 25 December, making this month the 15-year anniversary of the spacecraft’s orbit insertion and the beginning of its science program.
- These images are an excellent celebration of such a milestone. Taken by the Mars Express HRSC (High Resolution Stereo Camera), this view of Korolev crater comprises five different ‘strips’ that have been combined to form a single image, with each strip gathered over a different orbit. The crater is also shown in perspective, context, and topographic views, all of which offer a more complete view of the terrain in and around the crater.
- The Korolev crater is 82 km across and found in the northern lowlands of Mars, just south of a large patch of dune-filled terrain that encircles part of the planet’s northern polar cap (known as Olympia Undae). It is an especially well-preserved example of a martian crater and is filled not by snow but ice, with its center hosting a mound of water ice some 1.8 km thick all year round.
- This ever-icy presence is due to an interesting phenomenon known as a ‘cold trap’, which occurs as the name suggests. The crater’s floor is deep, lying some two km vertically beneath its rim.
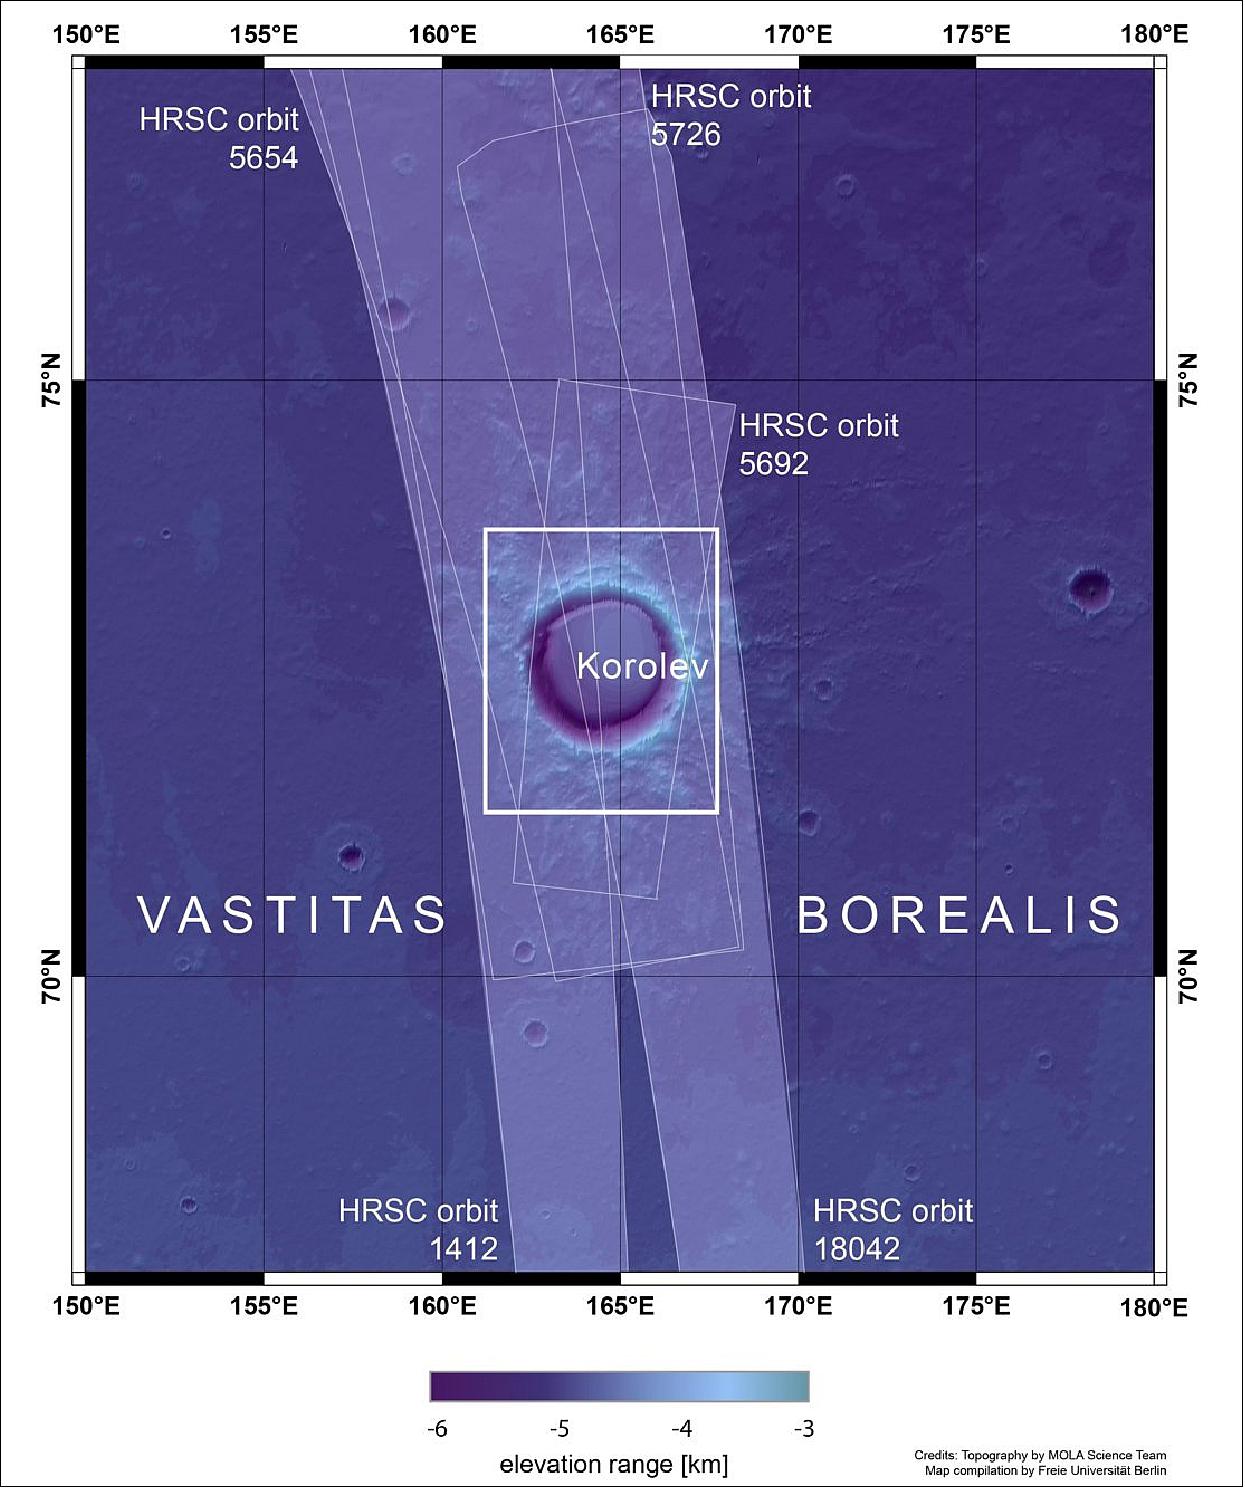
- The very deepest parts of Korolev crater, those containing ice, act as a natural cold trap: the air moving over the deposit of ice cools down and sinks, creating a layer of cold air that sits directly above the ice itself.
- Behaving as a shield, this layer helps the ice remain stable and stops it from heating up and disappearing. Air is a poor conductor of heat, exacerbating this effect and keeping Korolev crater permanently icy.
- The crater is named after chief rocket engineer and spacecraft designer Sergei Korolev (1907-1966), dubbed the father of Soviet space technology. Korolev worked on a number of well-known missions including the Sputnik program – the first artificial satellites ever sent into orbit around the Earth, in 1957 and the years following, the Vostok and Vokshod programs of human space exploration (Vostok being the spacecraft that carried the first ever human, Yuri Gagarin, into space in 1961) as well as the first interplanetary missions to the Moon, Mars, and Venus. He also worked on a number of rockets that were the precursors to the successful Soyuz launcher – still the workhorses of the Russian space program, and used for both crewed and robotic flights.
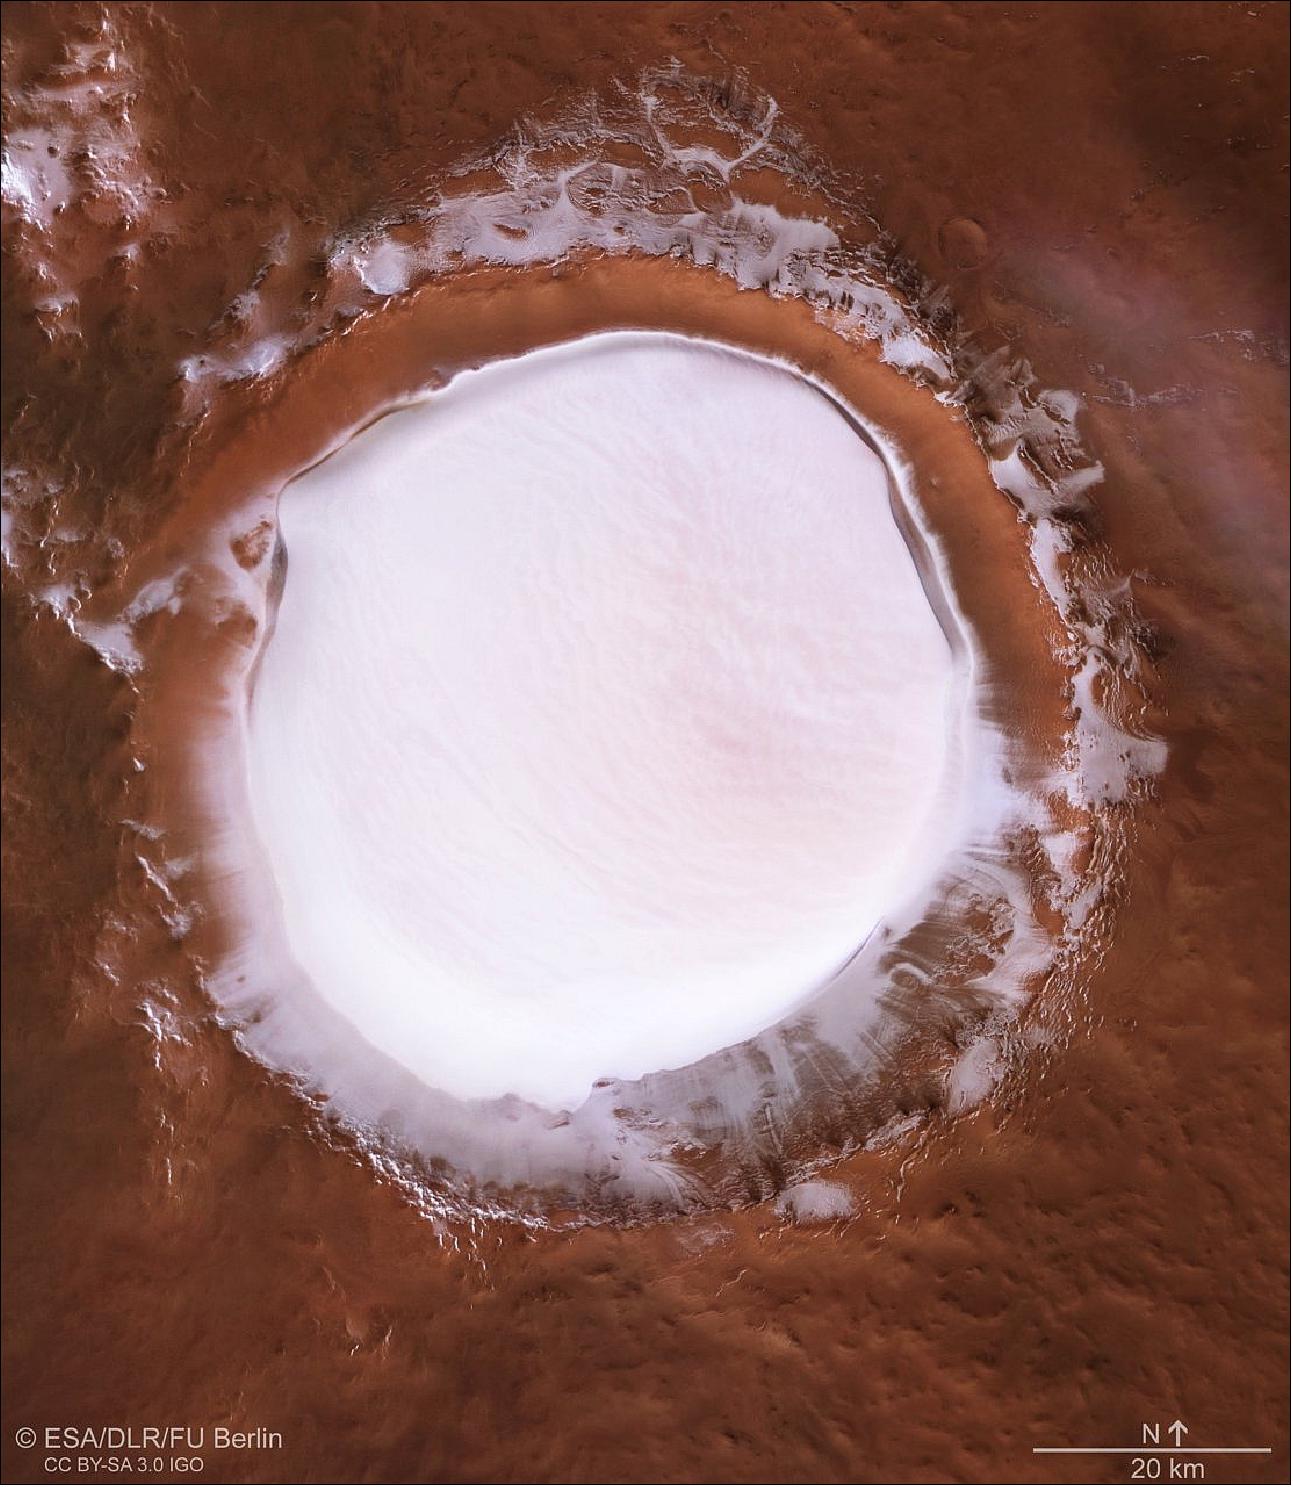
- The region of Mars has also been of interest to other missions, including ESA’s ExoMars program, which aims to establish if life ever existed on Mars. The CaSSIS (Color and Stereo Surface Imaging System) instrument aboard the ExoMars Trace Gas Orbiter, which began operating at Mars on 28 April 2018, also snapped a beautiful view of part of Korolev crater – this was one of the very first images the spacecraft sent back to Earth after arriving at our neighboring planet. CaSSIS imaged a 40 km long chunk of the crater’s northern rim, neatly showcasing its intriguing shape and structure, and its bright icy deposits.
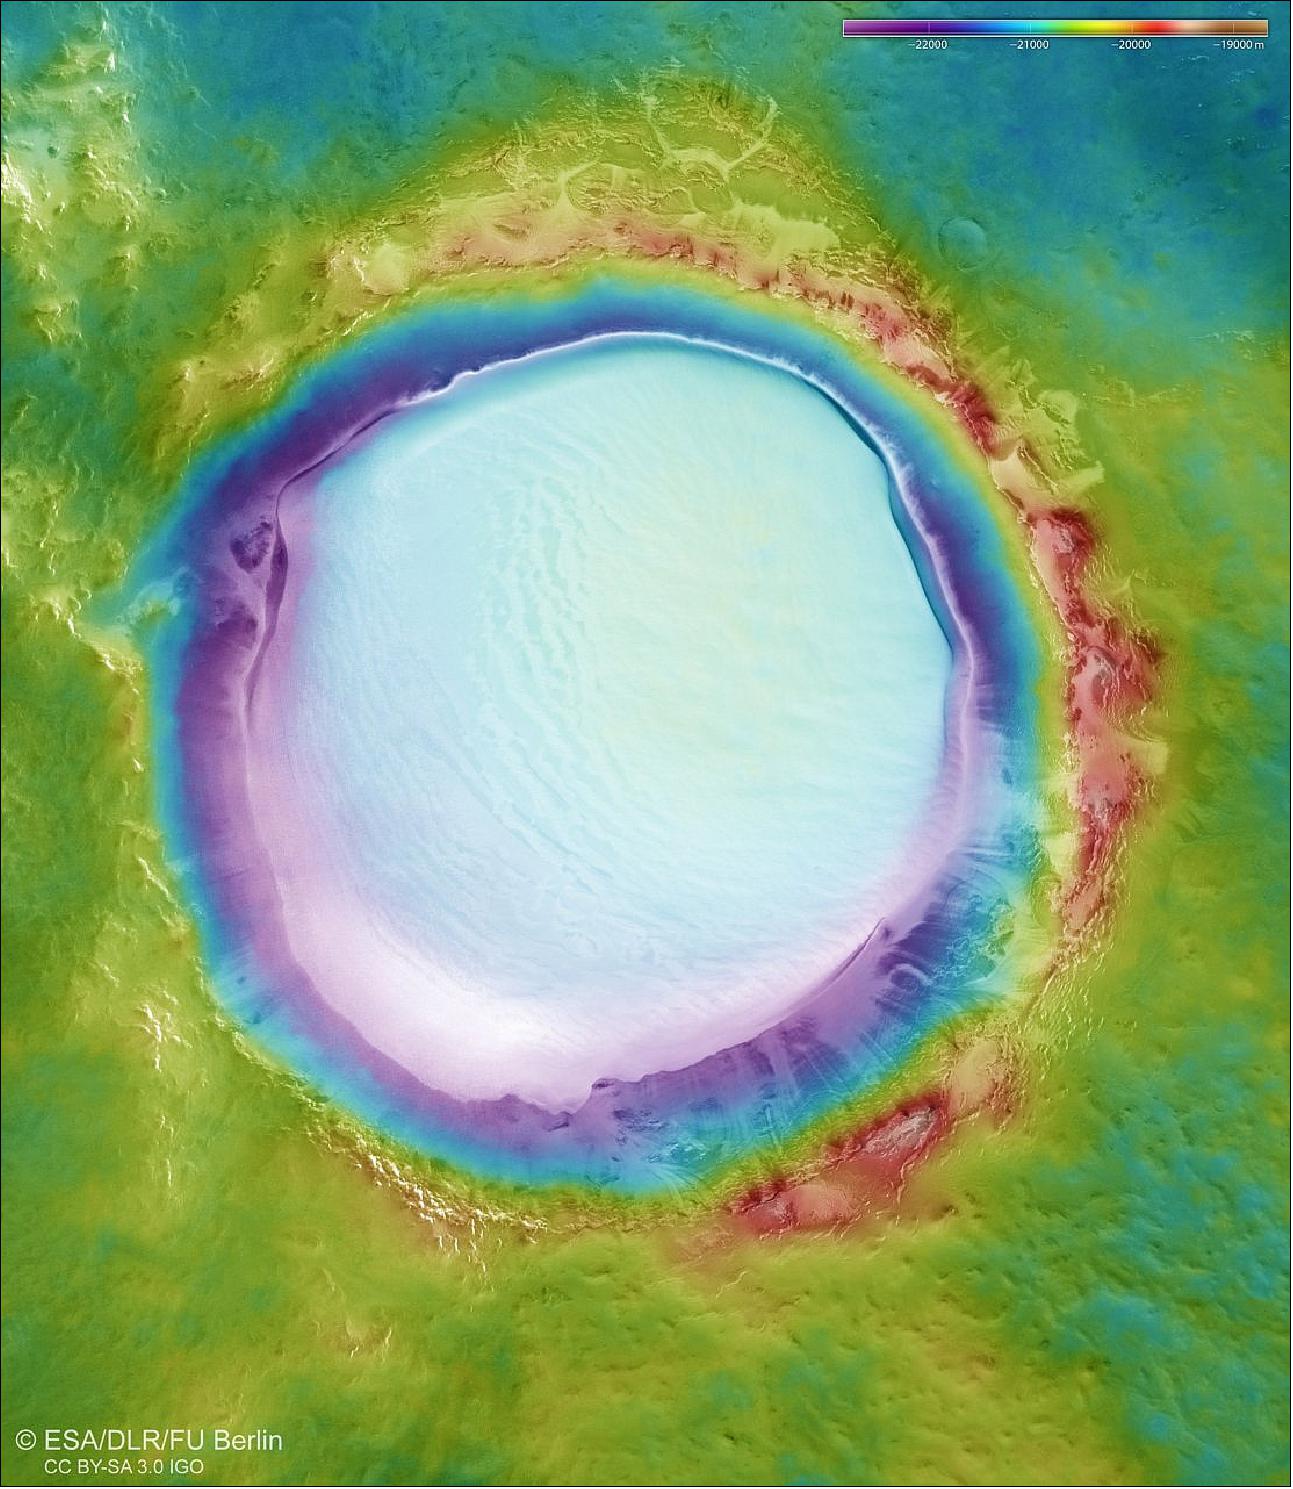
• 25 November 2018: At just before 21 hours CET (Central European Time) on 26 November, Mars will receive a new visitor: NASA’s InSight lander. InSight (Interior Exploration using Seismic Investigations, Geodesy and Heat Transport) will be the first Mars mission dedicated to studying the planet’s interior, including sensing Mars quakes. Learning about the interior of the planet will inform scientists about the early formation of the rocky planets in our own Solar System, as well as the evolution of exoplanets orbiting other stars. 25)
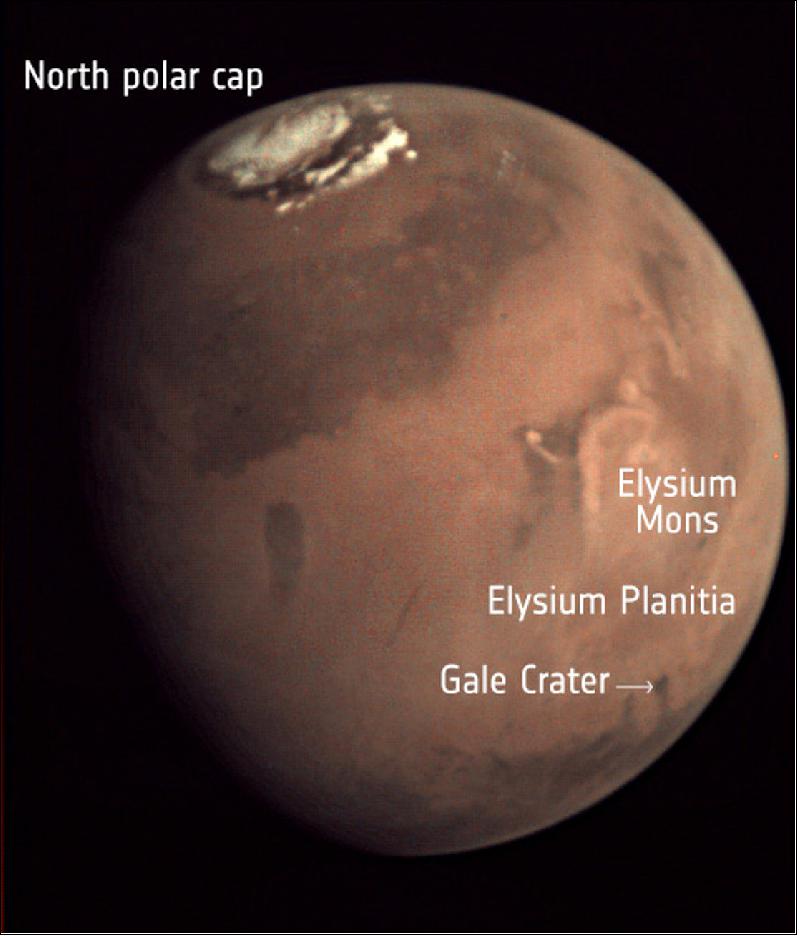
- Since InSight’s study is focused on sensing the planet’s interior, surface geology is not such an important factor in deciding the landing site as it is for other missions. Therefore, it is targeting a flat, stable surface in the Elysium Planitia region, which is captured in this wide field view from ESA’s Mars Express Visual Monitoring Camera taken on 29 February 2016.
- In the image of Figure 63, Elysium Planitia is located roughly between the dark features at the bottom right (which includes Gale Crater), and the brighter arc-shaped feature above, to the right of the center of the image, which is the location of volcano Elysium Mons. The north polar ice cap is seen at the top of the image.
- ESA has already been supporting InSight’s mission with its ground station network throughout the cruise to Mars, following the mission’s launch in May 2018. The joint ESA-Roscosmos Trace Gas Orbiter (TGO) of the ExoMars mission, which arrived at Mars in October 2016, is ready to support data relay from InSight several times per day once it has landed safely, as required. Mars Express will also be prepared to support, on NASA’s request, ad hoc relay contacts with InSight in case of emergency needs.
- TGO will also act as a data relay for the ExoMars rover mission in 2021, for which the landing site was recommended earlier this month as Oxia Planum. A region that is thought to have hosted vast volumes of water in the past, it is an ideal location to search for clues that may help reveal the presence of past life on Mars.
- NASA also just announced the landing site for its Mars 2020 rover, which is set to explore an ancient river delta in Jezero Crater. Moreover, the rover will collect rock and soil samples and store them in a cache on the planet's surface. NASA and ESA are studying future mission concepts to retrieve the samples and return them to Earth, setting the stage for the next decade of Mars exploration.
• 22 November 2018: ESA’s Mars Express has imaged an intriguing part of the Red Planet’s surface: a rocky, fragmented, furrowed escarpment lying at the boundary of the northern and southern hemisphere. 26)
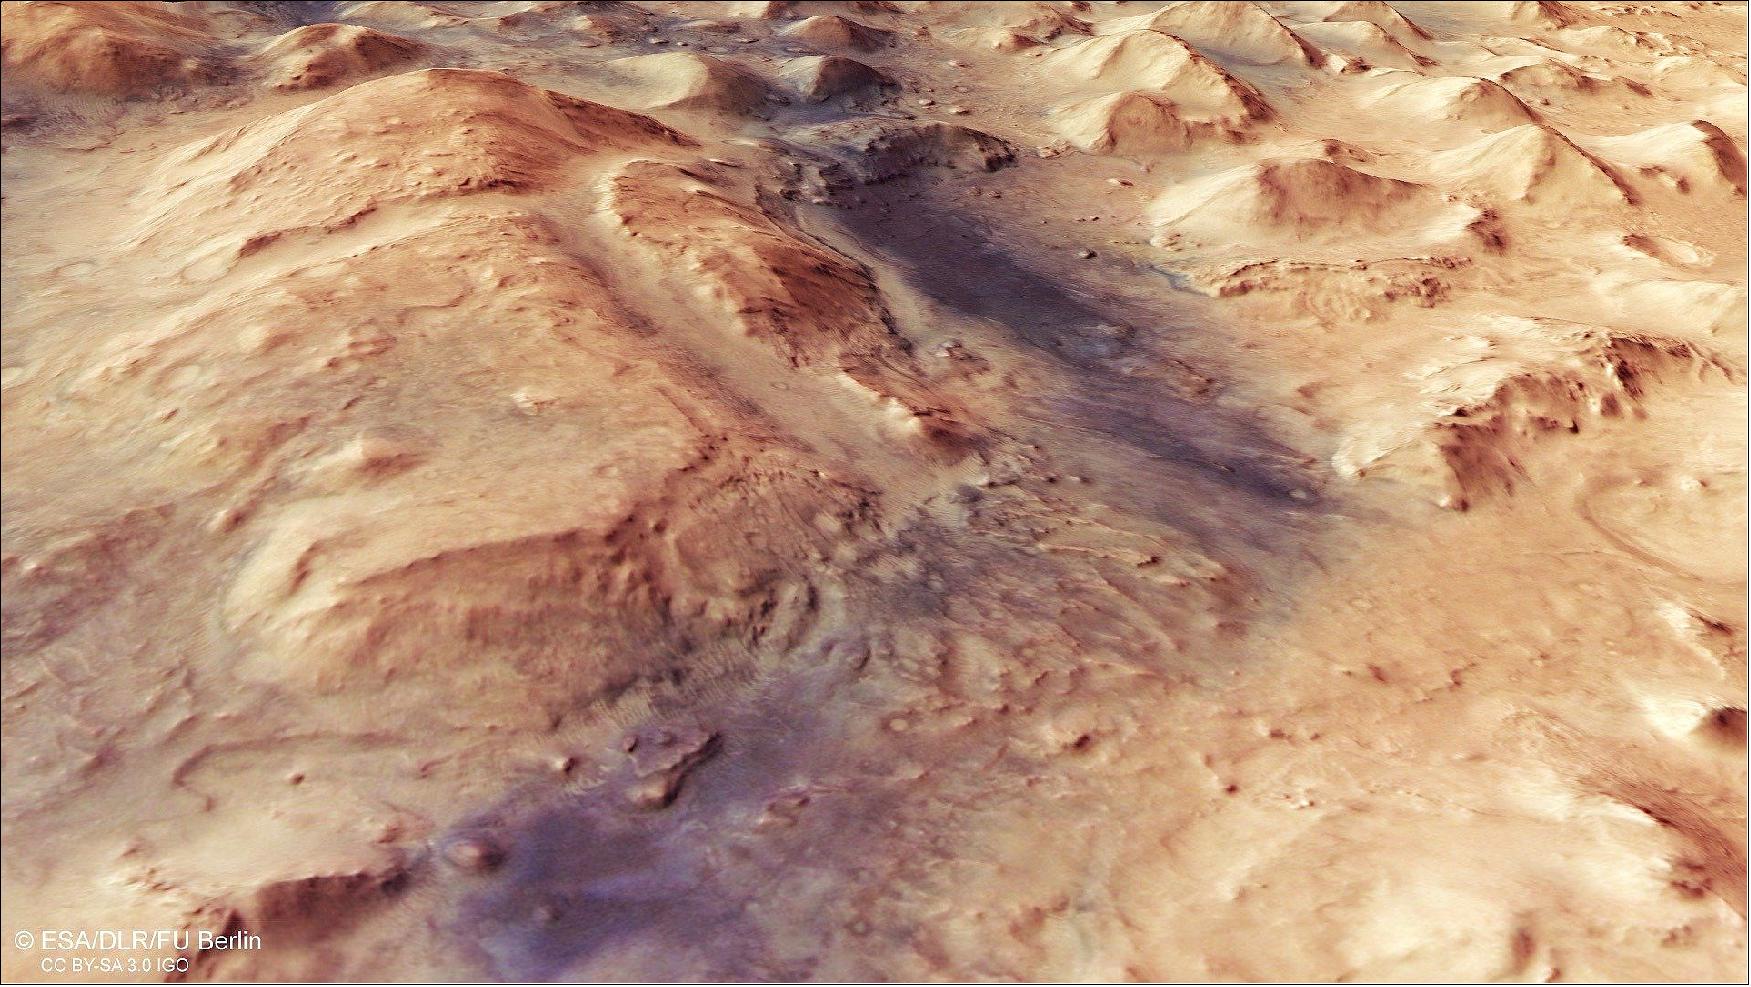
Legend to Figure 64: This oblique perspective was generated using data from ESA’s Mars Express HRSC. This scene is part of a region imaged during Mars Express orbit 17916 on 26 February 2018, with the gathered data combined to form a detailed mosaic. The image covers a part of the martian surface centered on 78°E, 28°N. This view looks across the feature from south to north.
- This region is an impressive example of past activity on the planet and shows signs of where flowing wind, water and ice once moved material from place to place, carving out distinctive patterns and landforms as it did so.
- Mars is a planet of two halves. In places, the northern hemisphere of the planet sits a full few kilometers lower than the southern; this clear topographic split is known as the martian dichotomy, and is an especially distinctive feature on the Red Planet’s surface.
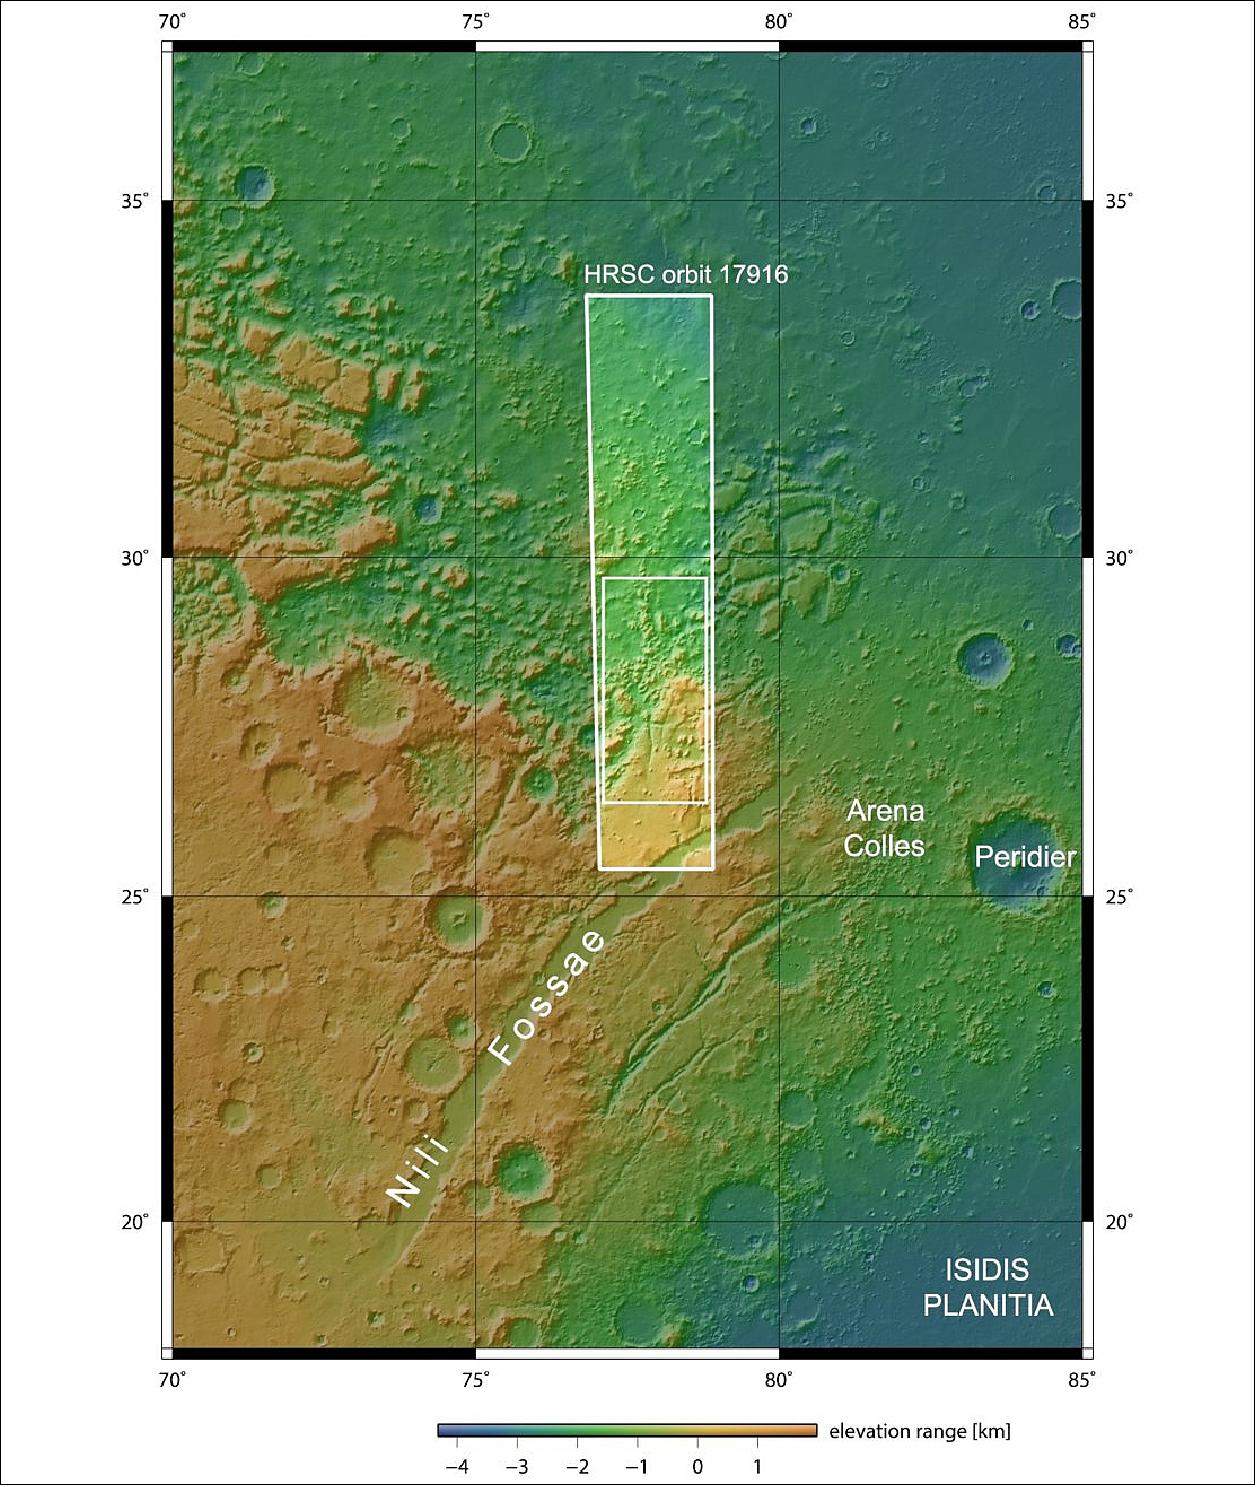
- Northern Mars also displays large areas of smooth land, whereas the planet’s southern regions are heavily pockmarked and scattered with craters. This is thought to be the result of past volcanic activity, which has resurfaced parts of Mars to create smooth plains in the north – and left other regions ancient and untouched.
- The star of this Mars Express image, a furrowed, rock-filled escarpment known as Nili Fossae, sits at the boundary of this north-south divide. This region is filled with rocky valleys, small hills, and clusters of flat-topped landforms (known as mesas in geological terms), with some chunks of crustal rock appearing to be depressed down into the surface creating a number of ditch-like features known as graben.
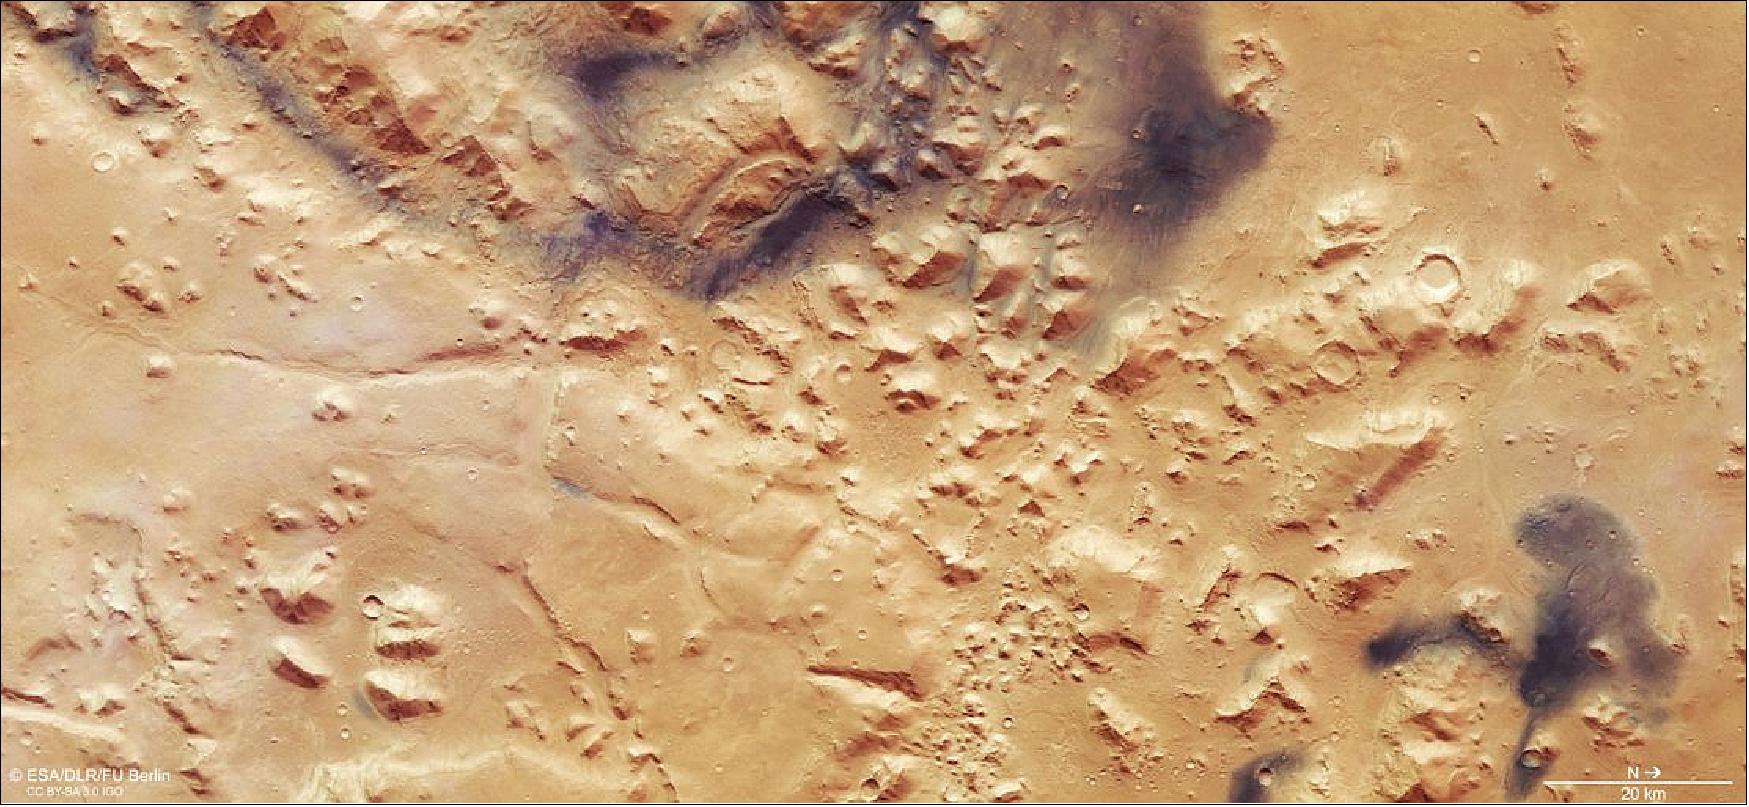
- As with much of the surrounding environment, and despite Mars’ reputation as a dry, arid world today, water is believed to have played a key role in sculpting Nili Fossae via ongoing erosion. In addition to visual cues, signs of past interaction with water have been spotted in the western (upper) part of this image – instruments such as Mars Express’ OMEGA spectrometer have spotted clay minerals here, which are key indicators that water was once present.
- The elevation of Nili Fossae and surroundings, shown in the topographic view (Figure 67), is somewhat varied; regions to the left and lower left (south) sit higher than those to the other side of the frame (north), illustrating the aforementioned dichotomy. This higher-altitude terrain appears to consist mostly of rocky plateaus, while lower terrain comprises smaller rocks, mesas, hills, and more, with the two sections roughly separated by erosion channels and valleys.
- This split is thought to be the result of material moving around on Mars hundreds of millions of years ago. Similar to glaciers on Earth, flows of water and ice cut through the martian terrain and slowly sculpted and eroded it over time, also carrying material along with them. In the case of Nili Fossae, this was carried from higher areas to lower ones, with chunks of resistant rock and hardy material remaining largely intact but shifting downslope to form the mesas and landforms seen today.
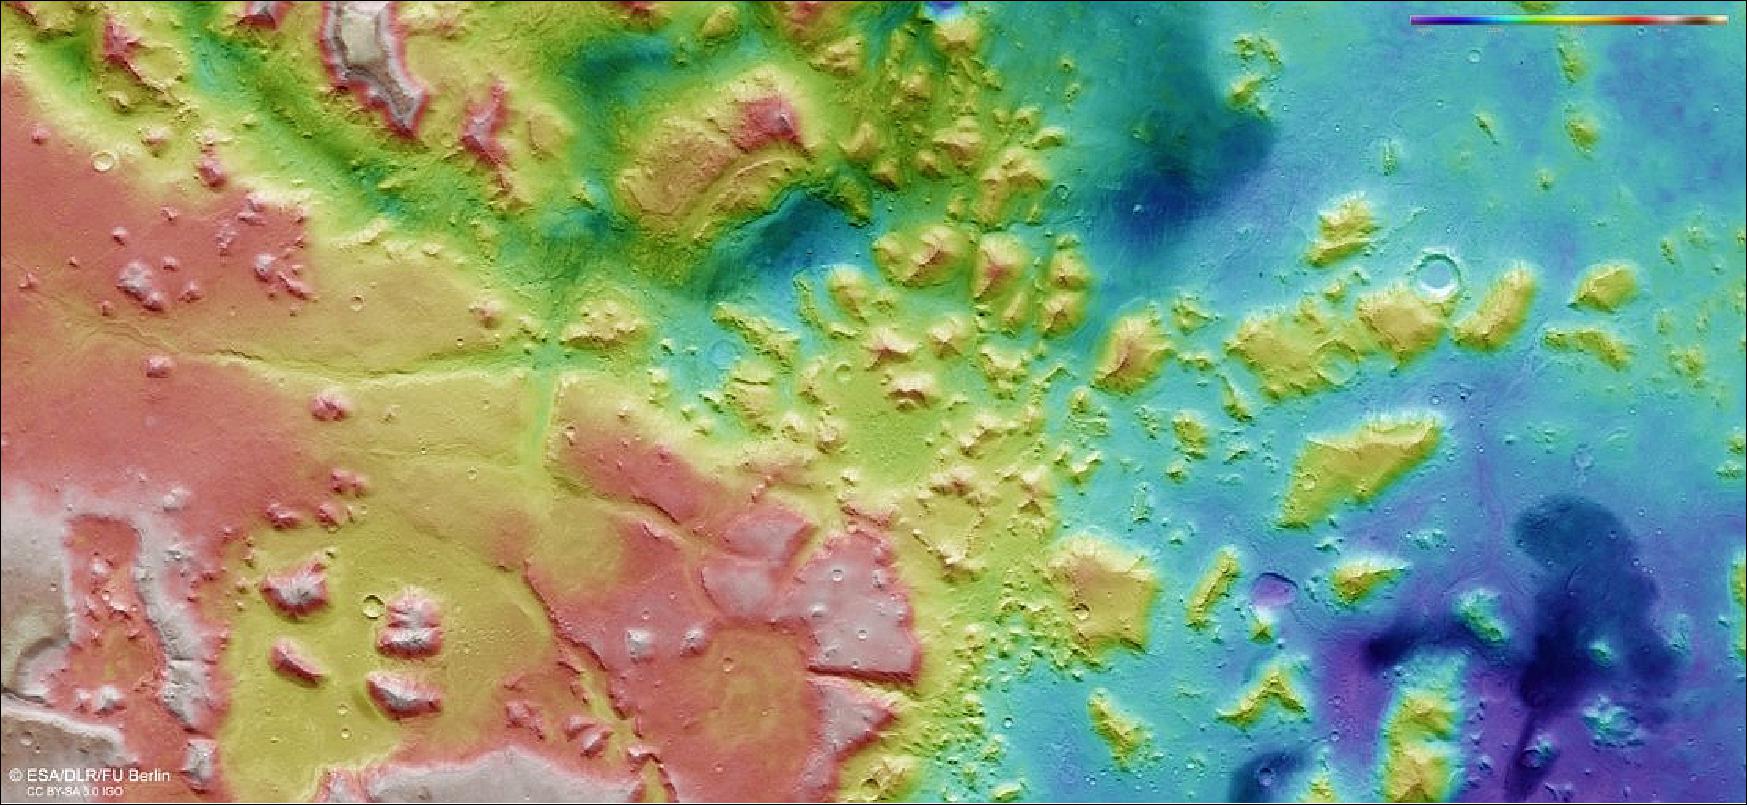
Legend to Figure 67: The color-coded topographic view is based on a digital terrain model of the region, from which the topography of the landscape can be derived. It comprises data obtained by the HRSC on ESA’s Mars Express during spacecraft orbit 17916. The ground resolution is about 18 m/pixel and the images cover a part of the martian surface centered on 78°E, 28°N. North is to the right.
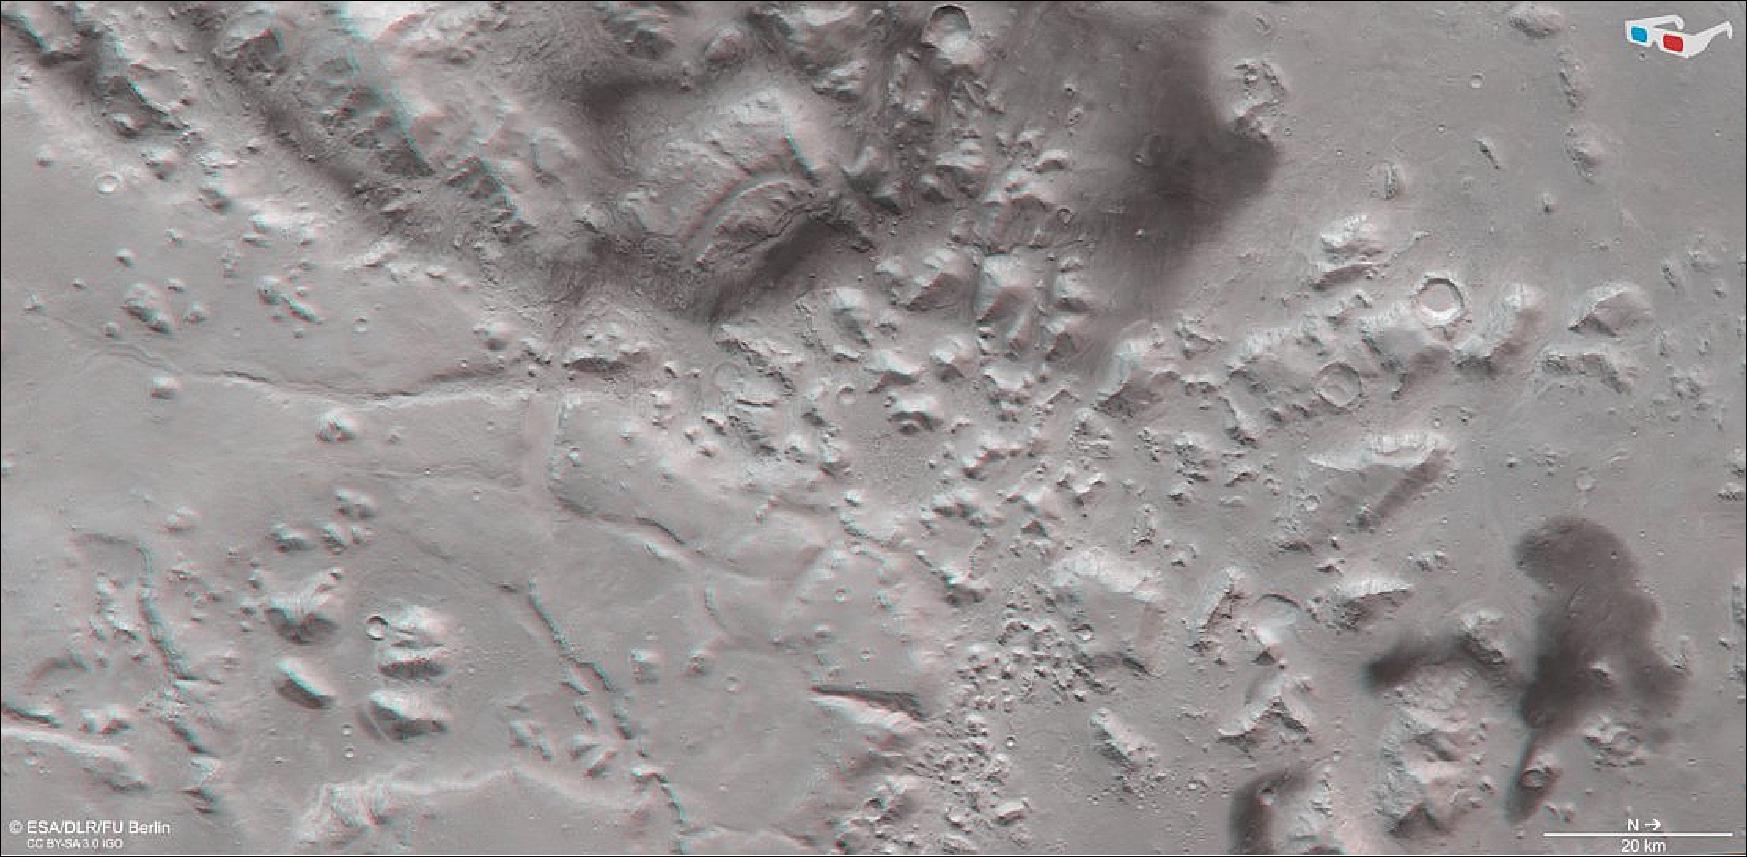
- The shapes and structures scattered throughout this image are thought to have been shaped over time by flows of not only water and ice, but also wind. Examples can be seen in this image in patches of the surface that appear to be notably dark against the ochre background, as if smudged with charcoal or ink. These are areas of darker volcanic sand, which have been transported and deposited by present-day martian winds. Wind moves sand and dust around often on Mars’ surface, creating rippling dune fields across the planet and forming multi-colored, patchy terrain like Nili Fossae.
- ESA’s Mars Express was launched in 2003. As well as producing striking views of the martian surface such as this, the mission has shed light on many of the planet’s biggest mysteries – and helped to build the picture of Mars as a planet that was once warmer, wetter and potentially habitable.
Extended life for ESA's science missions (Ref. 27)
• November 14, 2018: The SPC (Science Program Committee) of ESA has confirmed the continued operations of ten scientific missions in the Agency's fleet up to 2022. After a comprehensive review of their scientific merits and technical status, the SPC has decided to extend the operation of the five missions led by ESA's Science Program: Cluster, Gaia, INTEGRAL, Mars Express, and XMM-Newton. The SPC also confirmed the Agency's contributions to the extended operations of Hinode, Hubble, IRIS, SOHO, and ExoMars TGO. 27)
- This includes the confirmation of operations for the 2019–2020 cycle for missions that had been given indicative extensions as part of the previous extension process, and indicative extensions for an additional two years, up to 2022.
Note: Every two years, all missions whose approved operations end within the following four years are subject to review by the advisory structure of the Science Directorate. Extensions are granted to missions that satisfy the established criteria for operational status and science return, subject to the level of financial resources available in the science program. These extensions are valid for the following four years, subject to a mid-term review and confirmation after two years.
- The decision was taken during the SPC meeting at ESA/ESAC (European Space Astronomy Center) near Madrid, Spain, on 14 November.
- ESA's science missions have unique capabilities and are prolific in their scientific output. Cluster, for example, is the only mission that, by varying the separation between its four spacecraft, allows multipoint measurements of the magnetosphere in different regions and at different scales, while Gaia is performing the most precise astrometric survey ever realized, enabling unprecedented studies of the distribution and motions of stars in the Milky Way and beyond.
- Many of the science missions are proving to be of great value to pursue investigations that were not foreseen at the time of their launch. Examples include the role of INTEGRAL and XMM-Newton in the follow-up of recent gravitational wave detections, paving the way for the future of multi-messenger astronomy, and the many discoveries of diverse exoplanets by Hubble.
- Collaboration between missions, including those led by partner agencies, is also of great importance. The interplay between solar missions like Hinode, IRIS and SOHO provides an extensive suite of complementary instruments to study our Sun; meanwhile, Mars Express and ExoMars TGO are at the forefront of the international fleet investigating the Red Planet.
- Another compelling factor to support the extension is the introduction of new modes of operation to accommodate the evolving needs of the scientific community, as well as new opportunities for scientists to get involved with the missions.
• 26 October 2018: The surface of Mars may appear to be perpetually still, but its many features are ever-changing – as represented in this Mars Express view of the severely eroded Greeley impact crater. 28)
- Greeley crater, named for the renowned planetary scientist Ronald Greeley, is located in one of the most ancient parts of Mars: a section of the planet’s southern highlands named Noachis Terra.
- This region is thought to be some four billion years old, and is thus home to many features that formed in the very earliest days of the Solar System. Many craters have formed, changed, and eroded away in Noachis Terra, and Greeley crater is no exception.
- The subject of these Mars Express images sits between two huge, deep impact basin plains, Argyre and Hellas, and is a great example of a very old crater that has endured significant erosion over time.
- Wind, water, ice, and subsequent impacts have all played a part in wearing down the once-fresh structure of the crater. They have smoothed away and removed its walls and rims, erased any characteristic patterns in the nearby landscape that may have formed alongside the crater (such as ‘ejecta’, or rays of material flung out from an impact site), and infilled and flattened out its floor.
- This floor is covered with a number of smaller impact pits and pockmarks that have occurred since Greeley crater’s formation – another clear indication of the crater’s immense age. With a depth of only 1.5 km Greeley crater is actually relatively shallow for a martian crater, making it somewhat difficult to pick out from the surrounding terrain.
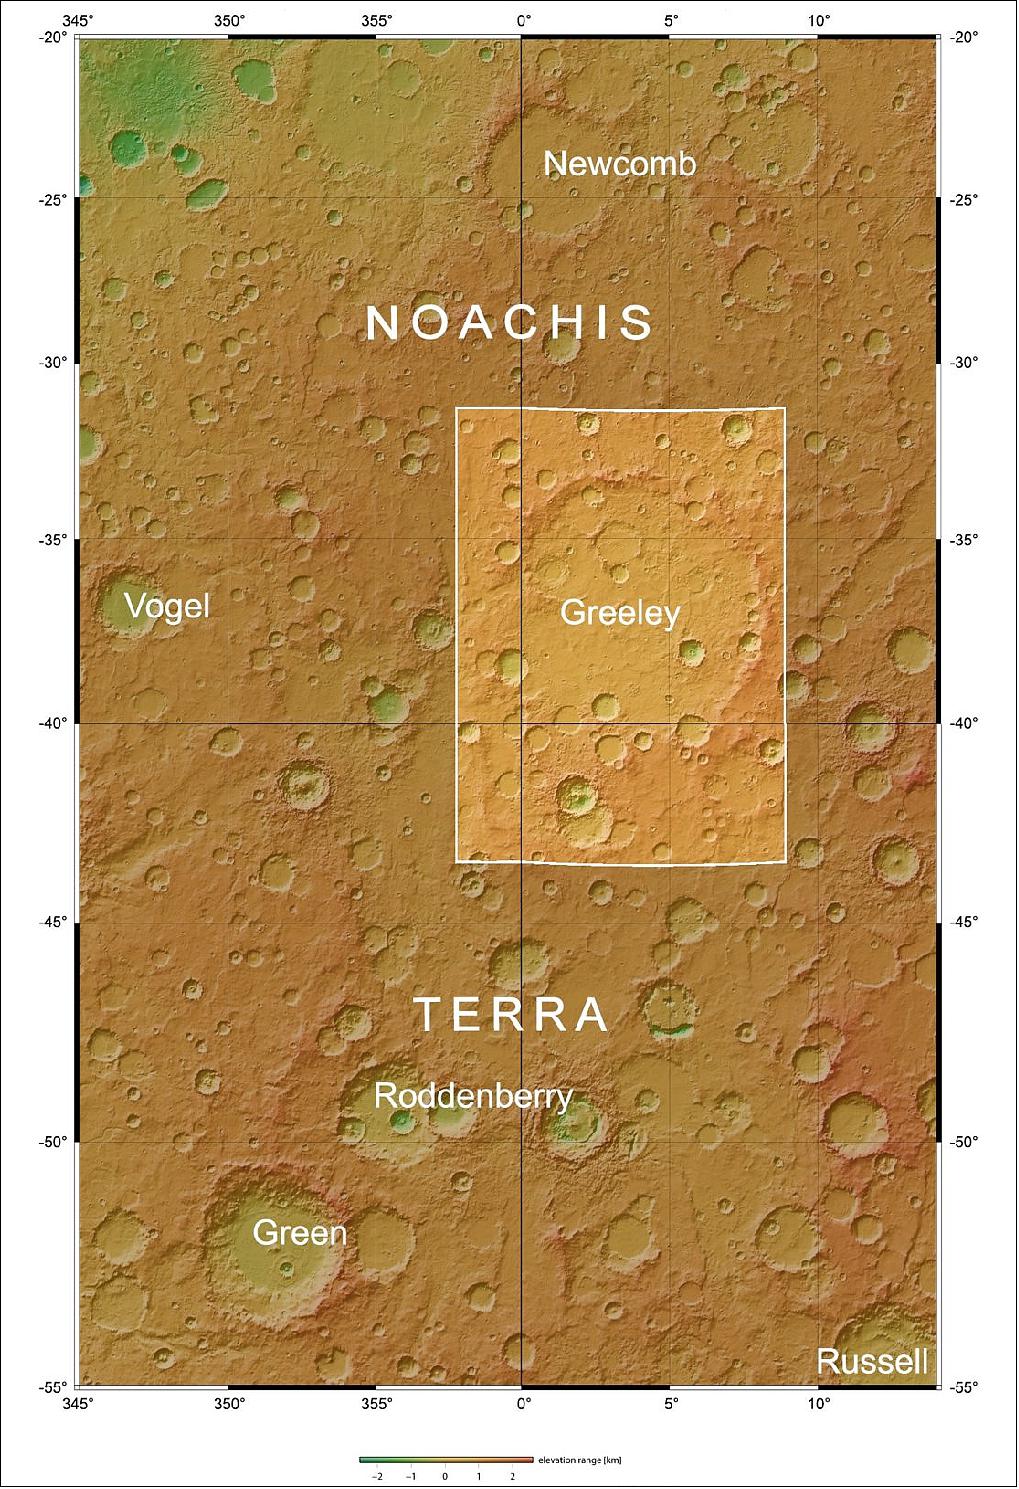
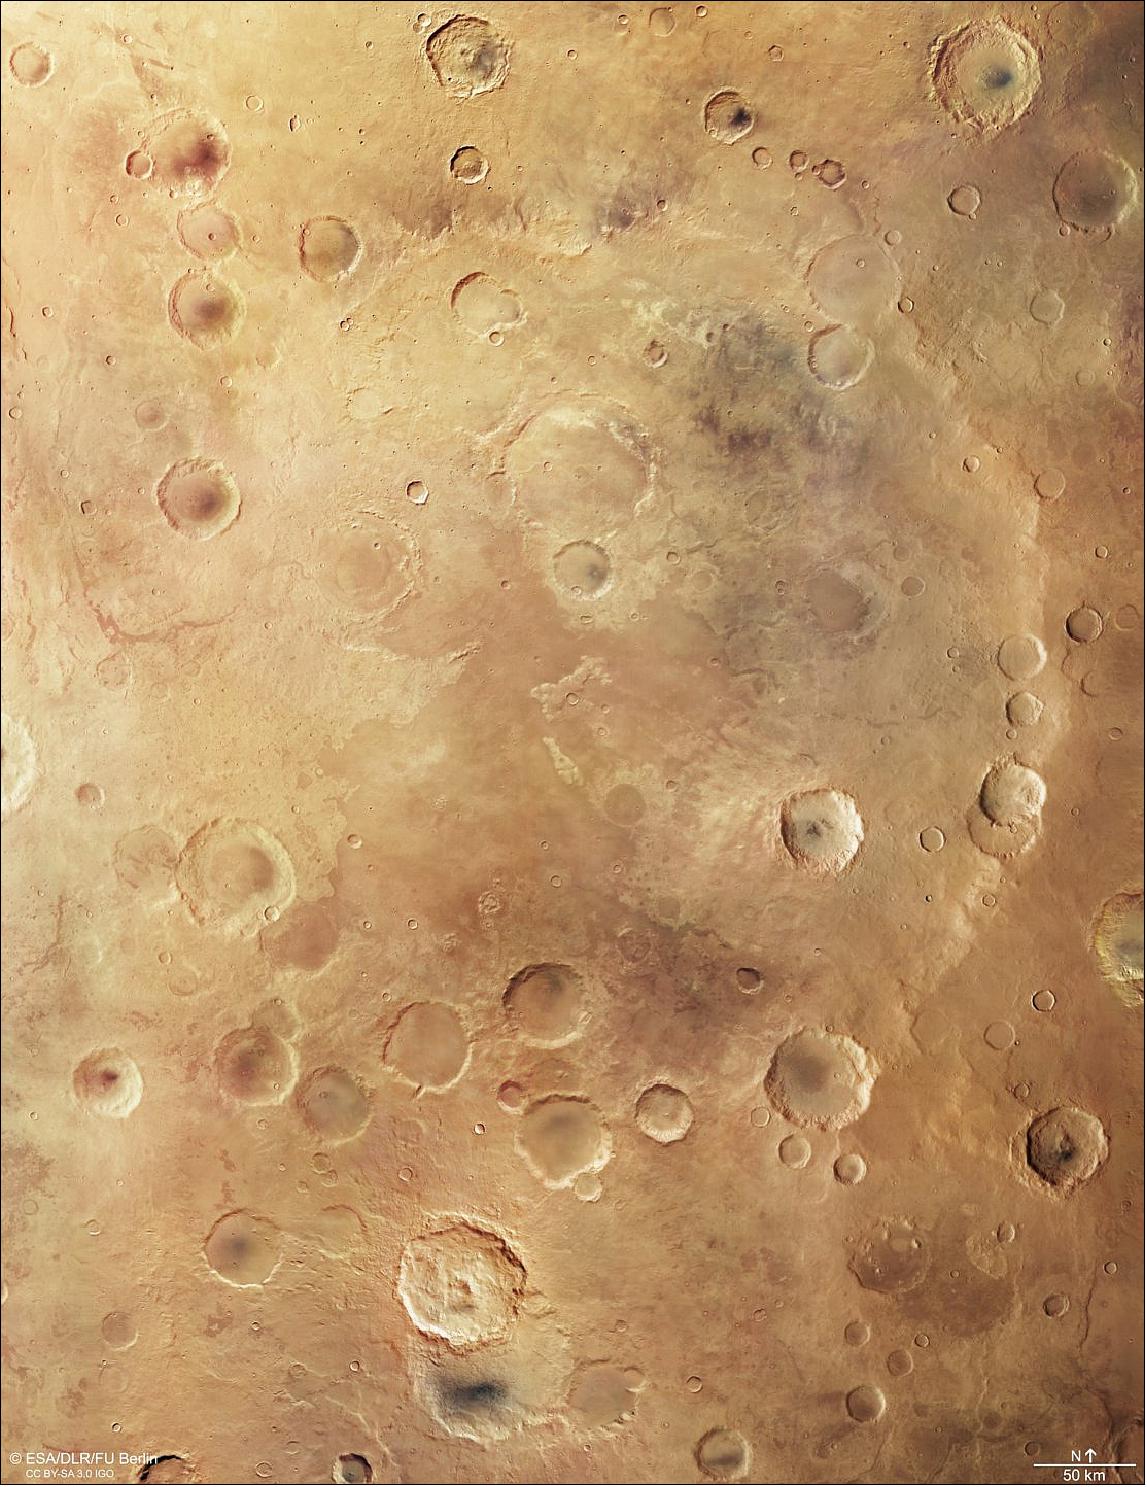
Legend to Figure 70: This plan view is a mosaic of data acquired by the High Resolution Stereo Camera on Mars Express over 16 of the spacecraft’s orbits (0430, 1910, 1932, 2412, 2467, 2478, 4306, 4317, 4328, 6556, 8613, 8620, 8708, 12835, 14719, 16778). The ground resolution is about 100 m/pixel and the images cover a part of the martian surface ranging from 2°W to 9°E / 31.5° to 43.5°S. North is up.
- Accompanying views of the crater show it in a wider context on Mars, color-coded by topography – highlighting the relative depths of the crater, its broken-down wall, smaller superimposed craters, and other features throughout the region – and also via an oblique perspective, which looks across the crater towards the south-west. Together, these images well-characterize the crater and its environment, and offer an intriguing insight into this ancient region on our planetary neighbor.
- Greeley crater earned its moniker following a proposal by the International Astronomical Union in 2015 to name the crater after distinguished planetary scientist Ronald Greeley. Greeley passed away on 27 October 2011. Ronald Greeley's passion was Mars science. Not only was he a co-investigator for the Mars Express HRSC, but he was also involved in other Mars missions, such as Mariner, Viking, Pathfinder, Mars Global Surveyor and the Mars Exploration Rovers Spirit and Opportunity. His career in planetary research began in 1967 at NASA AMES Research Center, where he studied volcanic landforms and lava tubes on Earth and the Moon. He later worked with planetary mission data acquired by Galileo for Jupiter, Magellan for Venus, and Voyager 2 for Uranus and Neptune. He was also interested in surface features and processes that occur due to the effects of wind on other planets. In 1977 he became Professor of the School of Earth and Space Exploration at Arizona State University, where he created the Planetary Aeolian Laboratory, which is still running to this day.
- Alongside significant work in planetary science spanning not only Mars and related missions but also lunar research and missions to Venus, Jupiter, Uranus, and Neptune, Greeley was a Regents’ Professor of planetary geology at Arizona State University from 1977 to 2011, and co-investigator of the Mars Express High Resolution Stereo Camera (HRSC) – the instrument that gathered the data used in these images.
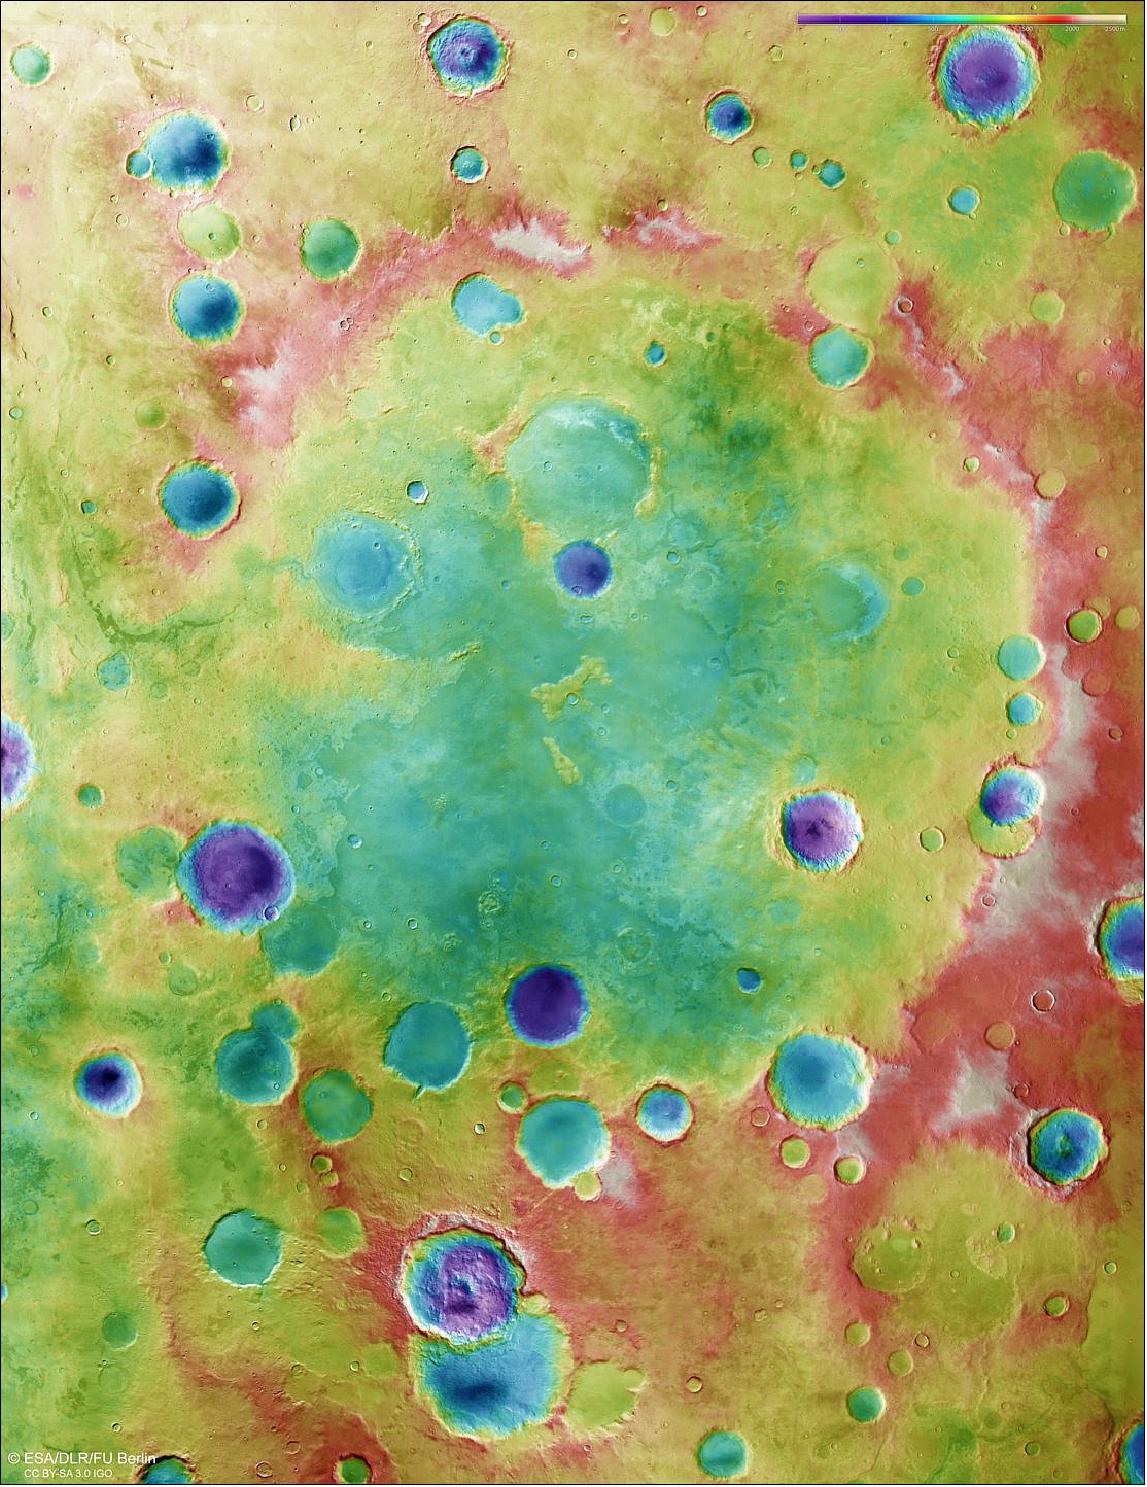
Legend to Figure 71: This colored topographic view comprises data obtained by the High Resolution Stereo Camera on Mars Express over 16 of the spacecraft’s orbits (0430, 1910, 1932, 2412, 2467, 2478, 4306, 4317, 4328, 6556, 8613, 8620, 8708, 12835, 14719, 16778). The ground resolution is about 100 m/pixel and the images cover a part of the martian surface ranging from 2°W to 9°E / 31.5° to 43.5°S. North is up.
• 25 October 2018: Since 13 September, ESA's Mars Express has been observing the evolution of an elongated cloud formation hovering in the vicinity of the 20 km-high Arsia Mons volcano, close to the planet's equator. 32)
- In spite of its location, this atmospheric feature is not linked to volcanic activity but is rather a water ice cloud driven by the influence of the volcano's leeward slope on the air flow – something that scientists call an orographic or lee cloud – and a regular phenomenon in this region.
- The cloud can be seen in this view taken on 10 October by the Visual Monitoring Camera (VMC) on Mars Express – which has imaged it hundreds of times over the past few weeks – as the white, elongated feature extending 1500 km westward of Arsia Mons. As a comparison, the cone-shaped volcano has a diameter of about 250 km.
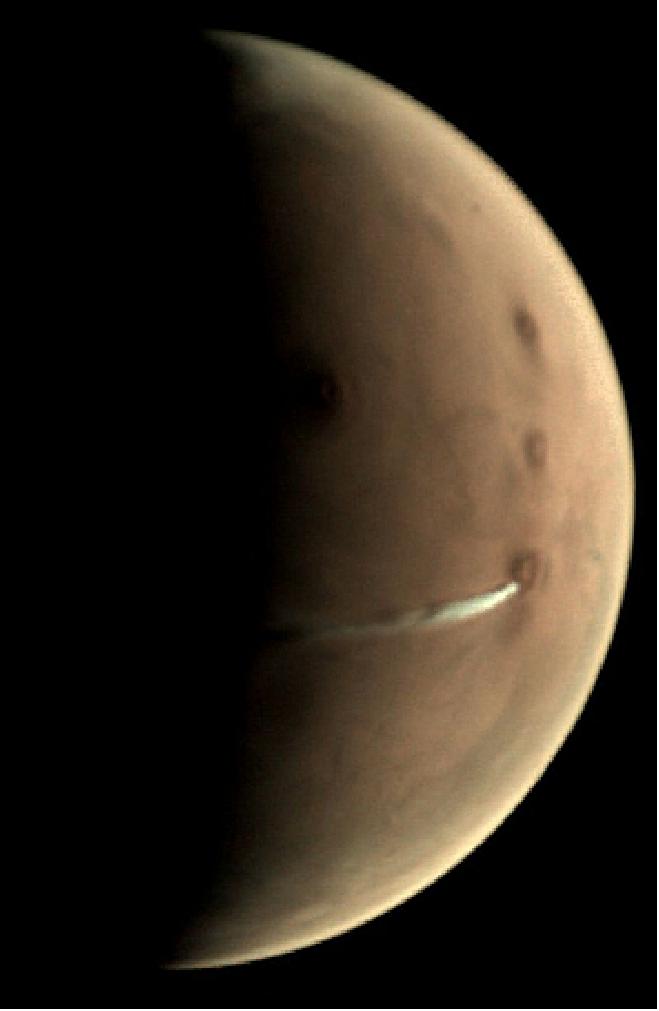
- Mars just experienced its northern hemisphere winter solstice on 16 October. In the months leading up to the solstice, most cloud activity disappears over big volcanoes like Arsia Mons; its summit is covered with clouds throughout the rest of the martian year.
- However, a seasonally recurrent water ice cloud, like the one shown in this image, is known to form along the southwest flank of this volcano – it was previously observed by Mars Express and other missions in 2009, 2012 and 2015.
- The cloud's appearance varies throughout the martian day, growing in length during local morning downwind of the volcano, almost parallel to the equator, and reaching such an impressive size that could make it visible even to telescopes on Earth.
- The formation of water ice clouds is sensitive to the amount of dust present in the atmosphere. These images, obtained after the major dust storm that engulfed the entire planet in June and July, will provide important information on the effect of dust on the cloud development and on its variability throughout the year.
- The elongated cloud hovering near Arsia Mons this year was also observed with the visible and near-infrared mapping spectrometer, OMEGA, and the High Resolution Stereo Camera (HRSC) on Mars Express, providing scientists with a variety of different data to study this phenomenon.
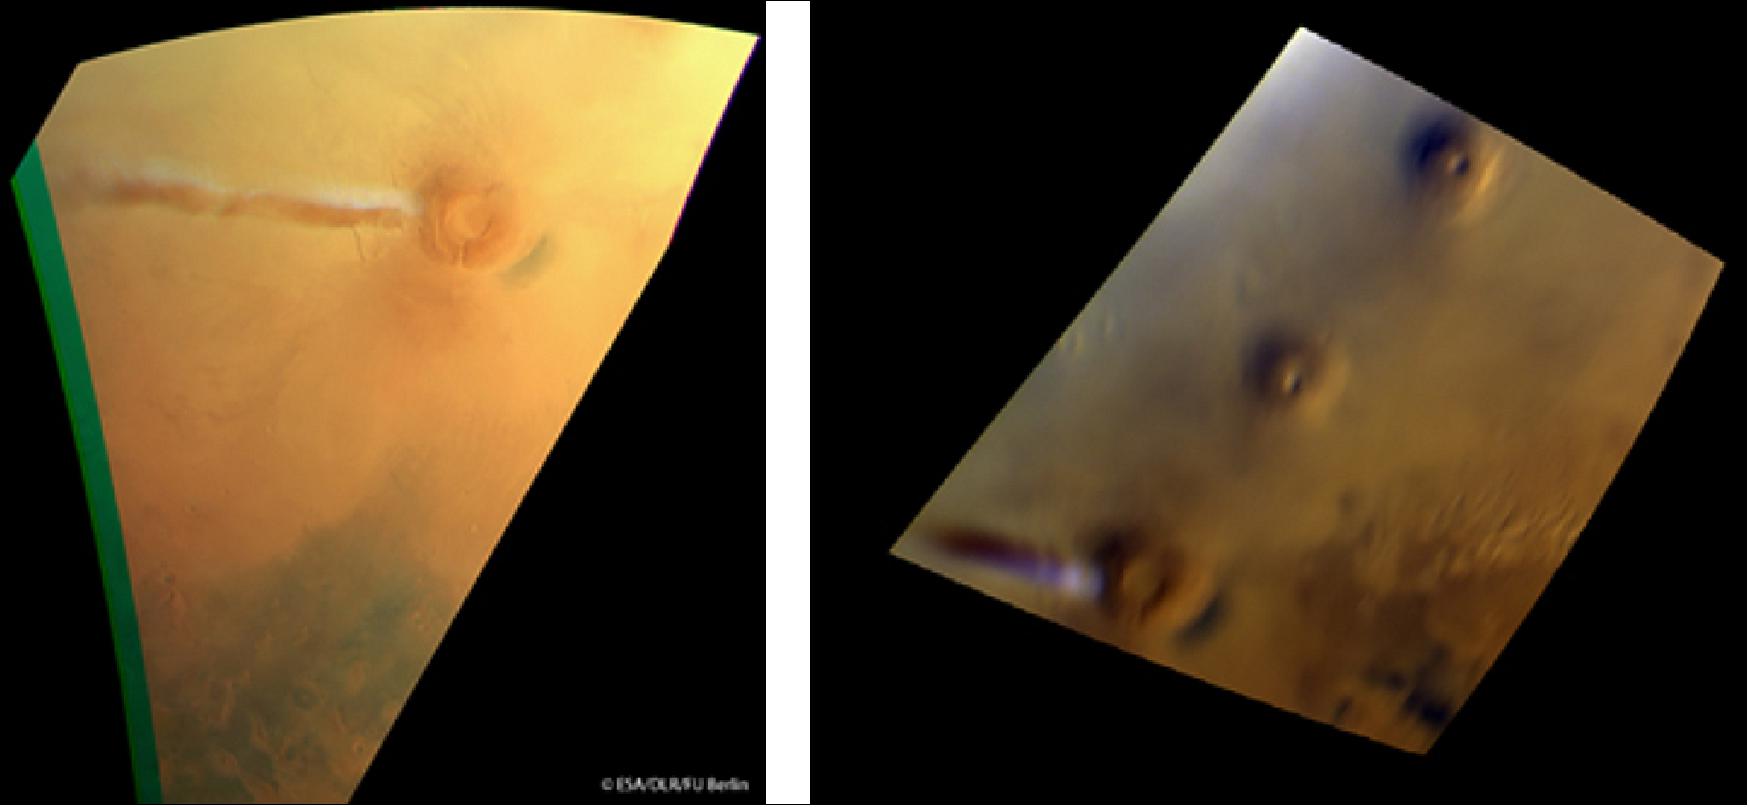
• 25 July 2018: Radar data collected by ESA's Mars Express point to a pond of liquid water buried under layers of ice and dust in the south polar region of Mars. 33)
- Evidence for the Red Planet's watery past is prevalent across its surface in the form of vast dried-out river valley networks and gigantic outflow channels clearly imaged by orbiting spacecraft. Orbiters, together with landers and rovers exploring the martian surface, also discovered minerals that can only form in the presence of liquid water.
- But the climate has changed significantly over the course of the planet's 4.6 billion year history and liquid water cannot exist on the surface today, so scientists are looking underground. Early results from the 15-year old Mars Express spacecraft already found that water-ice exists at the planet's poles and is also buried in layers interspersed with dust.
- The presence of liquid water at the base of the polar ice caps has long been suspected; after all, from studies on Earth, it is well known that the melting point of water decreases under the pressure of an overlying glacier. Moreover, the presence of salts on Mars could further reduce the melting point of water and keep the water liquid even at below-freezing temperatures.
- But until now evidence from the MARSIS (Mars Advanced Radar for Subsurface and Ionosphere Sounding) instrument the first radar sounder ever to orbit another planet, remained inconclusive.
- It has taken the persistence of scientists working with this subsurface-probing instrument to develop new techniques in order to collect as much high-resolution data as possible to confirm their exciting conclusion.
- Ground-penetrating radar uses the method of sending radar pulses towards the surface and timing how long it takes for them to be reflected back to the spacecraft, and with what strength. The properties of the material that lies between influences the returned signal, which can be used to map the subsurface topography.
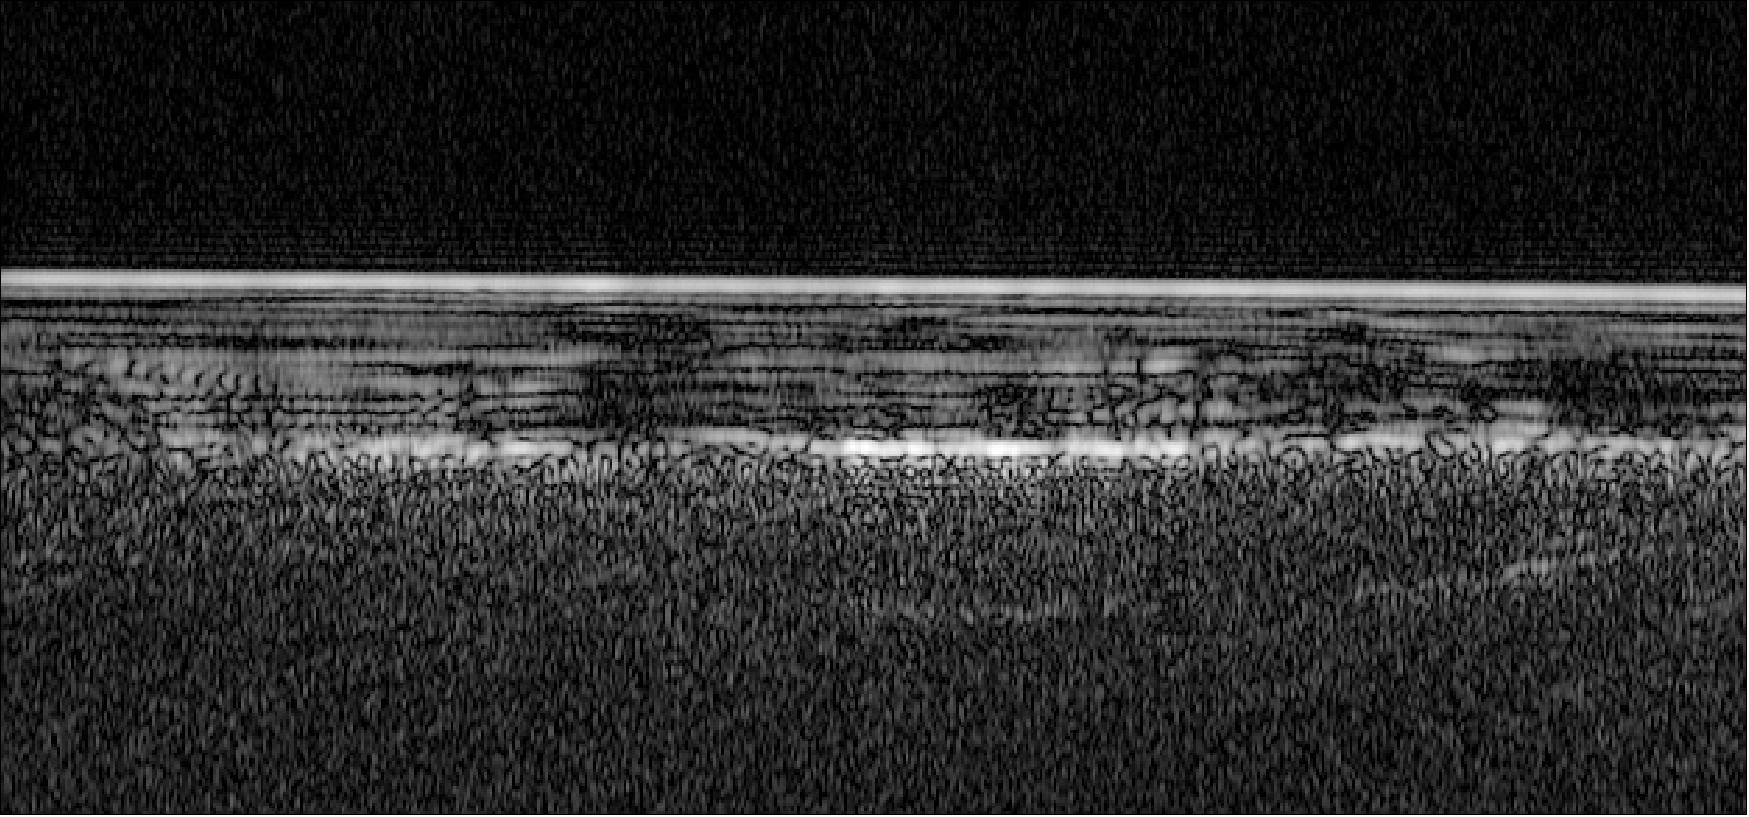
- The radar investigation shows that south polar region of Mars is made of many layers of ice and dust down to a depth of about 1.5 km in the 200 km-wide area analyzed in this study. A particularly bright radar reflection underneath the layered deposits is identified within a 20 km-wide zone.
- Analyzing the properties of the reflected radar signals and considering the composition of the layered deposits and expected temperature profile below the surface, the scientists interpret the bright feature as an interface between the ice and a stable body of liquid water, which could be laden with salty, saturated sediments. For MARSIS to be able to detect such a patch of water, it would need to be at least several tens of centimeters thick.
- "This subsurface anomaly on Mars has radar properties matching water or water-rich sediments," says Roberto Orosei, principal investigator of the MARSIS experiment and lead author of the paper published in the journal Science today. ”This is just one small study area; it is an exciting prospect to think there could be more of these underground pockets of water elsewhere, yet to be discovered." 34)
- "We'd seen hints of interesting subsurface features for years but we couldn't reproduce the result from orbit to orbit, because the sampling rates and resolution of our data was previously too low," adds Andrea Cicchetti, MARSIS operations manager and a co-author on the new paper. "We had to come up with a new operating mode to bypass some onboard processing and trigger a higher sampling rate and thus improve the resolution of the footprint of our dataset: now we see things that simply were not possible before."
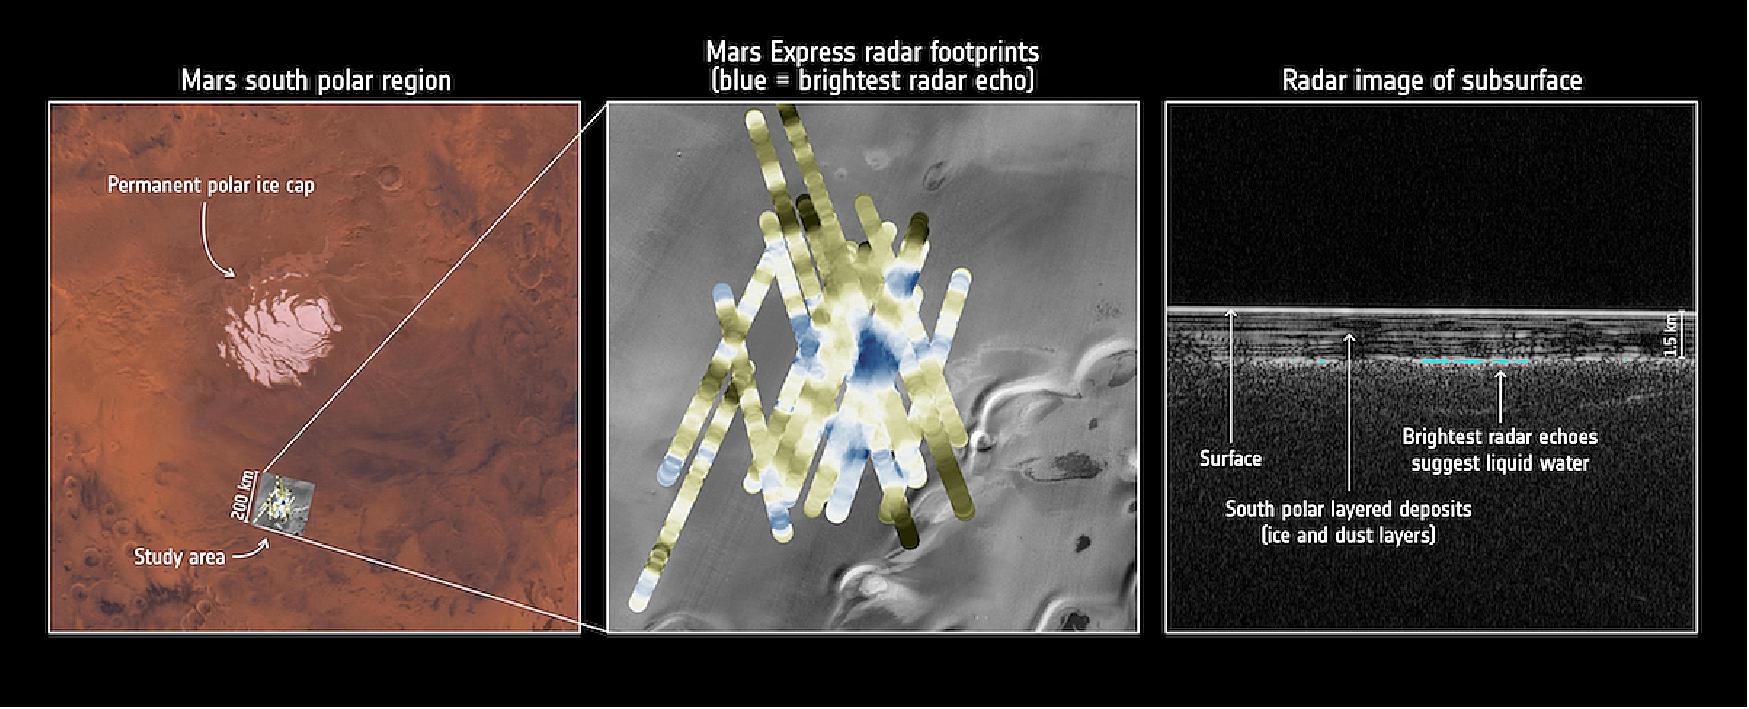
- The finding is somewhat reminiscent of Lake Vostok, discovered some 4 km below the ice in Antarctica on Earth. Some forms of microbial life are known to thrive in Earth's subglacial environments, but could underground pockets of salty, sediment-rich liquid water on Mars also provide a suitable habitat, either now or in the past? Whether life has ever existed on Mars remains an open question, and is one that Mars missions, including the current European-Russian ExoMars orbiter and future rover, will continue to explore.
- "The long duration of Mars Express, and the exhausting effort made by the radar team to overcome many analytical challenges, enabled this much-awaited result, demonstrating that the mission and its payload still have a great science potential," says Dmitri Titov, ESA's Mars Express project scientist. "This thrilling discovery is a highlight for planetary science and will contribute to our understanding of the evolution of Mars, the history of water on our neighbor planet and its habitability."
• 1 June 2018: Fifteen years ago, ESA’s Mars Express was launched to investigate the Red Planet. To mark this milestone comes a striking view of Mars from horizon to horizon, showcasing one of the most intriguing parts of the martian surface. 35)
- On 2 June 2003, the Mars Express spacecraft lifted off from Baikonur, Kazakhstan, on a journey to explore our red-hued neighboring planet. In the 15 years since, it has become one of the most successful missions ever sent to Mars, as demonstrated by this image of the region known as the Tharsis province, shown here in its full glory.
- Mammoth volcanoes, sweeping canyons, fractured ground: Tharsis is one of the most geologically interesting and oft-explored parts of the planet’s surface. Once an incredibly active region, displaying both volcanism and the shifting crustal plates of tectonics, it hosts most of the planet’s colossal volcanoes – the largest in the Solar System.

Legend to Figure 76: It sweeps from the planet’s upper horizon — marked by the faint blue haze at the top of the frame — down across a web of pale fissures named Noctis Labyrinthus (a part of Valles Marineris stretching to the upper left corner of the image), Ascraeus and Pavonis Mons (two of Tharsis’ four great volcanoes at more than 20 km high), and finishes at the planet’s northern polar ice cap (in this perspective, North is to the lower left).
- Sitting near Mars’ equator, Tharsis covers roughly a quarter of the martian surface and is thought to have a played an important role in the planet’s history. It straddles the boundary between Mars’ southern highlands and northern lowlands.
- Elevation on Mars is defined relative to where the gravity is the same as the average at the martian equator. This serves as a type of ‘sea-level’, even though there are no seas.
- Most of Tharsis is higher than average, at between 2 and 10 km high. The province likely formed as mushroom-shaped plumes of molten rock (magma) swelled up beneath the viscous surface over time, creating seeping flows, magma chambers, and large, rocky provinces – like Tharsis – and feeding ongoing volcanism from below.
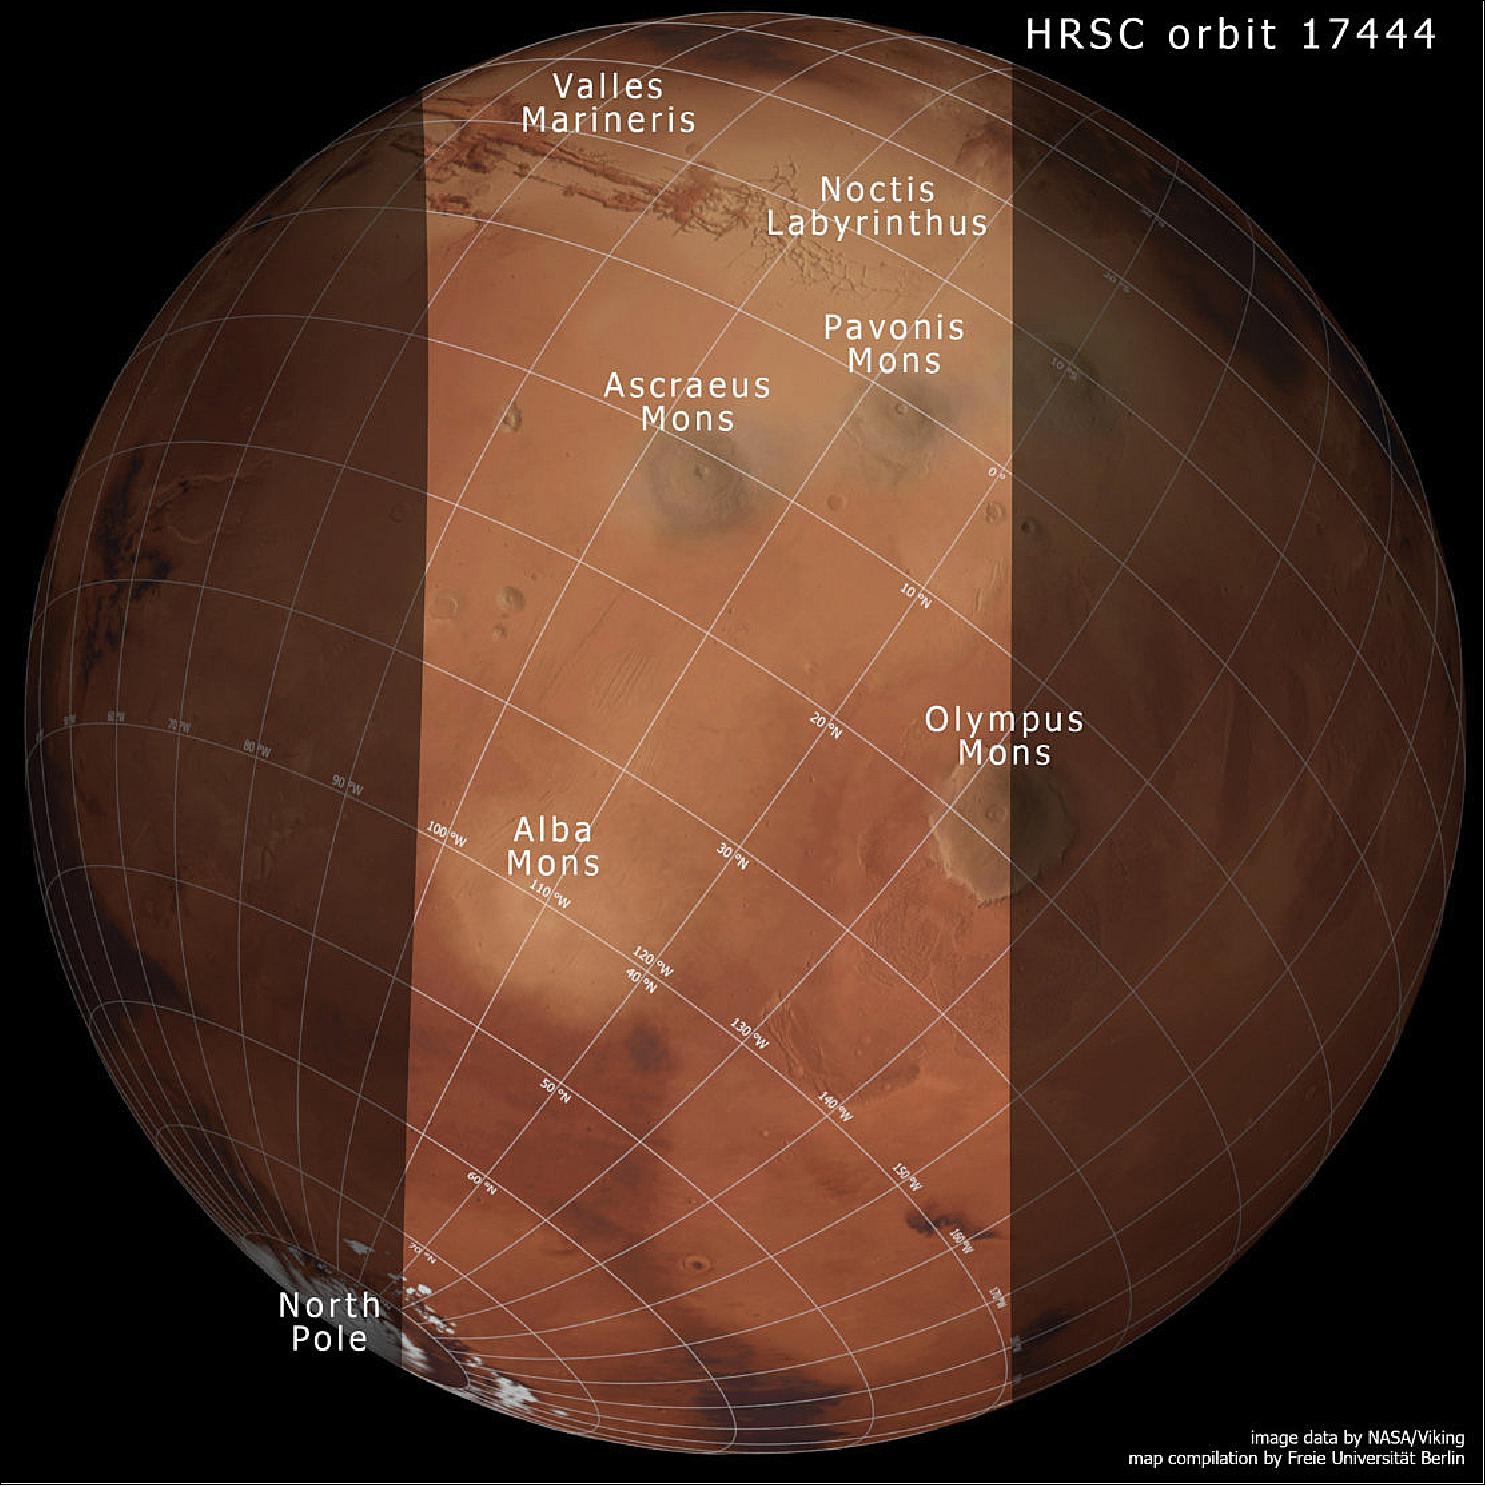
- Tharsis is also connected to the formation of the famous Valles Marineris, which is some four times longer and deeper than the Great Canyon in Arizona, USA, and the most extensive canyon system discovered in the Solar System. This is partly visible as the dark tendrils to the upper left of the image.
- As magma swelled up beneath the crust to create the Tharsis province, the tension caused some areas to rupture and fracture. Molten rock then flooded these fractures and destabilized and separated regions of the crust yet further, resulting in both the wide, substantial troughs and fissures that comprise modern-day Valles Marineris, and the web-like Noctis Labyrinthus that sits at the canyon system’s western end.
- Captured in the new view are volcanoes Pavonis Mons (top right), Ascraeus Mons (just below), Alba Mons (to the bottom left), and a small sliver of Olympus Mons (to the lower right, continuing out of frame) in caramel hues; a view of the region with labels is provided here. The location of this slice of Mars’ surface is also shown in a context map of the planet and in a topographic context.
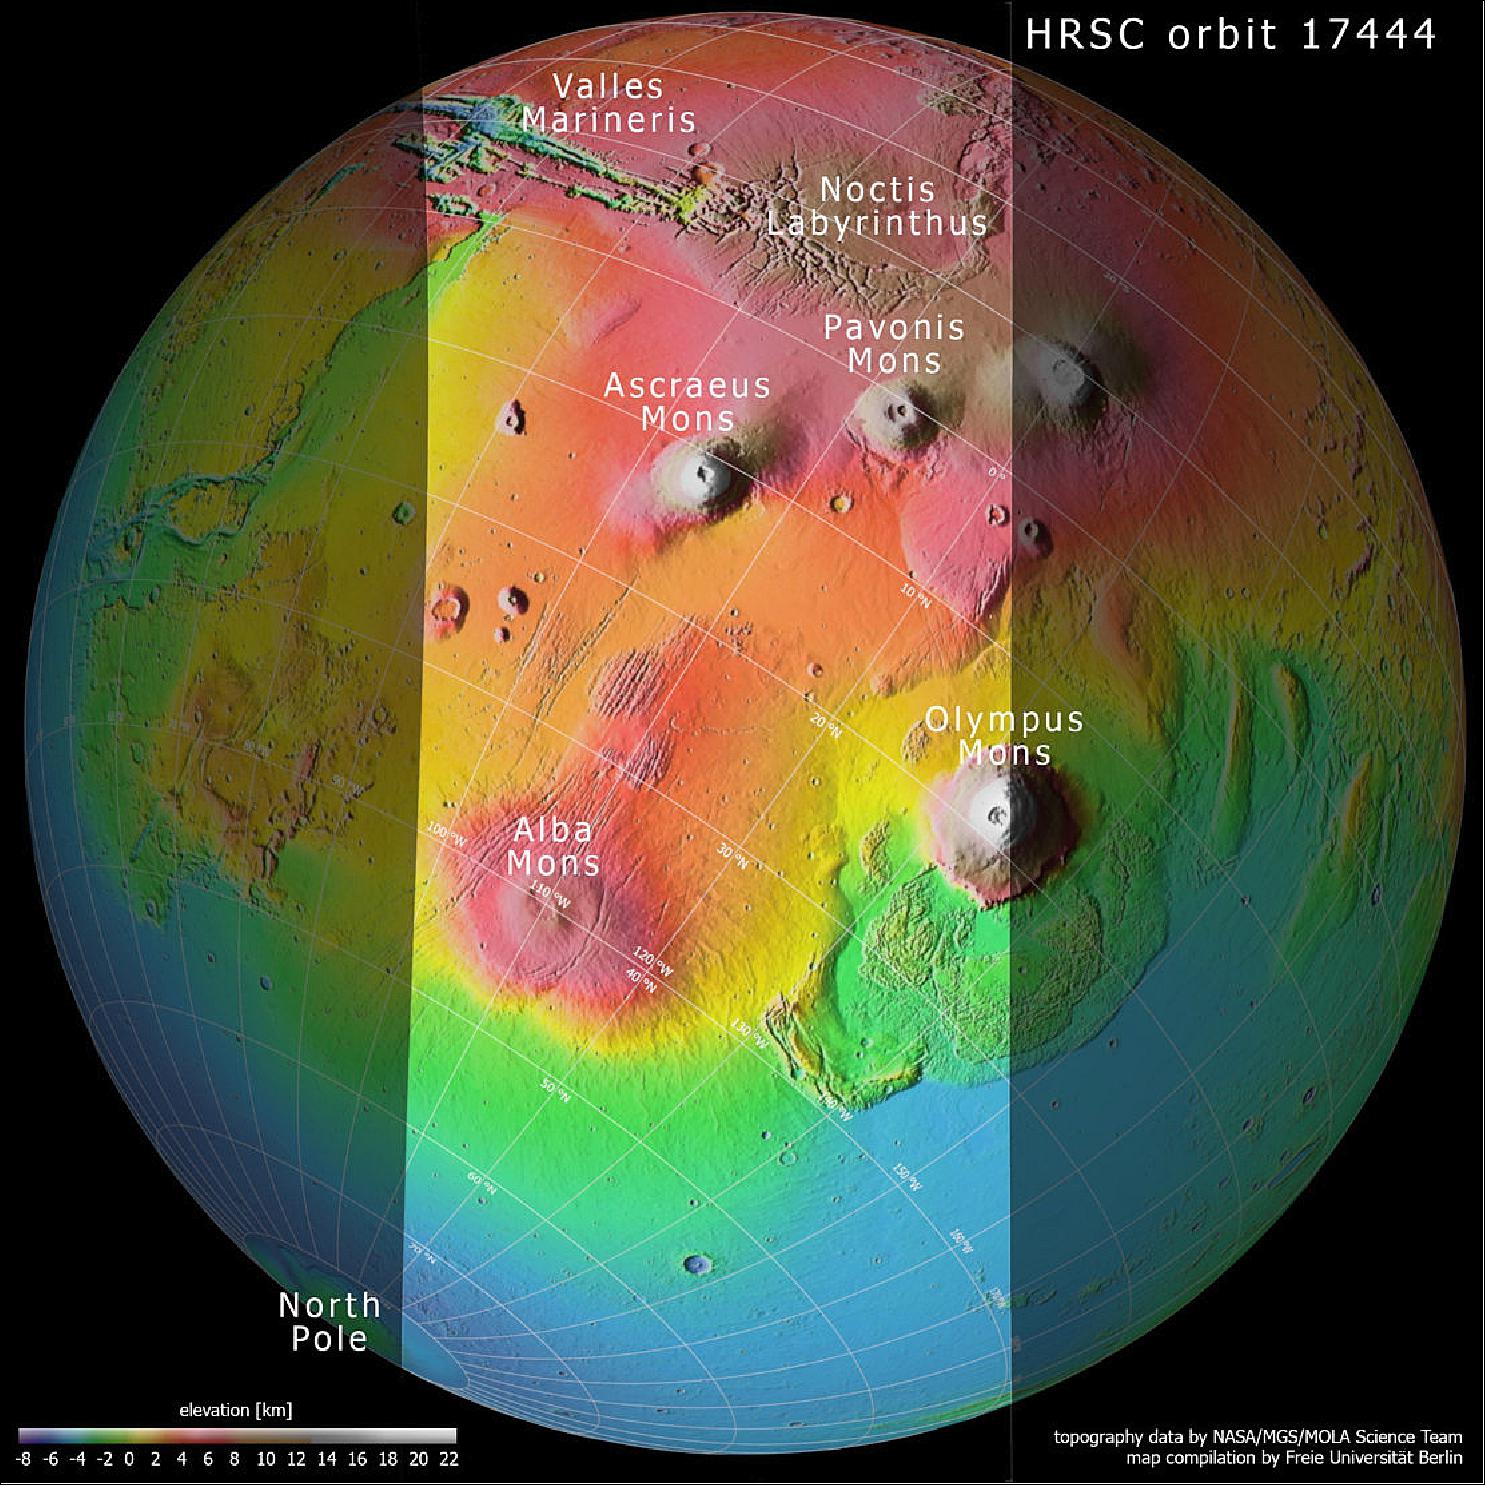
Legend to Figure 78: Included in this labelled view is the extensive canyon system of Valles Marineris, the web-like system of fissures comprising Noctis Labyrinthus, two out of four volcanoes, the north pole, and the so-called Martian dichotomy: the difference in altitude between the northern and southern regions of Mars. Areas at higher altitudes are shown in red-orange tones, while those at lower ones are displayed in blue-greens (as indicated by the scale to the bottom left).
• 11 April 2018: Every so often, your smartphone or tablet receives new software to improve its functionality and extend its life. Now, ESA’s Mars Express is getting a fresh install, delivered across over 150 million km of space. 37)
- With nearly 15 years in orbit, Mars Express – one of the most successful interplanetary missions ever – is on track to keep gathering critical science data for many more years thanks to a fresh software installation developed by the mission teams at ESA.
- The new software is designed to fix a problem that anyone still using a five-year-old laptop knows well: after years of intense usage, some components simply start to wear out.
- The spacecraft arrived at Mars in December 2003, on what was planned to be a two-year mission. It has gone on to spend more than 14 years gathering a wealth of data from the Red Planet, taking high-resolution images of much of the surface, detecting minerals on the surface that form only in the presence of water, detecting hints of methane in the atmosphere and conducting close flybys of the enigmatic moon, Phobos.
- Today, Mars Express is in good shape, with only some minor degradation in performance, but its gyroscopes are close to failing.
- These six gyros measure how much Mars Express rotates about any of its three axes. Together with the spacecraft’s two startrackers, they determine its orientation in space. This is critical for pointing its large parabolic radio antenna towards Earth and to aim its instruments – like the high-resolution stereo camera – at Mars.
- Startrackers are simple, point-and-shoot cameras that capture images of the background star field and, with some clever processing, are used to determine the craft’s orientation in space every few seconds.
- The rotation information from the gyros fills in the information between these snapshots and also when the trackers lose track of the stars – which can last for minutes or even hours.
- “After looking at variations in the intensity of the gyros’ internal lasers, we realized last year that, with our current usage, four of the six gyros were trending towards failure,” says spacecraft operations manager James Godfrey. “Mars Express was never designed to fly without its gyros continuously available, so we could foresee a certain end to the mission sometime between January and June 2019.”
- Engineers knew, however, from long experience with similar gyros on previous missions, including Rosetta and ERS-2, that it might be possible to fly the mission primarily using its startrackers, with the gyros only being switched on occasionally, to extend their lives.
- Hacking 15 year-old code: “Flying on startrackers with the gyros mostly switched off meant that a significant portion of the 15 year-old software on Mars Express would have to be rewritten, and this would be a major challenge,” says operations engineer Simon Wood.
- While the spacecraft’s builder provided great assistance, it was mostly up to the teams at ESA to open the code, rewrite the software, test it and prepare it for upload as soon as possible.
- “We were also helped by being able to take code flown on Rosetta and transplant it into the Mars Express guidance software,” adds Simon.
- A massive, multi-month effort followed, involving teams from across the Agency working to develop the new software that would enable Mars Express to keep flying. This also meant significant changes in instrument science planning.
- “We didn’t know if such a massive revision was possible – it hadn’t been done before, especially as we would be in a race against time to complete it. But faced with the almost-certain end of mission, what began as wild speculation during a tea break one afternoon last summer has led to the full rewrite now being ready to send up.”
- The new software was finalized earlier this year, and has undergone meticulous testing to ensure it will work as intended.
- Go/No-Go: The effort came to fruition yesterday, when the mission team met for a critical go/no-go meeting with the ESA managers to get final approval to activate the new software.
- The new code was actually uploaded to an area of spare memory on Sunday, but just like when your phone or tablet gets a software upgrade, mission controllers will have to shut Mars Express down and trigger a reboot to start running the new code, a critical step set for 16 April.
- If all goes as expected, the mission teams will then spend about two weeks testing and reconfiguring the spacecraft to ensure everything is working as it should before resuming normal science operations.
- “Similar, but much smaller fixes, have been developed in the past for other missions with old gyros, such as Rosetta, but this is certainly the most complex and extensive software rewrite we’ve done in recent memory,” says mission manager Patrick Martin. “Thanks to the skill of ESA’s teams, Mars Express will fly well into the 2020s, depending on fuel supply, and continue delivering excellent science for many years yet. I look forward to seeing continued joint science campaigns between Mars Express and other Mars missions like ESA’s Trace Gas Orbiter and incoming rover missions.”
• 07 September 2017: The Planetary SUrface Portal (PSUP) is an online tool for exploring the wealth of data about Mars collected in past decades. 38)
- Developed by experts at the observatories of Paris Sud (OSUPS) and Lyon (OSUL), PSUP has modules for filtering, processing, and downloading data (Mars System Information, or MarsSI), and for visualizing these data in 3D–including global mineralogical maps, geomorphologic maps, and various other catalogues (Mars Visu).
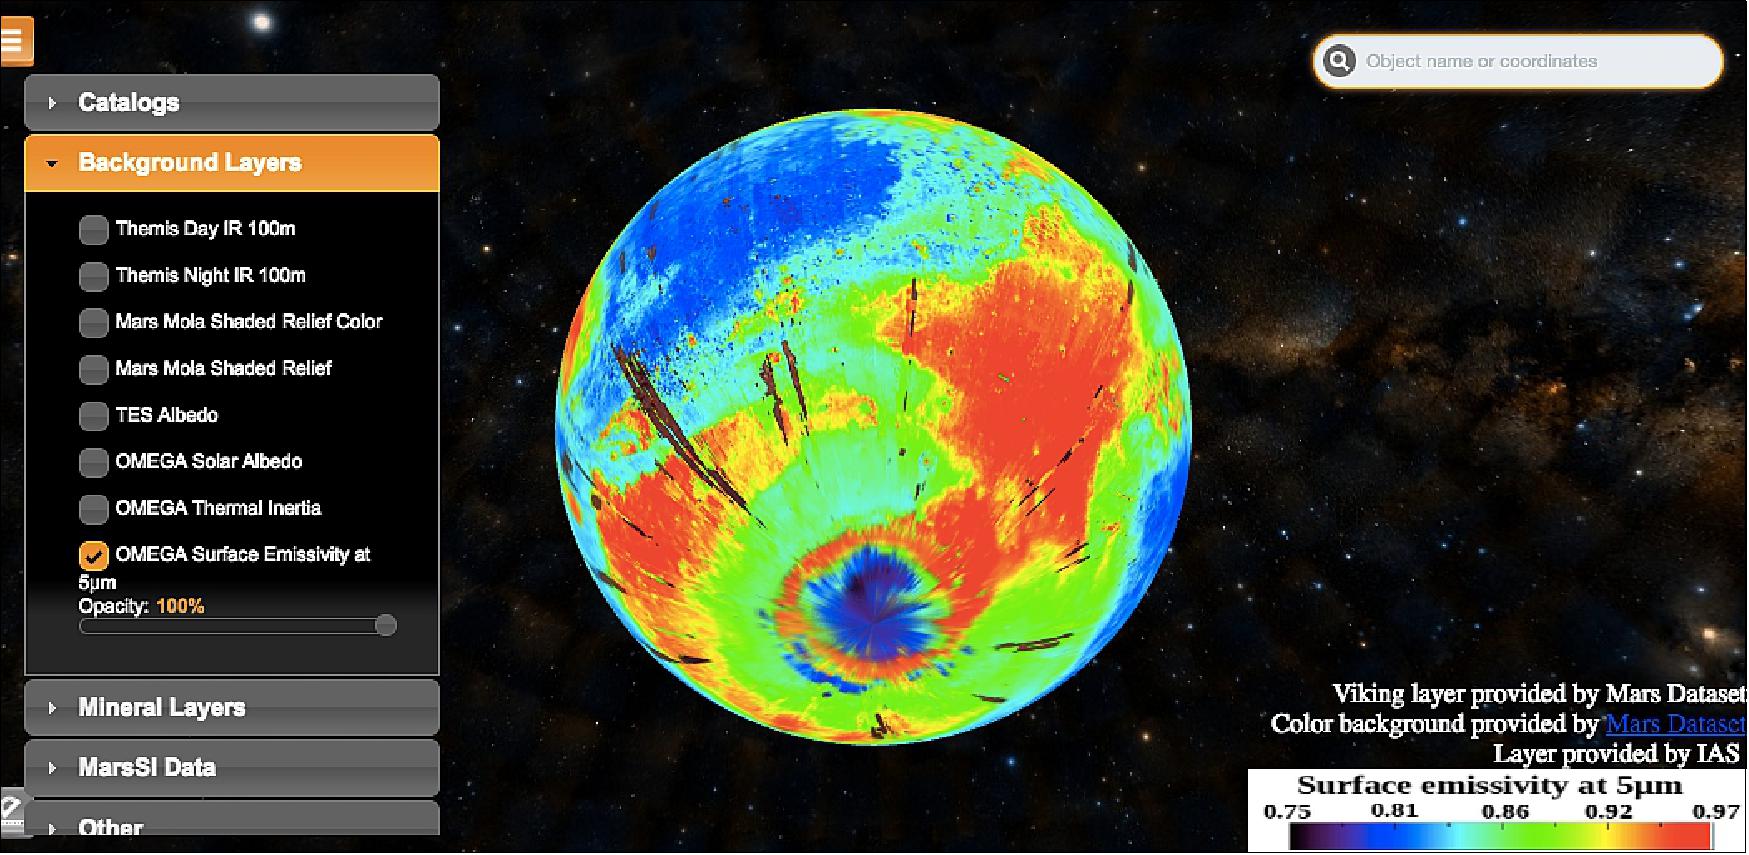
• 04 November 2011: The volcanoes on Mars are true giants. As well as being home to the largest volcano in our Solar System, the 24 km high Olympus Mons, and its three neighboring shield volcanoes Arsia, Pavonis and Ascraeus, there are a number of less-frequently observed volcano complexes on the Tharsis bulge near the Martian equator that also reach impressive heights. With a base measuring 155 x 125 km, the 8000 m Tharsis Tholus may only be a ‘mid-range’ volcano, but when measured against terrestrial standards, this volcano is truly gigantic. The HRSC (High Resolution Stereo Camera) operated by DLR (German Aerospace Cente) on board ESA’s Mars Express spacecraft acquired images of Tharsis Tholus over the course of several orbits, which have been combined to form a mosaic image with a resolution of 14 m/pixel. The images show an area located at 13º north and 268º east. 39) 40)
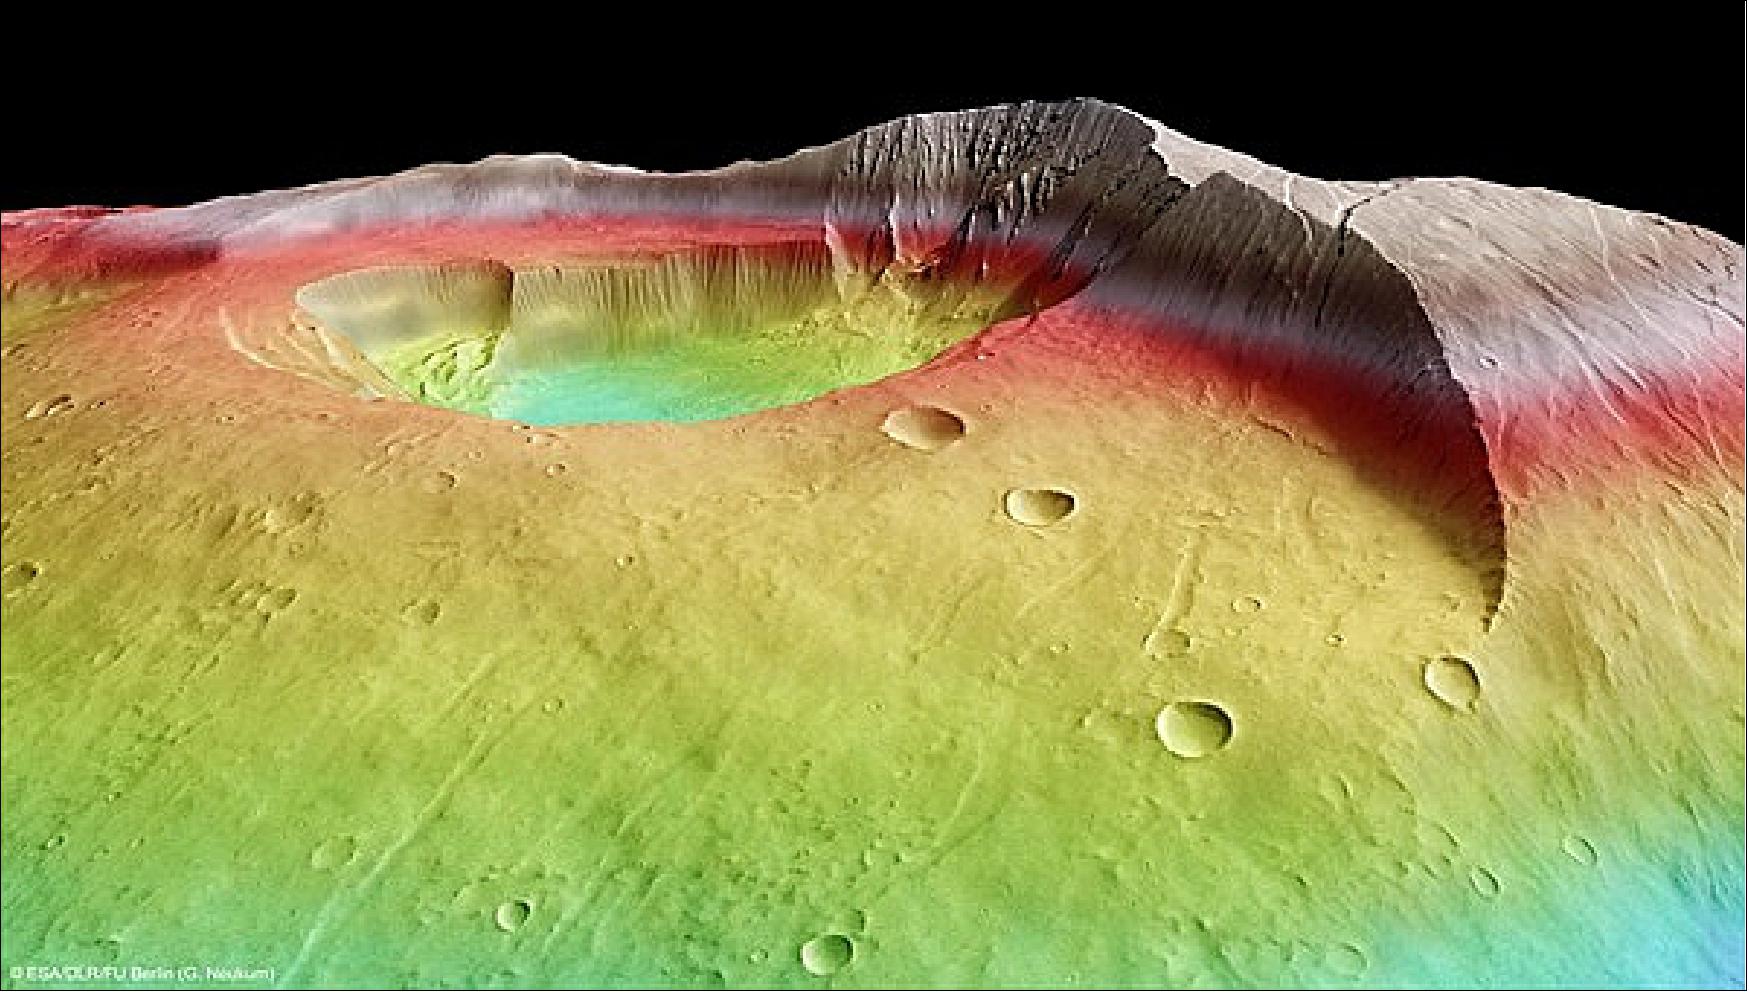
- Just as on Earth, volcanoes on Mars played an important role in both its climatic history and the thermal evolution of its interior. Volcanic eruptions fed ‘fresh’ gases into the atmosphere, thereby affecting the density and composition of this gaseous envelope. Whether a water cycle existed on Mars or whether it once rained are some of the most exciting questions addressed by Mars exploration. Closely related to this is the question of whether conditions were ever favorable for the development of life on the now dry planet.
- A caldera two and a half kilometers deep and the size of Berlin: Tharsis Tholus differs from many of the other volcanoes on Mars in that its edifice has undergone extensive modification. The complex has not developed in the usual way, for example as a cone or a shield surrounding the volcanic center; instead, it shows signs of substantial deformation. At least two major collapses on the western and eastern flanks have taken place in the course of its four billion year history. Evidence of these events is still visible, taking the form of the steep flanks some several kilometers in height, as well as concentric and ring faults.
- The main feature of Tharsis Tholus is, however, the size of its central caldera. This slightly elongated collapse crater at the summit of the volcano, measuring roughly 32 x 34 km, extends over an area almost as large as Berlin and the base is as much as 2.7 km below the rim. The caldera may have formed when a shallow magma chamber under the volcano emptied, primarily through volcanic eruptions – during which the magma emerged at the surface in the form of lava. This emptying process caused a large cavity to form inside the volcano. As lava accumulated over this cavity, there came a point when it could no longer support the additional weight and it collapsed, forming a depression known as a ‘collapse caldera’.
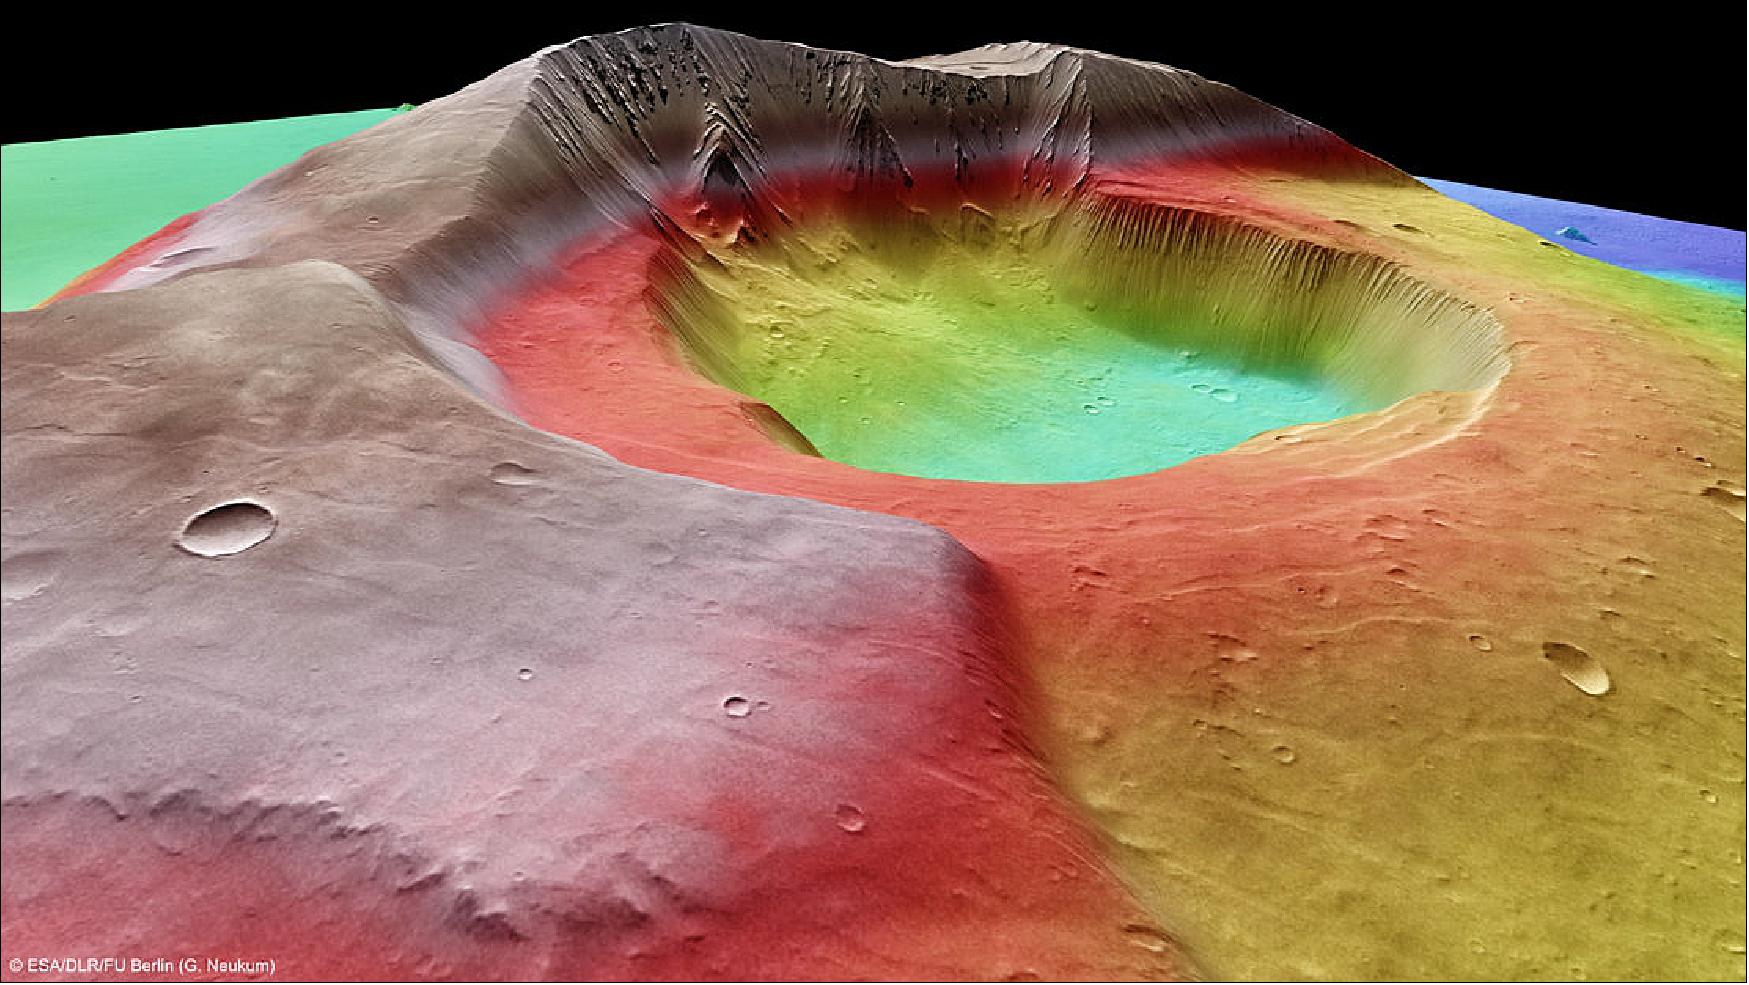
- But the true size of Tharsis Tholus is concealed. As the nadir image shows, the volcano is surrounded by numerous solidified lava flows, hiding the original base of the volcano. Taking into account the number and massive extent of these lava flows, it is possible that Tharsis Tholus is ‘submerged’ in lava to a depth of several kilometers.
- The image data used to create the images shown here were acquired using the HRSC between 28 October and 13 November 2004 during orbits 0997, 1019, 1041 and 1052. The images were produced by the Department of Planetary Sciences and Remote Sensing in the Institute for Geological Sciences of the Freie Universität Berlin. The perspective views were computed from the HRSC stereo channels. The anaglyph was derived from one stereo channel and the nadir channel, which captures image data at the highest resolution of all the channels. The black-and-white detail image was acquired with the nadir channel. The false-color images are based on digital terrain models of the region, from which the topography of the landscape can be derived.
- November 2011 – Mars in the spotlight: Mars continues to be one of the most important targets for planetary research. On 25 November, NASA’s Mars Science Laboratory, a lander carrying a rover named Curiosity, will be launched on its journey to the Red Planet. Curiosity is five times heavier than the two ‘veteran’ rovers, Spirit and Opportunity, which have been exploring the Martian surface since 2004. Equipped with the most comprehensive and sophisticated suite of experiments, Curiosity will continue the quest to find evidence for the existence, past or present, of organic molecules on Mars.
- Even the Russian space program will again contribute to the exploration of Mars; on 5-8 November 2011 at 22:16 CET, the Phobos Grunt spacecraft will embark on its journey to Phobos, the larger of Mars’ two moons. Once it lands in 2013, the small lander will collect samples for roughly a year. The loaded return vehicle will then blast off from Phobos and arrive back at Earth in 2014. DLR is participating in this mission by developing digital terrain models derived from HRSC image data, to support the Russians in the selection of the landing sites. Though manned missions to Mars are in the distant future, the Mars500 long-term experiment will help with preparations. In this experiment, the subjects embarked on a 520-day virtual flight to Mars inside a simulated spaceship. This journey will come to an end on 4 November, when they will ‘return to Earth’.
- The HRSC experiment on the European Space Agency’s Mars Express mission is led by the Principal Investigator (PI) Prof. Dr Gerhard Neukum, who was also responsible for the technical design of the camera. The science team for the experiment consists of 40 co-investigators from 33 institutions and 10 nations. The camera was developed at DLR under the leadership of the PI and it was built in cooperation with industrial partners EADS Astrium, Lewicki Microelectronic GmbH and Jena Optronik GmbH. The instrument is operated by the DLR Institute of Planetary Research, through ESA/ESOC. The systematic processing of the HRSC image data is carried out at DLR. The scenes shown here were processed by the PI-group at the Institute for Geological Sciences of the Freie Universität Berlin.
• In 2004, a year after Europe’s first mission to Mars was launched, the flight dynamics team at ESA’s operations center encountered a serious problem. New computer models showed a worrying fate for the Mars Express spacecraft if mission controllers continued with their plans to deploy its giant MARSIS (Mars Advanced Radar for Subsurface and Ionosphere Sounding) radar. 41)
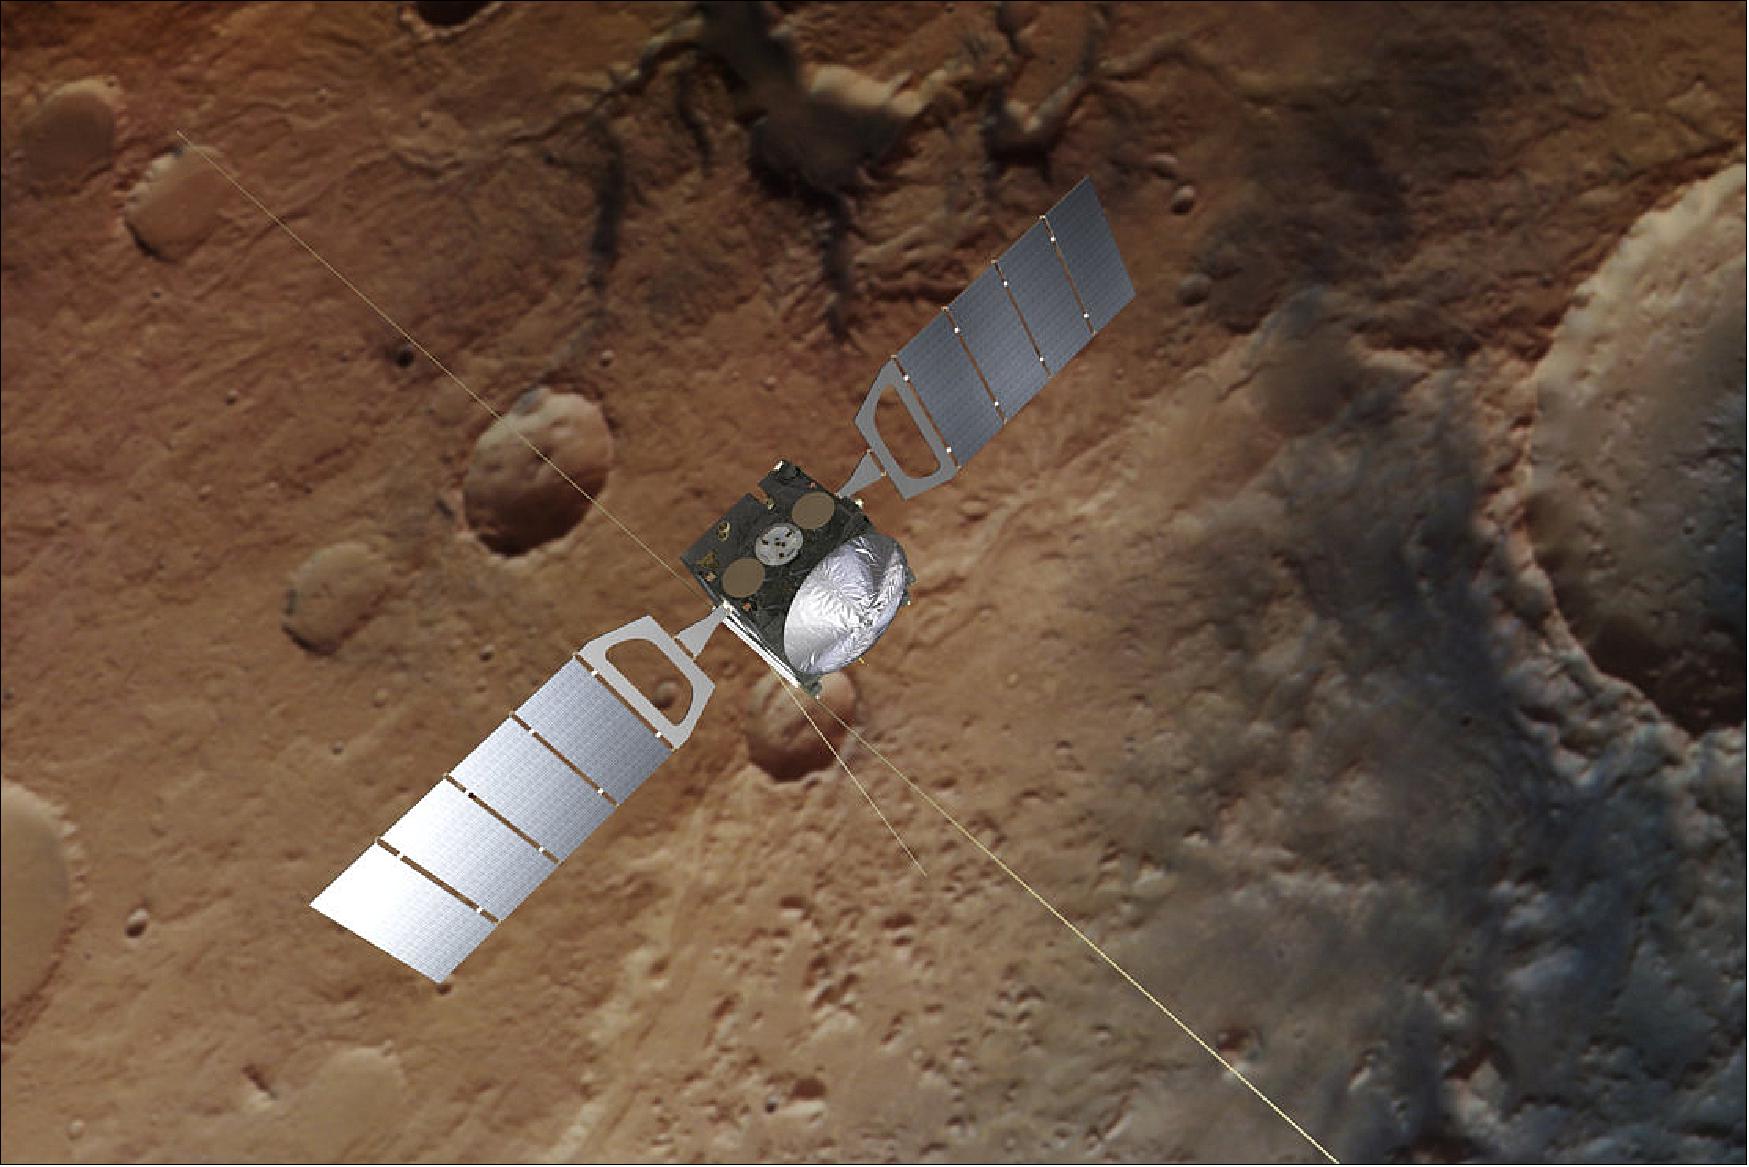
- This extremely sensitive radar instrument spans 40 meters across once fully extended, making it longer than a Space Shuttle orbiter and was built with the direct intention of finding water beneath Mars’ surface. By sending out a series of chips between 1.8 and 5.0 Mhz in ‘subsurface’ mode would scour the red planet for any signs of water anywhere down to a depth of a few kilometers. A secondary ‘ionosphere’ mode at 0.1 to 5.4 Mhz surveyed the electrical conductivity of the Martian upper atmosphere.
- Two ‘radar booms’, 20 m long hollow cylinders, 2.5 cm in diameter, and one 7 m boom, were folded up in a box like a concertina. Once the box was opened, all of the stored elastic energy from the glass fiber booms would be released, a little like a jack-in-the-box, and they would lock into a straight line.
- New and updated computer models, however, showed that these long rods would swing back and forth upon release with an even greater amplitude than previously thought, potentially coming into close contact with the delicate parts of the Mars Express body.
Deployment was Postponed

- Plans were made to get the spacecraft in a ‘robust’ mode before the deployment of each boom and while the glass fiber cylinders were extended. After each deployment the control team would conduct a full assessment of the spacecraft, taking up to a few days, before moving onto the next phase.
- The first deployment began on 4 May 2005 with one of the two 20 m ‘dipole’ booms, and flight controllers at ESA’s operations center quickly realized something wasn’t quite right. 12 out of 13 of the boom segments had ‘snapped’ into place, but one, possibly number 10, was not in position.
Deployment of the Second and Third Booms was Postponed
- Further analysis showed that prolonged storage in the cold conditions of outer space had affected the fiberglass and Kevlar material of the boom. What could be done to heat it up?
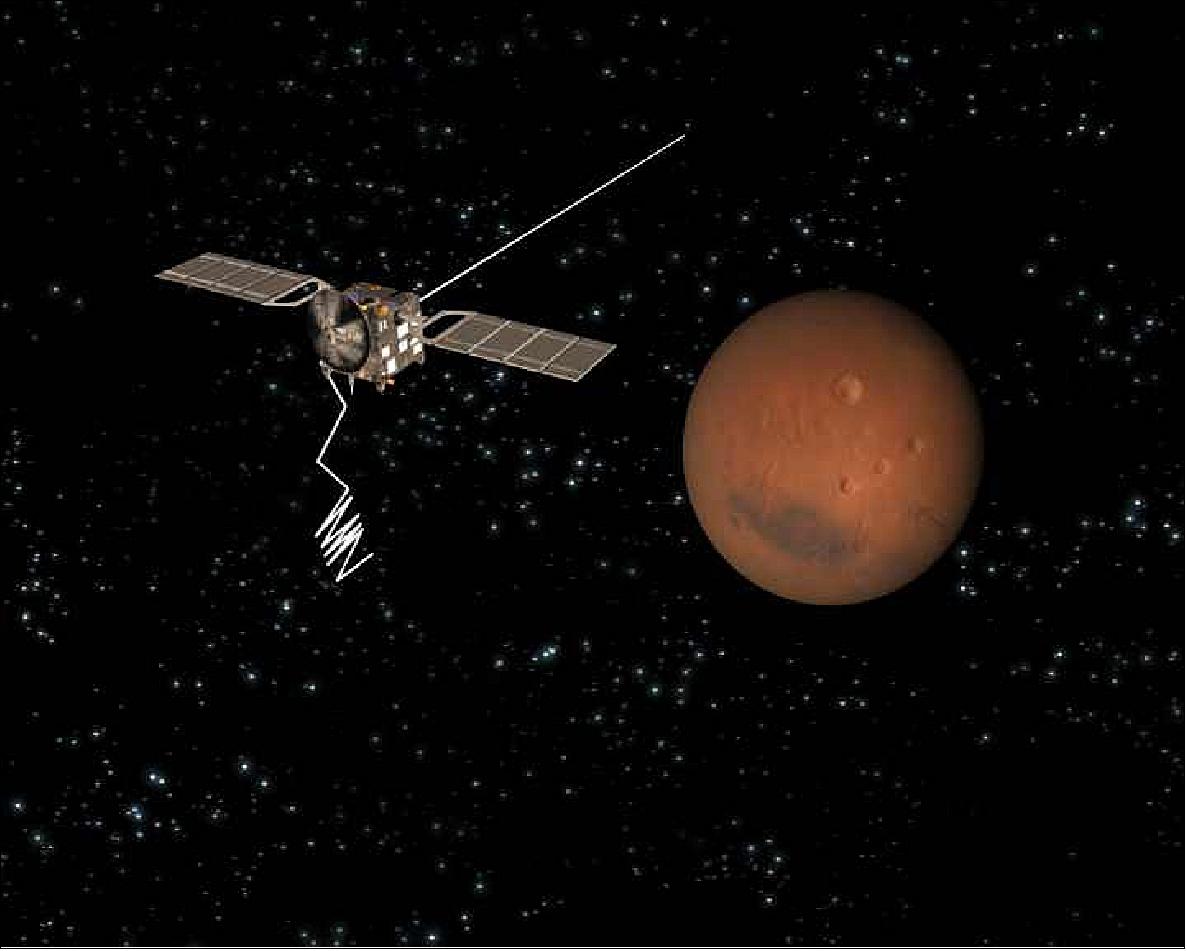
- Enter the Sun: Mission teams decided to swing the 680 kg spacecraft to a position that would allow the Sun to heat the cold side of the boom. It was hoped that as the cold side expanded in the heat, the unlocked segment would be forced into place.
- One hour later, as contact was reestablished at 04:50 CET on 11 May, detailed analysis showed all segments had successfully locked in place and Boom 1 was successfully deployed.
- Following the rollercoaster rollout of the first antenna, flight controllers spent some time mulling over the events. A full investigation ensued, lessons were learnt, and plans were put in place to prevent the same irregularity from taking place in the next two deployments.
- By 14 June 2005, operators felt confident that they, and Mars Express, were ready to deploy the second boom. At 13:30 CEST the commands were sent.
- This time, Mars Express was set into a slow rotation to last 30 minutes during and after the release of the second 20 m boom. The rotation was planned so that all of the boom’s hinges would be properly heated by the Sun before, during, and after deployment.
- Just three hours later and the first signs of success reached ground control, showing that Mars Express had properly re-oriented itself and was pointing towards Earth, transmitting data.
- The data confirmed that the spacecraft was working with two fully and correctly deployed booms, and their deployment had not caused any damage to the spacecraft.
- Not long after, the third boom was deployed, and the full MARSIS setup was complete on Mars Express.

Let the Science Begin
- Just four months later, and ESA was reporting on the radar’s activities. MARSIS radar scientists were collecting data about a highly electrically conducting layer – surveyed in sunlight. They were also continuing the laborious analysis of data in the search for any possible signs of underground water, in a frozen or liquid state.
- Radar science is based on the detection of radio waves, reflected at the boundaries between different materials. Each material interacts with light in a different way, so as the radio wave crosses the boundary between different layers of material, an echo is generated that carries a sort of ‘fingerprint’, providing information about the kind of material causing the reflection, including clues to its composition and physical state.
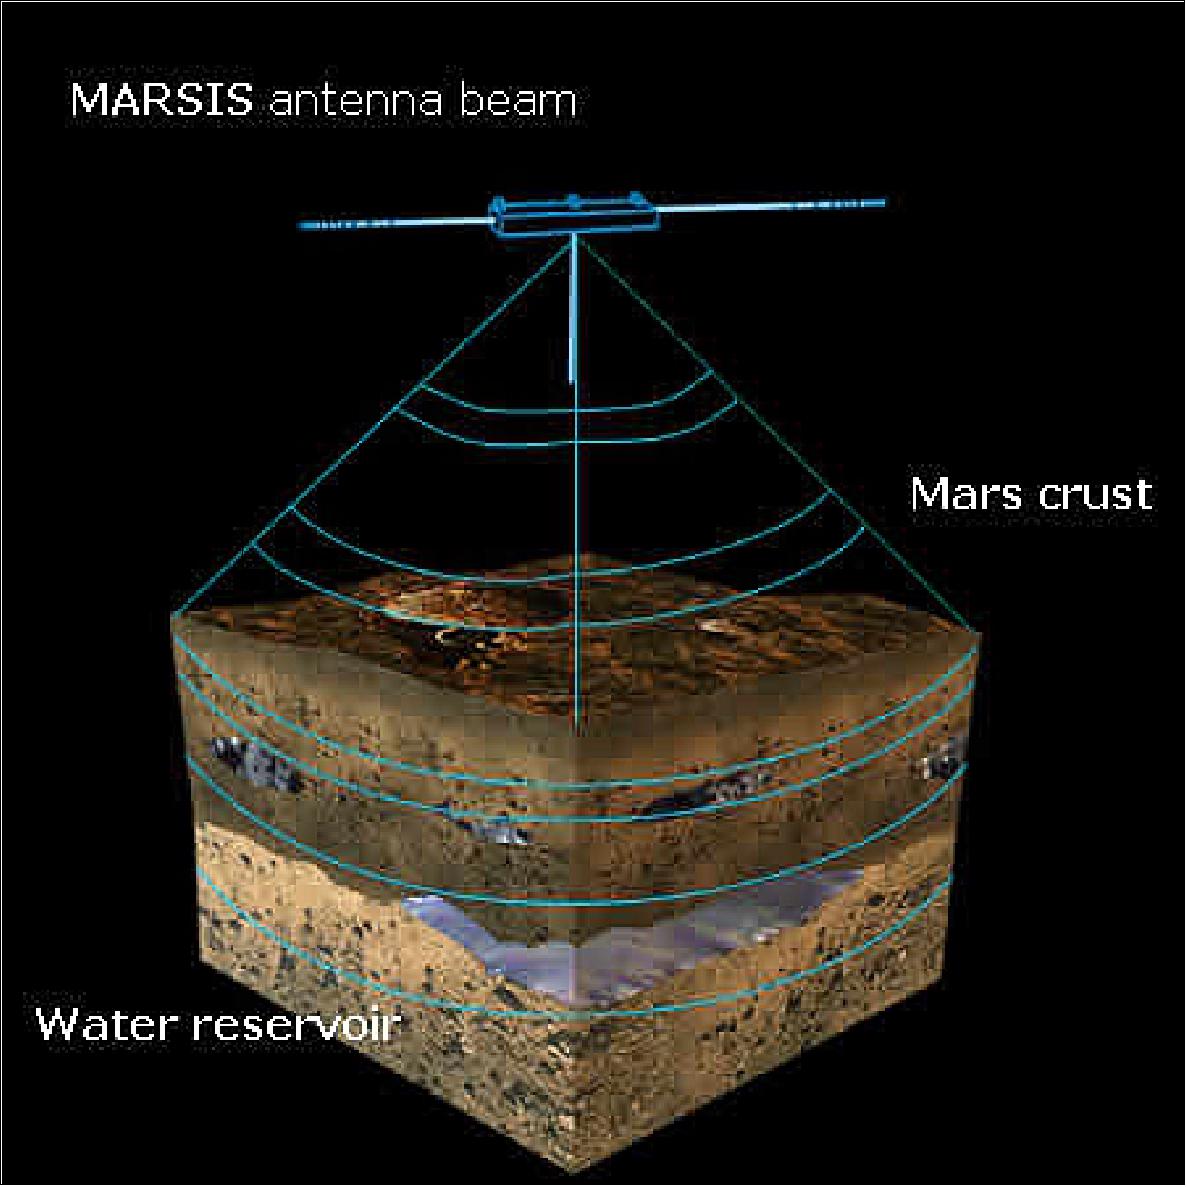
• 17 March 2004: Thanks to ESA’s Mars Express, we now know that Mars has vast fields of perennial water ice, stretching out from the south pole of the Red Planet. 42)
- Astronomers have known for years that Mars possessed polar ice caps, but early attempts at chemical analysis suggested only that the northern cap could be composed of water ice, and the southern cap was thought to be carbon dioxide ice.
- Recent space missions then suggested that the southern ice cap, existing all year round, could be a mixture of water and carbon dioxide. But only with Mars Express have scientists been able to confirm directly for the first time that water ice is present at the south pole too.
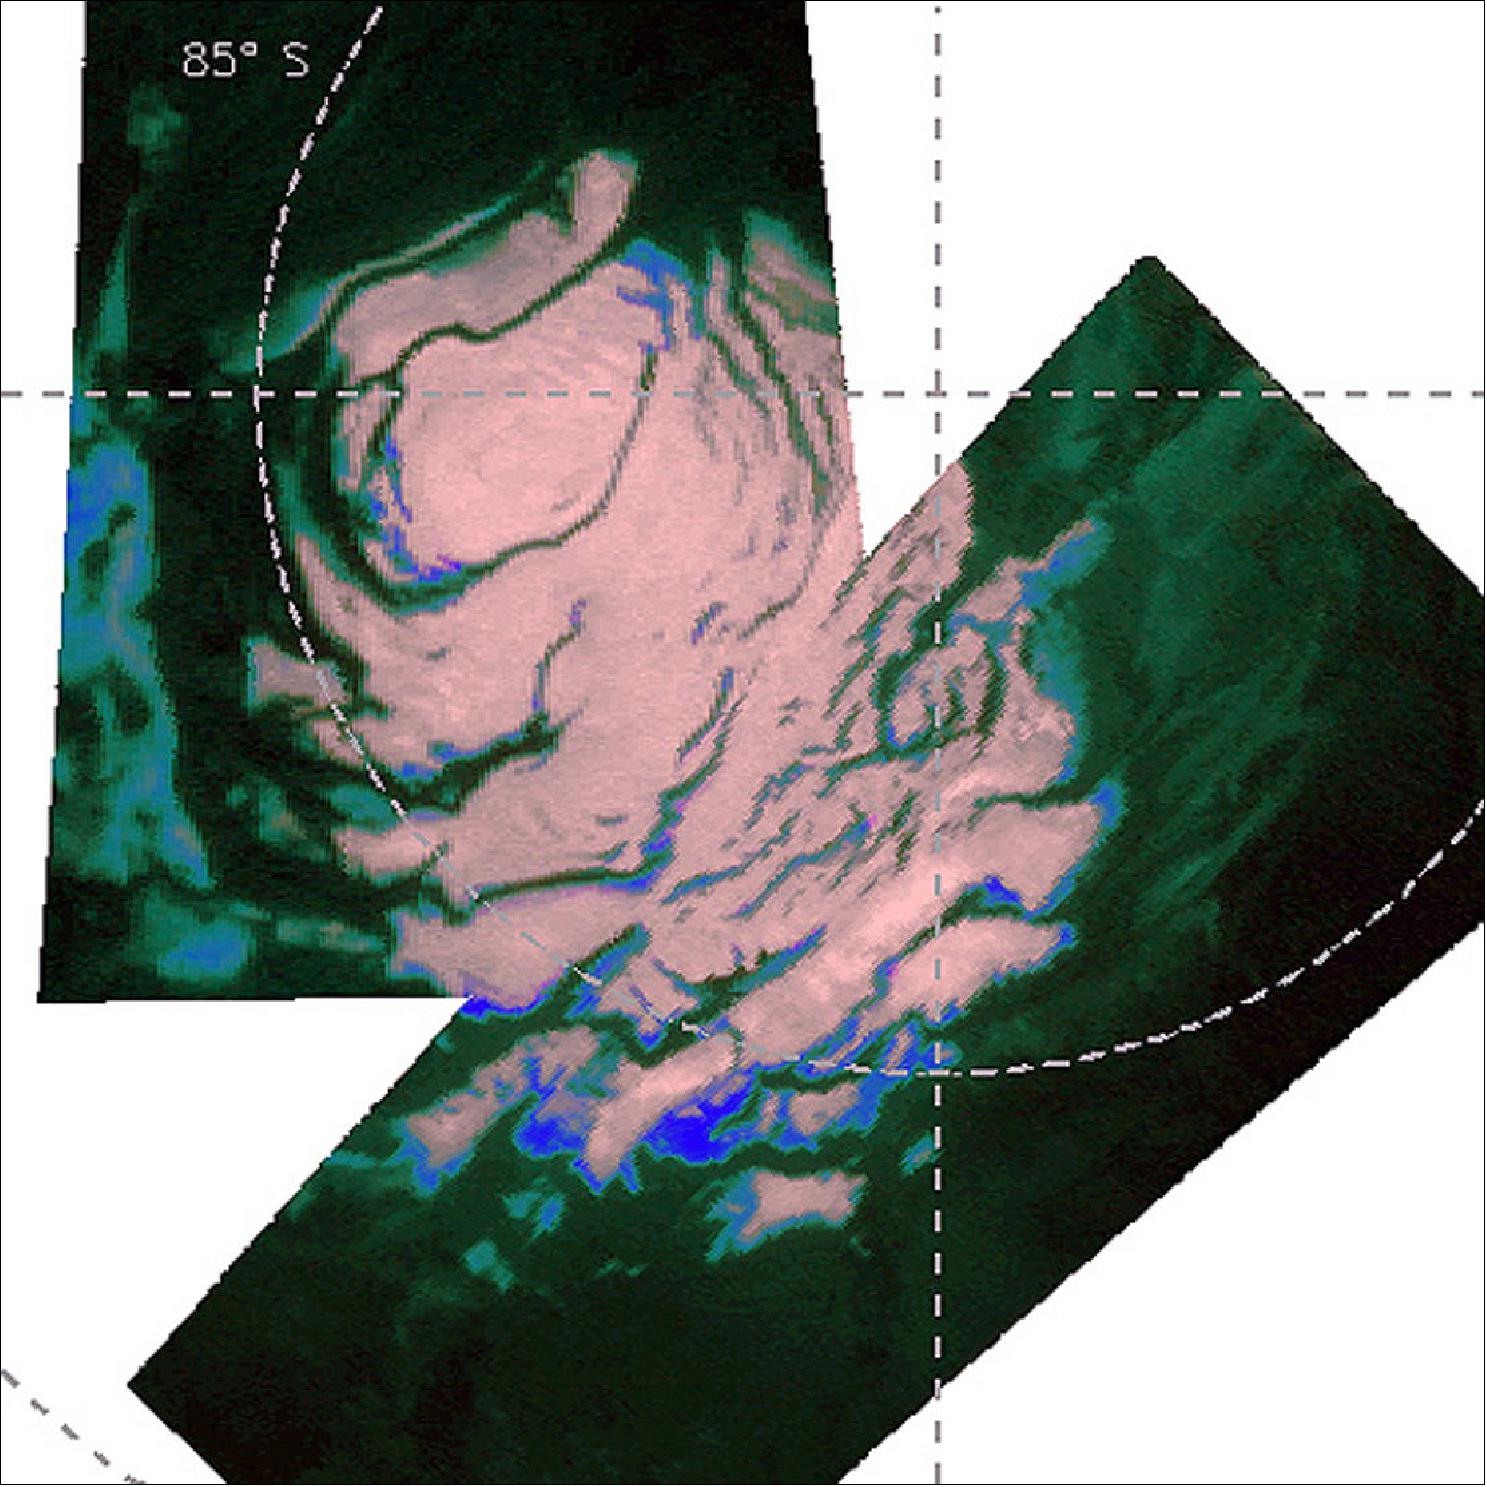
- Mars Express made observations with its OMEGA instrument to measure the amounts of sunlight and heat reflected from the Martian polar region. When planetary scientists analyzed the data, it clearly showed that, as well as carbon dioxide ice, water ice was present too.
- The results showed that hundreds of square kilometers of ‘permafrost’ surround the south pole. Permafrost is water ice, mixed into the soil of Mars, and frozen to the hardness of solid rock by the low Martian temperatures. This is the reason why water ice has been hidden from detection until now - because the soil with which it is mixed cannot reflect light easily and so it appears dark.
- However, OMEGA looked at the surface with infrared eyes and, being sensitive to heat, clearly picked up the signature of water ice. The discovery hints that perhaps there are much larger quantities of water ice all over Mars than previously thought.
- Using this data, planetary scientists now know that the south polar region of Mars can be split into three separate parts. Part one is the bright polar cap itself, a mixture of 85% highly reflective carbon dioxide ice and 15% water ice.
- The second part comprises steep slopes known as ‘scarps’, made almost entirely of water ice, that fall away from the polar cap to the surrounding plains. The third part was unexpected and encompasses the vast permafrost fields that stretch for tens of kilometers away from the scarps.
- The OMEGA observations were made between 18 January and 11 February this year, when it was late summer for the Martian southern hemisphere and temperatures would be at their highest. Even so, that is probably only –130 º Celsius and the ice that Mars Express has observed is a permanent feature of this location.
- During the winter months, scientists expect that carbon dioxide from the atmosphere will freeze onto the poles, making them much larger and covering some of the water ice from view.
- Mars Express and OMEGA will now continue looking for water ice and minerals across the surface of the planet. In May, another Mars Express instrument, the Mars Advanced Radar for Subsurface and Ionospheric Sounding (MARSIS), will begin collecting data, looking for water underground.
- It will be particularly exciting when MARSIS looks at the south pole because, once planetary scientists know how deep the ice reaches, they will be able to calculate exactly how much water there is. Knowing this is very important to understand how Mars evolved and if it ever harbored life.
• 23 January 2004: Mars Express, ESA’s first mission to Mars, will reach its final orbit on 28 January. It has already been producing stunning results since its first instrument was switched on, on 5 January. - The significance of the first data was emphasized by the scientists at a European press conference today at ESA’s Space Operations Center, Darmstadt, Germany. 43)
- I did not expect to be able to gather together - just one month after the Mars Orbit Insertion of 25 December – so many happy scientists eager to present their first results", said Professor David Southwood, ESA Director of Science. One of the main targets of the Mars Express mission is to discover the presence of water in one of its chemical states. Through the initial mapping of the South polar cap on 18 January, OMEGA, the combined camera and infrared spectrometer, has already revealed the presence of water ice and carbon dioxide ice.
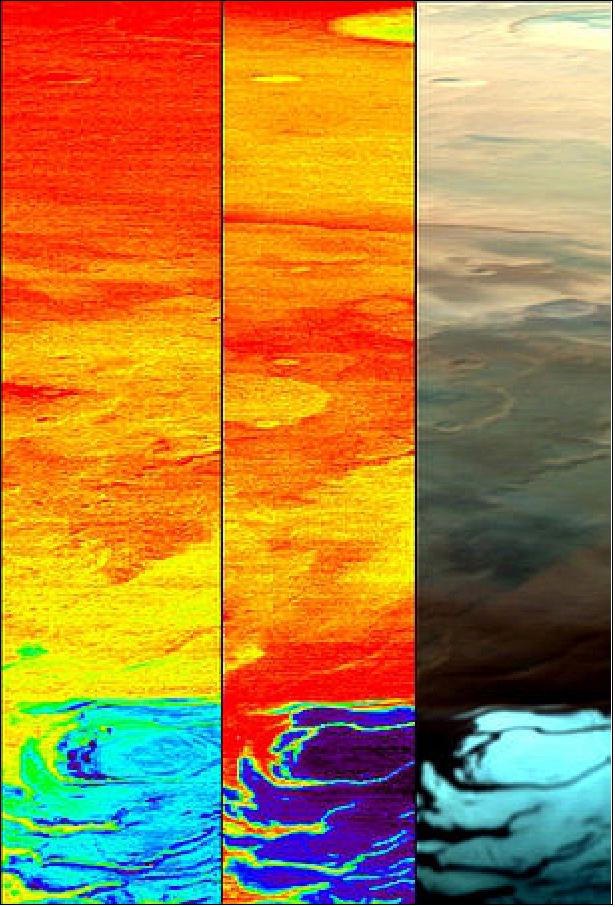
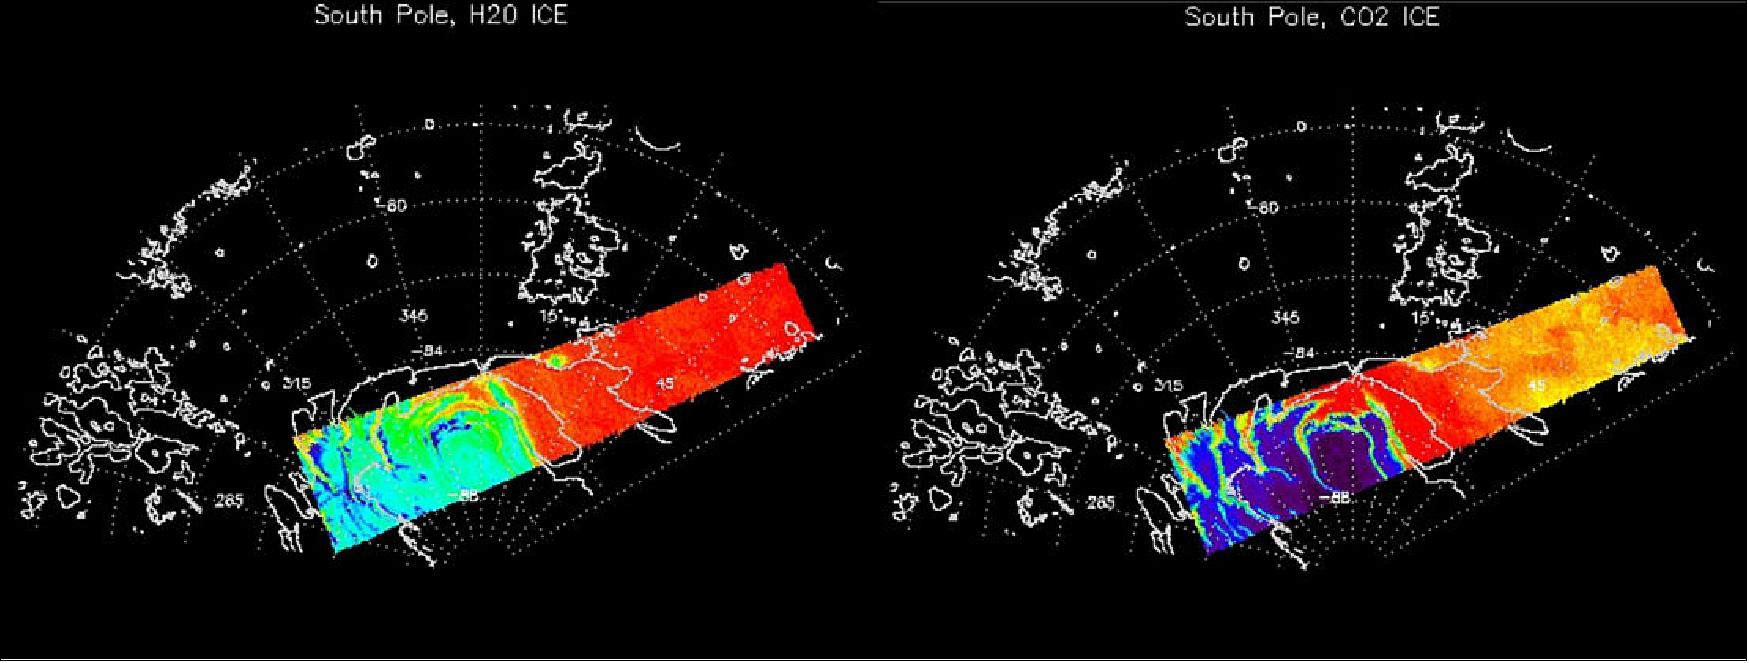
- This information was confirmed by the PFS (Planetary Fourier Spectrometer), a new high-resolution spectrometer of unprecedented accuracy. The first PFS data also show that the carbon oxide distribution is different in the northern and southern hemispheres of Mars.

- The MaRS (Mars Radio Science Experiment) instrument, a sophisticated radio transmitter and receiver, emitted a first signal successfully on 21 January that was received on Earth through a 70- meter antenna in Australia after it was reflected and scattered from the surface of Mars. This new measurement technique allows the detection of the chemical composition of the Mars atmosphere, ionosphere and surface.
- ASPERA (Analyzer of Space Plasmas and Energetic Atoms), a plasma and energetic neutral atoms analyzer, is aiming to answer the fundamental question of whether the solar wind erosion led to the present lack of water on Mars. The preliminary results show a difference in the characteristics between the impact of the solar wind area and the measurement made in the tail of Mars. Another exciting experiment was run by the SPICAM instrument (an ultraviolet and infrared spectrometer) during the first star occultation ever made at Mars. It has simultaneously measured the distribution of the ozone and water vapor, which has never been done before, revealing that there is more water vapor where there is less ozone.
- ESA also presented astonishing pictures produced with the High Resolution Stereo Camera (HRSC). They represent the outcome of 1.87 million km2 of Martian surface coverage, and about 100 GB of processed data. This camera was also able to make the longest swath (up to 4000 km) and largest area in combination with high resolution ever taken in the exploration of the Solar System.
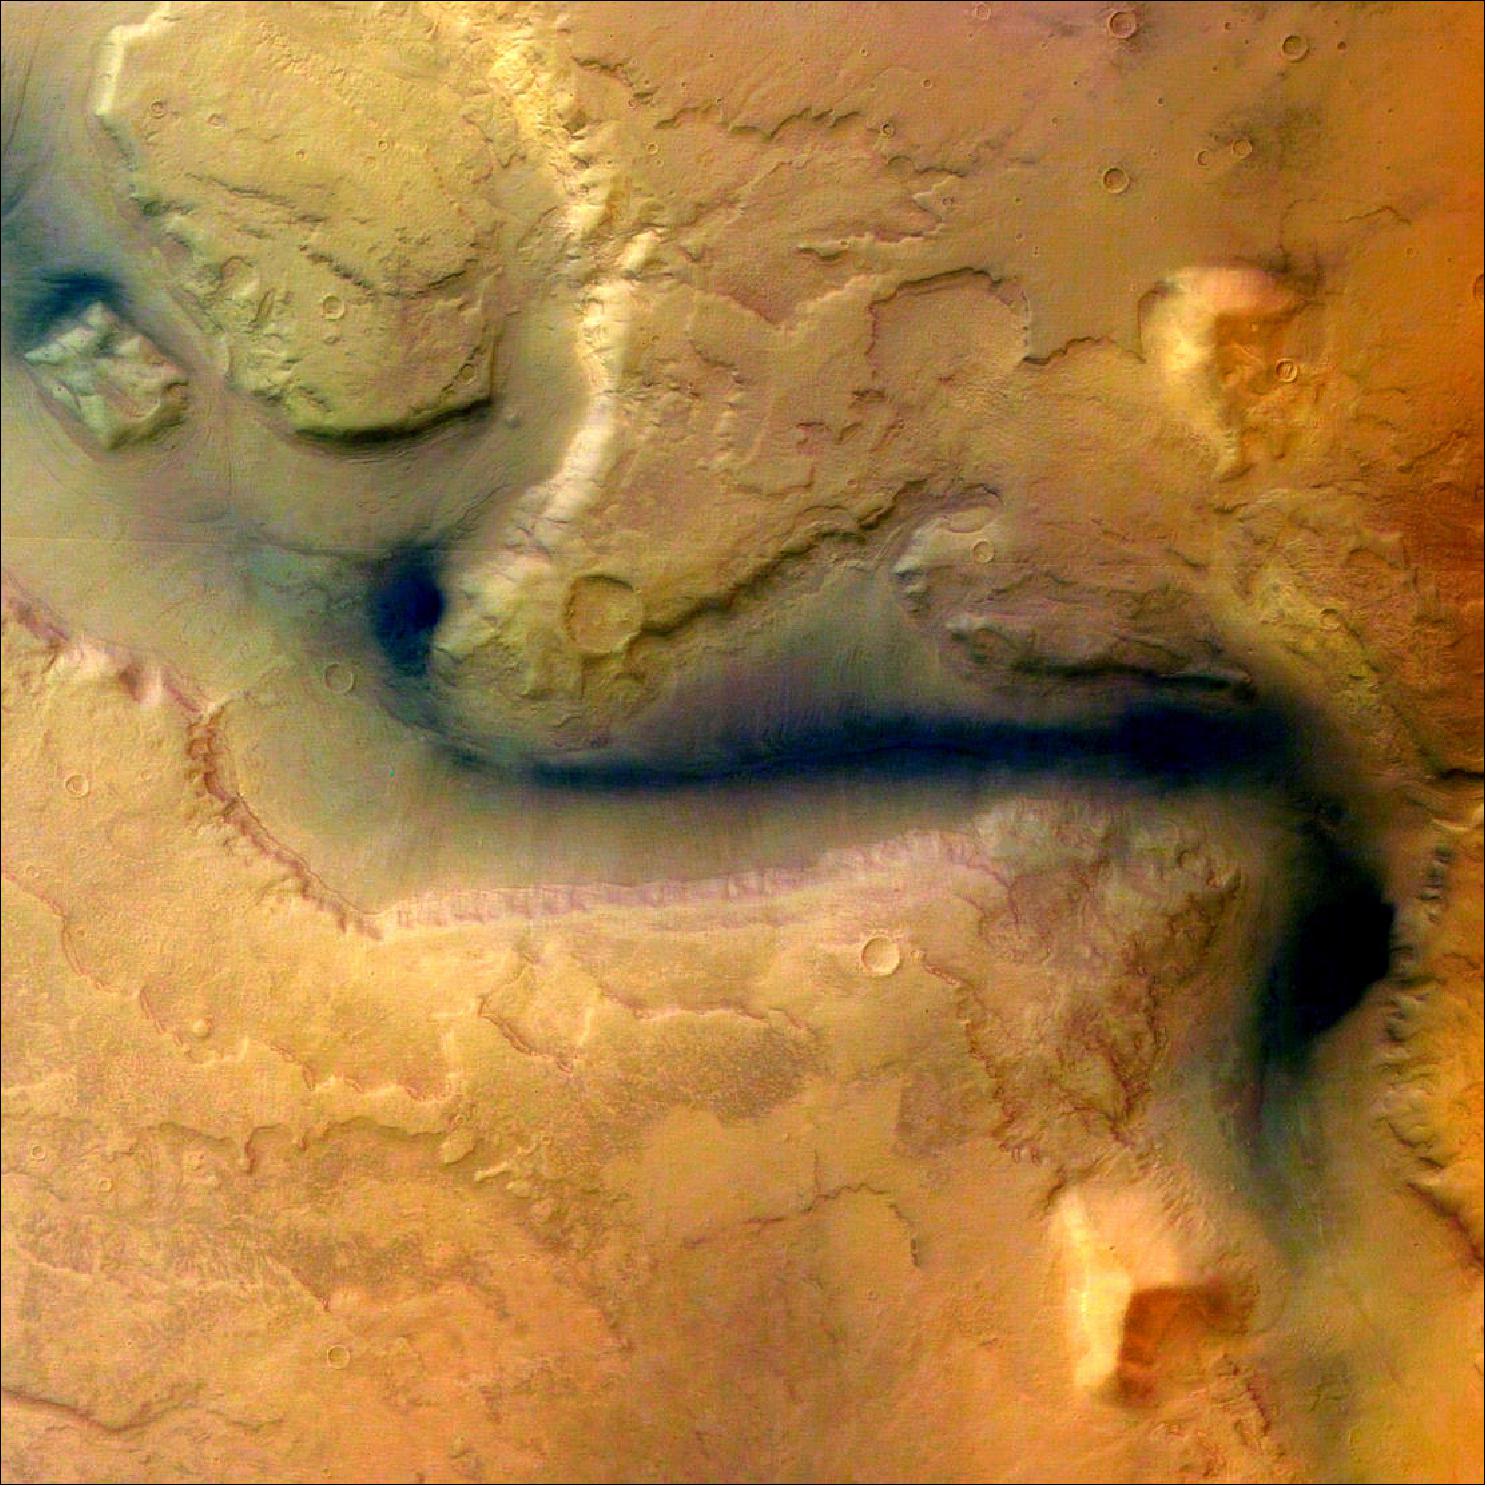
• 19 January 2004: The image of Figure 92 shows a portion of a 1700 km long and 65 km wide swath which was taken in south-north direction across the Grand Canyon of Mars (Valles Marineris) from two perspectives. It is the first image of this size that shows the surface of Mars in high resolution (12 m/pixel), in color and in 3D. 44)

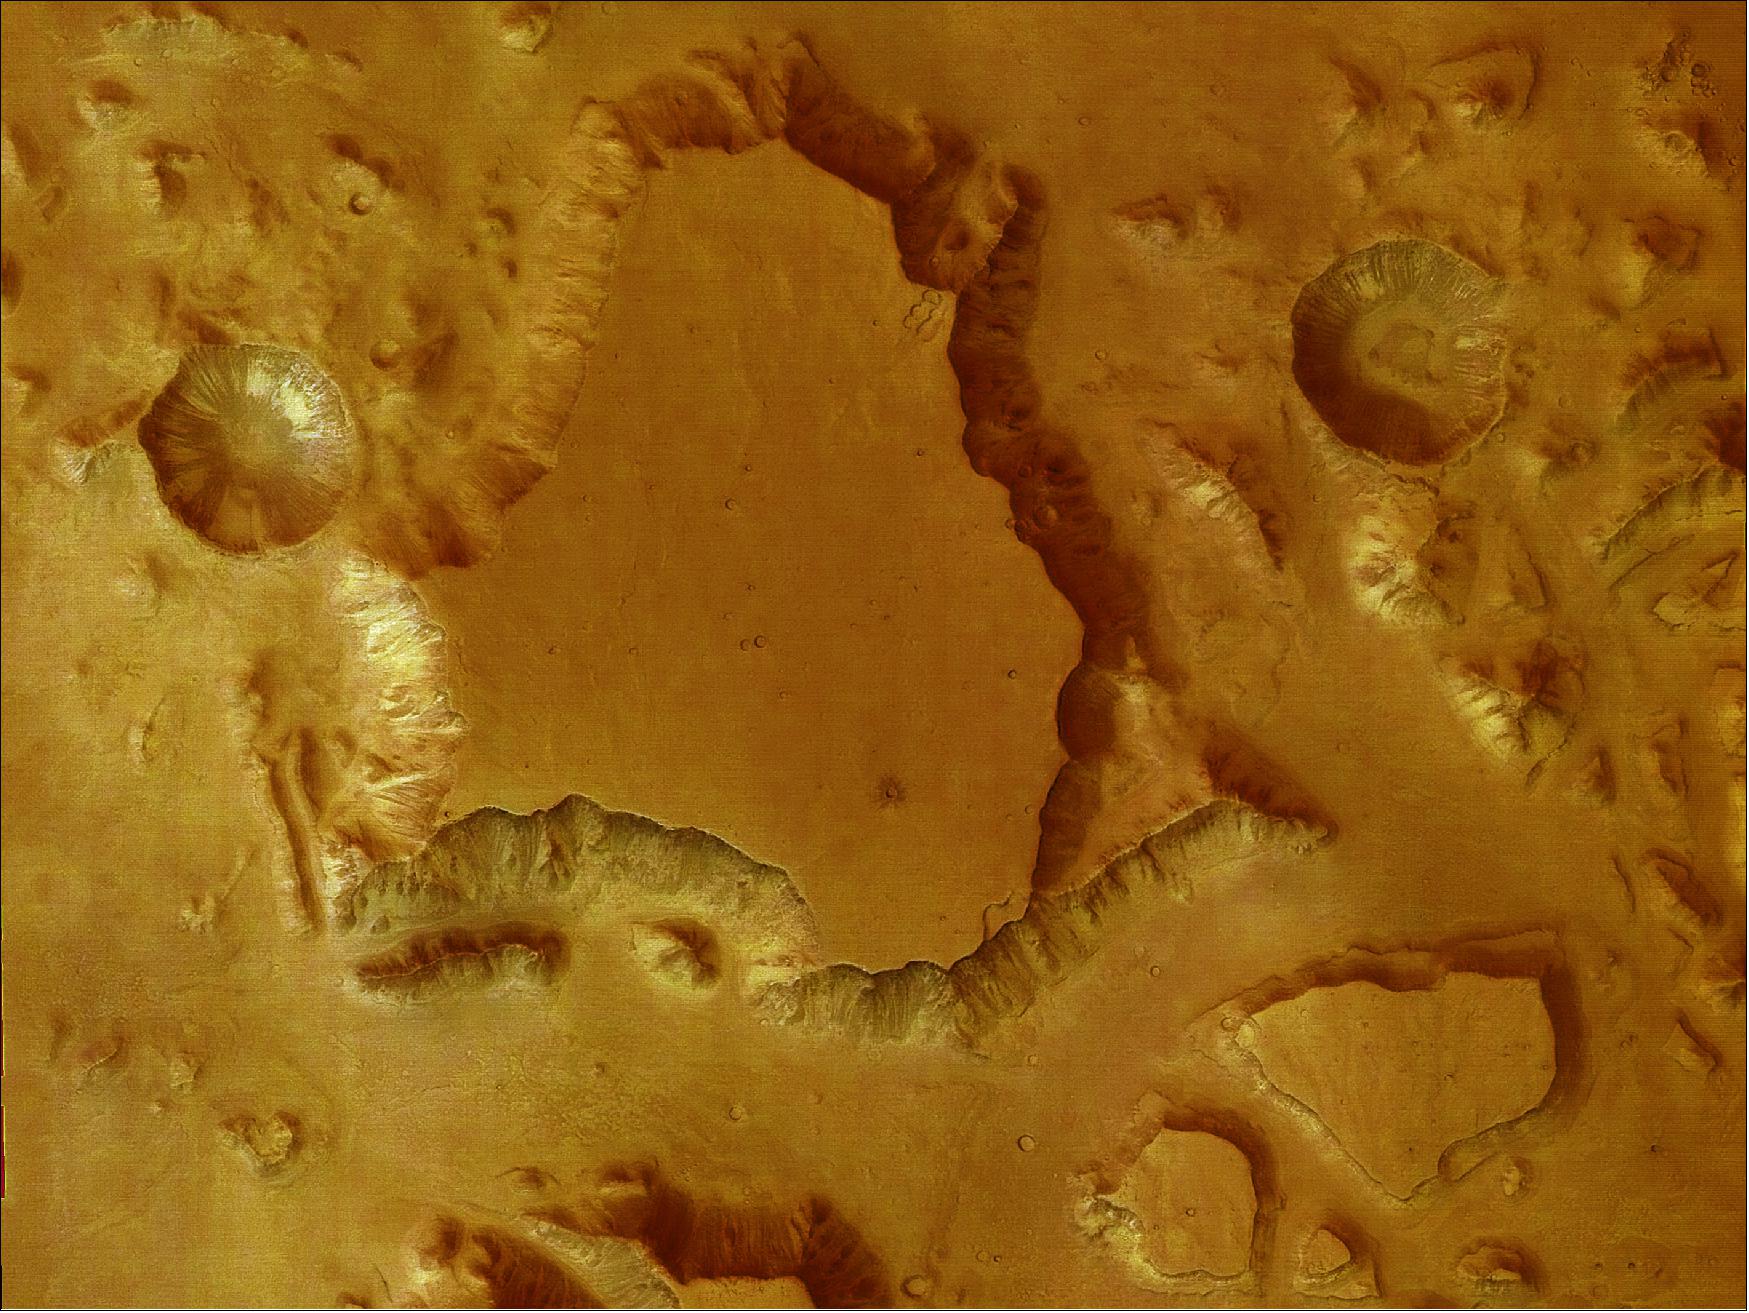
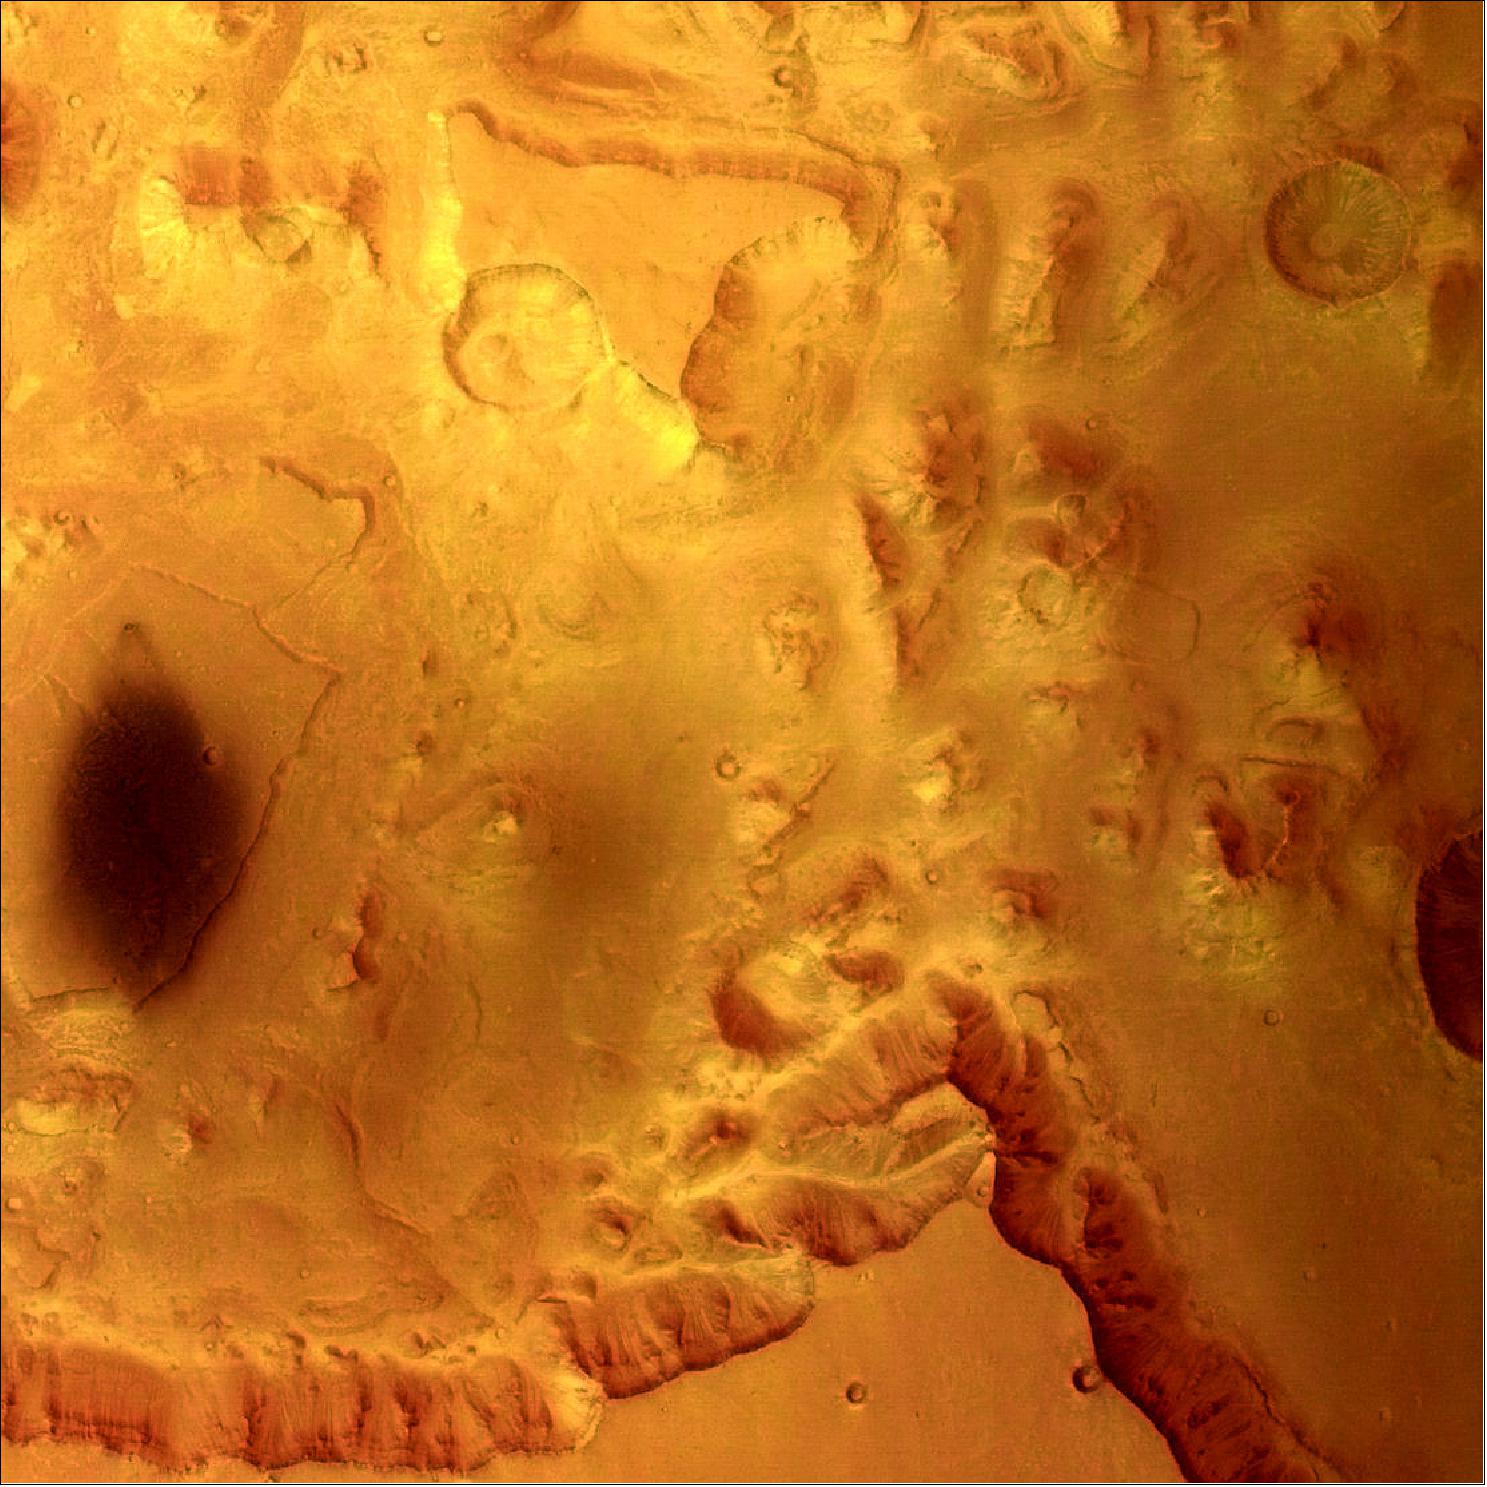
• Following spacecraft commissioning in January 2004, most instruments began their own calibration and testing, in the process acquiring scientific data. This phase lasted until June 2004, when all the instruments but one began routine operations after the payload commissioning review. The deployment of the MARSIS radar antennas, however, was postponed. The late deployment was initially planned to maximize daylight operations of the other instruments before the pericenter naturally drifts to southern latitudes, which coincides with the nightime conditions required for subsurface sounding by MARSIS. The nominal lifetime of the orbiter is a martian year (687 days), with a potential extension by another martian year to complete global coverage and observe all seasons twice over.
References
1) ”Mars Express tracks the phases of Phobos,” ESA / Science & Exploration / Space Science / Mars Express, 12 December 2019, URL: http://www.esa.int/Science_Exploration/Space_Science/Mars_Express/
Mars_Express_tracks_the_phases_of_Phobos
2) ”Fractured ice sheets on Mars,” ESA / Science & Exploration / Space Science / Mars Express, 21 November 2019, URL: http://www.esa.int/Science_Exploration/Space_Science/Mars_Express/Fractured_ice_sheets_on_Mars
3) ”ESA’s Mars orbiters did not see latest Curiosity methane burst,” ESA / Science & Exploration / Human and Robotic Exploration / Exploration / ExoMars, 13 November 2019, URL: http://www.esa.int/Science_Exploration/Human_and_Robotic_Exploration/Exploration/ExoMars/
ESA_s_Mars_orbiters_did_not_see_latest_Curiosity_methane_burst
4) ”Mars Express completes 20,000 orbits around the Red Planet,” DLR, 28 October 2019, URL: https://www.dlr.de/content/en/articles/news/2019/04/20191028_20000-orbit-mars-express.html
5) ”River relic spied by Mars Express,” ESA, 10 October 2019, URL: http://www.esa.int/Our_Activities/Space_Science/Mars_Express/River_relic_spied_by_Mars_Express
6) ”From Clouds to Craters,” ESA, 19 September 2019, URL: http://www.esa.int/Our_Activities/Space_Science/Mars_Express/From_clouds_to_craters
7) ”Dark meets light on Mars,” ESA, 8 August 2019, URL: http://www.esa.int/Our_Activities/Space_Science/Mars_Express/Dark_meets_light_on_Mars
8) ”Dust storms swirl at the north pole of Mars,” ESA, 04 July 2019, URL: http://www.esa.int/Our_Activities/Space_Science/
Mars_Express/Dust_storms_swirl_at_the_north_pole_of_Mars
9) A chaos found only on Mars,” ESA, 27 June 2019, URL: http://www.esa.int/Our_Activities/Space_Science/Mars_Express/A_chaos_found_only_on_Mars
10) ”From canals to craters,” ESA, 16 May 2019, URL: https://www.esa.int/Our_Activities/Space_Science/Mars_Express/From_canals_to_craters
11) ”Lowell Crater - a bullseye on Mars,” DLR, 16 May 2019, URL: https://www.dlr.de/dlr/en/desktopdefault.aspx/tabid-10081/151_read-33595/#/gallery/34232
12) ”How Venus and Mars can teach us about Earth,” ESA Space Science, 13 May 2019, URL: http://www.esa.int/Our_Activities/Space_Science/How_Venus_and_Mars_can_teach_us_about_Earth
13) ”Earth’s evil twin,” ESA, 13 May 2019, URL: http://www.esa.int/spaceinimages/Images/2019/05/Earth_s_evil_twin
14) ”Martian soil detox could lead to new medicines,” ESA, 08 April 2019, URL: http://m.esa.int/Our_Activities/Space_Engineering_Technology/
Martian_soil_detox_could_lead_to_new_medicines
15) ”Mars Express matches methane spike measured by Curiosity,” ESA, 1 April 2019, URL: http://m.esa.int/Our_Activities/Space_Science/Mars_Express/
Mars_Express_matches_methane_spike_measured_by_Curiosity
16) Marco Giuranna, Sébastien Viscardy, Frank Daerden, Lori Neary, Giuseppe Etiope, Dorothy Oehler, Vittorio Formisano, Alessandro Aronica, Paulina Wolkenberg, Shohei Aoki, Alejandro Cardesín-Moinelo, Julia Marín-Yaseli de la Parra, Donald Merritt & Marilena Amoroso, ”Independent confirmation of a methane spike on Mars and a source region east of Gale Crater,” Nature Geoscience, ISSN 1752-0908, Published: 1 April 2019, https://doi.org/10.1038/s41561-019-0331-9
17) ”Dark dust devil tracks on Mars,” ESA, 28 March 2019, URL: http://m.esa.int/Our_Activities/Space_Science/Mars_Express/Dark_dust_devil_tracks_on_Mars
18) ”First evidence of planet-wide groundwater system on Mars,” ESA, 28 February 2019, URL: http://m.esa.int/Our_Activities/Space_Science/Mars_Express/
First_evidence_of_planet-wide_groundwater_system_on_Mars
19) Francesco Salese, Monica Pondrelli, Alicia Neeseman, Gene Schmidt, and Gian Gabriele Ori, ”Geological evidence of planet‐wide groundwater system on Mars,” Journal of Geophysical Research: Planets, https://doi.org/10.1029/2018JE005802, First published: 21 January 2019, URL: https://agupubs.onlinelibrary.wiley.com/doi/epdf/10.1029/2018JE005802
20) ”Signs of ancient flowing water on Mars,” ESA, 21 February 2019, URL: http://m.esa.int/Our_Activities/Space_Science/Mars_Express/Signs_of_ancient_flowing_water_on_Mars2
21) ”15 years of images from DLR's HRSC stereo camera on board ESA's Mars Express spacecraft,” DLR, 11 January 2019, URL: https://www.dlr.de/dlr/en/desktopdefault.aspx/tabid-10081/151_read-31742/year-all/#/gallery/33242
22) ”Fifteen years imaging the Red Planet,” ESA, 10 January 2019, URL: http://m.esa.int/spaceinvideos/Videos/2019/01/Fifteen_years_imaging_the_Red_Planet
23) ”Mars Express gets festive: A winter wonderland on Mars,” ESA, 20 December 2018, URL: http://m.esa.int/Our_Activities/Space_Science/Mars_Express/
Mars_Express_gets_festive_A_winter_wonderland_on_Mars
24) ”A winter wonderland in red and white – Korolev Crater on Mars,” DLR, 20 December 2018, URL: https://www.dlr.de/dlr/en/desktopdefault.aspx/tabid-10212/332_read-31614/#/gallery/33106
25) ”Mars awaits,” ESA, 25 November 2018, URL: http://m.esa.int/spaceinimages/Images/2018/11/Elysium_Planitia
26) ”Shaping the surface of Mars with water, wind and ice,” ESA Mars Express, 22 November 2018, URL: http://m.esa.int/Our_Activities/Space_Science/Mars_Express/
Shaping_the_surface_of_Mars_with_water_wind_and_ice
27) ”Extended life for ESA's science missions,” ESA Science & Technology, 14 November 2018, URL: http://sci.esa.int/director-desk/60943-extended-life-for-esas-science-missions/
28) ”A changing crater: Honoring a renowned Mars Scientist,” ESA Mars Express, 26 October 2018, URL: https://www.esa.int/Our_Activities/Space_Science/Mars_Express/
A_changing_crater_Honouring_a_renowned_Mars_scientist
29) ”Greeley Crater in context,” ESA, 26 October 2018, URL: http://m.esa.int/spaceinimages/Images/2018/10/Greeley_Crater_in_context
30) ”Mars Express plan view of Greeley Crater,” ESA, 26 October 2018, URL: http://m.esa.int/spaceinimages/Images/2018/10/Mars_Express_plan_view_of_Greeley_Crater
31) ”Topography of Greeley Crater,” ESA, 26 October 2018, URL: http://m.esa.int/spaceinimages/Images/2018/10/Topography_of_Greeley_Crater
32) ”Mars Express keeps an eye on curious cloud,” ESA Mars Express, 25 October 2018, URL: : http://sci.esa.int/mars-express/60878-mars-express-keeps-an-eye-on-curious-cloud/
33) ”Mars Express detects liquid water hidden under planet's south pole,” ESA Mars Express, 25 July 2018, URL: http://sci.esa.int/mars-express/60516-mars-express-detects-liquid-water-hidden-under-planets-south-pole/
34) R. Orosei, S. E. Lauro, E. Pettinelli, A. Cicchetti, M. Coradini, B. Cosciotti, F. Di Paolo, E. Flamini, E. Mattei, M. Pajola, F. Soldovieri, M. Cartacci, F. Cassenti, A. Frigeri, S. Giuppi, R. Martufi, A. Masdea, G. Mitri, C. Nenna, R. Noschese, M. Restano, R. Seu, ”Radar evidence of subglacial liquid water on Mars,” Science, 25 July 2018, eaar7268, DOI: 10.1126/science.aar7268, URL of abstract: http://science.sciencemag.org/content/early/2018/07/24/science.aar7268
35) ”From horizon to horizon: Celebrating 15 years of Mars Express,” ESA, 1 June 2018, URL: http://m.esa.int/Our_Activities/Space_Science/Mars_Express/
From_horizon_to_horizon_Celebrating_15_years_of_Mars_Express
36) ”Topography of Tharsis region on Mars,” ESA, 01 June, 2018, URL: http://m.esa.int/spaceinimages/Images/2018/06/Topography_of_Tharsis_region_on_Mars
37) ”Mars Express v2.0,” ESA, 11 April 2018, URL: http://m.esa.int/Our_Activities/Operations/Mars_Express_v2.0
38) ”Using PSUP: Viewing OMEGA data of Mars' surface emissivity,” ESA, 07 September 2018, URL: http://sci.esa.int/mars-express/59471-using-psup-viewing-omega-data-of-mars-surface-emissivity/
39) ”Mars Express: Tharsis Tholus, a collapsed 8000 m peak,” DLR Mars Express, 04 November 2011, URL: https://www.dlr.de/dlr/en/desktopdefault.aspx/tabid-10453/651_read-1654/year-2011/#/gallery/3479
40) ”Battered Tharsis Tholus volcano on Mars,” ESA Mars Express, 8 November 2011, URL: http://m.esa.int/Our_Activities/Space_Science/Mars_Express/Battered_Tharsis_Tholus_volcano_on_Mars
41) ”Mars Express — from worry, to water,” ESA, 02 August 2018, URL: http://blogs.esa.int/rocketscience/2018/08/02/mars-express-from-worry-to-water/
42) ”Water at Martian south pole,” ESA Mars Express, 17 March 2004, URL: https://www.esa.int/Our_Activities/Space_Science/Mars_Express/Water_at_Martian_south_pole
43) ”Mars Express sees its first water - scientific results,” ESA Press Release 06-2004, 23 January 2004, URL: https://www.esa.int/Our_Activities/Space_Science/Mars_Express/
Mars_Express_sees_its_first_water_scientific_results
44) ”Picture taken by the High Resolution Stereo Camera (HRSC) onboard ESA's Mars Express orbiter on 14 January 2004,” ESA, 19 January 2004, URL: https://www.esa.int/spaceinimages/Images/2004/01/Picture_taken_by_the_High_Resolution_
Stereo_Camera_HRSC_onboard_ESA_s_Mars_Express_orbiter_on_14_January_20042
45) ”A mesa on Mars - HRSC 14 January 2004,” ESA, 14 January 2004, URL: https://www.esa.int/spaceinimages/Images/2004/01/A_mesa_on_Mars_-_HRSC_14_January_2004
46) ”Valles Marineris - HRSC image 14 January 2004,” ESA, 14 January 2004, URL: https://m.esa.int/spaceinimages/Images/2004/01/Valles_Marineris_-_HRSC_image_14_January_2004
The information compiled and edited in this article was provided by Herbert J. Kramer from his documentation of: ”Observation of the Earth and Its Environment: Survey of Missions and Sensors” (Springer Verlag) as well as many other sources after the publication of the 4th edition in 2002. - Comments and corrections to this article are always welcome for further updates (eoportal@symbios.space).