MicroASAR
Airborne Sensors
MicroASAR and SlimSAR Instruments on UAS (Unmanned Aircraft Systems)
The MicroASAR and SlimSAR are small, low-cost, SAR (Synthetic Aperture Radar) systems that represent a new advancement in high-performance SAR applications. A collaborative team of BYU (Brigham Young University) of Provo, UT, USA and Artemis Inc. of Spanish Fork, UT and Hauppauge, NY, has employed a unique design methodology that exploits previous developments in designing the MicroSAR and SlimSAR instruments to be smaller, lighter, and more flexible while consuming less power than typical SAR systems. 1) 2) 3)
The compact MicroASAR builds on the design of the µSAR instrument of BYU, .but is a much more robust and flexible system. The C-band MicroASAR is a complete, self-contained SAR system that has been designed specifically to be small and lightweight while still being robust and capable. These characteristics make it an ideal SAR system for use on UAS (Unmanned Aircraft Systems) and other small aircraft.
With UAS being used more and more frequently in military, civilian, and scientific applications, providing remote-sensing, surveillance, reconnaissance, and environmental monitoring capabilities, the suite of suitable sensors available is expanding. However, in past years the utility of small enough and low-mass SAR instruments in UAS was beyond the reach of the available technology.
MicroASAR Instrument
MicroASAR uses the LFM-CW (Linear Frequency Modulated-Continuous Wave) chirp signal to maximize SNR with a low-power transmitter. The LFM-CW chirp is generated by a DDS (Direct Digital Synthesizer) chip. By maximizing the pulse length, an LFM-CW system is able to maintain a high SNR while transmitting with a lower peak power than a comparable pulsed SAR. The return signal is mixed with a copy of the transmitted signal giving the difference in frequency. The frequency difference corresponds directly to the slant-range to a target. The bandwidth of the dechirped signal is much less than the bandwidth of the transmitted signal, so the required sample rate is lower, simplifying the hardware design.
Although the µSAR used a frequency-modulation scheme that ramps up then down, with each up-down cycle comprising one pulse repetition, the MicroASAR’s chirp ramps in a single direction only in order to more easily achieve high PRFs (Pulse Repetition Frequencies). The DDS needs a few clock cycles to reset between chirps, which means that while the MicroASAR is effectively an LFM-CW radar, its transmit waveform is not strictly continuous wave (CW). Nevertheless, the benefits of LFM-CW are realized in this configuration.
Since a CW SAR system is constantly transmitting, a bistatic configuration with a separate antenna for the receive channel is used to maximize transmit-receive isolation. An undesirable side effect of bistatic, LFM-CW SAR is feedthrough between the transmit and receive antennas. This relatively strong feedthrough component dominates the low end of the dechirped spectrum and must be removed before final processing. It is desirable to remove the feedthrough component as early as possible in order to minimize the required dynamic range at the receiver and ADC (Analog-to-Digital Converter), which would otherwise need to handle both the strong feedthrough and the weak radar returns.
Feedthrough removal can be accomplished at baseband by utilizing a highpass filter with a very low cutoff frequency, but this type of filter generally has a very long impulse response, which leads to degradation of the filtered signal. The MicroASAR removes the feedthrough component after dechirping with a SAW-BPF (Surface Acoustic Wave Band-Pass Filter) centered at 500 MHz. The SAW-BPF was selected for this purpose because of its high performance and ready availability. To accomplish the feedthrough removal, the frequency of the crystal oscillator, from which all signals are generated, is chosen so that the feedthrough component in the dechirped signal is mixed down to the first null of the BPF. This feedthrough removal scheme is illustrated in Figure 1.
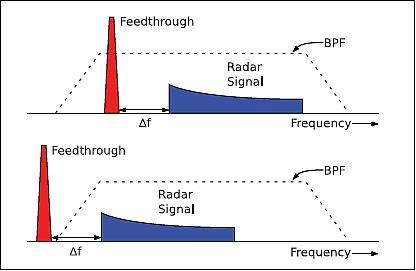
Legend to Figure 1: A BPF is used to filter the feedthrough component by shifting the spectrum down. Δf is the frequency representation of the distance between the platform and the ground.
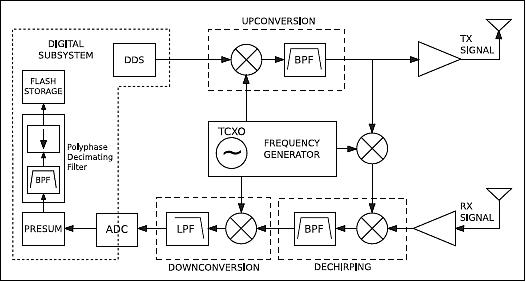
Legend to Figure 2: All clocks and signals are derived from the TCXO (Temperature Compensated Crystal Oscillator).
The capabilities of the MicroASAR have been calculated over a range of different operating conditions. Calculated swath width versus altitude for a range of velocities is displayed in Figure 3. These results are summarized in Table 1 along with system specifications.
Physical specifications | |
Transmit power | 30 dBm |
Supply power | < 35 W |
Supply voltage | +15 to +26 VDC |
Instrument dimensions | 22.1 cm x 18.5 cm x 4.6 cm |
Instrument mass | 2.5 kg |
Total instrument mass | < 3.3 kg (including enclosure and antennas) |
Radar parameters | |
Modulation type | LFM-CW |
Operating frequency band | C-band |
Transmit center frequency | 5428.76 MHz |
Signal bandwidth | 80-200 MHz (variable) |
PRF (Pulse Repetition Frequency) | 7-14 kHz (variable) |
Radar operating specifications | |
Theoretical resolution |
|
Operating altitude |
|
Swath width (max) |
|
Operating velocity |
|
Collection time (for 10 GB) |
|
Antennas (2 required) | |
Type | 2 x 8 patch array |
Gain | 15.5 dB |
Beamwidth | 8.5º x 50º |
Size | 35 cm x 12 cm x 0.25 cm |
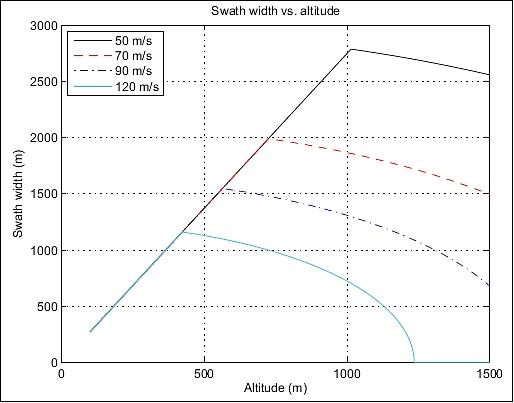
Legend to Figure 3: The linear first portion of the plot is limited by an antenna 3 dB beamwidth of 50º, the second portion is limited by a maximum storage rate of 5 MByte/s. The swath width may be increased by increasing the storage rate.
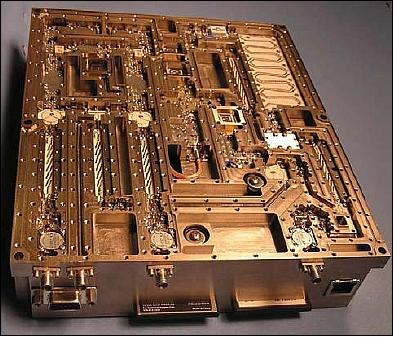
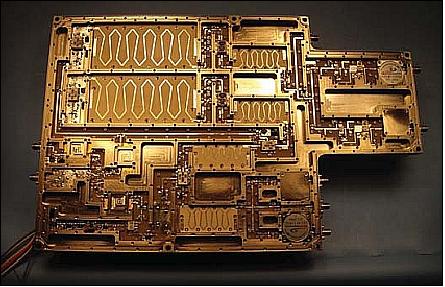
Legend to Figure 4: Also pictured is the front panel containing RF ports, flash memory cards, serial and Ethernet connections. The hardware solution provided by Artemis, is robust enough to withstand the rigors of airborne applications while still being small and lightweight.
MicroASAR hardware: The MicroASAR is completely contained in one aluminum enclosure measuring 22.1 cm x 8.5 cm x 4.6 cm. The enclosure is designed to minimize spurious emissions, self-interference, and interference from outside sources. Despite its solid metal enclosure, the entire system, including two antennas, has a mass of less than 3.3 kg. Its lightweight design makes it suitable for aircraft with payload restrictions, such as UAVs (Unmanned Aerial Vehicles).
A simplified block diagram showing the functions of the major signal paths is given in Figure 2. To maintain phase coherence, all signals and clocks are derived from a single TCXO (Temperature Compensated Crystal Oscillator) which has been tuned specifically so that the feedthrough component can be removed. The DDS generates the LFM chirp, which is then upconverted, amplified, and transmitted. A copy of this transmitted chirp is frequency-shifted and mixed with the received signal to produce the dechirped signal. The dechirped signal is then downconverted to an offset video frequency and sampled. The MicroASAR actually has two receive channels to support interferometric operation.
The digital subsystem for the MicroASAR contains the DDS chip which is used to generate the LFM chirp, a high-speed 500 Msample/s ADC, and a Virtex 4 FPGA. The FPGA is used to control the other chips, as well as to perform simple, prestorage processing such as presumming and filtering. Because the dechirped radar data is sampled at an offset video frequency, it is necessary to filter and downsample in order to obtain baseband data for storage. A digital bandpass filter performs the dual task of reducing quantization noise and limiting the bandwidth of the dechirped signal so that it will not alias destructively.
This filter/decimate operation is accomplished by way of a polyphase decimating filter. The decimation is designed so that an aliased copy of the signal ends up at baseband, eliminating the need for a separate mixing operation. After the data has been presummed, filtered, decimated, and low-pass filtered, the baseband signal is either written to two flash memory cards, which are accessible through the front panel of the system, or streamed over Ethernet.
Deployment of the MicroASAR Instrument in CASIE-09
The MicroASAR was used on the NASA SIERRA (Science Instrumentation Environmental Remote Research Aircraft) UAS of NASA during a science field campaign in 2009 to study sea ice roughness and break-up in the Arctic and high northern latitudes. This mission is known as CASIE-09 (Characterization of Arctic Sea Ice Experiment 2009). 4) 5)
The purpose of the CASIE mission is to determine the degree to which ice-roughness monitoring via remote sensing can detect basic changes in ice conditions such as ice thickness and ice age, to investigate relationships between ice roughness and factors affecting the loss or maintenance of the perennial ice cover, and to determine how roughness varies as a function of different kinematic conditions and ice properties.
CASIE combines the use of a variety of remote sensing methods, including satellite observations and UAS (Unmanned Aircraft Systems), to provide fundamental new insights into ice roughness on the scale of meters to tens of meters in the context of larger-scale environmental forcing. In addition, the mission offered a technological and operational testbed to demonstrate the value of autonomous vehicles for long-range, long-duration remote sensing science. Five science flights covering 2923 km of sea ice were flown in July 2009.
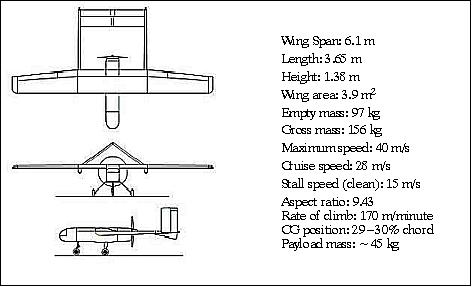
The SIERRA UAS is an ideal platform for the MicroASAR. With a relatively large payload capacity, efficient mission planning software, and in-flight programmable autopilot, the SIERRA is perfect for a variety of data gathering missions. The SIERRA UAS is of particular value when long duration flights preclude a human pilot, or where remoteness and harshness of the environment puts pilots and manned aircraft at risk. A combination of sensors can be carried that would be too large and heavy to deploy on a single, smaller UAS. This large payload was critical in meeting the need for simultaneously acquired sea ice observations from multiple sensors. The ice pack in Fram Strait is highly dynamic, with fast ice drift and potential for ridging and rafting, so simultaneous multi-sensor observation is critical.
For the CASIE mission, the SIERRA payload consisted of:
• Laser altimeter/surface height profiler (non-scanning) system consisting of two lasers acquiring simultaneous but laterally offset laser tracks, GPS, inertial measurement unit, and payload computer.
• Imaging synthetic aperture radar (the MicroASAR) with video camera.
• Three digital cameras.
• Up-looking and down-looking broadband shortwave radiation pyranometers
• Up-looking and down-looking shortwave spectrometers.
• Down-looking temperature sensors (pyrometers).
• Temperature/Rh sensors.
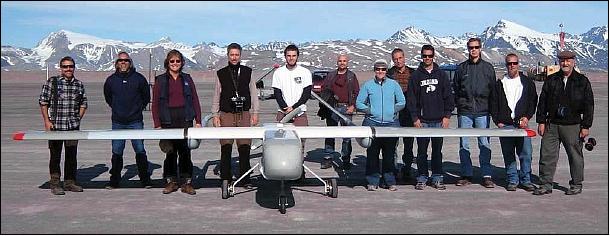
The CASIE mission was conducted as a data collection effort in support of the IPY (International Polar Year) project titled “Sea Ice Roughness as an Indicator of Fundamental Changes in the Arctic Ice Cover: Observations, Monitoring, and Relationships to Environmental Factors”, supported by the NASA Cryospheric Sciences and led by the PI (Principal Investigator) James Maslanik of the University of Colorado.
The project included scientists, engineers and students from the University of Colorado, Brigham Young University, Fort Hays State University and NASA/JPL (Jet Propulsion Laboratory) working together with research aviation specialists from NASA/ARC (Ames Research Center).
CASIE contributed to the overall project by providing an unprecedented suite of high-resolution data over a range of sea ice conditions within the Fram Strait region between northern Greenland and Svalbard. These data include surface topography observations, standard electro-optical (EO) imagery, SAR imagery, and surface reflectance and surface temperature measurements. NASA deployed the SIERRA with the MicroASAR on-board, along with a ground control station, a science team, and an operation and logistics team to collect science data in and around the Svalbard archipelago of Norway in July 2009.
Flights of the SIERRA took place from Ny-Alesund, Svalbard. This location was selected because it provides access to ice with a range of thicknesses, age, and ridging characteristics within acceptable flight range of the UAS. The SIERRA typically flew to the north and northwest, passing over open ocean and the marginal sea ice zone to target the variety of thick, old ice within the Fram Strait ice outflow region. Once over the desired ice conditions, most of the flight patterns involved closely spaced, adjacent flight tracks to provide mapping coverage. A total of five flights were conducted in the period July 16-29, 2009 covering a total distance of 2923 km of sea ice flown.

SlimSAR Instrument
The SlimSAR instrument of Artemis shares many of the features of the MicroASAR design, but has a number of improvements. There are LFM-CW and traditional pulsed versions of the SlimSAR, each designed for multi-frequency operation. The L-band SlimSAR core is a self-contained radar system with a mass of only 2.8 kg; it consumes < 150 W including a built-in motion measurement system.
Additional frequency bands are made available by using a block frequency converter with a mass of 0.9 kg; it consumes about 32 W for each additional frequency. The current test set-up has UHF and X-band capability, with additional bands in development. Add-ons to the system include a miniature data link and a gimbal for high-frequency antennas (Ref. 1). 6) 7)
Delayed mix-down chirp: The LFM-CW version of the SlimSAR sidesteps the range limitation imposed by the direct-dechirp of the MicroASAR. The system does this by using two DDS (Direct Digital Synthesizers) which generate identical SAR signals, with one delayed by the time of flight to the closest range of the desired imaging area. When the received signal is mixed with this second chirp, the bandwidth is reduced, lowering the sampling requirements, as with the direct dechirp. The difference is that with our delayed mixdown chirp we can increase the width of the imaged area while using the same sampling bandwidth.
The swath width is constrained by a number of inter-related factors:
1) The width of the intermediate frequency filter
2) The chirp rate and chirp bandwidth
3) The pulse-repetition frequency and antenna beamwidth
4) The platform altitude (AGL)
5) The maximum data rate
6) The mix-down chirp delay.
System design: The core of the system is the L-band portion. An FPGA controls the variable system parameters making sure the DDSs, the ADC, and the data storage are all working together. The DDSs generate the SAR signals which are up-converted to L-band (at different frequencies). The signal is either transmitted through the L-band antenna or frequency-converted (to X-band or any other desired frequency) in one of the frequency block converters, amplified, and transmitted through the appropriate antenna.
The receive signal is amplified, and in the case of the X-band signal, down-converted to L-band. The signal is mixed with the delayed second chirp, offset in frequency, which de-chirps the signal at an intermediate frequency. A SAW bandpass filter with large out-of-band rejection removes the antenna feed-through and signal returns from outside the target area. The reduced bandwidth signal is mixed-down and digitized. The digital signal is streamed via Ethernet to either on-board storage, the data-link, or an on-board processor. Range-Doppler, frequency-scaling, and backprojection algorithms have been developed for processing the data. The back-projection algorithm allows for non-linear flight paths (i.e. circular).
The SlimSAR supports a contiguous signal bandwidth of up to 660 MHz. To accommodate restrictions in very heavily utilized spectrum bands, the bandwidth and center frequency can be adjusted and notches added. Artemis operates with experimental FCC (Federal Communications Commission) licenses at 1257.5 MHz with 85 MHz bandwidth, two X-band frequency bands, and two Ku-band frequency bands.
The built in solid-state power amplifier is designed to output 4 W continuous peak power for the LFM-CW model and 25 W peak for the pulsed version, sufficient for the operational altitudes of 1500-2500 m AGL (Above Ground Level). The system is flexible, and adding an external power amplifier can maintain higher SNR at greater altitudes. The system is also capable of transmitting and receiving horizontal and vertical polarization for polarimetric operation.
Supporting components: There are several important subsystems which support the generation and exploitation of high-quality SAR imagery. The SlimSAR includes a built-in motion measurement system. A gimbal for small high-frequency antennas is also available. A Gbit Ethernet interface allows for the integration of a data-link for transferring the raw data to a ground station where it can be processed in near real time. The data is also stored in the 128 GB of on-board solid state storage, which is enough to record several hours of continuously collected SAR data, depending on the data rate. An on-board processor is in the works, which will provide real-time image formation for limited swath widths, and near real-time imaging for wider area coverage.
The motion measurement subsystem includes high-precision GPS receiver and an IMU (Inertial Measurement Unit). To obtain high-precision inertial measurements while minimizing the necessary payload weight, 3-axis accelerometers and fiberoptic gyroscopes are integrated into the SlimSAR enclosure, eliminating the need for an extra enclosure.
Additionally, at X-band (and other high-frequency bands) the antennas use a gimballed pointing system because they have a narrow beamwidth. Data from the GPS/IMU system is fed in real time to a two-axis gimbal which controls the elevation and azimuth pointing angles of the antennas, keeping the antennas pointing perpendicular to the flight path even when the aircraft may be flying at an angle to account for wind. The gimbal allows the X-band antennas to rotate 270º, enabling the use of SlimSAR in spotlight mode and GMTI (Ground Moving Target Indicator) mode.
The SlimSAR instrument has been flown in a variety of locations. In Figure 9, an area at the north end of Spanish Fork, Utah is imaged with the pulsed version of the SlimSAR. In Figure 10, sample multi-frequency imagery from the LFM-CW SlimSAR and the MicroASAR, collected near Everett, WA, is shown.
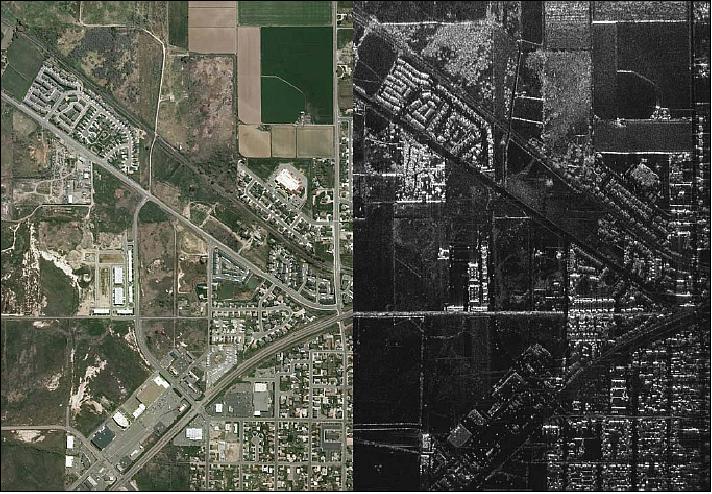
Legend to Figure 9: The left side shows an optical photograph of an area at the north end of Spanish Fork, UT. At right an 85 MHz bandwidth, pulsed, HH-polarized, L-band SlimSAR image is shown. The scene is illuminated from the top and measures 1.45 km x 2 km.
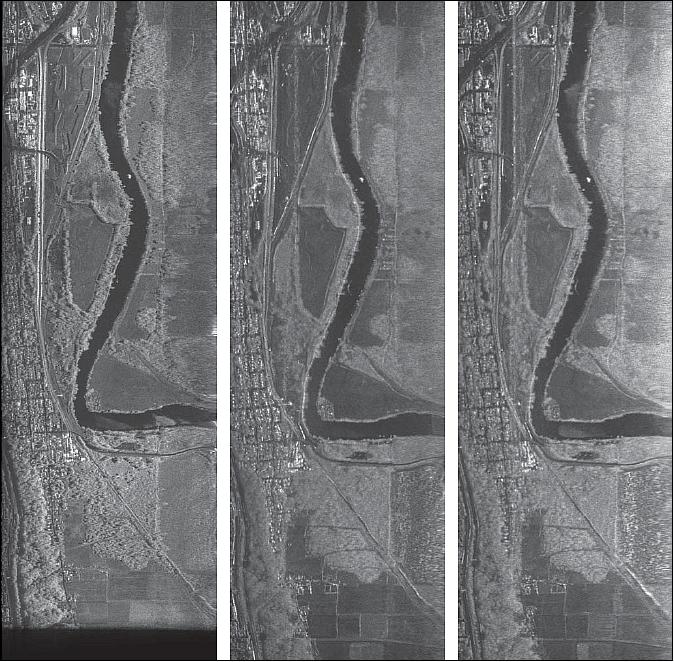
Legend to Figure 10: The leftmost image is a C-band MicroASAR image with a range resolution of 88 cm. The center image is an L-band HH-polarized SlimSAR image with the rightmost being L-band VV-pololarized SlimSAR image. The SlimSAR L-band images have a range resolution of 1.76 m, corresponding to the 85 MHz bandwidth. The area shown is 1.4 km wide by 4.2 km in length. The scene is illuminated from the right
References
1) Evan Zaugg , Matthew Edwards, David Long, Craig Stringham, “Developments in Compact High-Performance Synthetic Aperture Radar Systems for Use on Small Unmanned Aircraft,” 2011 IEEE Aerospace Conference, Big Sky, MT, USA, March 5-12, 2011
2) Matthew Edwards, David Madsen, Craig Stringham, Alex Margulis, Brandon Wicks,David G. Long, “MicroASAR: A Small, Robust LFM-CW SAR for Operation on UAVs and Small Aircraft”, Proceedings of IGARSS (International. Geoscience and Remote Sensing Symposium), Boston, MA, USA, July 6-11,, 2008, URL: http://www.mers.byu.edu/yinsar/papers/IGARSS2008Edwards.pdf
3) Evan C. Zaugg, David G. Long, “Full Motion Compensation for LFM-CW Synthetic Aperture Radar,” Proceedings of IGARSS 2007 (International Geoscience and Remote Sensing Symposium), Barcelona, Spain, July 23-27, 2007, URL: http://www.mers.byu.edu/yinsar/papers/IGARSS2007_Zaugg.pdf
4) Evan Zaugg, David Long, Matthew Edwards, Matthew Fladeland, Richard Kolyer , Ian Crocker, James Maslanik, Ute Herzfeld, Bruce Wallin, “Using the MicroASAR on the NASA SIERRA UAS in the Characterization of Arctic Sea Ice Experiment,” 2010 IEEE International Radar Conference, Arlington, VA, USA, May 10-14, 2010, URL: http://www.mers.byu.edu/long/papers/conf/RadarCon2010.pdf
5) David G. Long, Evan Zaugg, Matthew Edwards, James Maslanik, “The MicroASAR Experiment on CASIE-09,” Proceedings of IGARSS (IEEE International Geoscience and Remote Sensing Symposium) 2010, Honolulu, HI, USA, July 25-30, 2010, URL: http://www.mers.byu.edu/yinsar/papers/IGARSS2010_CASIE2.pdf
6) Evan C. Zaugg, Matthew C. Edwards, Alex Margulis, “The SlimSAR: A Compact, Flexible, High-Performance, Polarimetric, Multi-Band SAR for Operation on a Small UAS,” Proceedings of EUSAR 2010, 8th European Conference on Synthetic Aperture Radar, June 7-10, 2010, Aachen, Germany
7) Evan Zaugg, Matthew Edwards, Alex Margulis, “Developing a small multi frequency synthetic aperture radar for UAS operation: the SlimSAR,” Proceedings of SPIE, 'Radar Sensor Technology,' Kenneth I. Ranney; Armin W. Doerry (editors), Volume: 7669, Orlando, FLA, USA, April 5-9,, 2010, DOI: 10.1117/12.850207
The information compiled and edited in this article was provided by Herbert J. Kramer from his documentation of: ”Observation of the Earth and Its Environment: Survey of Missions and Sensors” (Springer Verlag) as well as many other sources after the publication of the 4th edition in 2002. - Comments and corrections to this article are always welcome for further updates (eoportal@symbios.space).