DebriSat - A destructive Laboratory Test of a Satellite
Non-EO
Technology and Research
Quick facts
Overview
| Mission type | Non-EO |
DebriSat - A destructive Laboratory Test of a Satellite
Spacecraft Impact Test Automated Imaging References
The DebriSat project is a collaboration among NASA, the USAF (U.S. Air Force), The Aerospace Corporation, and the University of Florida for laboratory-based hypervelocity impact experiments on a representative, modern LEO satellite and an upper stage mockup. The objective is to characterize the physical properties of impact fragments to improve satellite breakup models and space situational awareness. 1)
The DebriSat project will update and expand upon the information obtained in the 1992 SOCIT (Satellite Orbital Debris Characterization Impact Test), which characterized the breakup of a 1960's US Navy Transit satellite. There are three phases to this project: the design and fabrication of DebriSat - an engineering model representing a modern, 60 cm/50 kg class LEO satellite; conduction of a laboratory-based hypervelocity impact to catastrophically break up the satellite; and characterization of the properties of breakup fragments down to 2 mm in size.
The data obtained, including fragment size, area-to-mass ratio, density, shape, material composition, optical properties, and radar cross-section distributions, will be used to supplement the DoD's and NASA's satellite breakup models to better describe the breakup outcome of a modern satellite.
A key element to provide good short- and long-term OD (Orbital Debris) environment definition and OD impact risk assessments for critical space assets is the ability to reliably predict the outcome of a satellite breakup. The two major classes of satellite breakups are explosions and collisions. Before the anti-satellite test on the FengYun 1-C (FY-1C) weather satellite by China in 2007, the fragmentation debris population was almost all generated by explosions. After the FY-1C event and the collision between Iridium 33 and Cosmos 2251 in 2009, the numbers of the catalogued explosion fragments and collision fragments were about equal. Based on various modelling projection studies of the debris environments in low Earth orbit (LEO, the region below 2000 km altitude), collision fragments are expected to dominated the environment in the future – a phenomenon known as the "Kessler Syndrome" and predicted by Kessler and Cour-Palais in 1978. 2)
Background: A satellite breakup model consists of three fundamental components – fragment size, A/M (Area-to-Mass ratio), and relative velocity (ΔV) distributions. The fragment size distribution quantifies the amount of fragments generated from the event and the ΔV distribution specifies the initial spread of the fragment cloud. The A/M distribution determines the solar radiation pressure and atmospheric drag perturbations on the fragments. The latter is directly related to the orbital lifetimes of fragments below about 1000 km altitude. These three components provide the key information to model the orbital evolution of fragments and their short and long-term distributions, including spatial density, velocity distribution, and flux, in the near-Earth environment. For spacecraft (S/C) OD impact damage assessments, additional information, such as the shape and material density of the impacting debris, is needed to improve the reliability of the assessments.
The U.S. Space Surveillance Network (SSN) provides tracking data and maintains a catalog for the large objects in the near-Earth space. The size limits for the catalogued objects are about 10 cm in LEO and about 1 m in the geosynchronous region. The size information of a tracked debris can be inferred from its RCS (Radar Cross Section). The A/M of a LEO debris below 1000 km altitude can also be estimated based on the atmospheric drag perturbations on its orbital history.
For smaller debris, however, no such data exist. Because of the high impact speed in LEO (with an average of 10 km/s), even a sub-millimeter debris could be a safety concern for human space activities and robotic missions. Laboratory-based satellite impact experiments, therefore, are necessary to provide data for the physical properties of fragments smaller than 10 cm.
To characterize the outcome of a satellite collision and the properties of the generated fragments, the DoD (Department of Defense) and NASA conducted several series of laboratory impact tests in the 1980's and the early 1990's. One of the test series, the SOCIT (Satellite Orbital Debris Characterization Impact Test), led to a key laboratory-based dataset used in the development of the current NASA and DoD satellite breakup models. 3)
These models have been used for various orbital debris applications for more than 10 years. The target used for SOCIT was a flight-ready Navy Transit navigation satellite (46 cm diameter by 30 cm height, 34.5 kg) fabricated in the 1960's. As materials, components, and construction techniques for satellite design and fabrication continue to advance, there is a need to conduct new impact experiments on targets more representative of the modern satellites. The data can be used to supplement the existing models to better describe the breakup outcome of a modern satellite.
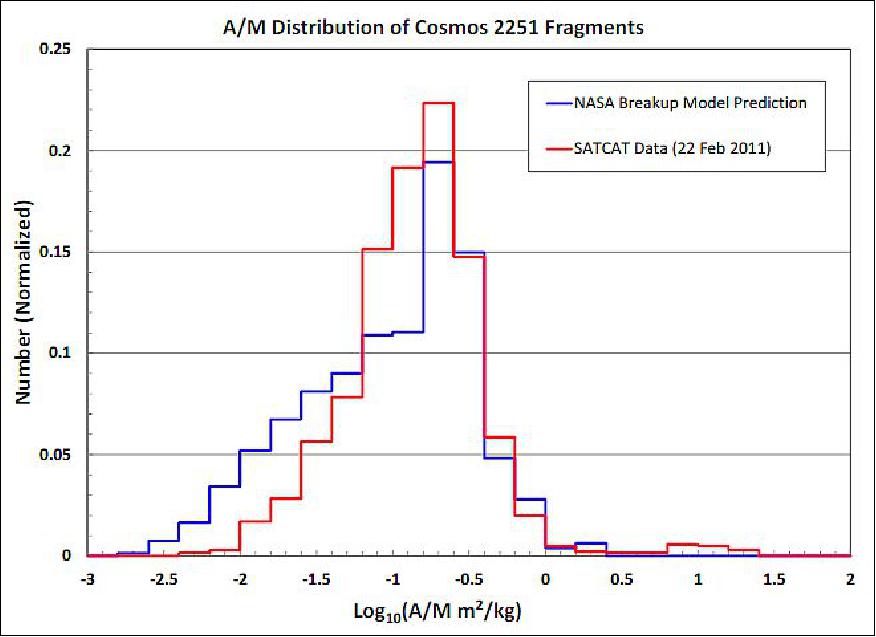
The justification for a new impact experiment is also supported by the FY-1C destruction and the collision between Cosmos 2251 and Iridium 33. Cosmos 2251 was an older satellite while Iridium 33 and the target for the ASAT test, FengYun-1C weather satellite, were relative modern. The U.S. SSN data have indicated that Cosmos 2251 fragments are well-described by the NASA standard satellite breakup model, as indicated by the comparison in Figure 1. 4)
DebriSat Spacecraft
The effort to conduct an impact experiment on a new target satellite, the DebriSat, was initiated by the NASA ODPO (Orbital Debris Program Office) in 2011. The responsibilities of the ODPO are to provide project and technical oversight and lead the efforts for data collection, analyses, and NASA model improvements.
The DebriSat project is co-sponsored by the Air Force's SMC (Space and Missile Systems Center). The SMC team provides technical oversight, supports data analyses, and leads the effort for DoD model improvements. The design and fabrication of DebriSat are led by UF (University of Florida) with subject matter experts' support provided by the Aerospace Corporation. The UF team also leads the post-impact fragment collection and measurements. The hypervelocity impact destruction of DebriSat will be conducted at the AEDC (Arnold Engineering Development Complex) of the USAF, located at Arnold AFB, Tennessee. 5)
Design of DebriSat
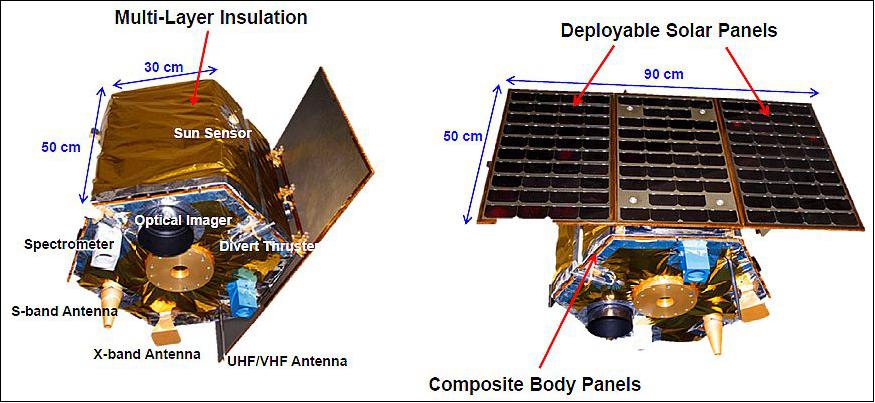
DebriSat is intended to be representative of modern LEO satellites. To achieve traditional improvements over the SOCIT test series, DebriSat is 45% more massive than Transit. It is also covered with MLI and equipped with deployable solar panels. Table 1 provides a comparison between DebriSat and Transit.
Parameter | Transit (SOCIT) | DebriSat |
Target body size | Diameter: 46 cm, height: 30 cm | Diameter: 60 cm, height: 68 cm |
Target mass | 34.5 kg | 50 kg |
MLI, solar panel | No | Yes |
Projectile material | Al sphere | Al sphere |
Projectile diameter, mass | 4.7 cm, 150 g | 5 cm, 176 g |
Impact speed | 6.1 km/s | 7 km/s |
Impact Energy to Target Mass ratio (EMR) | 78 J/g | 86 J/g |
The design of DebriSat started with a survey of LEO satellites launched between 1997 and 2011. Based on the availability of the data, 50 representative satellites were selected for analysis. Common subsystem, materials, mass fractions, structure, and construction methods of the sample satellites were identified. DebriSat includes seven major subsystems -ADCS (Attitude Determination and Control Subsystem), C&DH (Command and Data Handling), EPS (Electrical Power Subsystem), payload, propulsion, TT&C (Telemetry Tracking and Command), and thermal management.
The ADCS subsystem includes two star trackers, four sun sensors, one inertial measurement unit, one magnetometer, the magnetorquers, four reaction wheels, and one avionics module. The C&DH subsystem includes a flight computer, one data recorder, and cables inside shielded boxes. The EPS includes mock-up batteries, one power management and distribution module, and three deployable solar panels (30 cm x 50 cm each). The DebriSat payloads consist of two spectrometers and one optical imager. The propulsion subsystem includes one COVP (Composite Overwrapped Pressure Vessel), three thruster pairs, and one plumbing system. This is based on the assumption that future payloads will be in compliance with the post-mission passivation guideline adopted by the international community. The TT&C includes on S-band antenna, one X-band antenna, two UHF/VHF omnidirectional antennas, and avionics boxes. The thermal management subsystem is based on the capillary pump loop design. It includes one thermal reservoir, heat pipes, Kapton heaters. MLI (Multi-Layer Insulation) will also be used to wrap some components and cover most of the exterior of DebriSat.
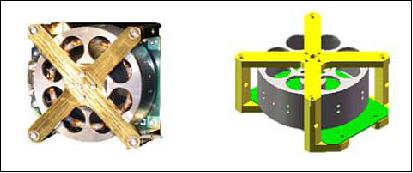
To reduce the cost of the project, a decision was made to emulate the majority of the components. The emulated components were based on existing designs of flight hardware, including dimensions, materials, and connection mechanisms. The designs of the emulated components were reviewed by subject matter experts to ensure the quality of the products. For example, the DebriSat design includes four reaction wheels in the ADCS. One of them was acquired from Sinclair Interplanetary while the other three were emulated based on the design of the first one (Figure 3). In addition to the subsystems, flight quality cables, harnesses, and connectors were obtained from a cancelled DoD satellite project for the fabrication of DebriSat.
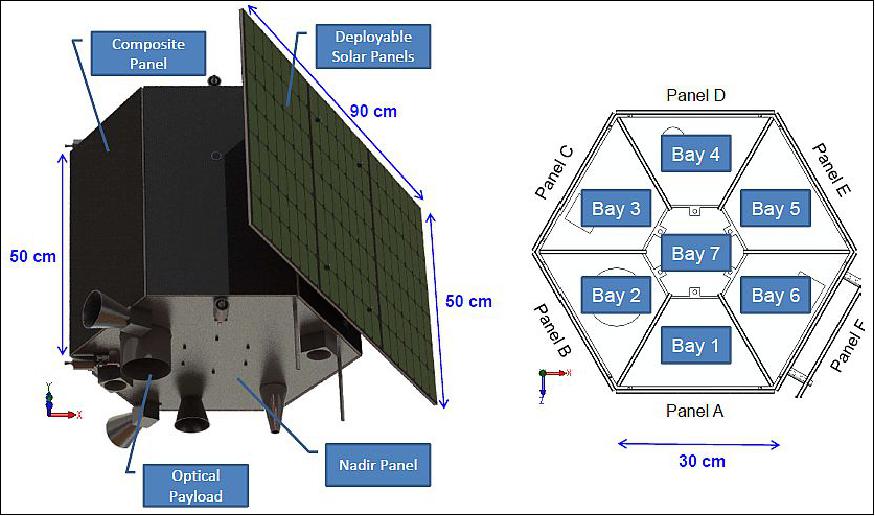
The shape of the DebriSat main body is a hexagonal prism, as shown in Figure 4. The structure includes two aluminum top and bottom hexagonal panels, six composite side panels and six ribs made of carbon fiber face sheets and aluminum honeycomb cores, and six aluminum longerons. Three deployable solar panels are mounted to one side of the main body. The detailed layout and the locations of the major components are shown in Figure 5.
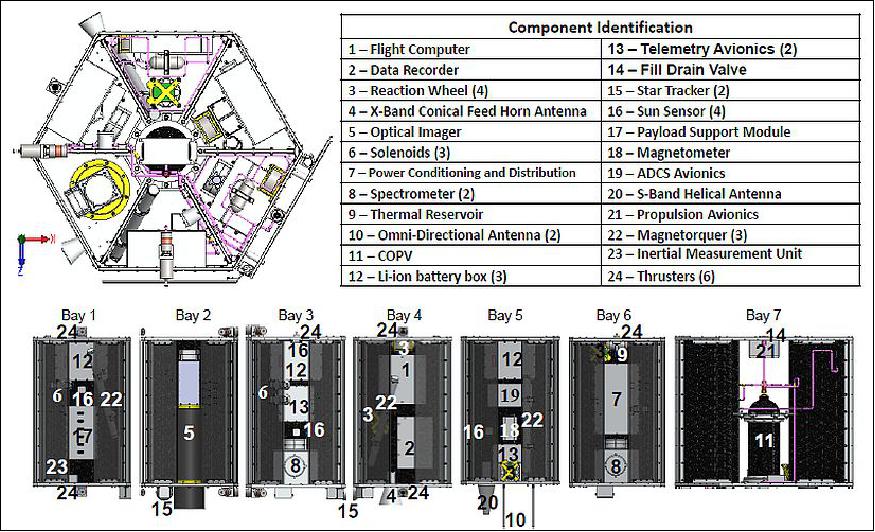
To ensure the integrity of the structure, the subsystems, and the mounting mechanisms, load analyses were performed. In addition, vibration and thermal vacuum tests are planned for DebriSat after its complete fabrication.
Hypervelocity Impact Facility at AEDC (Arnold Engineering Development Complex)
Previous laboratory-based hypervelocity impact tests have indicated that when the impact kinetic energy to the target mass ratio (EMR) is 40 J/g or higher, the outcome of the impact is catastrophic - meaning the target is completely fragmented into tens of thousands of pieces. Similar to the SOCIT tests, to exceed this EMR threshold for DebriSat, the hypervelocity impact has to be carried out at the AEDC facility.
The AEDC Range G Complex maintains and operates the largest two stage light gas gun in the United States. The range has several launchers capable of accelerating 500 g projectiles up the 7 km/s or 15 kg projectiles up to 3 km/s. The target is placed inside the 3 m diameter cylinder range tank (Figure 6). The projectile selected for DebriSat impact is an aluminum sphere with a minimum diameter of 5 cm and a mass of 176 g. The impact speed is planned for 7 km/s. The expected EMR is 86 J/g.
The Range G launcher is a two-stage, light-gas gun that is capable of launching various types of projectiles at velocities up to 7 km/s. The facility is routinely launches projectiles at velocities between 3-6 km/s. Projectiles up to 203 mm in diameter are launched into a 3 m diameter, 283.5 m long instrumented tank that can be maintained at pressures from 0.2 torr to 1.7 atmospheres. The launcher started test operations in 1962 at 63.5 mm diameter, but has been significantly upgraded over the years to launch larger masses at high velocities and lower peak acceleration loads. Currently the facility has three sizes of interchangeable barrels: 84 mm , 102 mm, and 203 mm.

The range tank is equipped with several diagnostic instruments. They include X-ray systems with 2 µs intervals between frames, high speed CCD cameras, and options for additional systems, such as laser, to record the impact process and to potentially collect data for ΔV measurements for some of the fragments immediately after the impact. An option to install low-mass piezoelectric sensors inside DebriSat to measure the propagation of shockwaves during breakup is also being considered.
Low density foam panels will be installed inside the target range as illustrated in Figure 7. The purpose is to "soft catch" fragments after the impact and to protect the chamber. Polyurethane from stacks, consisting of panels of different densities (0.06, 0.096, and 0.192 g/cm3) and with a total thickness of up to 25 cm, were used during the SOCIT test series. For DebriSat, new foam materials and configuration will be adopted to capture fragments, reduce damage to the fragments, and to allow for easy extraction of fragments from the panels for post-test measurements. 7)

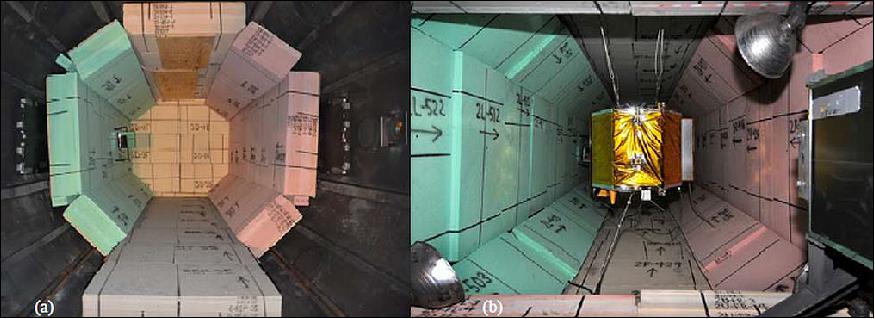
Legend to Figure 8: DebriSat is a non-functional, full-scale representation of a modern satellite. The satellite was designed and fabricated by the University of Florida and supplied to AEDC for destruction. 8) -I n addition to the DebriSat, AEDC Range G also helped the DoD, NASA and the Aerospace Corporation perform hypervelocity impact experiments involving an upper stage of a launch vehicle dubbed "DebrisLV" and a spacecraft protection device commonly called a Whipple Shield. Cooperative work between AEDC and the test customers allowed these additional test articles to be installed for the two facility checkout runs prior to the DebriSat test.
• Pre-test foam panel placement is displayed in this DebriSat before impact photo (Figure 8)
• Low-density polyurethane foam panels , each < 5 cm thick were installed inside target chamber one on top of the other (the most dense panel on the bottom)
• Panel colors indicate position in the chamber only
• Wide panels were placed horizontally and vertically
• Narrow panels were placed at 45deg to allow nearly full coverage of the interior of the chamber
• A 30º debris cone spread was expected by the operators to the end of the chamber
DebriSat Impact Test
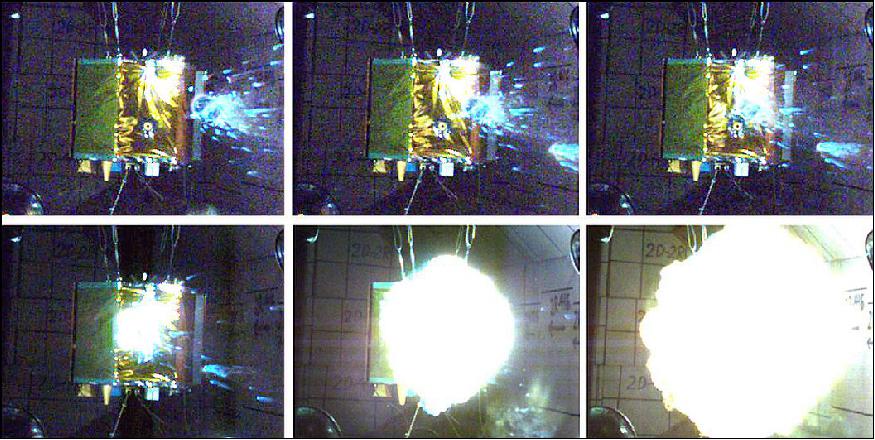
The DebriSat impact test was successfully carried out at AEDC Range G on 15 April, 2014. Figure 9 illustrates the impact sequences of DebriSat. Portions of the rear nylon cap fragmented and trailed the aluminum cylinder during flight, but this did not affect the planned catastrophic outcome of the impact. 9) 10)
Instrument | Organization | Description | Purpose/Comments |
150 kV Flash X-ray | AEDC | Dual-headed, orthogonally-mounted X-ray system. | Determines exact projectile position for velocity calculations and ensures projectile integrity. Performed satisfactorily during test operations. |
450 kV Flash X-Ray | AEDC | Dual-headed, orthogonally-mounted X-ray system. | Used to obtain two singe frame images of impact debris formation. Some image quality issues. |
Phantom Digital Cine Cameras | AEDC/NASA | 3 Phantom v7.1 cameras; | Recorded the condition of the projectile just prior to impact and at various stages of the impact event. |
Cooke Dicam Pro Laser Camera | AEDC | 2 cameras, illuminated with YAG laser | Captured projectile snapshot at moment of impact. |
Acoustic/vibration sensors | NASA | Thin-film, self-adhesive, piezoelectric sensor pads attached directly to the test article. | Time of arrival sensors - the sampling rate of these sensors was not fast enough to generate a waveform. |
AHMI Infrared | The Aerospace | 1–3 k frames/s infrared imager; | Captured infrared video of the post impact environment. |
AERHy Infrared Hyperspectral Imager | The Aerospace | 1–3 k frames/s. Spectral range from 1.25 to 4.0 µm in one axis (600 spectral bins) x ~128 spatial bins; 1.0-0.5 mrad/spatial pixel. | Documented chemical signatures in the infrared range. |
Portable Mass Spectrometer | The Aerospace |
| Collects data on the gases released from the impact and the late time reaction products. |
Witness Plate Assemblies | The Aerospace | Aluminum plate with embedded quartz, sapphire, and adhesive coupons | Used to collect samples to investigate fragment darkening as a result if interaction with the impact gasses and plasma by collecting condensable species. |
Borescope Photron 1024 pci camera | The Aerospace | Capable of 10,000 frames/s | Attempted to image the gas shock wave propagation through the DebrisLV target. This was not fielded on DebriSat because of the target configuration. Did observe internal propagation of the high-speed plasma flash within the tank of the Pre-Shot Calibration Target |
High-speed (ns) gated ICCD cameras | The Aerospace | ICCD camera adapted to a UV-visible | Records spectrally and temporally resolved signatures of the plasma flash. 3 m optical fiber was used to couple flash into spectrometer. 2 camera assemblies were used to cover spectral and/or temporal ranges. |
UV-Vis spectrometer | The Aerospace | UV-Vis spectrometer with integrating sphere for diffuse/spectral reflectance | Attempted to gather chemical signature data in the visible range to help complete the chemical picture. Was not fast enough to match up well with the other spectral instruments. |
Agilent Exoscan Portable FTIR | NASA | Non-destructive infrared analysis of samples. | Post test data gathering for debris darkening. It uses infrared light to create a chemical fingerprint of the compounds present on fragment surfaces. Was used to sample surfaces of Al tank and Debris Sat pre-and post test shots. |
Fragments Characterization Plan
After the hypervelocity impact on DebriSat, fragments down to ~ 2 mm in size will be collected and identified individually. The goal is to recover at least 90% of the total DebriSat mass from the fragments. The data measurement task is divided into two parts. The first part is for fundamental data to improve the satellite breakup model. The plan is to measure the three orthogonal dimensions and mass of each individual fragment. Three digital photographs, from three orthogonal directions, will be taken per fragment. Qualitative classifications of the shape, composition, and density of each fragment will also be documented. Unlike the SOCIT post-test fragment characterization where only 10% of the fragments were measured and many of them were grouped for easy processing, all DebriSat fragments will be individually measured to collect the fundamental data.
The second part of the measurements will include the selection of sample representative fragments. Those fragments will be subjected to additional three-dimensional digital scanning for more accurate cross-sectional area and volume data. Additional radar, photometric, and spectral measurements on selected fragments are also planned to provide data for the development of the optical size estimation model and potential improvements to the existing NASA radar size estimation model.
The DebriSat project was initiated in 2011. Major milestones and planned activities are summarized in Table 2. This project is a good collaboration among academia, DoD, and NASA. Once the data are processed and analyzed, the results will be published to help the orbital debris research community to better model future satellite breakups and improve the orbital debris environment definition.
Date | Milestone |
September 2011 | Project kickoff |
June 2012 | Preliminary DebriSat design |
January 2013 | Final DebriSat design |
September 2013 | Complete fabrication of DebriSat |
October 2013 | Vibration and thermal vacuum tests |
April 15, 2014 | Hypervelocity impact test |
December 2014 | Complete fragment measurements |
December 2015 | Process and analyze data for model improvements |
Automated Imaging System
One of the ways that satellite breakup models characterize fragments is by size. The standard parameter for size characterization of orbital debris used by NASA is characteristic length. Characteristic length is defined as the mean of an object's three maximum orthogonal projected lengths. This provides a single length parameter used to describe the size of a fragment. Originally, characteristic length was measured by hand using calipers and graph paper. This measurement approach was time-consuming and relied on inconsistent human measurement. The next improvement in measurement was to utilize a 3D scanner and manually measure the resulting model in computer software. While this improved repeatability and traceability, the human factor was still present in measurements and the process took hours per object. The automated imaging system that has been developed will provide quick, accurate, and repeatable characteristic length measurements. 11)
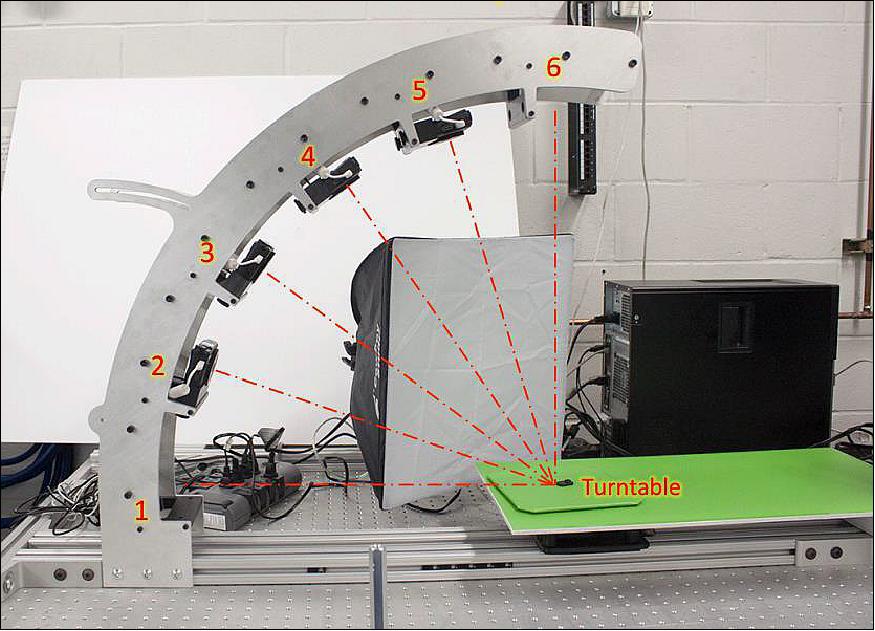
An automated imaging system was developed for the size characterization of the debris fragments. The system uses images taken from various azimuth and elevation angles around the object to produce a 3D representation of the fragment via a space carving algorithm. The system consists of N point-and-shoot cameras attached to a rigid support structure that defines the elevation angle for each camera. The debris fragment is placed on a turntable that is incrementally rotated to desired azimuth angles. The number of images acquired can be varied based on the desired resolution. Appropriate background and lighting is used for ease of object detection. The system calibration and image acquisition process are automated to result in push-button operations. However, for quality assurance reasons, the system is semi-autonomous by design to ensure operator involvement. A description provided of the imaging system setup, calibration procedure, repeatability analysis, and the results of the debris characterization.
Image Acquisition Instrumentation
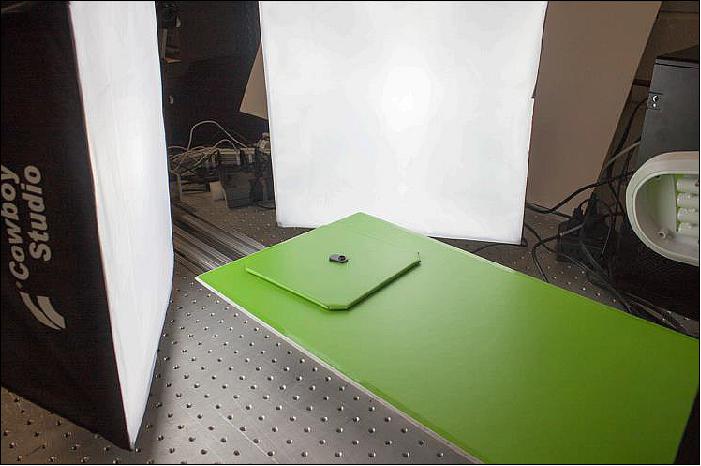
The imaging system has the instrumentation necessary to acquire images from various azimuth and elevation angles around the object. These images will then be used to generate a 3D point cloud of the object. As shown in Figure 10, the system currently features six point-and-shoot cameras, a rigid support structure, a rotary turntable, a green screen background, and diffuse lighting. The system also features a desktop computer to automate image acquisition, detect the object in images, perform 3D reconstruction via a space carving algorithm, measure the characteristic length of the point cloud, and store the images and measurement results. The cameras, which are equidistant from the center of the turntable, are rigidly fixed to the support structure to preserve calibration. Images can be acquired from around the object by rotating the turntable to various azimuth angles while acquiring images from various elevation angles. The green screen and diffuse lighting are used to aid in object detection in the images.
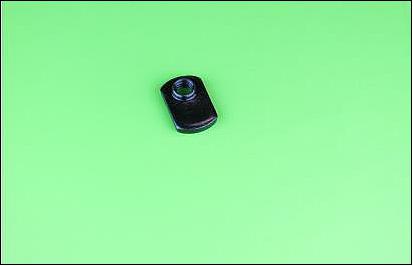
In order to create a 3D representation, the object must be detected in each acquired image. To aid with object detection, a green screen background and diffuse lighting are used (Figure 11). The green screen provides a background against which the object can be easily distinguished. The diffuse lighting is used to eliminate shadows in the images. The system has proven capable of detecting objects that are partially reflective and ones that are as small as 2 mm in length. A sample object image is shown in Figure 12.
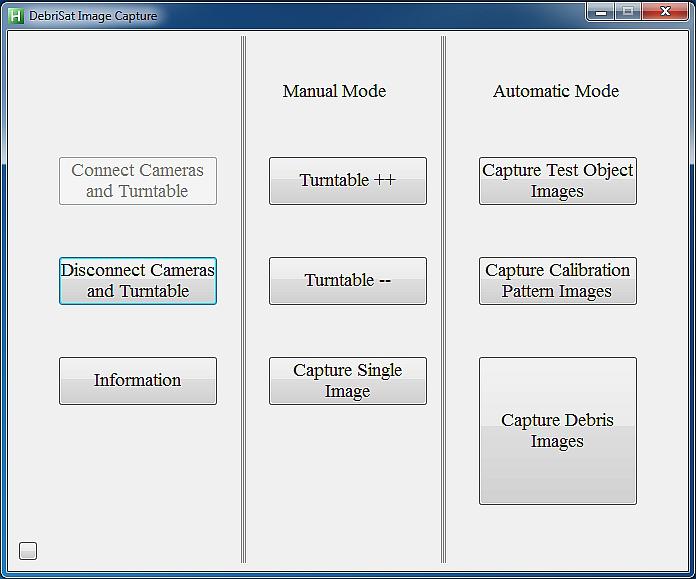
System operation: An algorithm that automates the image acquisition process was developed. Through a single command from the user in the graphical user interface (Figure 5), images from each elevation are acquired, the turntable is incremented to the next azimuth, and the process is repeated until images from all azimuth positions are acquired. The system is controlled such that the turntable increments to the next azimuth angle only once all cameras have acquired images from each of their elevation angles. Currently, images are acquired at six elevation angles and 21 azimuth angles. The first and last azimuth angles are made to be the same. As a result, the first and last image for each camera can then be compared to confirm that the object has not moved during imaging. The turntable acceleration is limited to reduce the risk of object movement relative to the turntable during imaging, which would reduce accuracy. It takes about four minutes to acquire the 126 images currently used for 3D reconstruction.
Camera Calibration
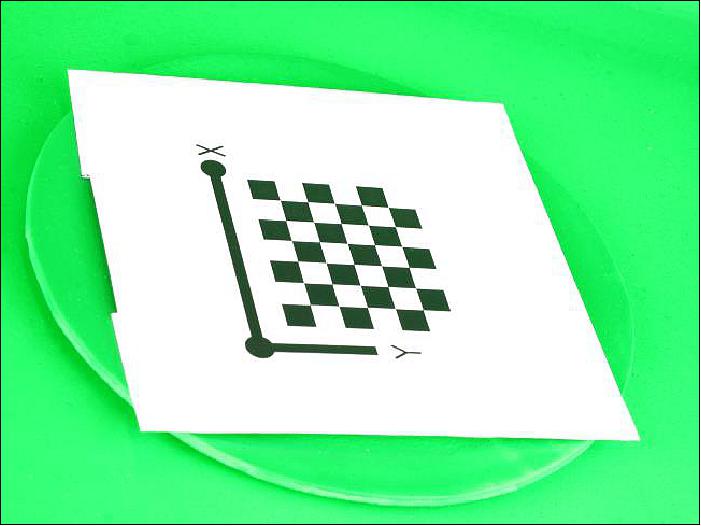
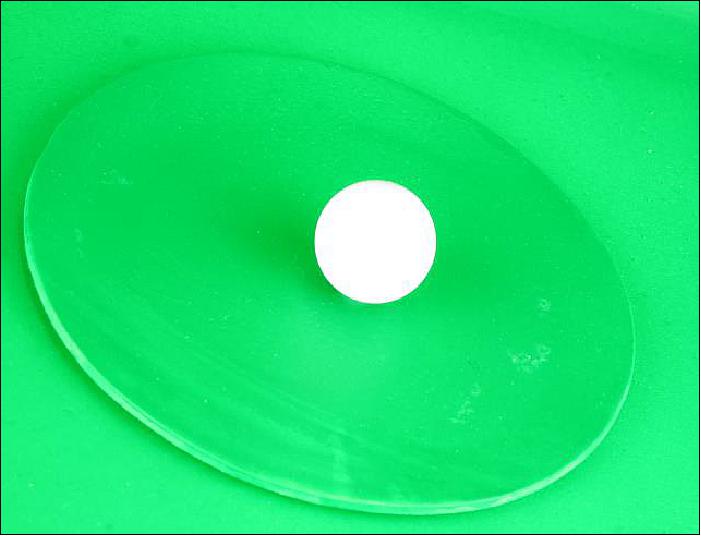
To reconstruct the images into a single 3D representation, the imaging system must be calibrated. The camera calibration is performed by acquiring images of a calibration checkerboard pattern of known size (Figure 14). The automated imaging sequence is run to acquire images from each azimuth and elevation angle. These images are then processed to detect the corners in the checkerboard pattern. Once the corners are detected in each image, the extrinsic and intrinsic parameters for each of the cameras are extracted. Using the extrinsic parameters, which give location and orientation information for the cameras, the images can be reconstructed into a single 3D representation of the object. Using the intrinsic parameters, the object size in the image can be related to its physical size. With a rigid camera setup and a precise turntable, the calibration will still be valid after numerous objects are imaged. Testing will be conducted to experimentally determine the number of cycles over which calibration is preserved. The system must be calibrated to within the desired measurement accuracy for all objects imaged. When the imaging system is in use, calibration will be required after a fixed number of objects are imaged. At the very least, calibration will be conducted at the beginning of every day regardless of the number of objects processed the previous day. In addition, a calibration sphere of known diameter (Figure 15) will be imaged to ensure the measurement results are within the required accuracy.
Performance of the Imaging System
The imaging system was developed for size characterization of debris fragments from the DebriSat project. With the system, an object's characteristic length can be quickly and accurately determined. The system is fully automated to eliminate the human factor from measurements. The non-contact measurements also reduce fragment handling and the risk of fragment damage.
The imaging system is intended to generate a 3D point cloud representation of the object from which maximum dimensions and characteristic length can be extracted. A space carving algorithm is used to accomplish 3D reconstruction from the silhouette of the object seen in images taken from various azimuth and elevation angles around the object. The use of the silhouette for reconstruction ensures that the maximum dimensions are captured. In addition, the space carving approach reduces processing time by disregarding features that are irrelevant for characteristic length measurement. For this reason, the space carving approach does not detect concave features in faces of the object. However, these concavities are irrelevant for characteristic length measurement.
A variety of test samples have been processed using the imaging system. The samples tested have varied in size from maximum dimensions of 2 mm to 100 mm. The test objects have had a variety of shapes, colors, and reflectivities. The results from one of the test samples processed is shown in Figure 16 and Figure 17. Currently, objects with characteristic lengths as small as 2 mm can be imaged and detected. The characteristic length results have shown an accuracy of about 2% and a repeatability of about 1.5%. These accuracy and repeatability values will be refined as further testing is completed. The measurement accuracy was verified through comparison with existing approaches for characteristic length measurement, such as hand measurements with calipers and NASA 3D scanner measurements. The measurement results were also compared to the known dimensions of computer-generated point clouds. In order to measure repeatability, the imaging system was used to measure the same object repeatedly. The imaging system improves repeatability by eliminating the human factor from measurements.
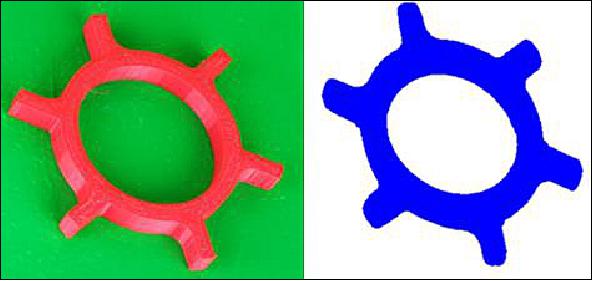
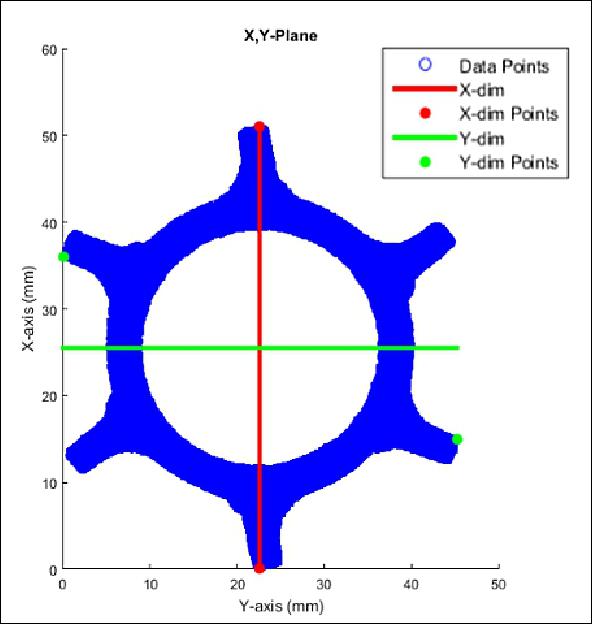
In summary, a fully automated imaging system has been developed for characteristic length measurement of DebriSat hypervelocity impact fragments. The imaging system is currently capable of acquiring a total of 126 images from six elevation angles and 21 azimuth angles. This image acquisition process can be completed with a single button-click and only takes about 4 minutes. Once these images are acquired, a 3D representation of the object can be generated and measured in about 2 minutes. Thus, the imaging system provides a complete approach for producing a 3D representation of an object from which characteristic length can then be measured.
This imaging system provides several advantages over alternative approaches to characteristic length measurement, such as using 3D scanners or calipers. The system obtains non-contact measurements and minimizes fragment handling to avoid damage or contamination of the object. In addition, the system acquires measurements of an object in about 6 minutes. These measurements are accurate and precise due to the elimination of the human factor from the measurement process. The system has a measurement accuracy of about 2% and a repeatability of about 1.5%. The complete automation of the system allows fragments to be processed quickly with minimal operator involvement. The imaging system will be used to process the tens of thousands of debris fragments generated in the DebriSat test (Ref. 11).
Preliminary Characterization Results from the DebriSat Project
• September 2017: Since the beginning of the characterization phase of the DebriSat project, over 154,000 fragments have been collected and approximately 250,000 fragments are expected to be collected in total, a three-fold increase over the 85,000 fragments predicted by the current break-up model. The challenge throughout the project has been to ensure the integrity and accuracy of the characteristics of each fragment. To this end, the post hypervelocity-impact test activities, which include fragment collection, extraction, and characterization, have been designed to minimize handling of the fragments. The procedures for fragment collection, extraction, and characterization were painstakingly designed and implemented to maintain the post-impact state of the fragments, thus ensuring the integrity and accuracy of the characterization data. Each process is designed to expedite the accumulation of data, however, the need for speed is restrained by the need to protect the fragments. Methods to expedite the process such as parallel processing have been explored and implemented while continuing to maintain the highest integrity and value of the data. To minimize fragment handling, automated systems have been developed and implemented. Errors due to human inputs are also minimized by the use of these automated systems. 12)
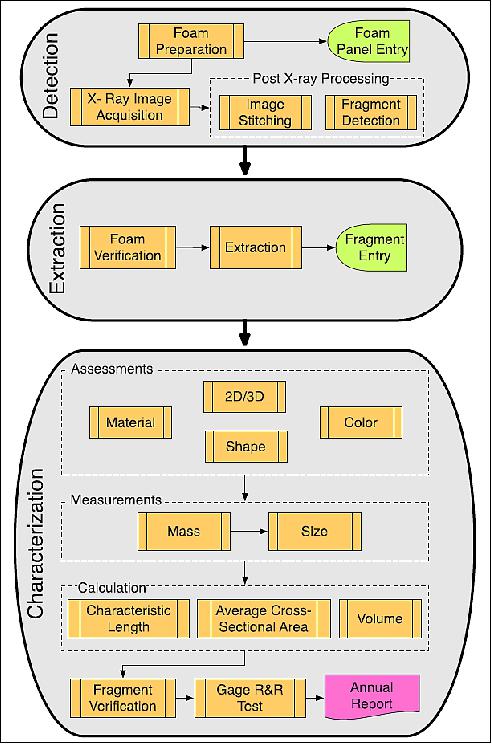
- In order to characterize the DebriSat fragments, a rigorous process was developed and implemented. There are three major tasks associated with the post-impact processing of DebriSat fragments: detection, extraction, and characterization. Each task and its associated sub-tasks and activities are shown in Figure 18. The detection task has three sub-tasks beginning with foam panel preparation where loose fragments and fragments embedded on the surfaces of the panels are collected and stored. Once panel preparation is completed, the panels are X-ray imaged. After the X-ray images are acquired, they are post-processed to detect other embedded fragments. The extraction task involves the careful extraction of fragments with at least one dimension greater than 2 mm which are stored individually. The approximate location of each fragments on or in the panel is recorded to provide information on physical distribution and penetration depth. The fragments are recorded into the DebriSat Categorization System (DCS) database where each fragment is given a unique identification number.
The characterization task involves fragment assessments (2D/3D size discriminator, material, shape, and color), measurements (mass and physical size XDIM, YDIM, and ZDIM), and the size characteristics from the measurements (i.e., determining the characteristic length, average cross-sectional area, and volume) are calculated. All the fragment data and images generated throughout the process as well as the associated metadata (revision history, creator, timestamp, etc.) are all uploaded and stored on the DCS.
Once the fragments are characterized, each fragment goes through a verification process where technicians confirm the data archived in the DCS database. The fragment verification ensures the integrity of the fragment data generated throughout the post-HVI (Hypervelocity Impact) process. In addition, Gage repeatability and reproducibility (Gage R&R) tests are conducted every 1,000 verified fragments to quantify the variations in equipment and procedure. The Gage R&R tests maintain high levels of confidence in the fragment characterization data.
- In summary, rigorous procedures for each activity in the post-impact phase of the DebriSat project has matured to improve efficiencies as well as to incorporate new processes/equipment based on lessons learned. Furthermore, the procedures have been developed and updated to be independent of technicians to adapt to growing and ever changing group of technicians. One of the biggest challenge is handling and working with fragments in the 2 mm range, and the technicians have focused on extreme care and attention during each activity. A verification step has been implemented in order to mitigate inaccuracies in the information stored in the database and to ensure the integrity of the data archived for each fragment.
There has been a steady increase in the panel preparation for X-ray imaging and object detection and completed all the panels that are greater than 2/3 of the original size. The remaining foam panels are all broken panels, thus, a procedure has been developed and is currently being verified to process the broken panels. As the third year of post-impact processing continues, the majority of the focus has been on fragment extraction and characterization. Over 20,000 fragments have been collected through extraction, and over 13,000 fragments have been characterized. In addition, close to 3,000 fragments have been verified. While only fragments that qualify as 2D are characterized to date, the 3D fragments are beginning to be characterized.
• March 2016: The DebriSat project is a continuing effort sponsored by NASA and DoD to update existing break-up models using data obtained from two separate hypervelocity impact tests used to simulate on-orbit collisions. To protect the fragments resulting from the impact tests, "soft-catch" arenas made of polyurethane foam panels were utilized. After each impact test, the test chamber was cleaned and debris resulting from the catastrophic demise of the test article were collected and shipped to the University of Florida for post-impact processing. The post-impact processing activities include collecting, characterizing, and cataloging of the fragments. 13)
Since the impact tests, a team of students has been working to characterize the fragments in terms of their mass, size, shape, color and material content. The focus of the 20 months since the impact tests has been on the collection of 2 mm and larger fragments resulting from impact test on the 56 kg representative LEO satellite referred to as DebriSat. To date we have recovered in excess of 115 k fragments, 30 k more than the prediction of 85 k fragments from the existing model. We continue to collect fragments but have transitioned to the characterization phase of the post-impact activities. Since the start of the characterization phase, the focus has been to utilize automation to (i) expedite fragment characterization process and (ii) minimize human-in-the-loop. We have developed and implemented such automated processes; e.g., we have automated the data entry process to reduce operator errors during transcription of the measurement data. However, at all steps of the process, there is human oversight to ensure the integrity of the data. Additionally, we have developed and implemented repeatability and reproducibility tests to ensure that the instrumentation used in the characterization process is accurate and properly calibrated. In this paper, the implemented processes are described and preliminary results presented. Additionally, lessons learned from the implemented automations and their impacts on the integrity of the results are discussed.

• Post-test DebriSat activity is concentrated on developing strategies and techniques to extract and categorize fragments through the current planned mission period.
• The panel X-ray task shown in the table below should be completed by the end of FY16 (09/30/16).
• Fragment extraction and characterization will continue will continue throughout the duration of the project.
• DebrisLV activities are of lower priority, and may begin in FY17.
• The DebriSat project group took care to build a spacecraft with components that mimic modern spacecraft • Plan is to extract ≥2 mm fragments from foam panels/loose pieces/dust • Plan is to recover at least 90% of the total DebriSat mass from the fragments • Debris collected so far ~112 k, Debris recorded so far >107 k • The current estimate for the >2mm DebriSat fragments to be collected is more than 200,000 - Assign each individual fragment a unique identification number - A label of 2-D or 3-D is given to each fragment based on the means of analysis of fragment dimensions that will be performed - Fragment physical parameters filling out the database include material/color, shape - Fragment derived parameters include characteristic length, volume, average cross sectional area, mass, bulk density • The small fragment population so far favors tens of thousands of CFRP (Carbon Fiber Reinforced Polymer) fragments created from the splintering DebriSat spacecraft skin and interior inserts. These fragments favor the 2-D imaging techniques • UF (University of Florida) Database - Investigating whether "needle-like fragment" dimensions (i.e., thickness is assumed to be negligible) can be approximated with simple 2-D assumption - Further research is required to determine what the average thickness of the CFRP fragments are, to provide a range of expected thicknesses. |
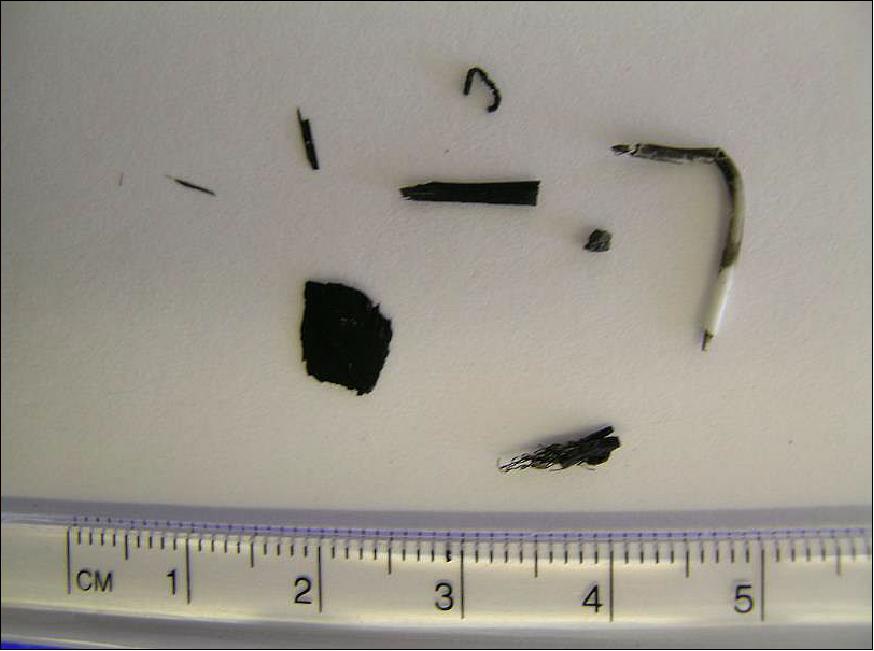
• Fragments labeled 1, 2, and 3 are CFRP splinters. These will be defined as 2-D objects.
• Wire fragments 4, 5 and the wire bundle (8) will likely treated as 3-D.
• The nugget (6) and charred bent plate (7) are 3-D.
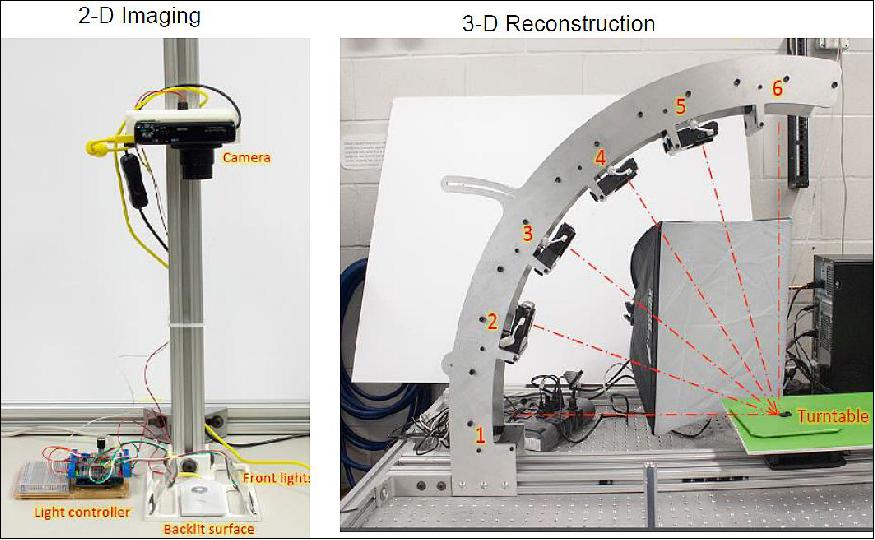
UF database plans to include single-tagged fragments ≥2mm in maximum dimension, original locations within panels, material, shape, mass, volume, CS area, characteristic length, and multiple photos.
References
1) J.-C. Liou, S. Clark, N. Fitz-Coy, T. Huynh, J. Opiela, M. Polk, B. Roebuck, R. Rushing, M. Sorge, M. Werremeyer, "DebriSat - a planned laboratory-based satellite impact experiment for breakup fragment characterization," The 6th European Conference on Space Debris, Darmstadt, Germany, 22-25 April 2013, URL of paper: http://ntrs.nasa.gov/archive/nasa/casi.ntrs.nasa.gov/20130011792.pdf , URL of presentation: http://ntrs.nasa.gov/archive/nasa/casi.ntrs.nasa.gov/20130012445.pdf
2) Donald J. Kessler, Burton G. Cour-Palais, "Collision frequency of artificial satellites: The creation of a debris belt," Journal of Geophysical Research, Volume 83, Issue A6, June 1, 1978, pp: 2637-2646, DOI: 10.1029/JA083iA06p02637, URL: http://webpages.charter.net/dkessler/files/Collision%20Frequency.pdf
3) N. L. Johnson, P. H. Krisko, J.-C. Lieu, P. D. Am-Meador, "NASA's new breakup model of EVOLVE 4.0," Advanced Space Research, Vol. 28, No. 9, 2001, pp. 1377-1384,URL: https://www.researchgate.net/publication/223571206_NASA's_new_breakup_model_of_evolve_40
4) J.-C. Liou, "An Update on Recent Major Breakup Fragments," NASA Orbital Debris Quarterly News, Vol. 13, Issue 3, pp: 5-6, 2009, URL: http://orbitaldebris.jsc.nasa.gov/newsletter/pdfs/ODQNv13i3.pdf
5) "Arnold Engineering Development Complex," Factsheet, Dec. 15, 2014, URL: http://www.arnold.af.mil/library/factsheets/factsheet.asp?id=12977
6) J.-C. Liou, "USA Space Debris Environment, Operations, and Measurement Updates," 52nd session of the Scientific and Technical Subcommittee, UNOOSA (United Nations Office for Outer Affairs), Vienna, Austria, Feb. 2-13, 2015, URL: http://www.unoosa.org/pdf/pres/stsc2015/tech-28E.pdf
7) E. Christiansen, A. Davis, J. Miller, D. Lear, "Hypervelocity Impact Test with Large Mass Projectile," NASA Orbital Debris Quarterly News, Vol. 18, Issue 2, 2014, pp: 6-7, URL: http://orbitaldebris.jsc.nasa.gov/newsletter/pdfs/ODQNv18i2.pdf
8) Marshall Polk, "DebriSat: data from Destruction," Air Force Materiel Command, May 13, 2014, URL: http://www.afmc.af.mil/news/story.asp?id=123410761
9) J.-C. Liou, J. Opiela, H. Cowardin, T. Huynh, M. Sorge, C. Griffice, P. Shaeffer, N. Fitz-Coy, M. Wilson, R. Rushing, B. Hoff, M. Nolen, M. Polk, B. Roebuck, D. Woods, "Successful Hypervelocity Impacts of DebrisLV and DebriSat," NASA Orbital Debris Quarterly News, Vol. 18, Issue 3, July 2014, pp: 3-5, URL: http://orbitaldebris.jsc.nasa.gov/newsletter/pdfs/ODQNv18i3.pdf
10) Marshall Polk, David Woods, Brian Roebuck, John Opiela, Patti Sheaffer, J.-C. Liou, "Orbital Debris Assessment Testing in the AEDC Range G," The 13th Hypervelocity Impact Symposium, Boulder, CO, USA, April 26-30, 2015, URL: http://ntrs.nasa.gov/archive/nasa/casi.ntrs.nasa.gov/20140017142.pdf
11) Matthew Moraguez, Kunal Patankar, Norman Fitz-Coy, J.-C. Liou, Heather Cowardin, "An Imaging System for Satellite Hypervelocity Impact Debris Characterization," Proceedings of the 16th AMOS (Advanced Maui Optical and Space Surveillance Technology Conference), Maui, Hawaii, USA, Sept. 15-18, 2015, URL: http://www.amostech.com/TechnicalPapers/2015/Poster/Moraguez.pdf
12) N. Fitz-Coy, J.-C. Liou, T. Huynh, M. Sorge, H. Cowardin, J. Opiela, P. Krisko, "Characterizing DebriSat Fragments: So many fragments, so much data, and so little time," Proceedings of the 68th IAC (International Astronautical Congress), Adelaide, Australia, 25-29 Sept. 2017, paper: IAC-17.A6.3.6
13) M. Rivero, B. Shiotani, J. Kleespies, R. Toledo-Burdett, M. Moraguez, M. Carrasquilla, N. Fitz-Coy, J.-C. Liou, M. Sorge, T. Huynh, J.Opiela, P. Krisko, H. Cowardin, "Preliminary Characterization Results from the DebriSat Project," March 21, 2016, URL of abstract: http://ntrs.nasa.gov/archive/nasa
/casi.ntrs.nasa.gov/20160003483.pdf
14) M. Sorge, P. H. Krisko, "DebriSat Project Update and Planning," 34th Inter-Agency Debris Coordination Committee, Oxford, U.K., 30 March –2 April 2016, URL: http://ntrs.nasa.gov/archive/nasa/casi.ntrs.nasa.gov/20160002362.pdf
The information compiled and edited in this article was provided by Herbert J. Kramer from his documentation of: "Observation of the Earth and Its Environment: Survey of Missions and Sensors" (Springer Verlag) as well as many other sources after the publication of the 4th edition in 2002. - Comments and corrections to this article are always welcome for further updates (herb.kramer@gmx.net).
Spacecraft Impact Test Automated Imaging References Back to top