PSP (Parker Solar Probe)
Non-EO
NASA
Space Weather
Quick facts
Overview
| Mission type | Non-EO |
| Agency | NASA |
| Launch date | 12 Aug 2018 |
Parker Solar Probe - former SPP (Solar Probe Plus) Spacecraft Mission
Spacecraft Launch Mission Status Sensor Complement References
The Solar Probe Plus mission is part of NASA's LWS (Living With a Star) Program. The program is designed to understand aspects of the sun and Earth's space environment that affect life and society. The program is managed by NASA/GSFC (Goddard Space Flight Center). The Johns Hopkins University Applied Physics Laboratory (JHU/APL) in Laurel, MD., is the prime contractor for the spacecraft. In September 2010, NASA selected the Solar Probe Plus mission for development. A launch of the mission is planned for 2018. 1)
NASA's first mission to go to the sun, the Parker Solar Probe, is named after Eugene Parker who first theorized that the sun constantly sends out a flow of particles and energy called the solar wind.
On May 31, 2017, NASA has renamed the Solar Probe Plus spacecraft humanity's first mission to a star, which will launch in 2018 as the "Parker Solar Probe" in honor of astrophysicist Eugene Parker. The announcement was made at a ceremony at the University of Chicago, where Parker serves as the S. Chandrasekhar Distinguished Service Professor Emeritus, Department of Astronomy and Astrophysics.
In 1958, Parker — then a young professor at the university's Enrico Fermi Institute — published an article in the Astrophysical Journal called "Dynamics of the interplanetary gas and magnetic fields." Parker believed there was high speed matter and magnetism constantly escaping the sun, and that it affected the planets and space throughout our solar system.
This phenomenon, now known as the solar wind, has been proven to exist repeatedly through direct observation. Parker's work forms the basis for much of our understanding about how stars interact with the worlds that orbit them.
"This is the first time NASA has named a spacecraft for a living individual," said Thomas Zurbuchen, associate administrator for NASA's Science Mission Directorate in Washington. "It's a testament to the importance of his body of work, founding a new field of science that also inspired my own research and many important science questions NASA continues to study and further understand every day. I'm very excited to be personally involved honoring a great man and his unprecedented legacy."
"The solar probe is going to a region of space that has never been explored before," said Parker. "It's very exciting that we'll finally get a look. One would like to have some more detailed measurements of what's going on in the solar wind. I'm sure that there will be some surprises. There always are."
In the 1950s, Parker proposed a number of concepts about how stars — including our sun — give off energy. He called this cascade of energy the solar wind, and he described an entire complex system of plasmas, magnetic fields and energetic particles that make up this phenomenon. Parker also theorized an explanation for the superheated solar atmosphere, the corona, which is — contrary to what was expected by physics laws — hotter than the surface of the sun itself. Many NASA missions have continued to focus on this complex space environment defined by our star — a field of research known as heliophysics.
"Parker Solar Probe is going to answer questions about solar physics that we've puzzled over for more than six decades," said Parker Solar Probe Project Scientist Nicola Fox, of the Johns Hopkins University Applied Physics Laboratory. "It's a spacecraft loaded with technological breakthroughs that will solve many of the largest mysteries about our star, including finding out why the sun's corona is so much hotter than its surface. And we're very proud to be able to carry Gene's name with us on this amazing voyage of discovery."
NASA missions are most often renamed after launch and certification; in this case, given Parker's accomplishments within the field, and how closely aligned this mission is with his research, the decision was made to honor him prior to launch, in order to draw attention to his important contributions to heliophysics and space science.
Born on June 10, 1927, in Michigan, Eugene Newman Parker received a Bachelor of Science in physics from Michigan State University and a doctorate from Caltech. He then taught at the University of Utah, and since 1955, Parker has held faculty positions at the University of Chicago and at its Fermi Institute. He has received numerous awards for his research, including the George Ellery Hale Prize, the National Medal of Science, the Bruce Medal, the Gold Medal of the Royal Astronomical Society, the Kyoto Prize, and the James Clerk Maxwell Prize.
The SPP science objectives are: 3) 4) 5)
1) Determine the structure and dynamics of the magnetic fields at the sources of the fast and slow solar wind.
2) Trace the flow of energy that heats the corona and accelerates the solar wind.
3) Determine what mechanisms accelerate and transport energetic particles.
4) Explore dusty plasma phenomena in the near-sun environment and their influence on the solar wind and energetic particle formation.
Background
• The concept for a "solar probe" dates back to "Simpson's CommiIee" of the Space Science Board (National Academy of Sciences, 24 October 1958). The need for extraordinary knowledge of Sun from remote observations, theory, and modeling to answer the questions:
- Why is the solar corona so much hotter than the photosphere?
- How is the solar wind accelerated?
• SPP was a NASA concept study in 2008. The challanging objective of the mission is to explore the near-Sun environment for a better understanding of solar physics. So far, no missions have penetrated closer to the Sun than 0.3 AU (Astronomical Units).
• Helios 1 and 2 were a pair of cooperative US and German deep space probes (launch Dec. 10, 1974 and Jan. 15, 1976, respectively) which set the record for the closest approach to the Sun, at ~45 million km, slightly inside the orbit of Mercury.
• The NASA MESSENGER mission (launch Aug. 3, 2004) was the first spacecraft to orbit planet Mercury. The data of the Sun are unique representing the only in situ measurements of the inner heliosphere as close as 60 solar radii (RS). The unexplored region within this distance is where the corona is accelerated to form the supersonic solar wind, and is critical to our understanding of the Sun's impact on the solar system.
First definitions of Solar Probe missions (studies) at NASA/JPL were started in 1978. The original Solar Probe mission concept of 2005, based on a Jupiter gravity assist trajectory, was no longer feasible under the new guidelines given to the mission. A complete redesign of the mission was required to meet the mission constraints, which called for the development of alternative mission trajectories that excluded a flyby of Jupiter.
In mid-2007, NASA asked JHU/APL to consider another concept for Solar Probe that would perform all science objectives of the 2005 concept, implemented as a non-nuclear powered spacecraft, and executed under a New Frontiers-like cost cap. The resulting mission is called Solar Probe+ in recognition of the potential gains in science of the current concept over predecessors. 11) 12) 13)
In March 2012, the SPP project advanced to Phase-B. 14)
Two key technical challenges make a solar probe much more difficult than other missions: 15)
1) The extremely high temperature and harsh environment in the Sun's proximity, which the spacecraft cannot survive without adequate thermal protection
2) The extreme difficulty of getting close to the Sun, as an enormous amount of velocity must be canceled out from the Earth orbital velocity in order for a probe to get close to the Sun.
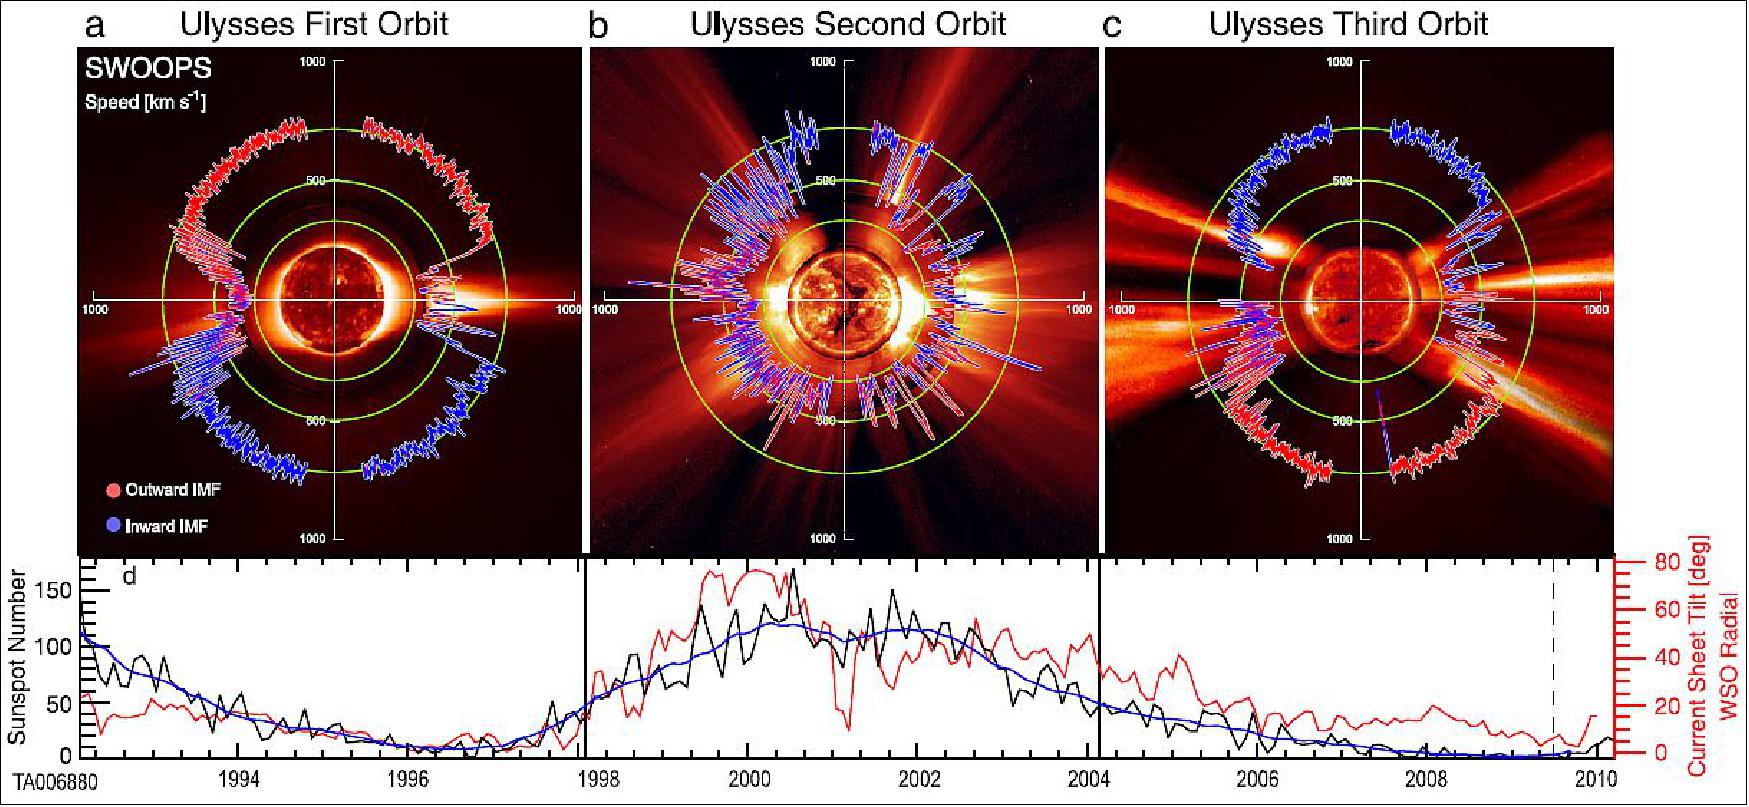
SPP will sample the solar corona to reveal how it is heated and the solar wind and solar energetic particles are accelerated. Solving these problems has been a top science goal for over 50 years. 16) During the seven-year mission, seven Venus gravity assist (VGA) maneuvers will gradually lower the perihelia to <10 RS (Radius of sun ~700,000 km), the closest any spacecraft has come to the Sun. Throughout the 7-year nominal mission duration, the spacecraft will spend a total of 937 hours inside 20 RS , 440 hours inside 15 RS , and 14 hours inside 10 RS, sampling the solar wind in all its modalities (slow, fast, and transient) as it evolves with rising solar activity toward an increasingly complex structure. SPP will orbit the Sun in the ecliptic plane, and so will not sample the fast wind directly above the Sun's polar regions (Figure 1). However, the current mission design compensates for the lack of in-situ measurements of the fast wind above the polar regions by the relatively long time SPP spends inside 20 RS.17) - This will allow extended measurement of the equatorial extensions of high-latitude coronal holes and equatorial coronal holes. At a helioradius ~35 RS , there are two periods per orbit (one inbound and one outbound) when SPP will be in quasi-corotation with the Sun and will cross a given longitudinal sector slowly. In these intervals, known as fast radial scans, the spacecraft will sample the solar wind over large radial distances within a given flux tube before moving across the sector. These measurements will yield additional information on the spatial/temporal dependence of structures in the solar wind and on how they merge in the inner heliosphere.
Science Overview
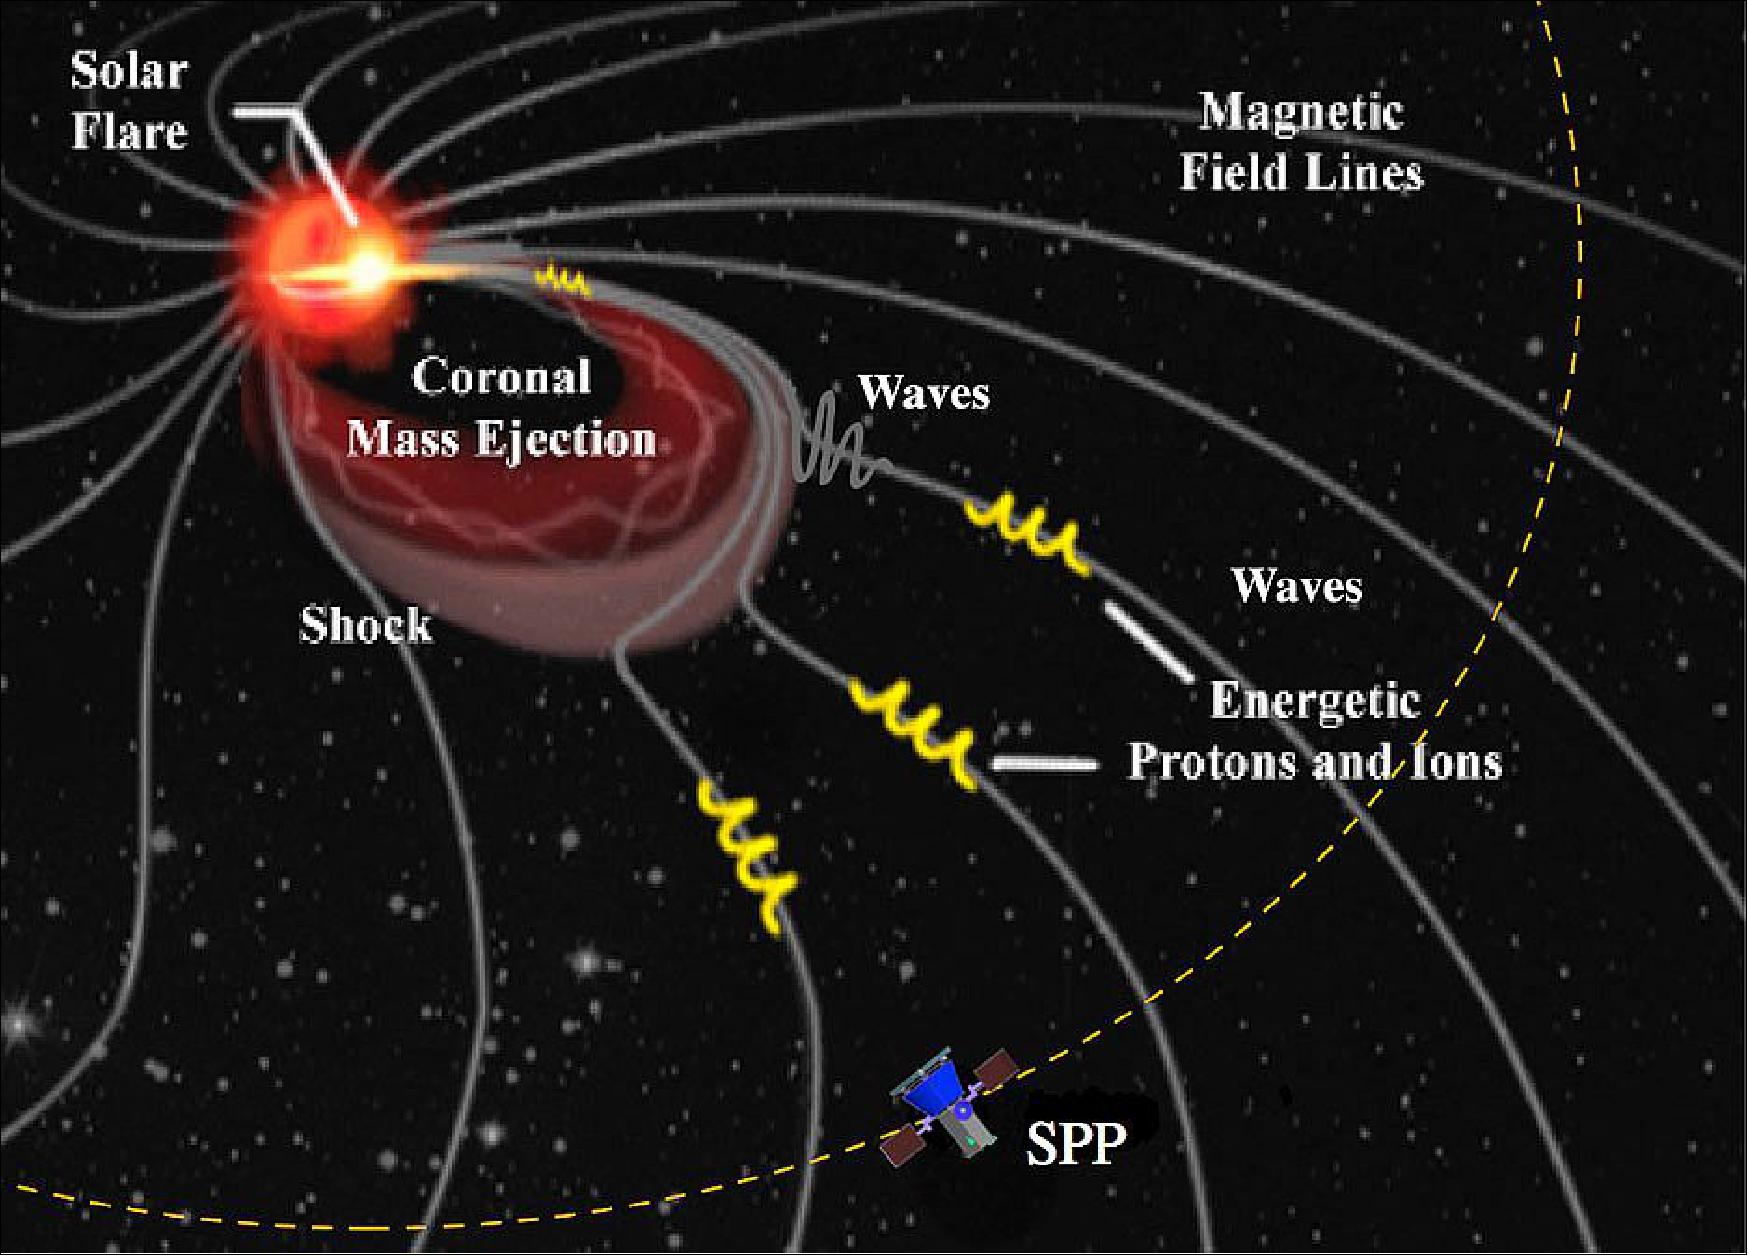
The SPP mission targets processes and dynamics that characterize the Sun's expanding corona and solar wind. SPP will explore the inner region of the heliosphere through in-situ and remote sensing observations of the magnetic field, plasma, and energetic particles. The solar magnetic field plays a defining role in forming and structuring the solar corona and the heliosphere. In the corona, closed magnetic field lines confine the hot plasma in loops, while open magnetic field lines guide the solar wind expansion in the inner corona. The energy that heats the corona and drives the wind derives from photospheric motions, and is channeled, stored, and dissipated by the magnetic fields that emerge from the convection zone and expand in the corona where they dominate almost all physical processes therein. Examples of these are waves and instabilities, magnetic reconnection, and turbulence, which operate on a vast range of spatial and temporal scales. Magnetic fields play also a critical role in coronal heating and solar wind acceleration. They are conduits for waves, store energy, and propel plasma into the heliosphere through complex forms of magnetic activity [e.g., CMEs (Coronal Mass Ejections), flares, and small-scale features such as spicules and jets]. How solar convective energy couples to magnetic fields to produce the multifaceted heliosphere is central to SPP science.
SPP will make in-situ and remote measurements from <10 RS to at least 0.25 AU (53.7 RS ). Measurements of the region where the solar wind originates and where the most hazardous solar energetic particles are energized will improve our ability to characterize and forecast the radiation environment of the inner heliosphere. SPP will measure local particle distribution functions, density and velocity field fluctuations, and electromagnetic fields within 0.25 AU of the Sun. These data will help answer the basic questions of how the solar corona is powered, how the energy is channeled into the kinetics of particle distribution functions in the solar corona and wind, and how such processes relate to the turbulence and wave-particle dynamics observed in the heliosphere. Cross-correlation of velocity, density, and electromagnetic fluctuations will allow a partial separation of spatial and temporal effects.
The physical conditions of the region below 20 RS are important in determining largescale properties such as solar wind angular momentum loss and global heliospheric structure. The Alfvénic critical surface, where the solar wind speed overtakes the Alfvén speed, is believed to lie in this region. This surface defines the point beyond which the plasma ceases to corotate with the Sun, i.e., where the magnetic field loses its rigidity to the plasma. In this region solar wind physics changes because of the multi-directionality of wave propagation (waves moving sunward and anti-sunward can affect the local dynamics including the turbulent evolution, heating and acceleration of the plasma). This is also the region where velocity gradients between the fast and slow speed streams develop, forming the initial conditions for the formation, further out, of CIRs (Corotating Interaction Regions).
SPP Participation
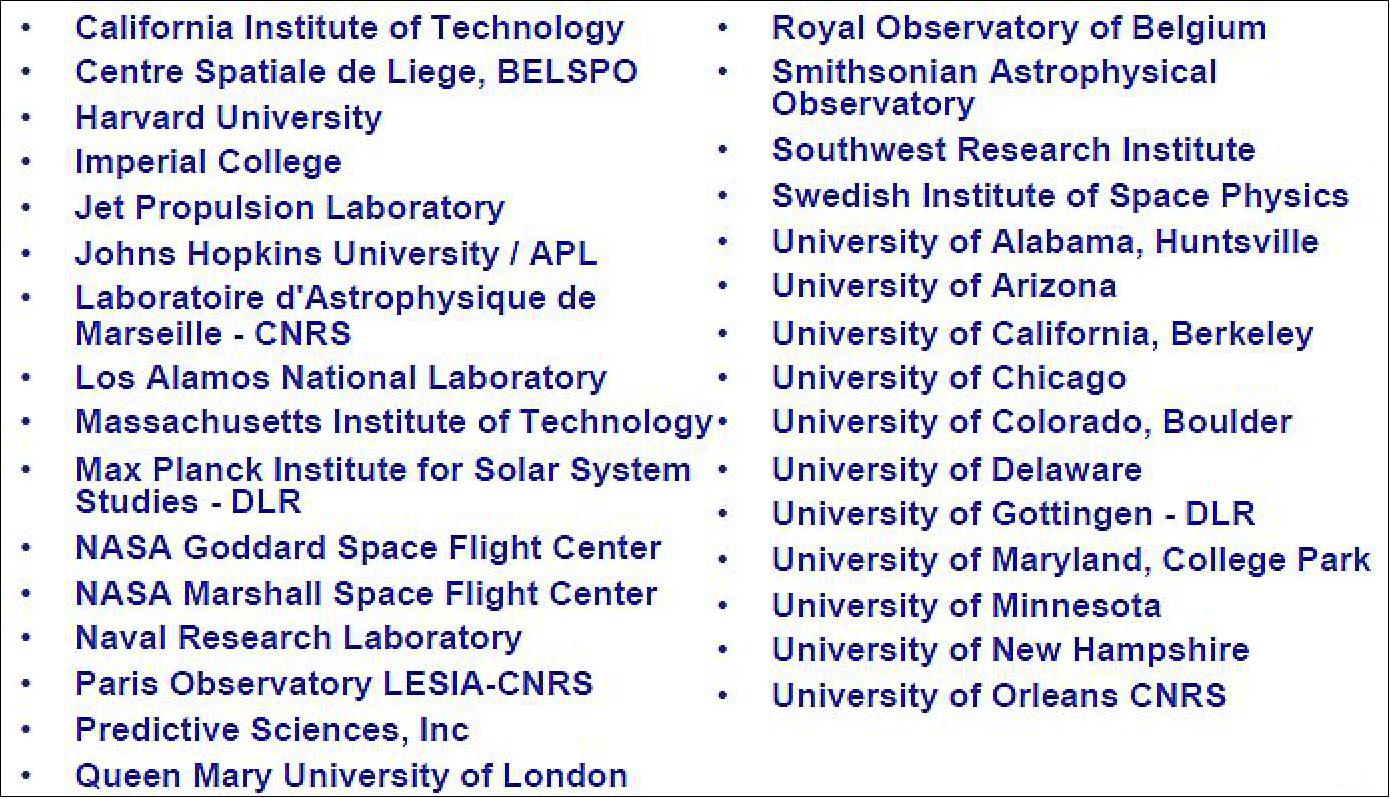
• 31 institutions participate in SPP science teams
- 23 in the US, 8 foreign
- 17 educational, 5 non-profit, 8 government labs
• 106 science team members
- 69 PIs and Co-Is
- 37 additinal scientists
- Next generation graduate students and post-docs.
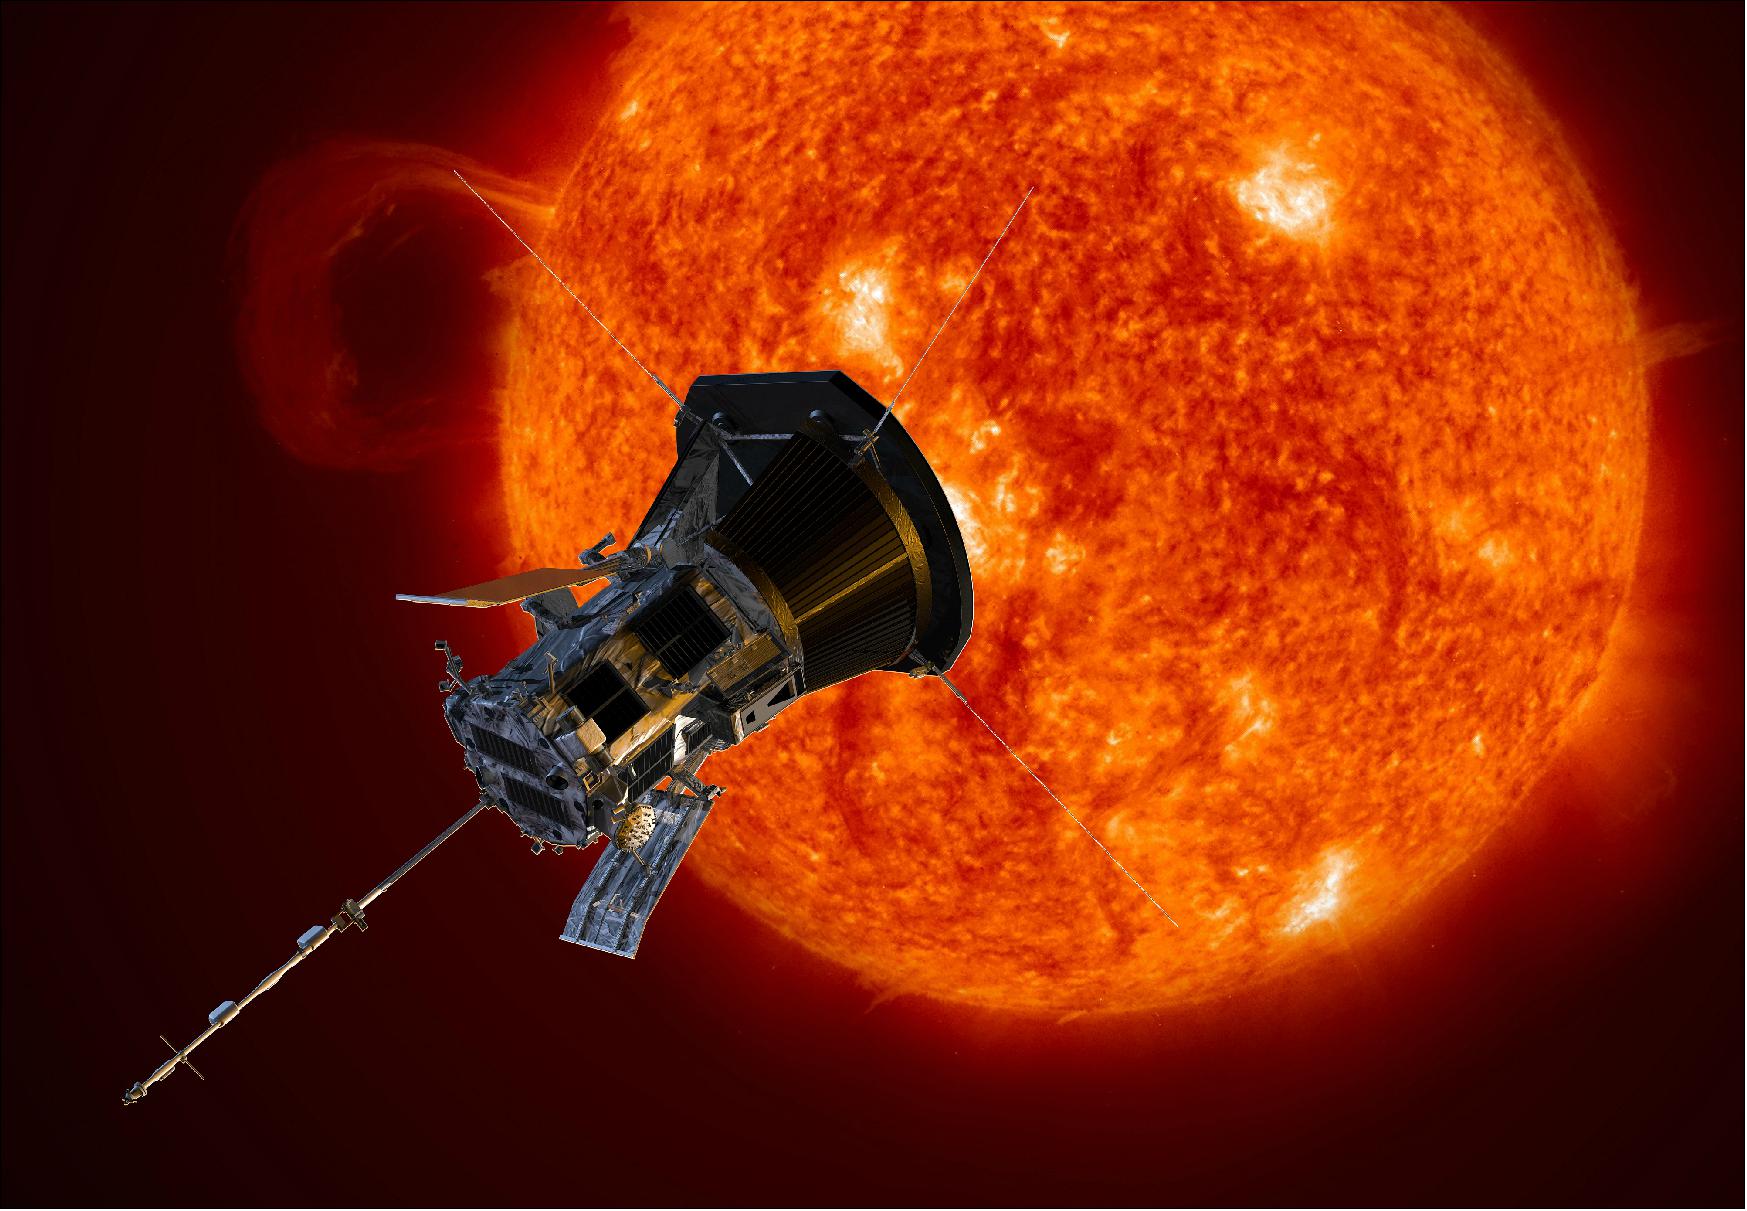
To accomplish the science objectives of addressing the fundamental questions about the Sun by acquiring critical data and measurements to answer questions that cannot be answered by observations from satellites in Earth orbit and from other interplanetary space probes, a solar probe must approach the Sun closely. A solar orbit approach to within the range of 10 solar radii (Rs) from Sun's center must be considered to conduct the necessary in situ measurements and investigations.
Getting directly to the Sun from Earth would require a launch energy C3 as large as 423 km2/s2. This is beyond the capability of launch vehicles currently available (Atlas V, Delta IV Heavy) or to be developed in the near future. The highest launch C3 ever achieved was 164 km2/s2 for the New Horizons mission to Pluto (launch Jan. 2006).
After an extensive analysis by NASA and JHU/APL, the trajectory option 5 was chosen as the baseline trajectory for the new solar probe. The redesigned mission is named SPP (Solar Probe Plus) for its significant advantages in both technical implementation and science accomplishments as compared with the original Solar Probe mission.
The mission design utilizes seven Venus gravity assists to gradually reduce perihelion (Rp) from 35 solar radii (Rs) in the first orbit to < 10 Rs for the final three orbits. The SPP orbit consists of two primary orbit phases, a science phase (0.25AU to perihelion) and a cruise/data downlink phase (0.25AU to aphelion).
Parameter | Solar Probe (2005) | Solar Probe Plus (2008) |
Minimum perihelion | 4 Rs | 9.5 Rs |
Inclination | 90º from ecliptic | 3.4º from ecliptic |
Number of solar passes | 2 | 24 |
Total time within 20 Rs | 96 hours | 961 hours |
Time between passes | 4.6 years | 88 to 150 days |
Time from launch to first perihelion | 4.1 years | 3 months |
Mission duration | 8.8 years | 6.9 years |
Aphelion | 5.5 AU | 1 AU |
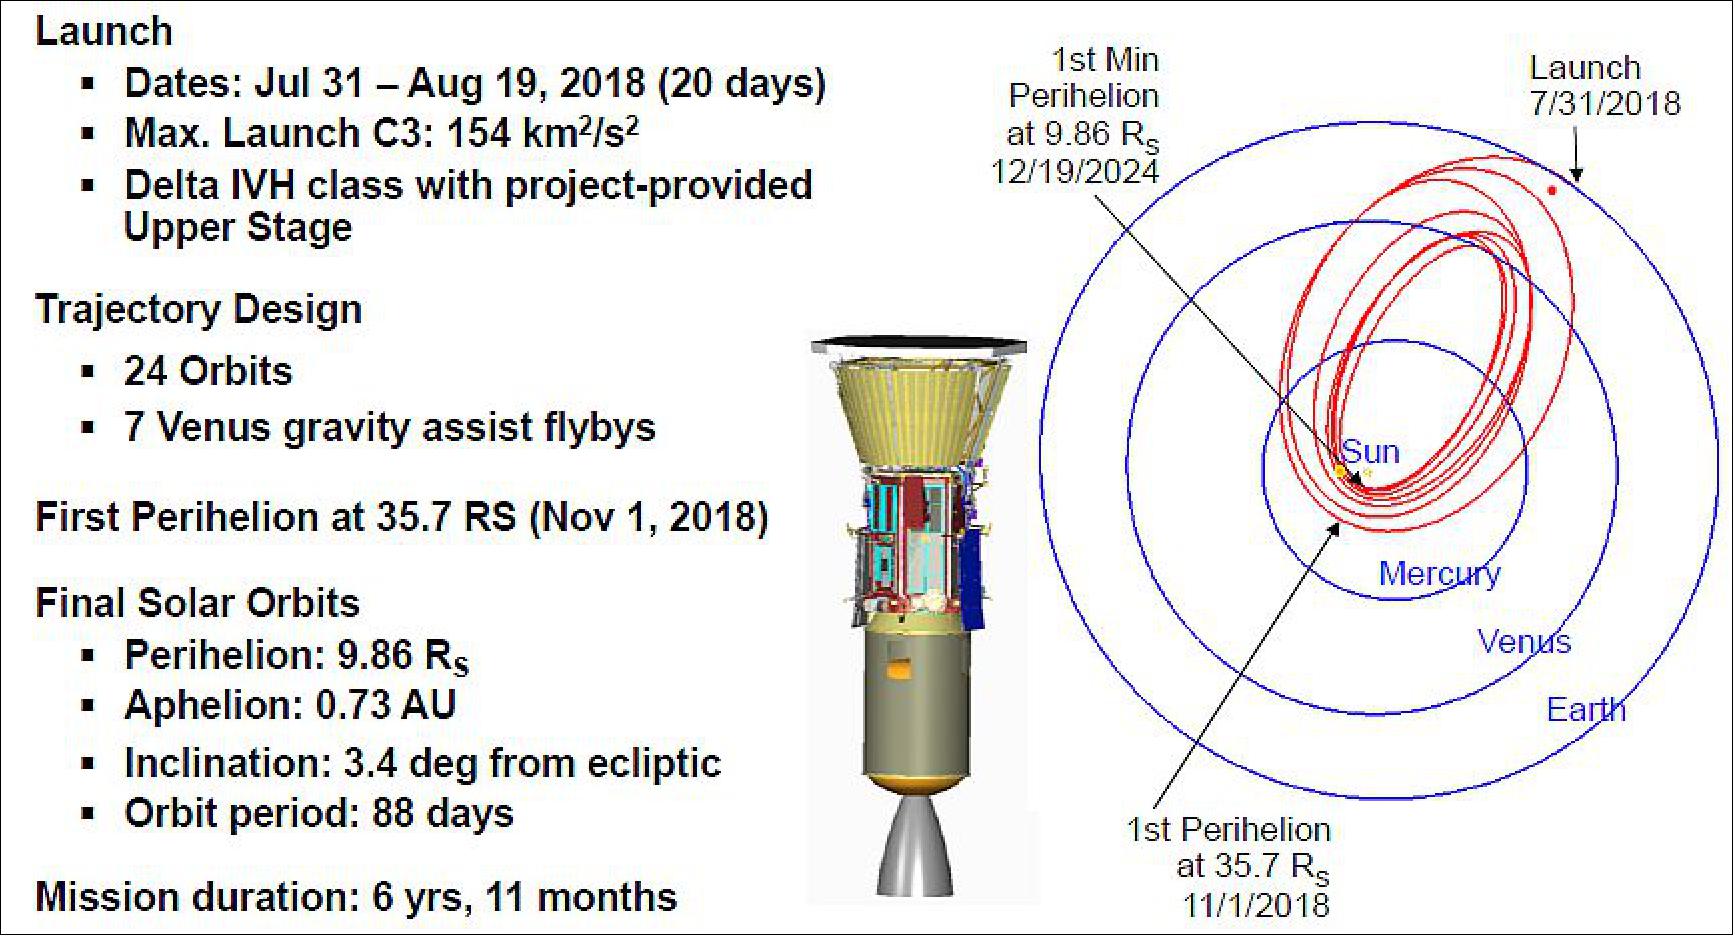
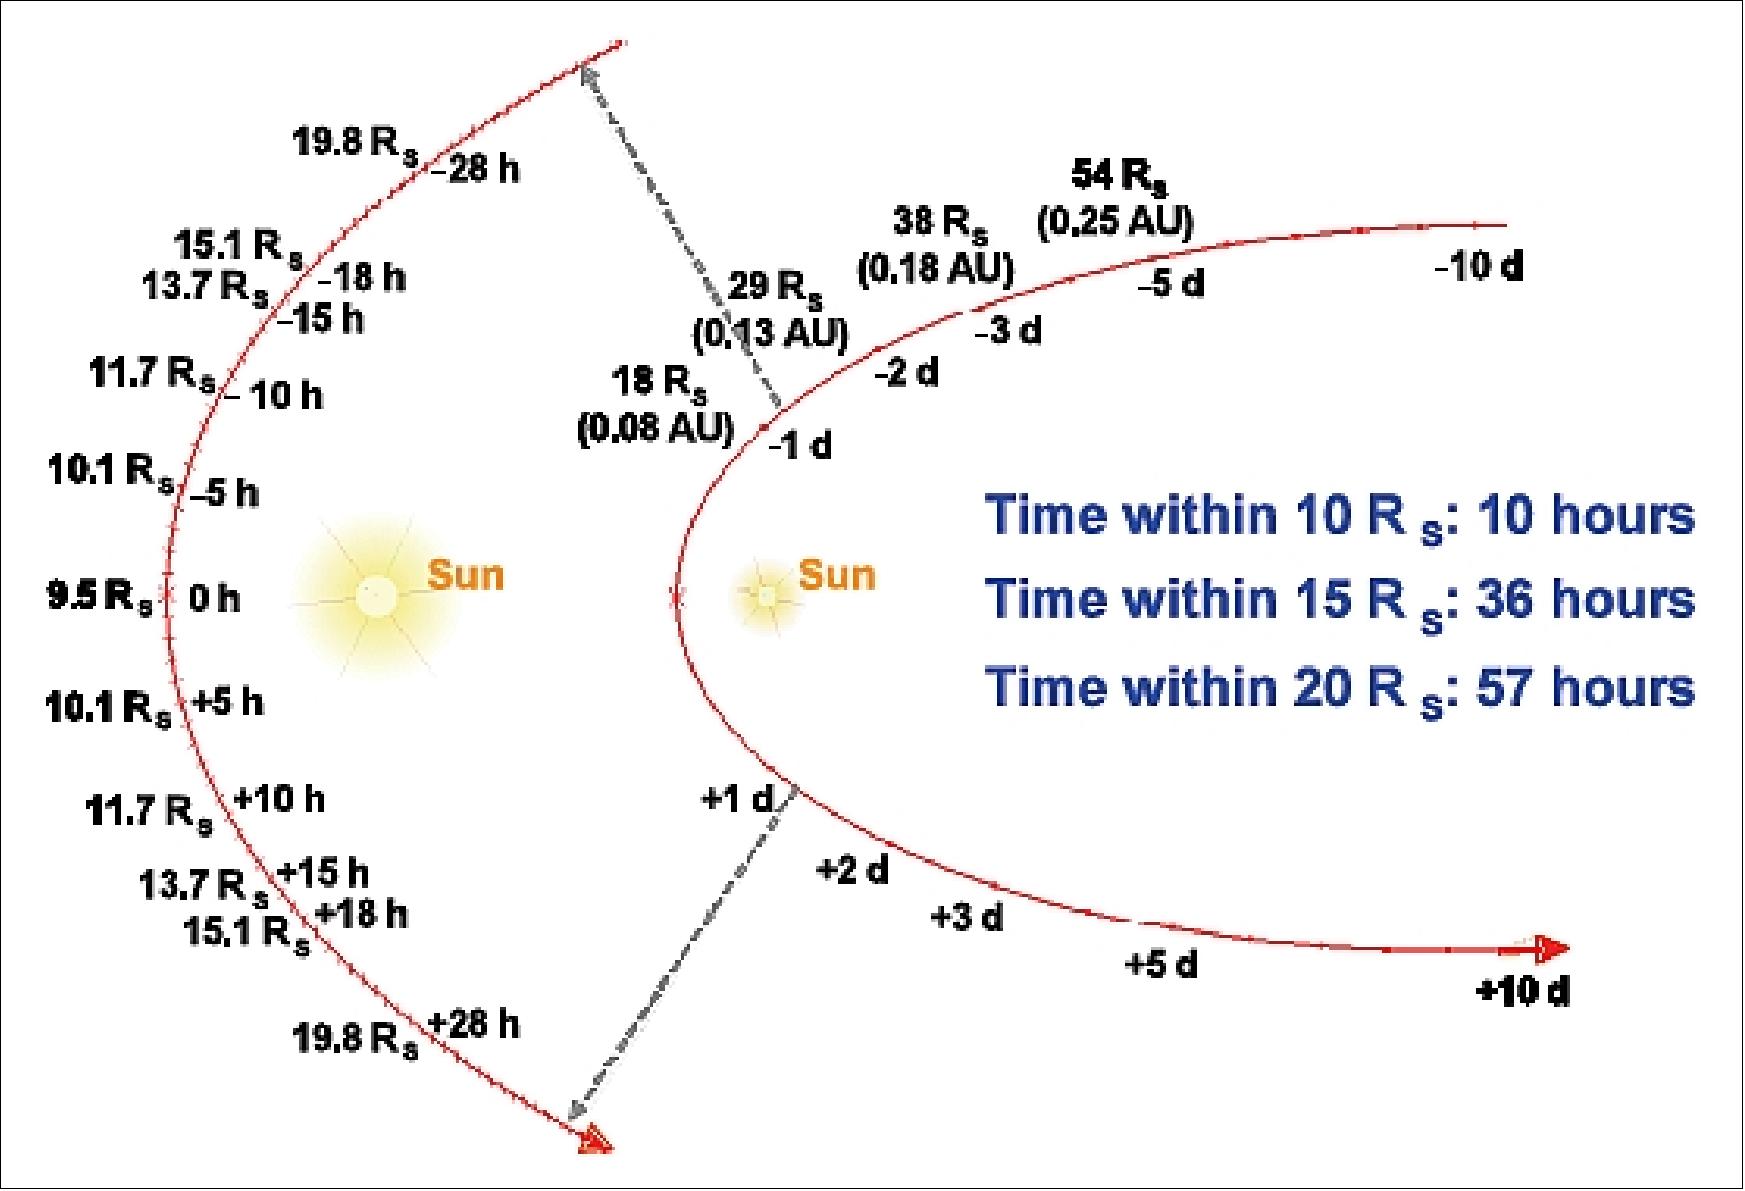
Figure 7 shows the orbit within ± 10 days of perihelion, and an expansion of the region ± 20 Rs. This figure also shows the time spent in each part of the solar encounter of scientific interest for one of the final orbits. In total, SPP will spend more than 2100 hrs closer than 30 Rs, nearly 1000 hours below 20 Rs, and 27 hrs in the region below 10 Rs.
SPP is an ambitious mission, requiring significant technology development in several major areas. Table 3 is a summary of the technology readiness assessment for SPP and gives an indication of the basis for technology. For each area, technology development plans have been established, and in each case, significant progress has been made to achieve TRL (Technology Readiness Level) 6 by PDR (Preliminary Design Review).
Item | TRL (Technology Readiness Level) | Comment |
TPS (Thermal Protection System) | 4 | NASA sponsored technology development |
Solar array | 4 | Combines space heritage and concentrator cells |
Cooling system | 4 | Adapted from heritage systems |
X-/Ka-band transponder | 4 | NASA sponsored technology development |
LEON3 processor | 5 | Qualified product in new JHU/APL application |
Parker Solar Probe of NASA and Solar Orbiter of ESA
• May 16, 2018: Two upcoming missions will soon take us closer to the Sun than we've ever been before, providing our best chance yet at uncovering the complexities of solar activity in our own solar system and shedding light on the very nature of space and stars throughout the universe. 19)
- Together, NASA's Parker Solar Probe and ESA's (the European Space Agency) Solar Orbiter may resolve decades-old questions about the inner workings of our nearest star. Their comprehensive, up-close study of the Sun has important implications for how we live and explore: Energy from the Sun powers life on Earth, but it also triggers space weather events that can pose hazard to technology we increasingly depend upon. Such space weather can disrupt radio communications, affect satellites and human spaceflight, and — at its worst — interfere with power grids. A better understanding of the fundamental processes at the Sun driving these events could improve predictions of when they'll occur and how their effects may be felt on Earth.
- "Our goal is to understand how the Sun works and how it affects the space environment to the point of predictability," said Chris St. Cyr, Solar Orbiter project scientist at NASA's Goddard Space Flight Center in Greenbelt, Maryland. "This is really a curiosity-driven science."
- Parker Solar Probe is slated to launch in the summer of 2018, and Solar Orbiter is scheduled to follow in 2020. These missions were developed independently, but their coordinated science objectives are no coincidence: Parker Solar Probe and Solar Orbiter are natural teammates.
- Both missions will take a closer look at the Sun's dynamic outer atmosphere, called the corona. From Earth, the corona is visible only during total solar eclipses, when the Moon blocks the Sun's most intense light and reveals the outer atmosphere's wispy, pearly-white structure. But the corona isn't as delicate as it looks during a total solar eclipse — much of the corona's behavior is unpredictable and not well understood.
- The corona's charged gases are driven by a set of laws of physics that are rarely involved with our normal experience on Earth. Teasing out the details of what causes the charged particles and magnetic fields to dance and twist as they do can help us understand two outstanding mysteries: what makes the corona so much hotter than the solar surface, and what drives the constant outpouring of solar material, the solar wind, to such high speeds.
- We can see that corona from afar, and even measure what the solar wind looks like as it passes by Earth — but that's like measuring a calm river miles downstream from a waterfall and trying to understand the current's source. Only recently have we had the technology capable of withstanding the heat and radiation near the Sun, so for the first time, we're going close to the source.
- "Parker Solar Probe and Solar Orbiter employ different sorts of technology, but — as missions — they'll be complementary," said Eric Christian, a research scientist on the Parker Solar Probe mission at NASA Goddard. "They'll be taking pictures of the Sun's corona at the same time, and they'll be seeing some of the same structures — what's happening at the poles of the Sun and what those same structures look like at the equator."
- Parker Solar Probe will traverse entirely new territory as it gets closer to the Sun than any spacecraft has come before — as close as 3.8 million miles from the solar surface. If Earth were scaled down to sit at one end of a football field, and the Sun at the other, the mission would make it to the 4-yard line. The current record holder, Helios B, a solar mission of the late 1970s, made it only to the 29-yard line.
- From that vantage point, Parker Solar Probe's four suites of scientific instruments are designed to image the solar wind and study magnetic fields, plasma and energetic particles — clarifying the true anatomy of the Sun's outer atmosphere. This information will shed light on the so-called coronal heating problem. This refers to the counterintuitive reality that, while temperatures in the corona can spike upwards of a few million degrees Celsius, the underlying solar surface, the photosphere, hovers around just 6,000ºC. To fully appreciate the oddity of this temperature difference, imagine walking away from a campfire and feeling the air around you get much, much hotter.
- Solar Orbiter will come within 26 million miles of the Sun — that would put it within the 27-yard line on that metaphorical football field. It will be in a highly tilted orbit that can provide our first-ever direct images of the Sun's poles — parts of the Sun that we don't yet understand well, and which may hold the key to understanding what drives our star's constant activity and eruptions.
- Both Parker Solar Probe and Solar Orbiter will study the Sun's most pervasive influence on the solar system: the solar wind. The Sun constantly exhales a stream of magnetized gas that fills the inner solar system, called solar wind. This solar wind interacts with magnetic fields, atmospheres, or even surfaces of worlds throughout the solar system. On Earth, this interaction can spark auroras and sometimes disrupt communications systems and power grids.
- Data from previous missions have led scientists to believe the corona contributes to the processes that accelerate particles, driving the solar wind's incredible speeds — which triple as it leaves the Sun and passes through the corona. Right now, the solar wind travels some 92 million miles by the time it reaches the spacecraft that measure it — plenty of time for this stream of charged gases to intermix with other particles traveling through space and lose some of its defining features. Parker Solar Probe will catch the solar wind just as it forms and leaves the corona, sending back to Earth some of the most pristine measurements of solar wind ever recorded. Solar Orbiter's perspective, which will provide a good look at the Sun's poles, will complement Parker Solar Probe's study of the solar wind, because it allows scientists to see how the structure and behavior of the solar wind varies at different latitudes.
- Solar Orbiter will also make use of its unique orbit to better understand the Sun's magnetic fields; some of the Sun's most interesting magnetic activity is concentrated at the poles. But because Earth orbits on a plane more or less in line with the solar equator, we don't typically get a good view of the poles from afar. It's a bit like trying to see the summit of Mount Everest from the base of the mountain.
- That view of the poles will also go a long way toward understanding the overall nature of the Sun's magnetic field, which is lively and extensive, stretching far beyond the orbit of Neptune. The Sun's magnetic field is so far-reaching largely because of the solar wind: As the solar wind streams outward, it carries the Sun's magnetic field with it, creating a vast bubble, called the heliosphere. Within the heliosphere, the solar wind determines the very nature of planetary atmospheres. The heliosphere's boundaries are shaped by how the Sun interacts with interstellar space. Since Voyager 1's passage through the heliopause in 2012, we know these boundaries dramatically protect the inner solar system from incoming galactic radiation.
- It's not yet clear how exactly the Sun's magnetic field is generated or structured deep inside the Sun — though we do know intense magnetic fields around the poles drives variability on the Sun, causing solar flares and coronal mass ejections. Solar Orbiter will hover over roughly the same region of the solar atmosphere for several days at a time while scientists watch tension build up and release around the poles. Those observations may lead to better awareness of the physical processes that ultimately generate the Sun's magnetic field.
- Together, Parker Solar Probe and Solar Orbiter will refine our knowledge of the Sun and heliosphere. Along the way, it's likely these missions will pose even more questions than they answer — a problem scientists are very much looking forward to.
- "There are questions that have been bugging us for a long time," said Adam Szabo, mission scientist for Parker Solar Probe at NASA Goddard. "We are trying to decipher what happens near the Sun, and the obvious solution is to just go there. We cannot wait — not just me, but the whole community."
Spacecraft
At 9.5 Rs, the solar intensity is 512 times that at 1AU. SPP is packaged behind the carbon-carbon TPS (Thermal Protection System), a 11 cm thick heat shield, to protect it from this extreme solar environment and allow it to operate at standard space thermal environments while the TPS experiences temperatures of 1400ºC on its sun-facing surface. SPP utilizes actively cooled solar arrays for power generation maintaining the solar cells within required temperature limits (Ref. 3). 20) 21)
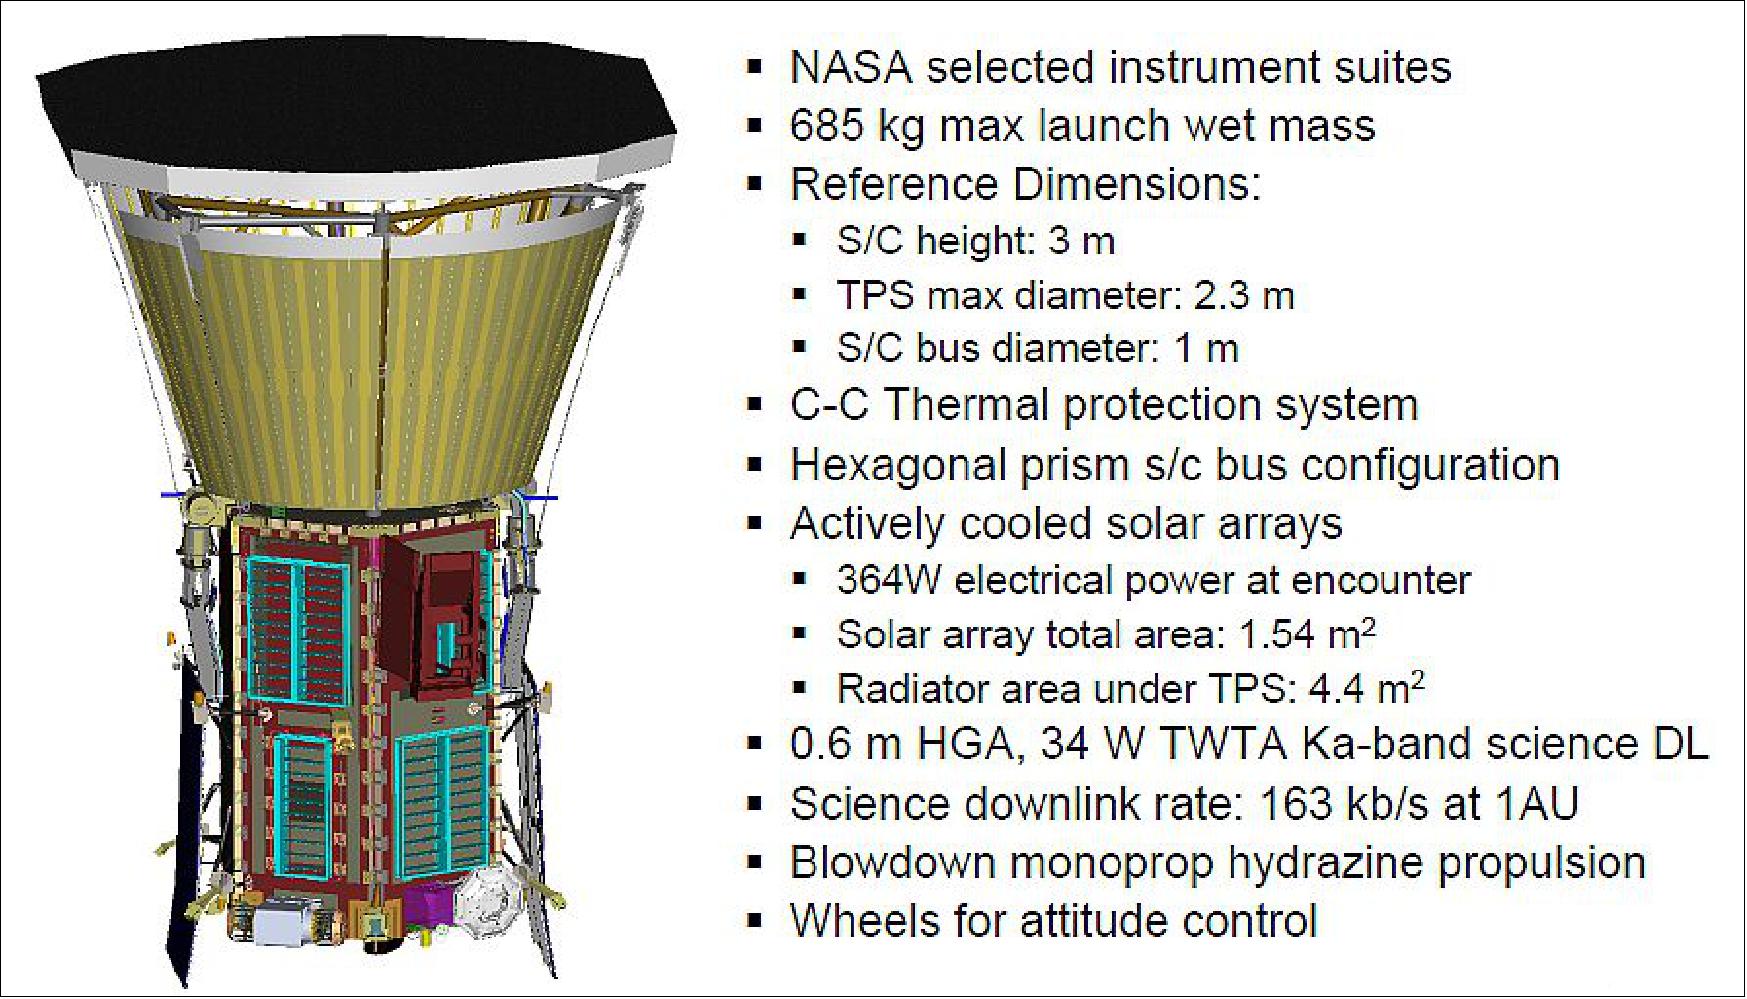
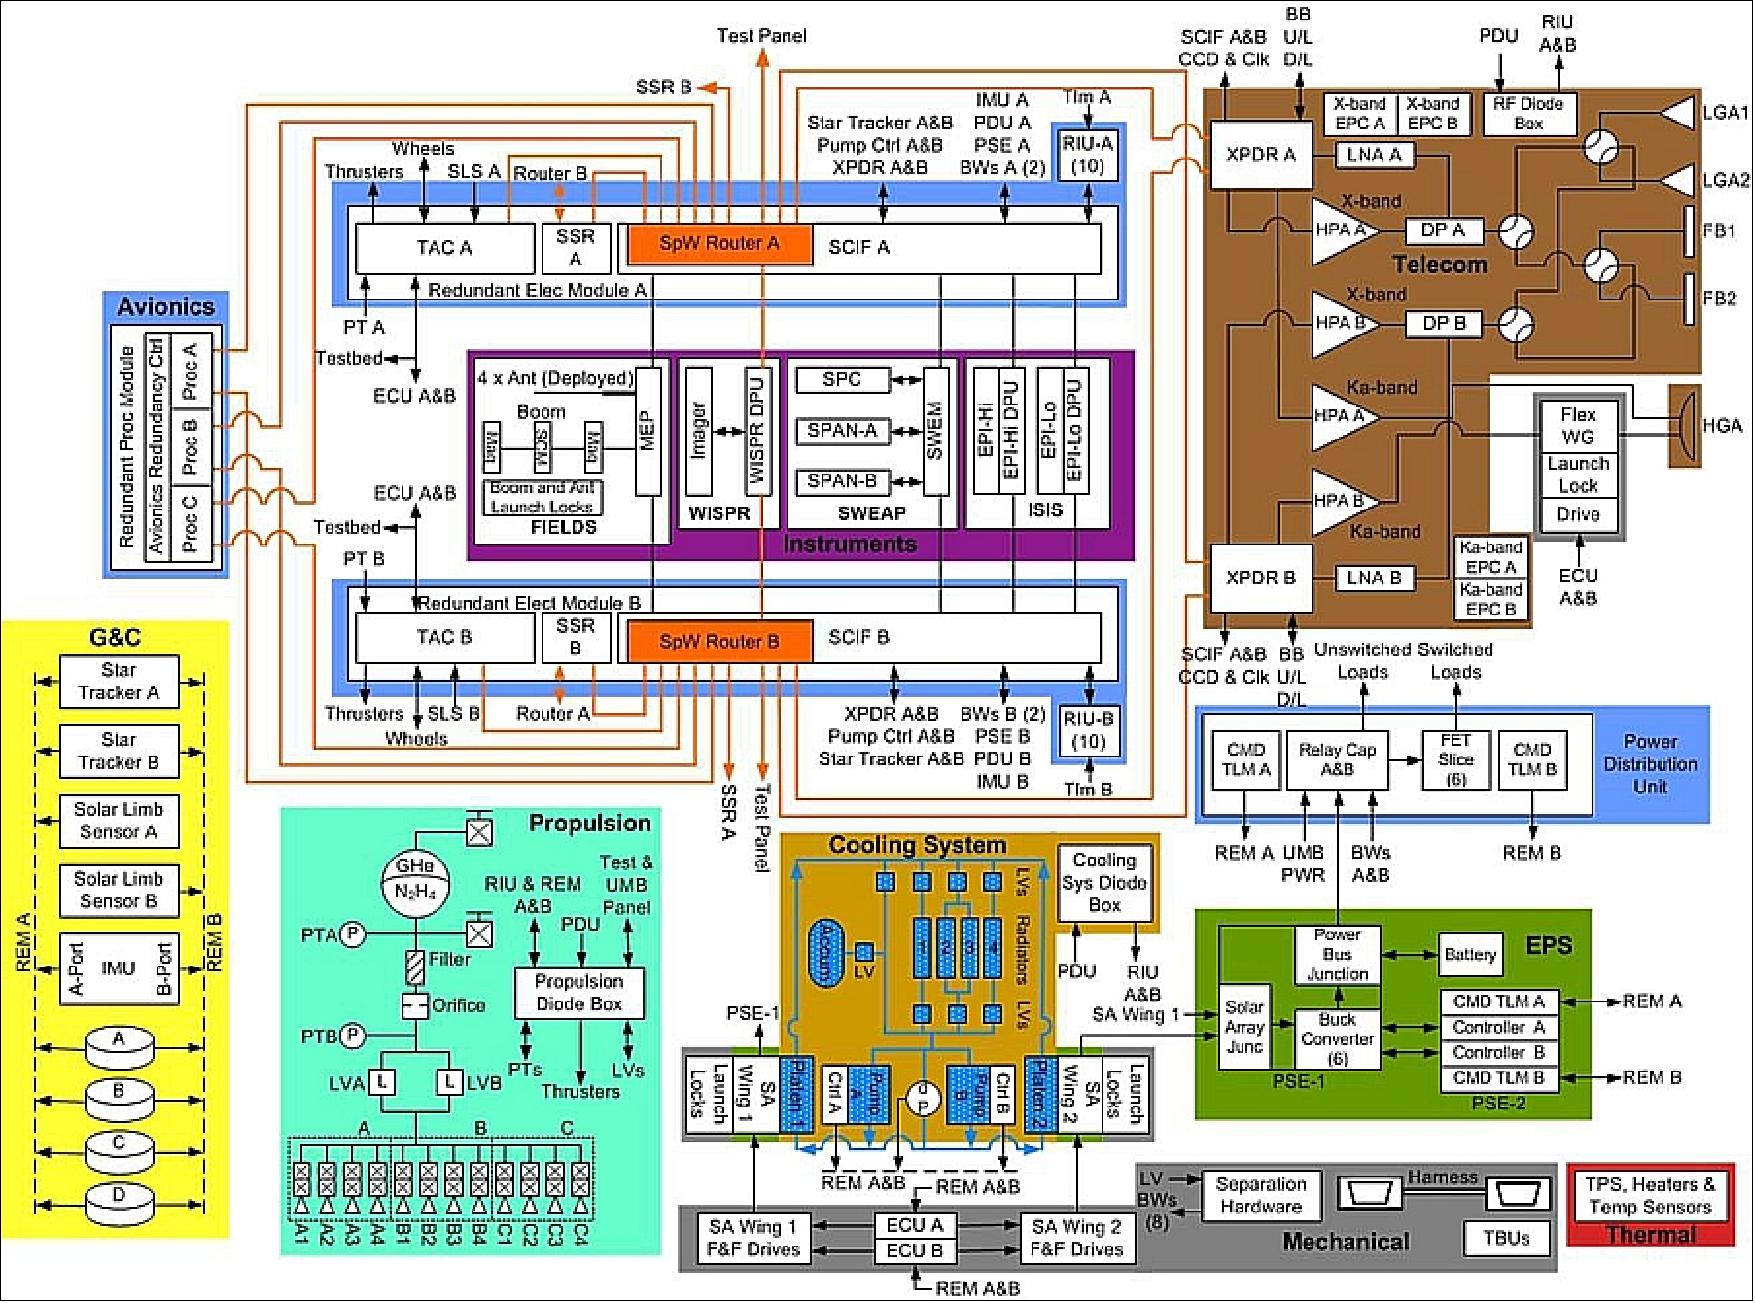
Solar Probe Plus is a 3-axis stabilized spacecraft, shown in Figure 8, with functional block diagram in Figure 10.
TPS: The most prominent feature is the 2.3 m diameter TPS, with associated structure used to attach the shield to the spacecraft. The TPS protects the bus and payload within its umbra during solar encounter. The conceptual science instruments are mounted either directly to the bus, on a stand-off bracket near the fairing attachment, or on a science boom extended from the rear of the spacecraft.
In general, the payload is protected from the effects of solar exposure by the TPS. Two notable exceptions are the SPC (Solar Probe Cup), part of the SWEAP investigation, and the electric field antennas carried as part of the FIELDS investigation. Both sensor packages extend beyond the TPS and see the same environment as the TPS sunward-looking face. Both sensors are of high heritage; however the solar environment during solar encounter is significantly more severe than all previous experience. Therefore, technology development programs for each have been implemented to demonstrate the operation of each in the expected SPP environment.
Three deployable conceptual carbon-carbon plasma wave antennas are mounted 120º apart on the side of the bus. These antennas will partially protrude beyond the umbra during encounter. The solar array cooling system dissipates the high solar flux absorbed by solar array wings during closest approach to the sun enabling the solar cells to operate within their temperature constraints while providing the required electrical power. Water in the cooling system is pumped from the outboard-most edge of the solar array substrate, or platen, up through channels in the solar array wings into the four cooling system radiators mounted under the TPS and back through the pump located on the top deck of the spacecraft. The system can dissipate 6000 W of heat at perihelion, and is designed and operated to prevent freezing at aphelion.
The new configuration uses a single pair of arrays to generate power. The bulk of the solar array panel is filled with "primary cells" similar to cells used on the MESSENGER mission to Mercury, while the angled panel on the end of the solar arrays use cells designed to withstand the high illumination during perihelion.
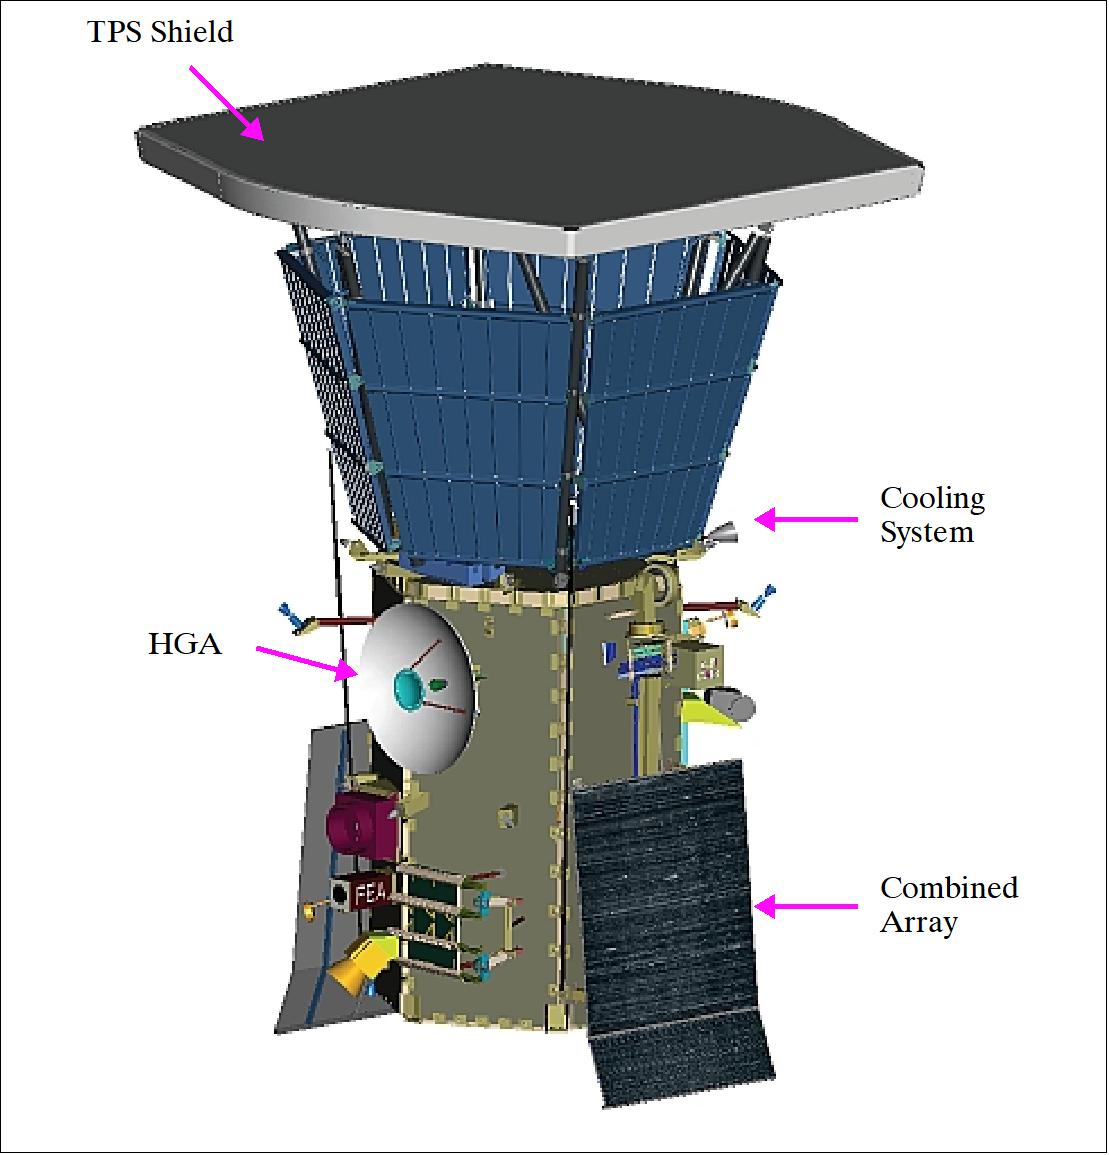
At aphelion, the entire array is exposed to sunlight. As the spacecraft nears the sun, the array is tilted toward the spacecraft body until at perihelion only the end of the array is exposed to sunlight in the penumbra created by the TPS knife edge. The array substrate is a titanium plate with channels running under the cells. Water pumped through this panel carries heat to radiators mounted on the TPS support structure. Figure 11 shows the configuration at perihelion.
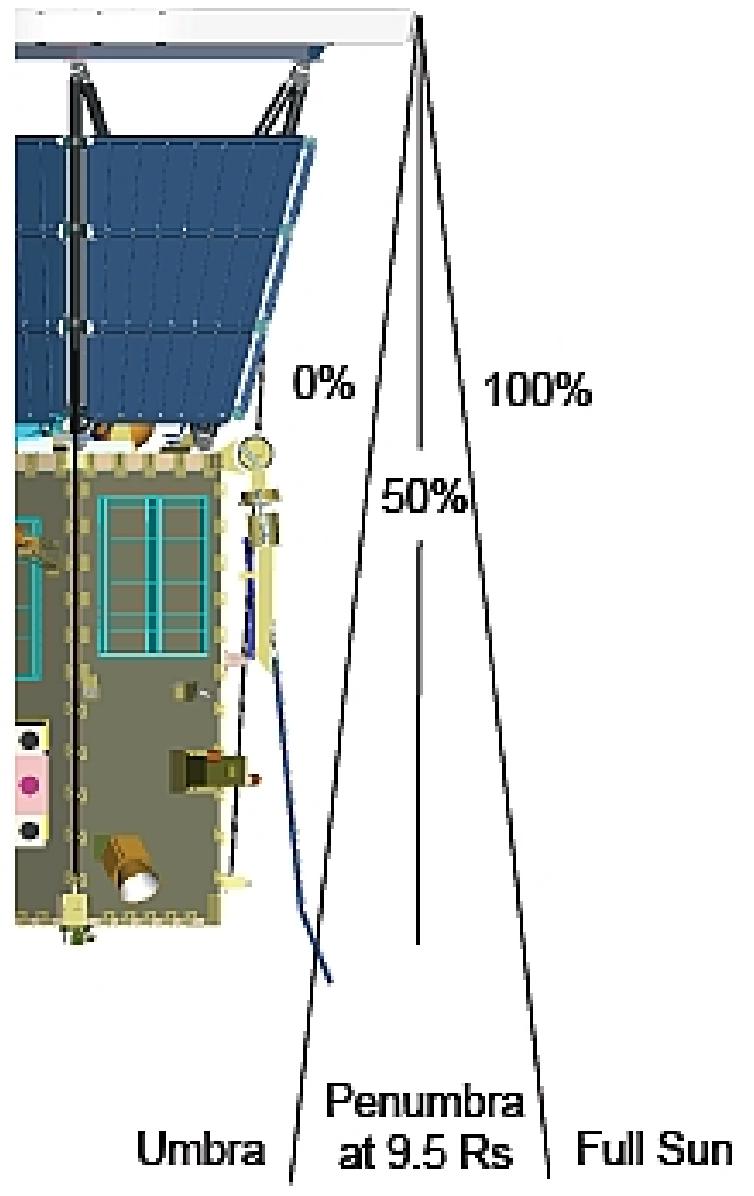
Technology development work on TPS has resulted in several changes to the design. The TPS remains a carbon-carbon and carbon foam sandwich, with a ceramic coating on the Sun-facing surface to control reflectance and emissivity properties. The shape and size of the TPS has changed to optimize mass while considering manufacturability and the need for longer knife edges for illumination control of the solar arrays. In particular, the TPS has shrunk from nearly 3 m in diameter to reflect more efficient packaging of the spacecraft.
The spacecraft in Figure 8 also reflects the new antenna configuration, including a 0.6 m HGA (High Gain Antenna) mounted on the body of the spacecraft instead of a boom. In addition to mass optimization, this change removes the need to deploy and retract the HGA each orbit to protect it from thermal damage at perihelion, thus increasing the reliability of the system.
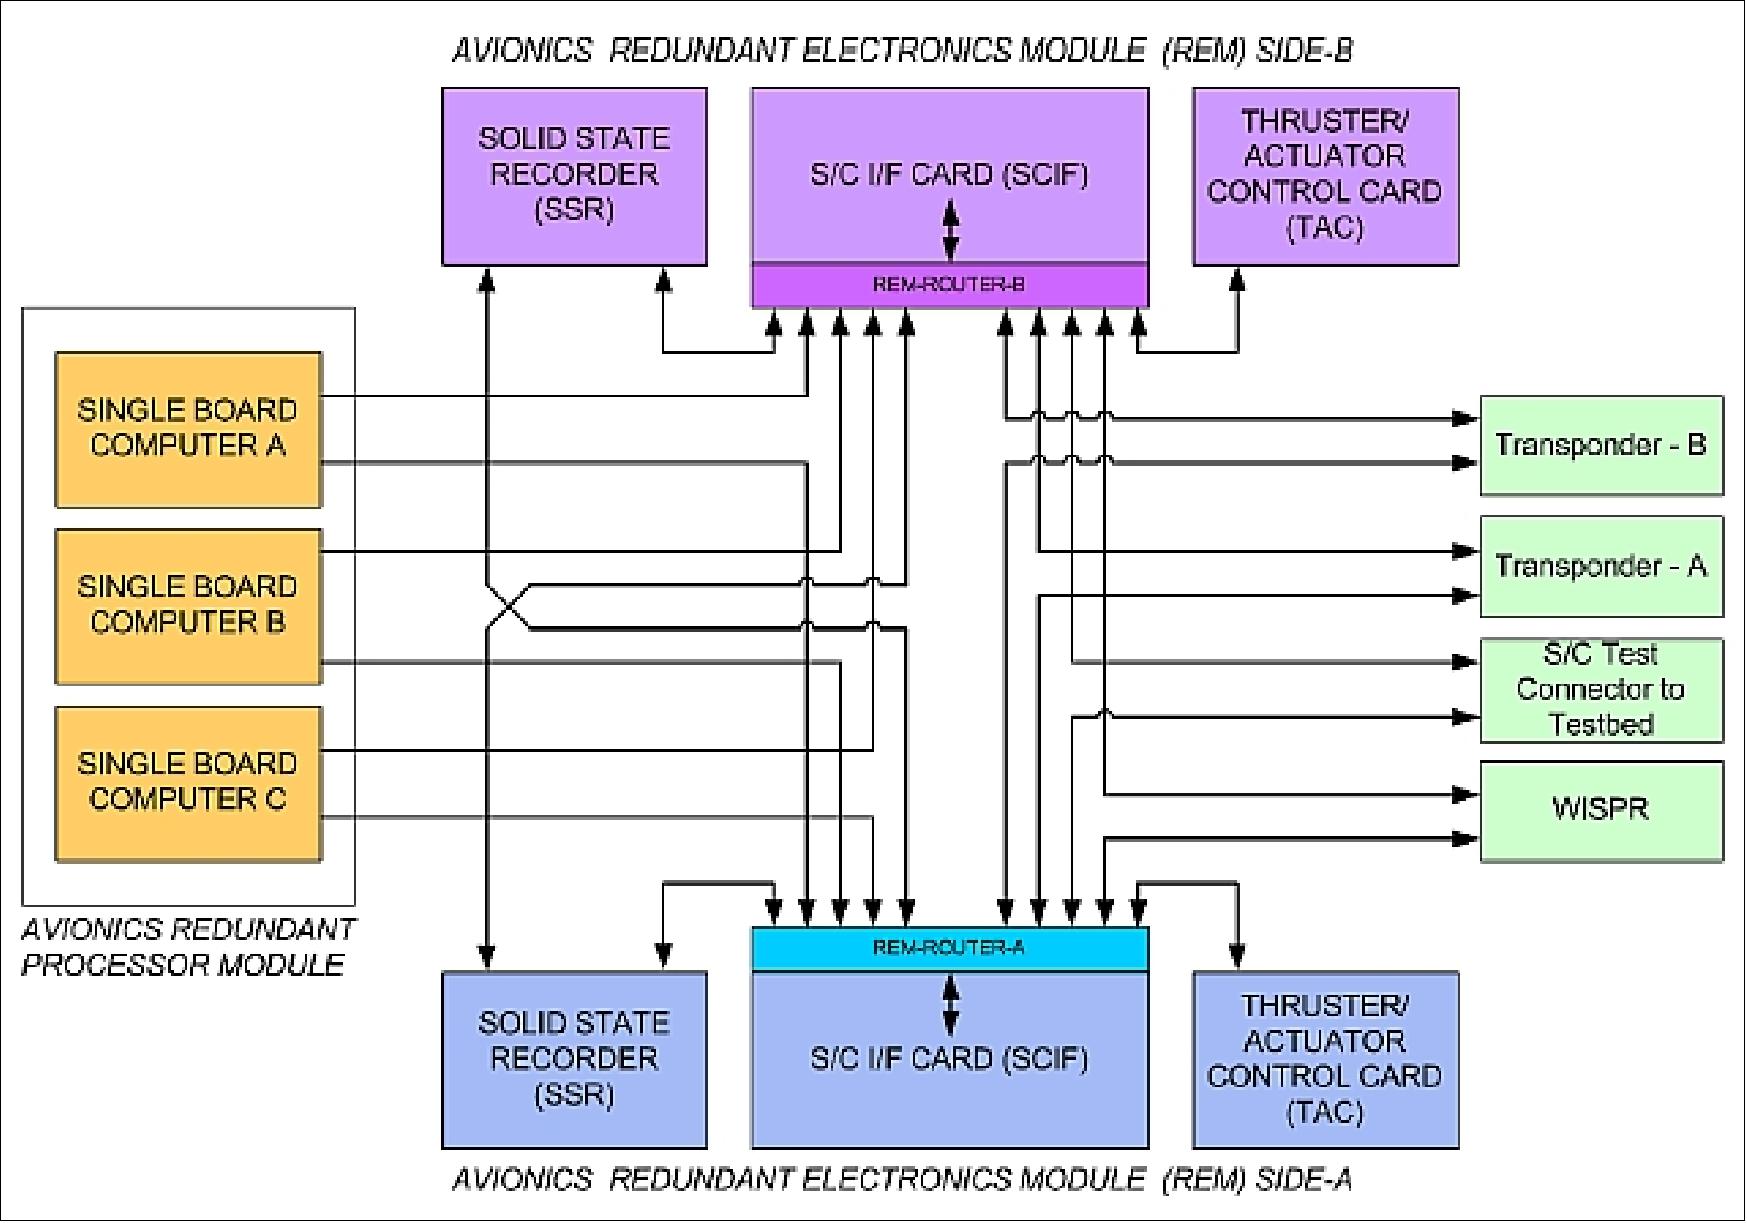
The design uses a blowdown monopropellant hydrazine system for propulsion, with thrusters for attitude control and trajectory correction. Star Trackers and an internally redundant IRU (Inertial Measurement Unit) are included for guidance and control. The avionics suite is based on the APL IEM (Integrated Electronics Module) and PDU (Power Distribution Unit) used in most APL missions over the last decade or more. The IEM houses the command and data handling processor, solid-state recorder, interface to the guidance and control instruments, and payload interface. The PDU is an internally redundant box that includes all power switching. RIO (Remote I/O) devices are used to collect spacecraft telemetry, and communicate with the avionics suite through serial data links.
Avionics and SpaceWire Network: 22)
• SpaceWire selected over 1553: SpaceWire offers greater bandwidth and lower emissions
• Redundant processor module: (prime, hot spare, warm spare)
• Redundant electronic modules: SSRs (Solid State Recorders) are cross strapped
• Two cross strapped transponders.
Communication Coverage Profile
Adequate communication links between ground and spacecraft are essential for mission operations. Transmissions of spacecraft operation commands, spacecraft telemetry, science observation sequences, and instrument measurement data between the SPP spacecraft and ground are through the spacecraft Telecomm system and NASA's DSN (Deep Space Network) of tracking stations located at Goldstone in the United States, Canberra in Australia, and Madrid in Spain. Besides the data transmission, navigation of the SPP spacecraft will rely on regular and periodic tracking of the spacecraft through the DSN. The communication coverage of the spacecraft over the mission duration directly affects the spacecraft's operation, science data download, navigation, and the control of the flight trajectory. Due to launch and navigation errors, the flight trajectory needs to be periodically adjusted by applying a TCM (Trajectory Correct Maneuver). Availability of adequate navigation tracking and communication links to the spacecraft dictates the placement of the trajectory correction maneuvers, which has direct impacts on the onboard ΔV budget (Ref. 21).
A comprehensive study of detailed communication coverage over the entire mission was conducted in Phase B across multiple SPP subsystem teams. Because of the unique operation environment of the SPP mission, many factors must be understood in order to maintain adequate communications with the spacecraft. First, the highly elliptical solar orbits across the inner solar system cause frequent solar conjunctions, sometimes with extended periods. And secondly, the spacecraft's TPS obstructs the view of the antenna and causes extra outage of communication times.
The X-band is baselined for spacecraft tracking for navigation and works for both uplink and downlink modes. The Ka-band is mainly for science data downlink and works only for the downlink mode.
Besides the communication outage due to the solar conjunctions attributed to the viewing geometry of Sun, Earth, and the spacecraft, the TPS of the spacecraft sometimes causes additional outage. Because of the extremely high heat radiated from the Sun, the spacecraft bus must be constantly protected from direct solar radiation to prevent overheating. When spacecraft solar distance is less than 0.7 AU, the spacecraft must be oriented with the TPS pointed at the Sun, so that the spacecraft bus and components including the antennas are behind the TPS and are protected inside the TPS umbra. Since the antennas are behind the TPS, some of the radio transmission is obstructed by the TPS. About 14° of the field of view from the center of the TPS is blocked. When the direction of Earth is near the direction of the Sun and within the 14° cone angle about the TPS center, the view from the SPP antenna to Earth is obstructed by the TPS, thereby preventing communication between Earth and the spacecraft.
The survive the extreme solar radiation conditions, the TPS must remain pointed toward the sun at all times. The flight software is required to be capable of controlling attitude within 5 seconds of a processor reset or demotion. The spacecraft has three flight processors (prime, hot spare, and backup spare) to meet this requirement. The tight TPS pointing requirements cause geometric challenges for communications with earth resulting in severely limited communication availability and bandwidth. The SPP spacecraft will use Ka-band downlink transmissions which provide high throughput with CFDP (CCSDS File Delivery Protocol) to return as much data as possible. The SPP spacecraft will use X-band uplink with CFDP to provide efficient guaranteed delivery of commands and save uplink bandwidth when deploying command loads to multiple processors. 23)
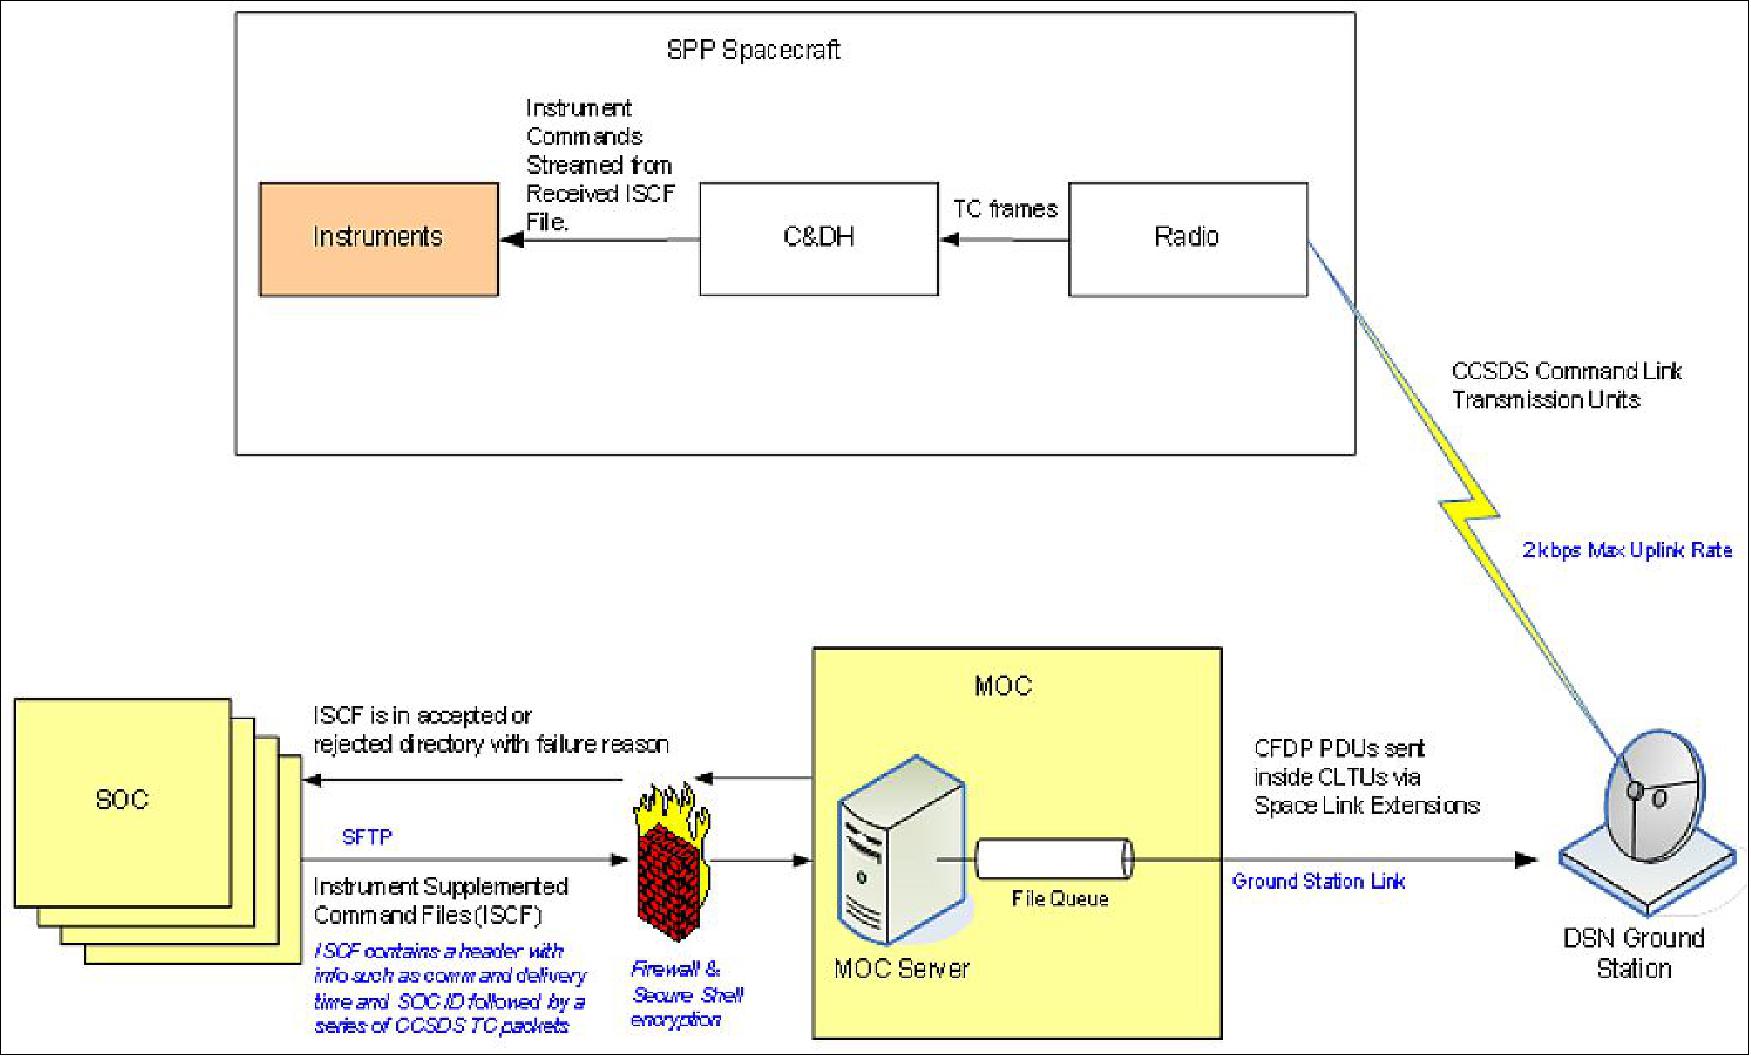
Commanding: The SPP flight software reuses heritage code from JHU/APL missions designed to use CCSDS Telecommand packets for commanding. The SPP Ground Software has a database of commands which can create telecommand packets and package them into CLTUs (Command Link Transmission Units). SPP supports the unreliable delivery Expedited Service (BD Service) of the CCSDS Communications Operations Procedure-1 (COP-1) commanding protocol. SPP does not support the reliable Sequence-Controlled Service (AD Service) of COP-1 commanding. The COP-1 AD Service is not well suited for deep space without modification as it provides a limited maximum number of commands without acknowledgment and requires significant retransmission if a single command is dropped.
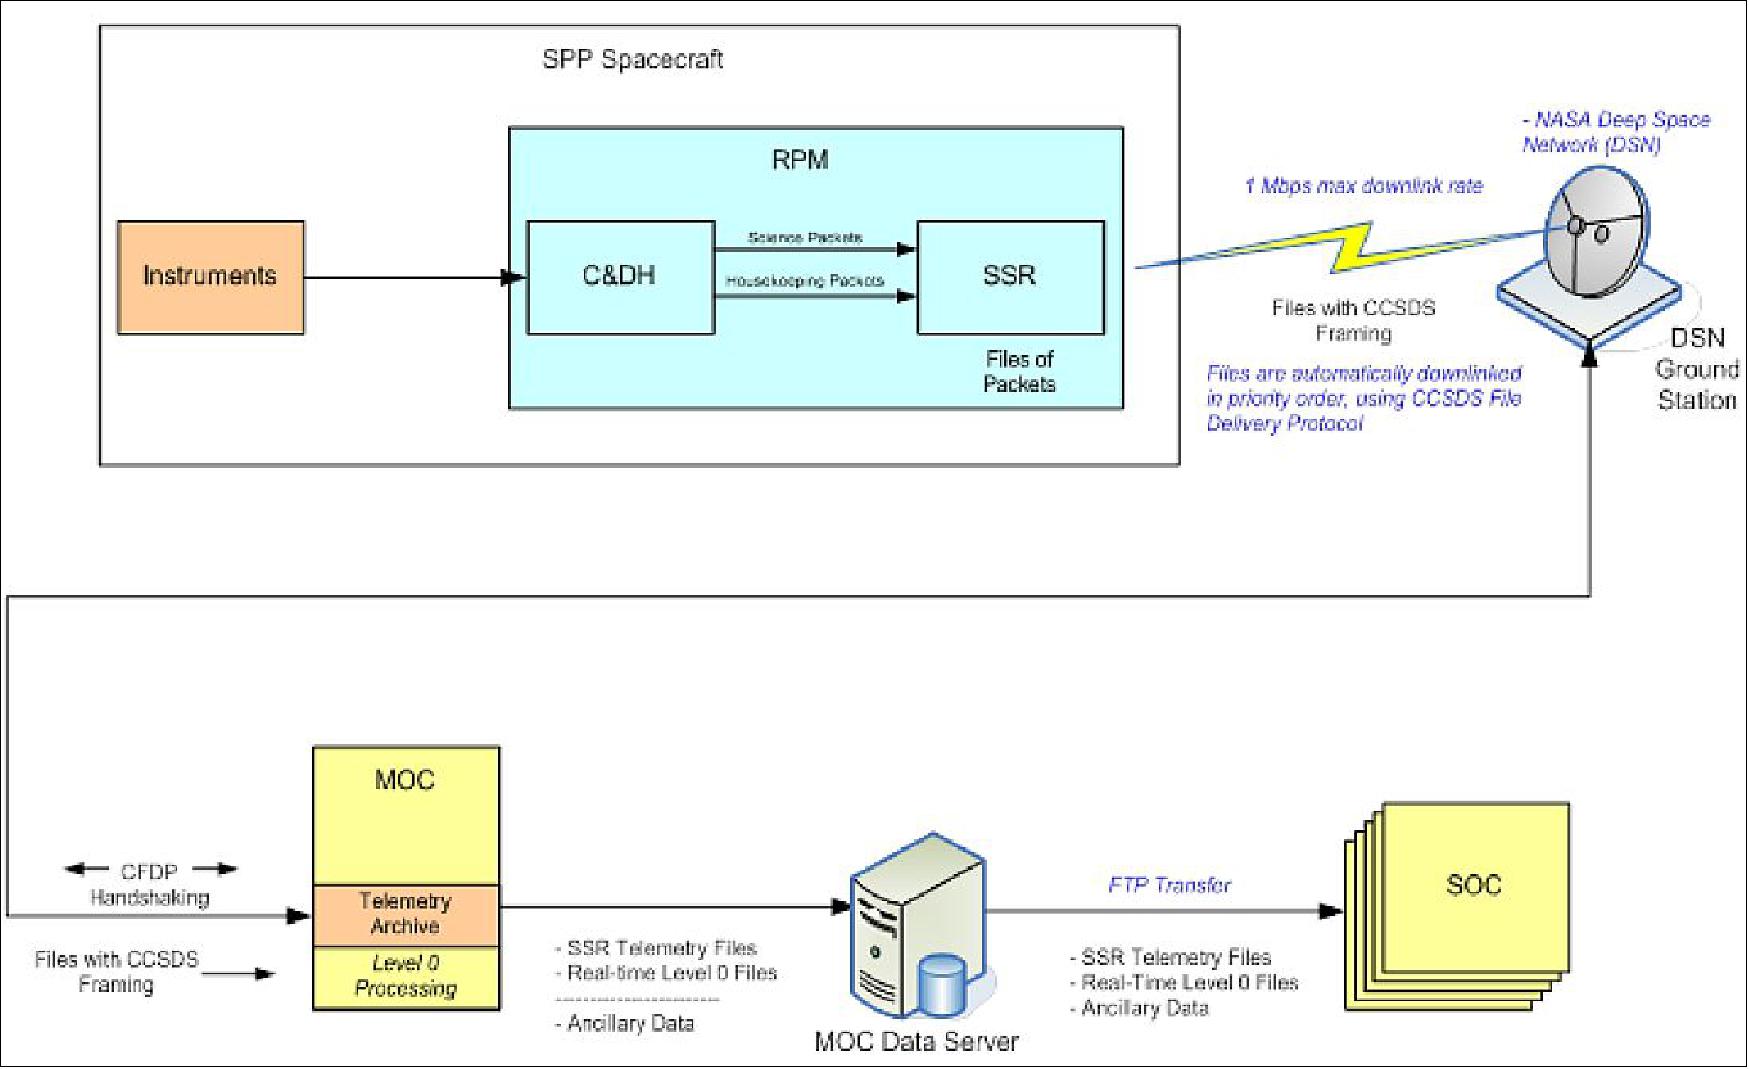
SPP is a decoupled mission where each SOC (Science Operations Center) can command their instrument as they see fit. Aside from a limited set of calibration activities and earth pointing for communications (when allowed), the spacecraft pointing is fixed at the sun. There is no coordination required between the SOCs and the MOC (Mission Operations Center) to point the spacecraft. The MOC validates that instrument commands are well-formed, targeted to the right destination, and have an APID (Application Identifier) within the assigned instrument APID range prior to allowing transmission to the spacecraft. The MOC does not perform any further validation of instrument commands. The flight software will only send instrument CF contents to the target instrument interface. Instruments can only be commanded via files sent to the MOC by SFTP. These command files are queued and later uplinked to the spacecraft. A separate sequence number will be used for each instrument interface. This guarantees the ordering of files sent to the instrument interface while not impacting sequencing of CDH (Command and Data Handling) or other instrument command files. Due to power constraints, instruments are off during Ka telemetry downlinks, but files can still be uplinked during this period and later streamed to the instrument when it is powered on. Figure 12 highlights the steps involved in sending instrument commands to the target instrument.
The MOC runs a file queue management application that is responsible for initiating the uplink file transfers. The spacecraft CDH and instrument files are all stored in separate queues in this application. Instrument files have an enable time when it is considered acceptable to send them to the spacecraft and a time-out time when an opportunity would have been missed and it no longer makes sense to uplink the file. MOC files are queued in realtime by a contact plan and do not have time out times. Each queue can be enabled for file selection or disabled by the MOC. This application will select the next file by checking for priority files first and then doing a round-robin selection between each enabled command interface with a file that is ready to send.
Telemetry: JHU/APL uses the SLE (Space Link Extension)) Return All Frames (RAF) service to receive CCSDS telemetry frames from the spacecraft. Virtual channels are assigned for real-time telemetry, recorded data on SSR (Solid State Recorder), and realtime fill frames. The process of prioritizing and playing back SSR telemetry via CFDP has been used quite successfully on the MESSENGER and Van Allen Probes missions. SSR Housekeeping telemetry is ingested into the MOC telemetry archive. Instrument SSR telemetry files will be provided directly to SOCs with no processing by the MOC.
SPP will record telemetry immediately before a low data rate contact and use CFDP to guarantee delivery of the most critical data during this contact. Figure 13 shows the high level flow of instrument telemetry from creation to the SOC.
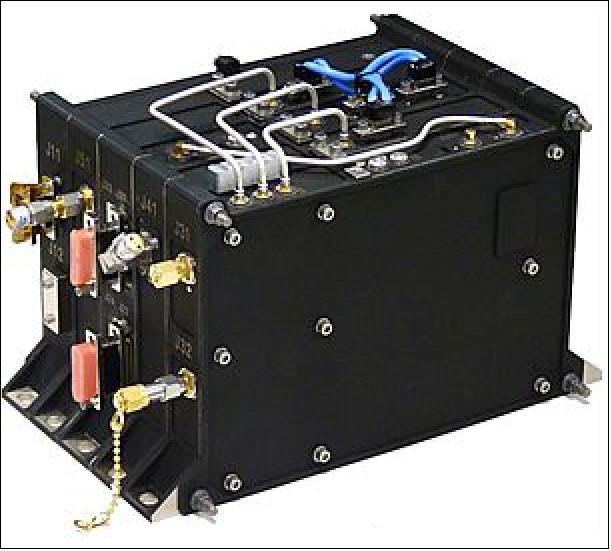
Frontier Radio on SPP Mission 24)
NASA has selected the Frontier Radio DS (Deep Space) version, developed by JHU/APL, for the communication for the SPP (Solar Probe Plus) mission. The VAP (Van Allen Probes) mission successfully transitioned the Frontier Radio technology to TRL-9 in an S-band duplex configuration for Near-Earth applications (Frontier NE). The successful VAP effort and TRL-6 X/X/Ka-band development efforts provided a deep space Frontier Radio (Frontier DS) with high heritage from the TRL-9 near-Earth unit. The low-SWaP (Size, Weight, and Power) and intrinsically high radiation tolerance of the Frontier Radio DS uniquely qualified it for the SPP application and resulted in the mission baselining this radio. As with VAP for the near-Earth radio, the SPP effort supported the maturation of the deep space radio enhancements, including the necessary compatibility testing with the DSN (Deep Space Network). Flight Frontier Radios for the SPP mission (Figure 14) have completed qualification as of August 2016 and will be integrated into the spacecraft during the remainder of 2016. 25)
Launch
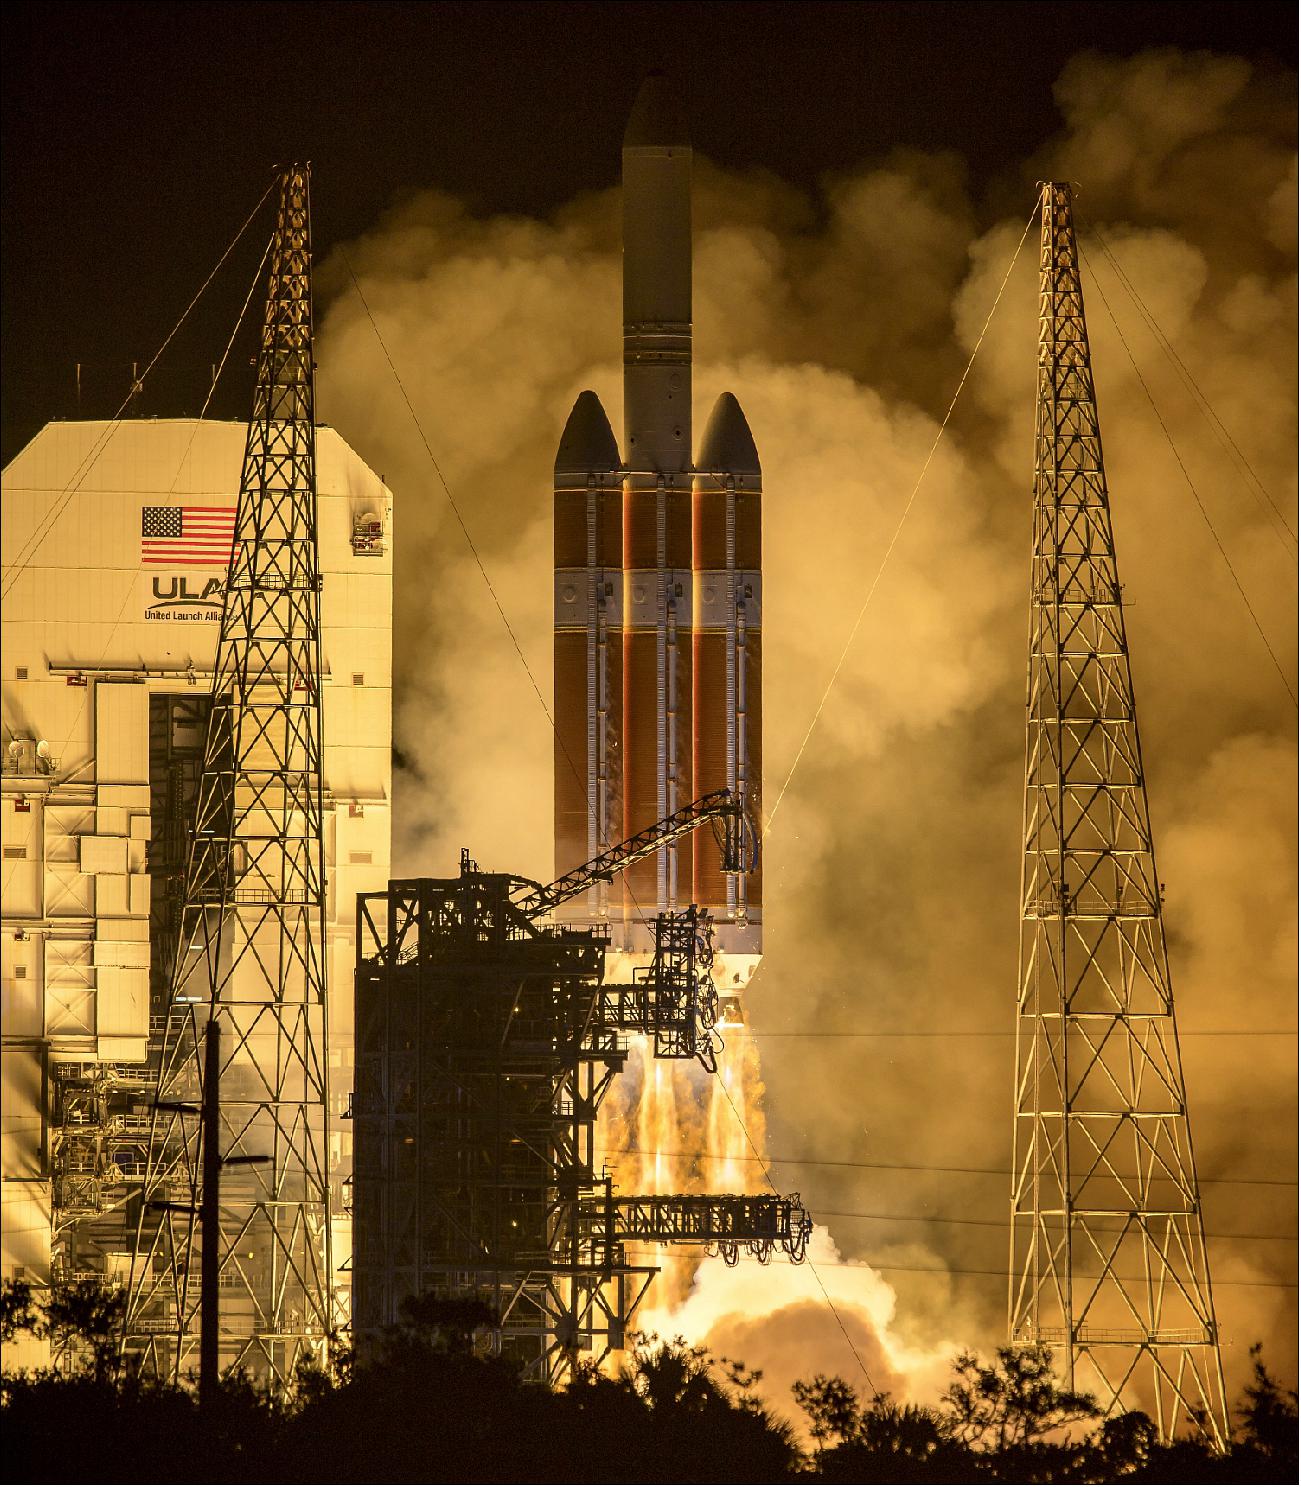
The Parker Solar Probe spacecraft was launched on 12 August 2018 (07:31 UTC) from SLC-37B (Space Launch Complex -7 B) of the Cape Canaveral Air Force Station, Florida. The launch vehicle was a Delta-4 Heavy rocket of ULA (United Launch Alliance), augmented by Orbital ATK's Star-48 solid motor as a third stage, in order to cope with the extremely high energy required for this flagship mission. 26) 27) 28)
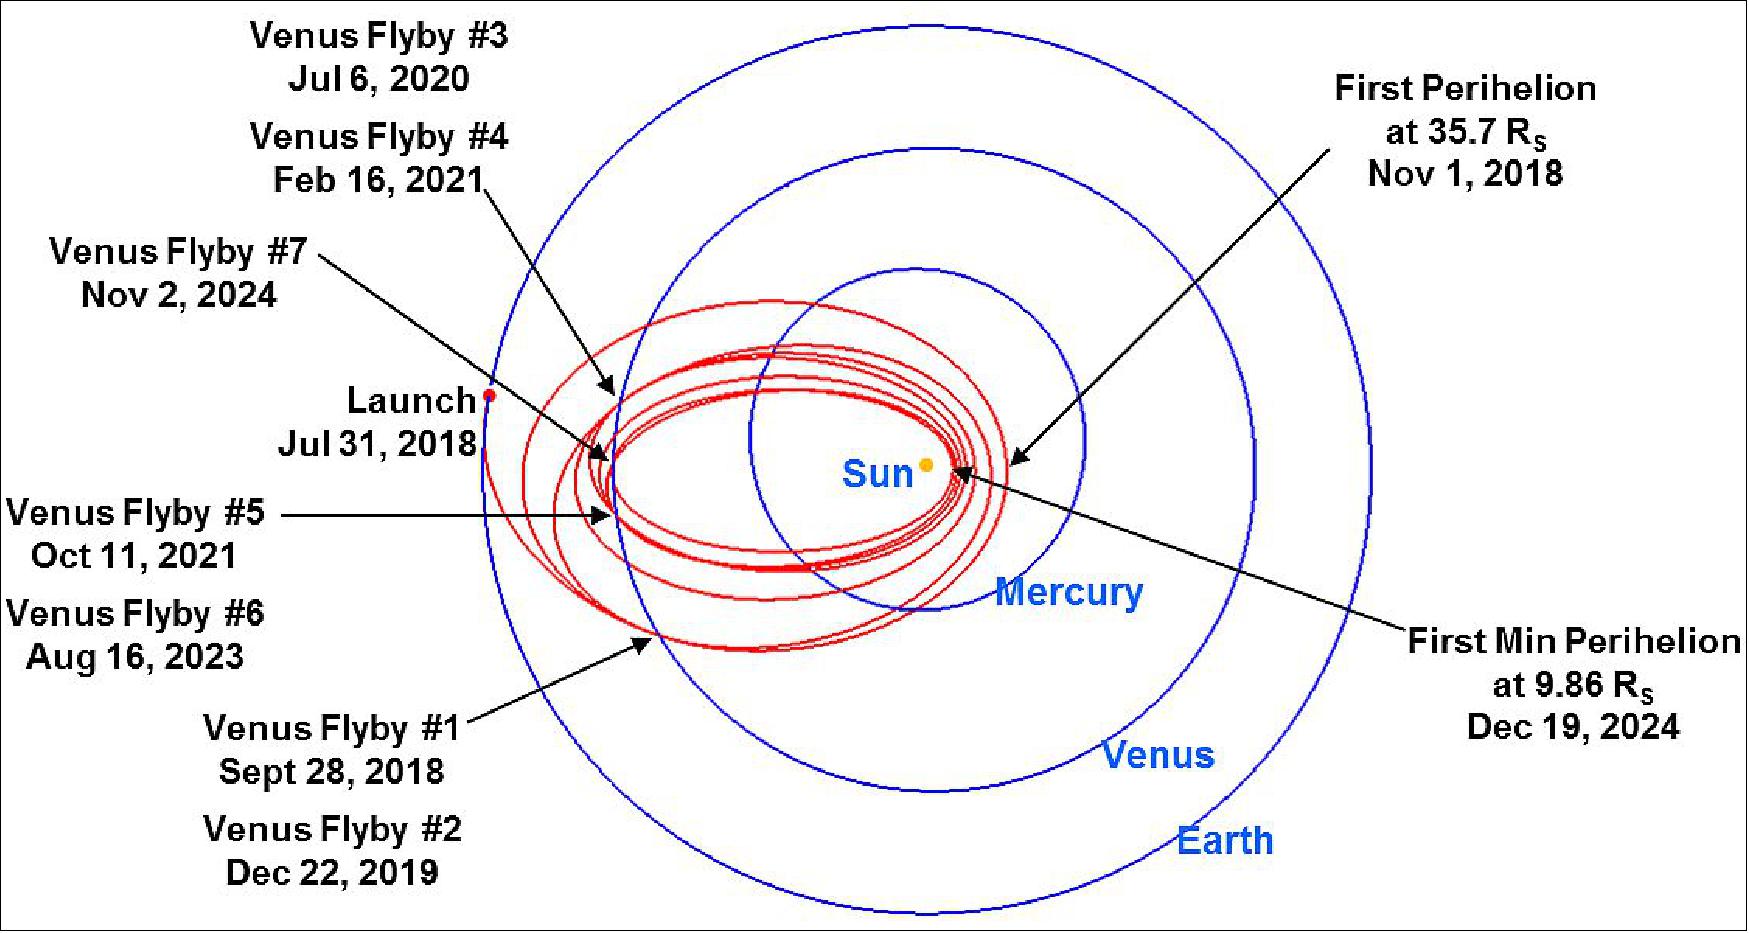
Orbit: The trajectory able to send the spacecraft within 10 RS (Solar Radii) of the Sun center is a Venus-Venus-Venus-Venus-Venus-Venus-Venus-Gravity-Assist (V7GA) trajectory, a unique trajectory developed to enable the Parker Solar Probe mission without a Jupiter gravity assist. Even with the most powerful launch vehicle and upper stage, a spacecraft cannot get close to the Sun from Earth directly. Extra energy must be shed off the spacecraft's orbit to further reduce its heliocentric orbital velocity in order to encounter the Sun under 10 RS. The V7GA trajectory allows for the spacecraft to reduce the necessary orbital speed via multiple Venus gravity assists.
The amount of required orbital speed reduction required at aphelion is too large to come from one or two Venus flybys. Attaining the aphelion orbital speed reduction will require seven Venus flybys. Following each Venus flyby, the orbital speed at aphelion will decrease, resulting in a smaller orbit with a shorter perihelion distance. After seven Venus flybys, orbit perihelion distance will gradually decrease to 9.86 RS, the minimum solar distance required for the baseline mission. Throughout the mission there are no additional deep space maneuvers; all the orbit changes as well as the phasing (Venus-to-Venus transfer location and timing) between each Venus flyby are achieved through the control of the Venus flybys by appropriate selection of the Venus flyby target parameters. To minimize the mission duration, both resonant and non-resonant Venus flybys are utilized in this trajectory design (Ref. 21).
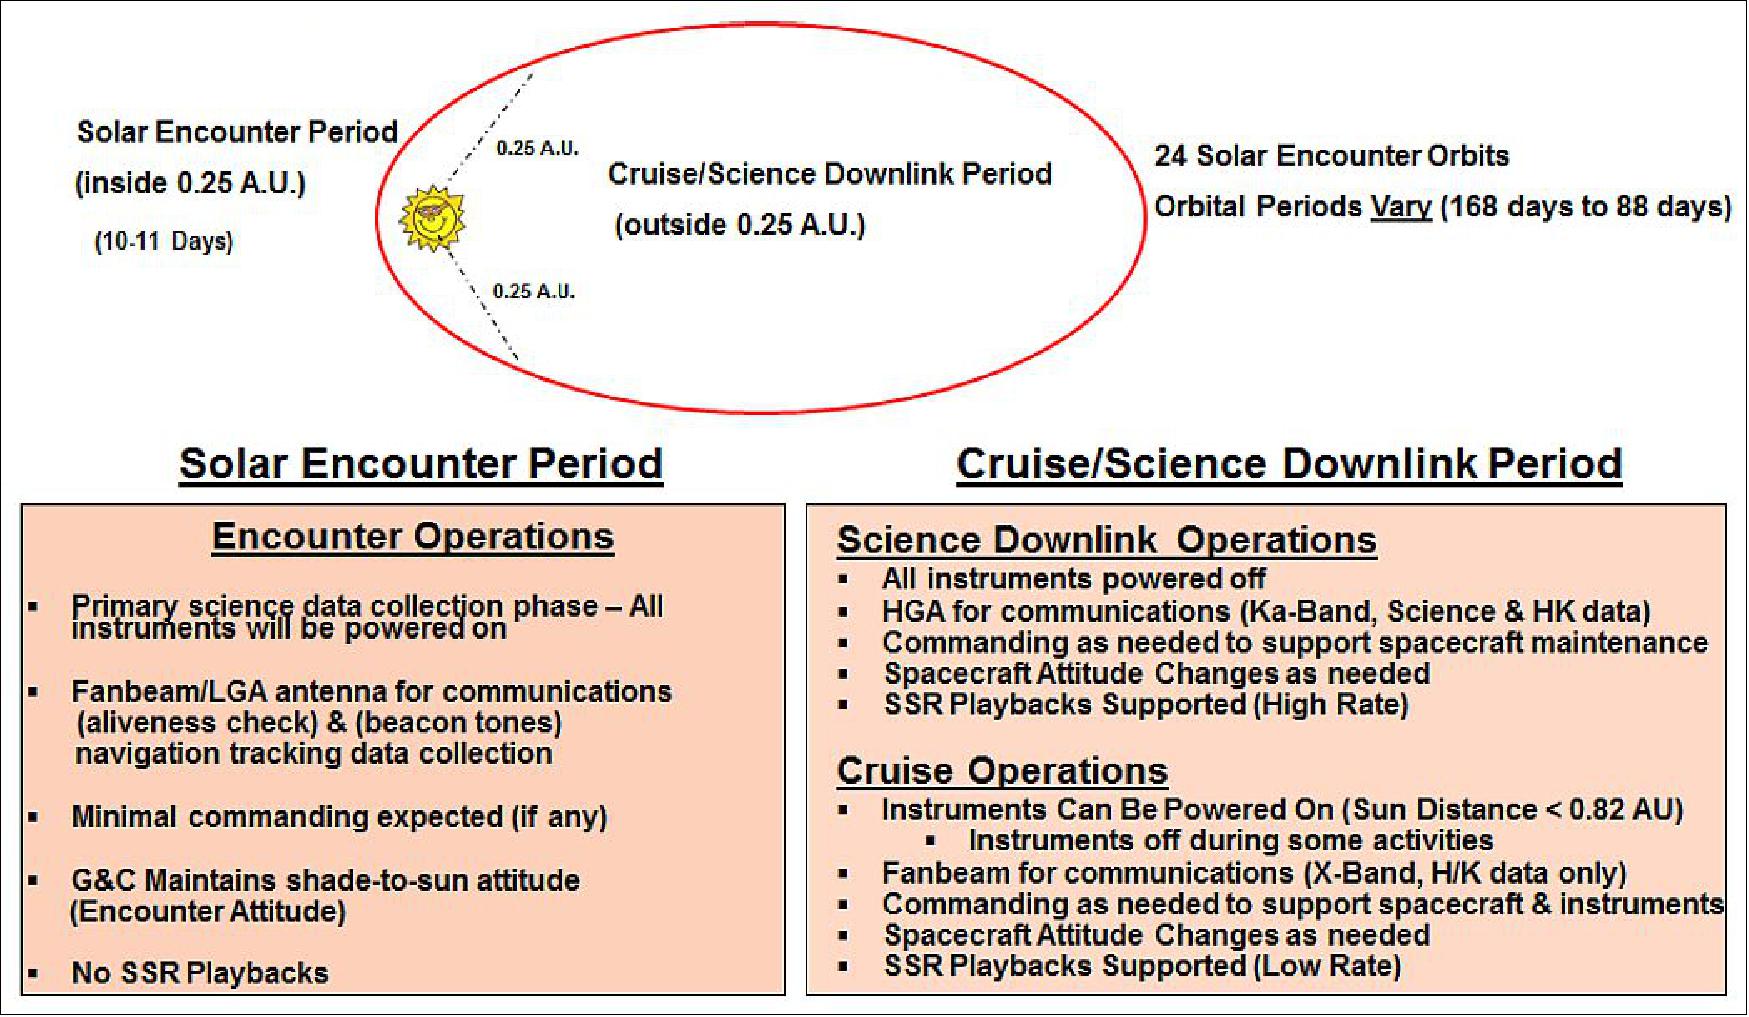
The SPP mission is comprised of 24 highly elliptical, heliocentric orbits with decreasing orbital periods from 168 days for orbit 1, settling into an 88 day orbit period midway through the mission. Each orbit is broken into two distinct periods, the Solar Encounter period and the Cruise/Downlink period. Figure 19 highlights the primary characteristics of each period (Ref.23) .
It's Hard to go to the Sun 29)
The Sun contains 99.8 percent of the mass in our solar system. Its gravitational pull is what keeps everything here, from tiny Mercury to the gas giants to the Oort Cloud, 186 billion miles away. But even though the Sun has such a powerful pull, it's surprisingly hard to actually go to the Sun: It takes 55 times more energy to go to the Sun than it does to go to Mars.
Why is it so difficult? The answer lies in the same fact that keeps Earth from plunging into the Sun: Our planet is traveling very fast — about 67,000 miles/hr (107,820 km/hr) — almost entirely sideways relative to the Sun. The only way to get to the Sun is to cancel that sideways motion.
The extreme difficulty of getting close to the Sun — at first an enormous amount of velocity must be canceled out from the Earth orbital velocity in order for a probe to leave Earth's orbit and head towards the Sun — then the tremendous gravitational acceleration towards the Sun has to be partially offset with the seven Venusian (decelerating) ‘slingshots'.
Since the Parker Solar Probe will skim through the Sun's atmosphere, it only needs to drop 53,000 miles/hr (85,300 km/hr) of sideways motion to reach its destination, but that's no easy feat. In addition to using a powerful rocket, the Delta IV Heavy, the Parker Solar Probe will perform seven Venus gravity assists over its seven-year mission to shed sideways speed into Venus' well of orbital energy.
These gravity assists will draw the Parker Solar Probe's orbit closer to the Sun for a record approach of just 3.83 million miles from the Sun's visible surface on the final orbits.
Though it's shedding sideways speed to get closer to the Sun,the Parker Solar Probe will pick up overall speed, bolstered by the Sun's extreme gravity - so it will also break the record for the fastest-ever human-made objects, clocking in at 430,000 miles/hr (692,000 km/hr) on its final orbits.
Note: As of 06 March 2021, the previously large Parker Solar Probe file has been split into two files, to make the file handling manageable for all parties concerned, in particular for the user community.
• This article covers the Parker Solar Probe mission and its imagery in the period 2020 +2021, in addition to some of the mission milestones.
• Parker Solar Probe status and imagery in the period 2019+18
Mission Status
• March 3, 2022: As NASA's Parker Solar Probe completes its latest swing around the Sun, it's doing so in full view of dozens of other spacecraft and ground-based telescopes. 30)
- These powerful instruments can't actually see Parker itself – the van-sized spacecraft is far too small for visible detection – but they offer from a distance what the probe is sensing close-up, as it samples and analyzes the solar wind and magnetic fields from as close as 5.3 million miles (8.5 million km) from the Sun's surface.
- Occurring at 10:36 a.m. EST (15:36 UTC) on Feb. 25, this was the 11th close approach – or perihelion in the spacecraft's orbit around the Sun – of 24 planned for Parker Solar Probe's primary mission. Most of these passes occur while the Sun is between the spacecraft and Earth, blocking any direct lines of sight from home. But every few orbits, the dynamics work out to put the spacecraft in Earth's view – and the Parker mission team seizes these opportunities to organize broad observation campaigns that not only include telescopes on Earth, but several spacecraft as well.
- More than 40 observatories around the globe, including the recently commissioned Daniel K. Inouye Solar Telescope in Hawaii, among other major installations in the southwestern United States, Europe and Asia, are training their visible, infrared and radio telescopes on the Sun over the several weeks around the perihelion. About a dozen spacecraft, including NASA's STEREO, Solar Dynamics Observatory, TIMED and Magnetospheric Multiscale missions, ESA's and NASA's Solar Orbiter, ESA's BepiColombo, the JAXA-led Hinode, and even NASA's MAVEN at Mars are making simultaneous observations of activity stretching from the Sun to Earth and beyond.
- The pass also marked the midway point in the mission's 11th solar encounter, which began Feb. 20 and continues through March 2. The spacecraft checked in with mission operators at APL – where Parker Solar Probe was designed and built – on Feb. 28 to report that it was healthy and operating as expected.
- Most of the data from this encounter will stream back to Earth from March 30 through May 1, though the team will get a glimpse of some readings when the spacecraft sends a limited amount of data this week.
Solar Activity Picks Up
- Parker Solar Probe is expected to dip back into the Sun's outer atmosphere – the corona – continuing the solar wind and magnetic field readings it has taken since before it first "touched the Sun" last year.
- Along with that data, scientists eagerly anticipate a look at what Parker Solar Probe recorded from the large solar prominence on Feb. 15 that blasted tons of charged particles in the spacecraft's direction. Project Scientist Nour Raouafi of the Space Exploration Sector, said it was the largest event Parker Solar Probe has experienced during its first three-and-a-half years in flight.
- "The shock from the event hit Parker Solar Probe head-on, but the spacecraft was built to withstand activity just like this – to get data in the most extreme conditions," he said. "And with the Sun getting more and more active, we can't wait to see the data that Parker Solar Probe gathers as it gets closer and closer."
- Assisted by a pair of orbit-shaping Venus flybys in August 2023 and November 2024, Parker Solar Probe will eventually come within 4 million miles (6.2 million km) of the solar surface in December 2024 at speeds topping 430,000 miles per hour. Follow the probe's trek through the inner solar system.
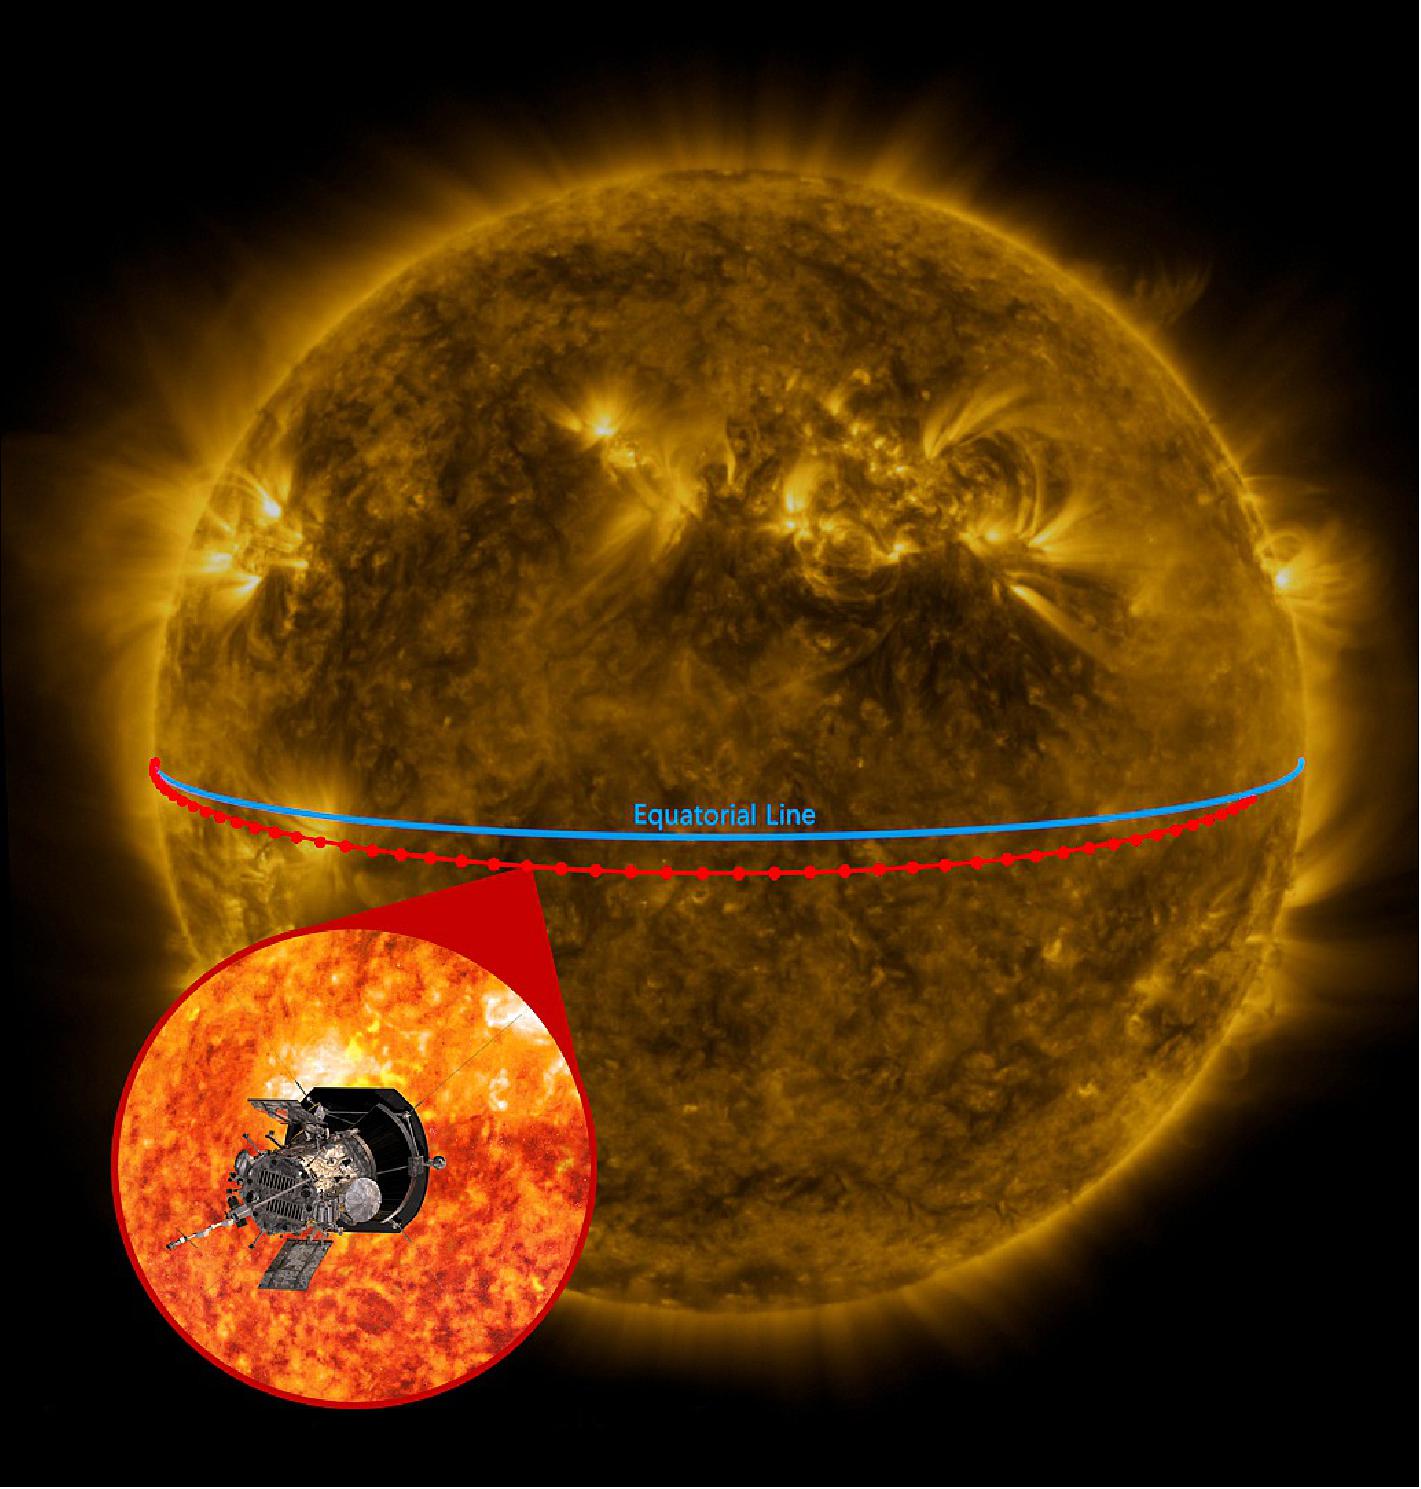
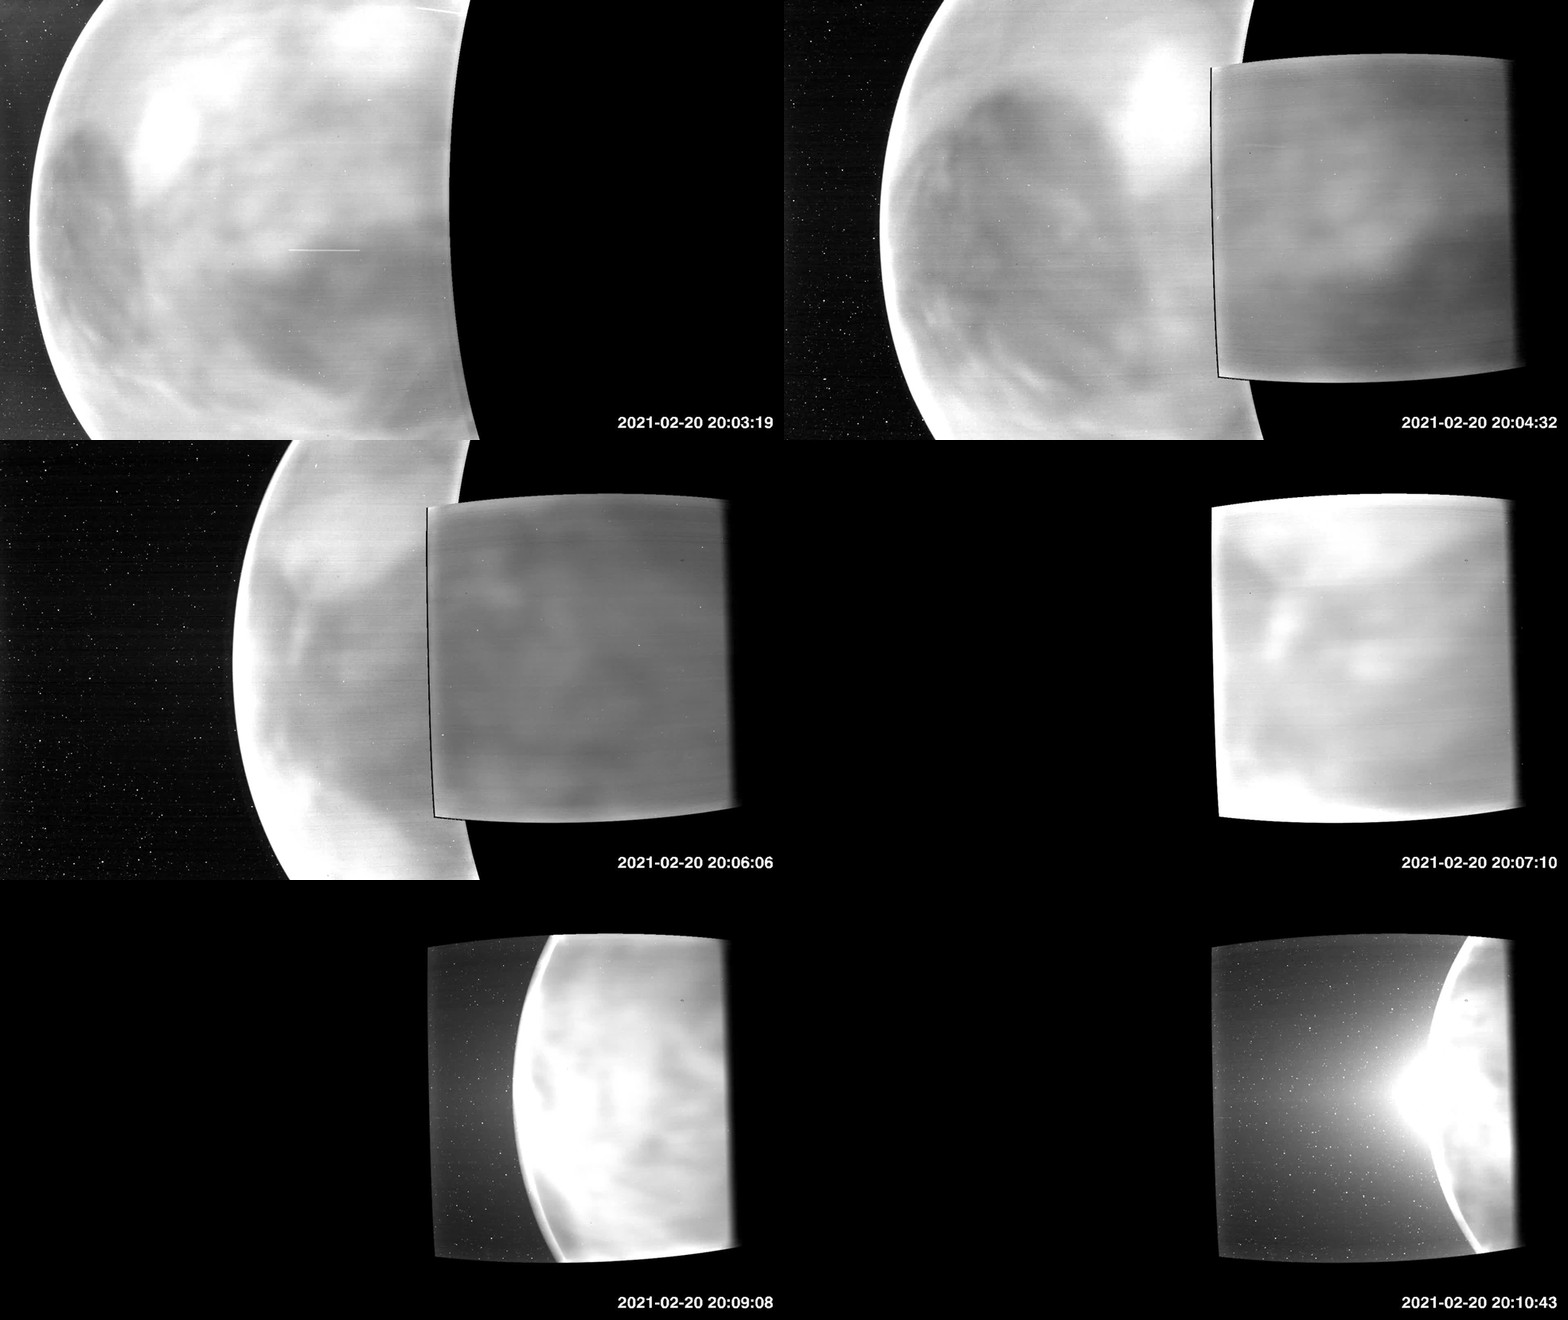
• February 9, 2022: Smothered in thick clouds, Venus' surface is usually shrouded from sight. But in two recent flybys of the planet, Parker used its WISPR (Wide-Field Imager) to image the entire nightside in wavelengths of the visible spectrum – the type of light that the human eye can see – and extending into the near-infrared. 31)
- The images, combined into a video, reveal a faint glow from the surface that shows distinctive features like continental regions, plains, and plateaus. A luminescent halo of oxygen in the atmosphere can also be seen surrounding the planet.
- "We're thrilled with the science insights Parker Solar Probe has provided thus far," said Nicola Fox, division director for the Heliophysics Division at NASA Headquarters. "Parker continues to outperform our expectations, and we are excited that these novel observations taken during our gravity assist maneuver can help advance Venus research in unexpected ways."
- Such images of the planet, often called Earth's twin, can help scientists learn more about Venus' surface geology, what minerals might be present there, and the planet's evolution. Given the similarities between the planets, this information can help scientists on the quest to understand why Venus became inhospitable and Earth became an oasis.
- "Venus is the third brightest thing in the sky, but until recently we have not had much information on what the surface looked like because our view of it is blocked by a thick atmosphere," said Brian Wood, lead author on the new study and physicist at the Naval Research Laboratory in Washington, DC. "Now, we finally are seeing the surface in visible wavelengths for the first time from space." 32)
Unexpected Capabilities
- The first WISPR images of Venus were taken in July 2020 as Parker embarked on its third flyby, which the spacecraft uses to bend its orbit closer to the Sun. WISPR was designed to see faint features in the solar atmosphere and wind, and some scientists thought they might be able to use WISPR to image the cloud tops veiling Venus as Parker passed the planet.
- "The objective was to measure the speed of the clouds," said WISPR project scientist Angelos Vourlidas, co-author on the new paper and researcher at Johns Hopkins University Applied Physics Laboratory.
- But instead of just seeing clouds, WISPR also saw through to the surface of the planet. The images were so striking that the scientists turned on the cameras again during the fourth pass in February 2021. During the 2021 flyby, the spacecraft's orbit lined up perfectly for WISPR to image Venus' nightside in entirety.
- "The images and video just blew me away," Wood said.
Glowing like an Iron from the Forge
- Clouds obstruct most of the visible light coming from Venus' surface, but the very longest visible wavelengths, which border the near-infrared wavelengths, make it through. On the dayside, this red light gets lost amid the bright sunshine reflected off Venus' cloud tops, but in the darkness of night, the WISPR cameras were able to pick up this faint glow caused by the incredible heat emanating from the surface.
- "The surface of Venus, even on the nightside, is about 860 degrees," Wood said. "It's so hot that the rocky surface of Venus is visibly glowing, like a piece of iron pulled from a forge."
- As it passed by Venus, WISPR picked up a range of wavelengths from 470 nm to 800 nm. Some of that light is the near-infrared – wavelengths that we cannot see, but sense as heat – and some is in the visible range, between 380 nm and about 750 nm.
Venus in a New Light
- In 1975, the Venera 9 lander sent the first tantalizing glimpses of the surface after landing on Venus. Since then, Venus' surface has been revealed further with radar and infrared instruments, which can peer through the thick clouds by using wavelengths of light invisible to the human eye. NASA's Magellan mission created the first maps in the 1990s using radar and JAXA's Akatsuki spacecraft gathered infrared images after reaching orbit around Venus in 2016. The new images from Parker add to these findings by extending the observations to red wavelengths at the edge of what we can see.
- The WISPR images show features on the Venusian surface, such as the continental region Aphrodite Terra, the Tellus Regio plateau, and the Aino Planitia plains. Since higher altitude regions are about 85 degrees Fahrenheit cooler than lower areas, they show up as dark patches amidst the brighter lowlands. These features can also be seen in previous radar images, such as those taken by Magellan.
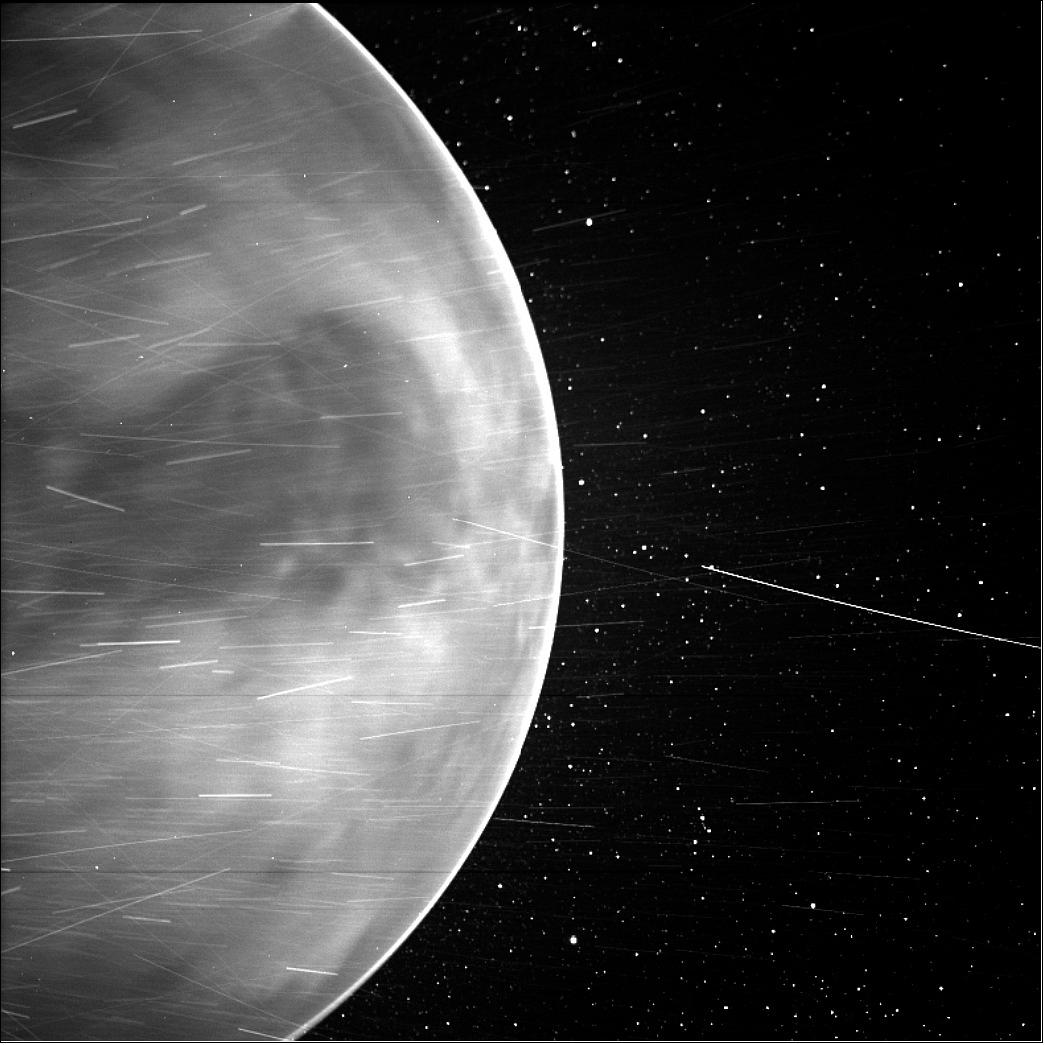
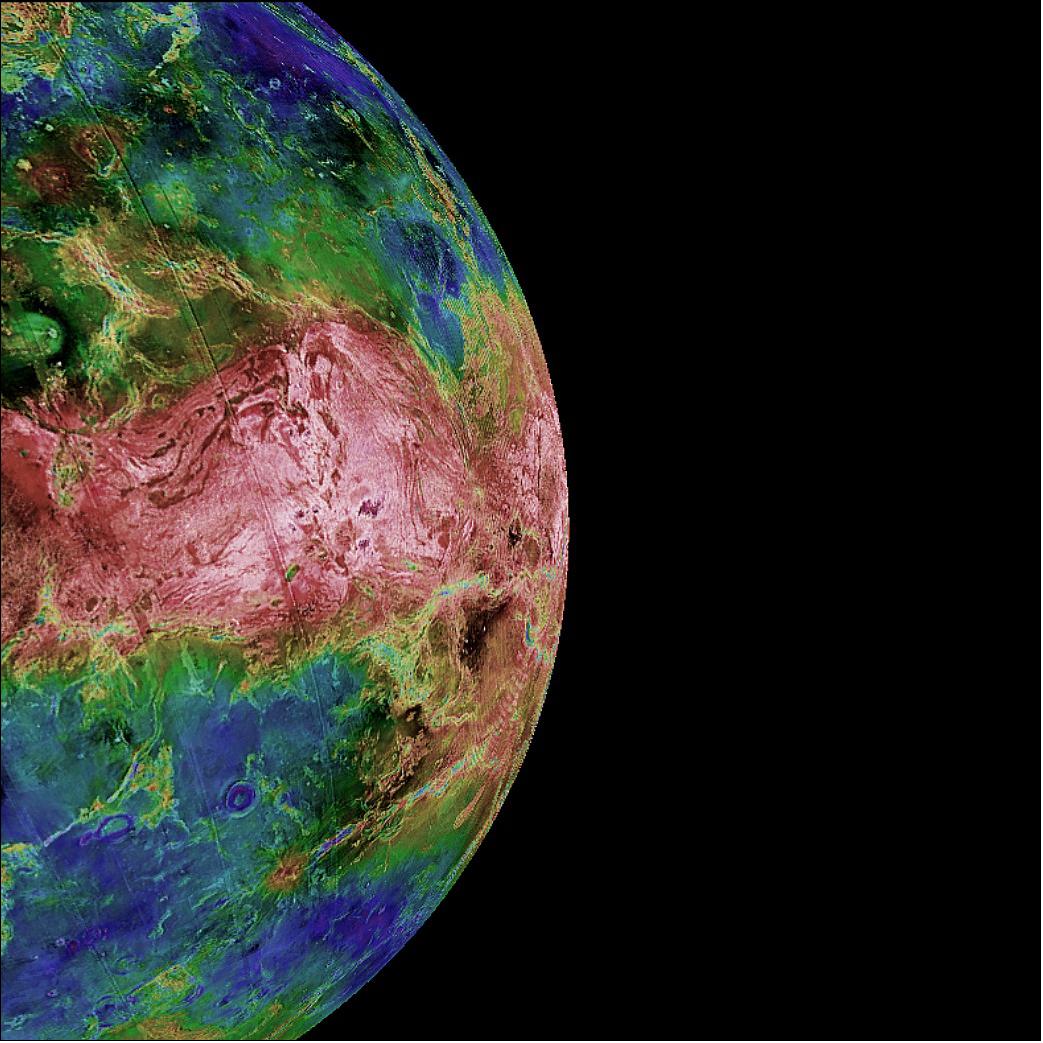
- Beyond looking at surface features, the new WISPR images will help scientists better understand the geology and mineral make-up of Venus. When heated, materials glow at unique wavelengths. By combining the new images with previous ones, scientists now have a wider range of wavelengths to study, which can help identify what minerals are on the surface of the planet. Such techniques have previously been used to study the surface of the Moon. Future missions will continue to expand this range of wavelengths, which will contribute to our understanding of habitable planets.
- This information could also help scientists understand the planet's evolution. While Venus, Earth, and Mars all formed around the same time, they are very different today. The atmosphere on Mars is a fraction of Earth's while Venus has a much thicker atmosphere. Scientists suspect volcanism played a role in creating the dense Venusian atmosphere, but more data are needed to know how. The new WISPR images might provide clues about how volcanos may have affected the planet's atmosphere.
- In addition to the surface glow, the new images show a bright ring around the edge of the planet caused by oxygen atoms emitting light in the atmosphere. Called airglow, this type of light is also present in Earth's atmosphere, where it's visible from space and sometimes from the ground at night.
Flyby Science
- While Parker Solar Probe's primary goal is solar science, the Venusian flybys are providing exciting opportunities for bonus data that wasn't expected at the mission's launch.
- WISPR has also imaged Venus' orbital dust ring – a doughnut-shaped track of microscopic particles strewn in the wake of Venus' orbit around the Sun – and the FIELDS instrument made direct measurements of radio waves in the Venusian atmosphere, helping scientists understand how the upper atmosphere changes during the Sun's 11-year cycle of activity.
- In December 2021, researchers published new findings about the rediscovery of the comet-like tail of plasma streaming out behind Venus, called a "tail ray". The new results showed this tail of particles extending nearly 5,000 miles out from the Venusian atmosphere. This tail could be how Venus' water escaped from the planet, contributing to its current dry and inhospitable environment.
- While the geometry of the next two flybys likely won't allow Parker to image the nightside, scientists will continue to use Parker's other instruments to study Venus' space environment. In November 2024, the spacecraft will have a final chance to image the surface on its seventh and final flyby.
The Future of Venus Research
- Parker Solar Probe, which is built and operated by the Johns Hopkins Applied Physics Laboratory in Laurel, Maryland, isn't the first mission to gather bonus data on flybys, but its recent successes have inspired other missions to turn on their instruments as they pass Venus. In addition to Parker, the ESA (European Space Agency) BepiColombo mission and the ESA and NASA Solar Orbiter mission have decided to gather data during their flybys in the coming years.
- More spacecraft are headed to Venus around the end of this decade with NASA's DAVINCI and VERITAS missions and ESA's EnVision mission. These missions will help image and sample Venus' atmosphere, as well as remap the surface at higher resolution with infrared wavelengths. This information will help scientists determine the surface mineral make-up and better understand the planet's geologic history.
- "By studying the surface and atmosphere of Venus, we hope the upcoming missions will help scientists understand the evolution of Venus and what was responsible for making Venus inhospitable today," said Lori Glaze, director of the Planetary Science Division at NASA Headquarters. "While both DAVINCI and VERITAS will use primarily near-infrared imaging, Parker's results have shown the value of imaging a wide range of wavelengths."
• January 14, 2022: A new study led by University of Minnesota Twin Cities researchers, using data from NASA's Parker Solar Probe, provides insight into what generates and accelerates the solar wind, a stream of charged particles released from the sun's corona. Understanding how the solar wind works can help scientists predict "space weather," or the response to solar activity—such as solar flares—that can impact both astronauts in space and much of the technology people on Earth depend on. 33)
- The paper is published in Astrophysical Journal Letters, a scientific journal from the American Astronomical Society (AAS) that publishes high-impact astrophysical research. 34)
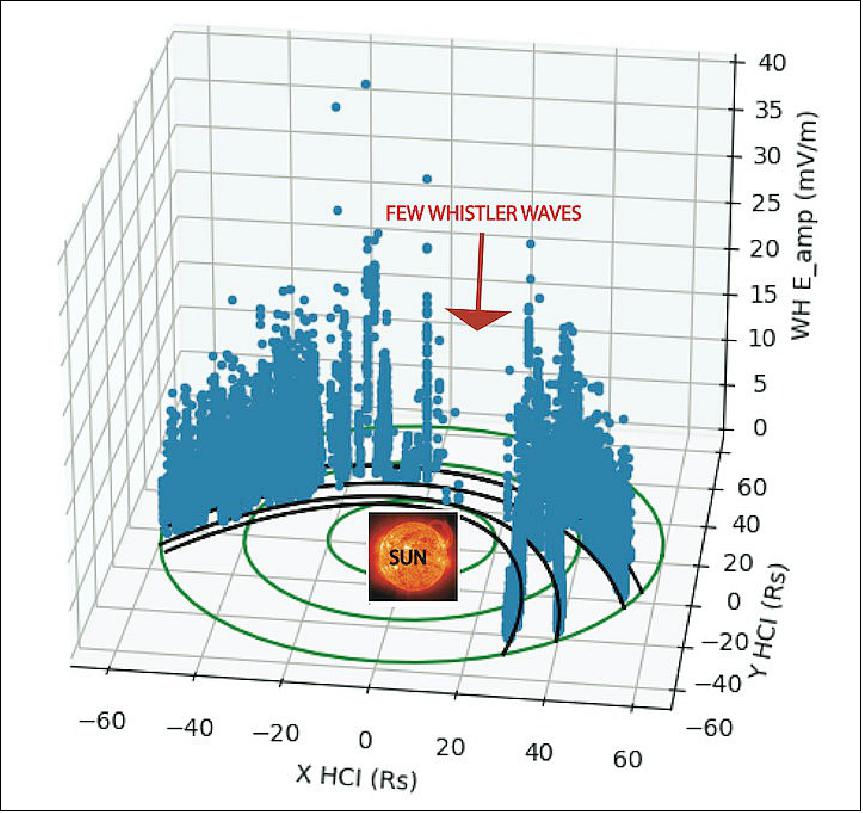
- The scientists used data gathered from Parker Solar Probe, which launched in 2018 with the goal to help scientists understand what heats the Sun's corona (the outer atmosphere of the sun) and generates the solar wind. To answer these questions, scientists need to understand the ways in which energy flows from the sun. The latest round of data was obtained in August 2021 at a distance of 4.8 million miles from the sun—the closest a spacecraft has ever been to the star.
- Previous research has indicated that in the solar wind, at distances from about 35 solar radii (one solar radius is a little more than 432,000 miles) out to the Earth's orbit at about 215 solar radii, electromagnetic waves called "whistler" waves help regulate the heat flux, one form of energy flow. In this new study, the University of Minnesota-led research team discovered that in a region closer to the sun, inside around 28 solar radii, there are no whistler waves.
- Instead, the researchers saw a different kind of wave that was electrostatic instead of electromagnetic. And in that same region, they noticed something else: the electrons showed the effect of an electric field created in part by the pull of the sun's gravity, similar to what happens at the Earth's poles where a "polar wind" is accelerated.
- "What we found is that when we get inside 28 solar radii, we lose the whistlers. That means the whistlers can't be doing anything to control the heat flux in that region," said Cynthia Cattell, lead author on the paper and a professor in the School of Physics and Astronomy at the University of Minnesota Twin Cities. "This result was very, very surprising to people. It has impacts not only for understanding the solar wind and the winds of other stars, but it's also important for understanding the heat flux of a lot of other astrophysical systems to which we can't send satellites—things like how star systems form."
- Learning about the solar wind is also important to scientists for other reasons. For one, it can disturb Earth's magnetic field, generating "space weather" events that can make satellites malfunction, impact communication and GPS signals, and cause power outages on Earth at northern latitudes like Minnesota. The energetic particles that propagate through the solar wind can also be harmful to astronauts traveling in space.
- "Scientists want to be able to predict space weather," Cattell explained. "And if you don't understand the details of energy flow close to the sun, then you can't predict how fast the solar wind will be moving or what its density will be when it reaches Earth. These are some of the properties that determine how solar activity affects us."
- In late 2024, the Parker Solar Probe will fly to an even closer distance of 3.8 million miles from the sun. Moving forward, Cattell and her colleagues are excited to see the next round of data from the spacecraft. Their next goal will be to figure out why this absence of whistler waves exists so close to the sun, how the electrons accelerated by the gravity-associated electric field might excite other waves, and how that impacts the solar wind.
- The research was funded by NASA, and the simulation work was supported by the Minnesota Supercomputing Institute on the University of Minnesota Twin Cities campus. Parker Solar Probe is part of NASA's Living with a Star program to explore aspects of the Sun-Earth system that directly affect life and society. The program is managed by NASA's Goddard Space Flight Center for the Heliophysics Division of NASA's Science Mission Directorate. The Johns Hopkins Applied Physics Laboratory in Laurel, Maryland, built and operates the Parker Solar Probe spacecraft and manages the mission for NASA.
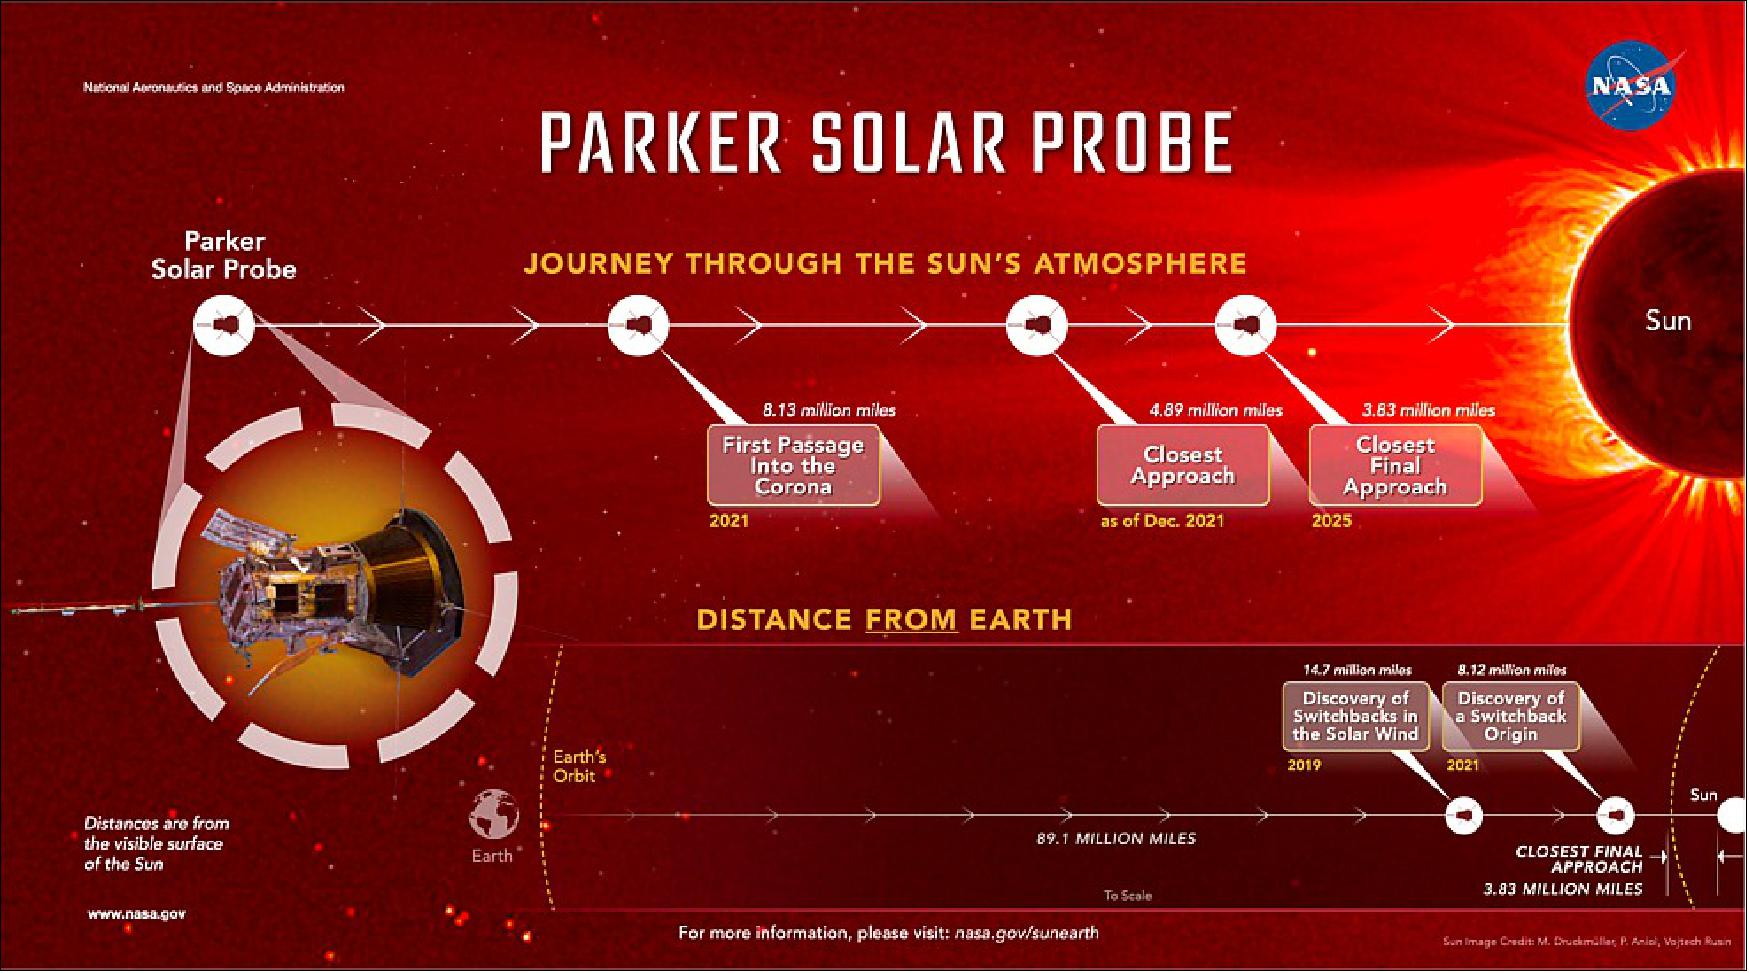
• December 14, 2021: For the first time in history, a spacecraft has touched the Sun. NASA's Parker Solar Probe has now flown through the Sun's upper atmosphere – the corona – and sampled particles and magnetic fields there. 35)
- The new milestone marks one major step for Parker Solar Probe and one giant leap for solar science. Just as landing on the Moon allowed scientists to understand how it was formed, touching the very stuff the Sun is made of will help scientists uncover critical information about our closest star and its influence on the solar system.
- "Parker Solar Probe "touching the Sun" is a monumental moment for solar science and a truly remarkable feat," said Thomas Zurbuchen, the associate administrator for the Science Mission Directorate at NASA Headquarters in Washington. "Not only does this milestone provide us with deeper insights into our Sun's evolution and it's impacts on our solar system, but everything we learn about our own star also teaches us more about stars in the rest of the universe."
- As it circles closer to the solar surface, Parker is making new discoveries that other spacecraft were too far away to see, including from within the solar wind – the flow of particles from the Sun that can influence us at Earth. In 2019, Parker discovered that magnetic zig-zag structures in the solar wind, called switchbacks, are plentiful close to the Sun. But how and where they form remained a mystery. Halving the distance to the Sun since then, Parker Solar Probe has now passed close enough to identify one place where they originate: the solar surface.
- The first passage through the corona – and the promise of more flybys to come – will continue to provide data on phenomena that are impossible to study from afar.
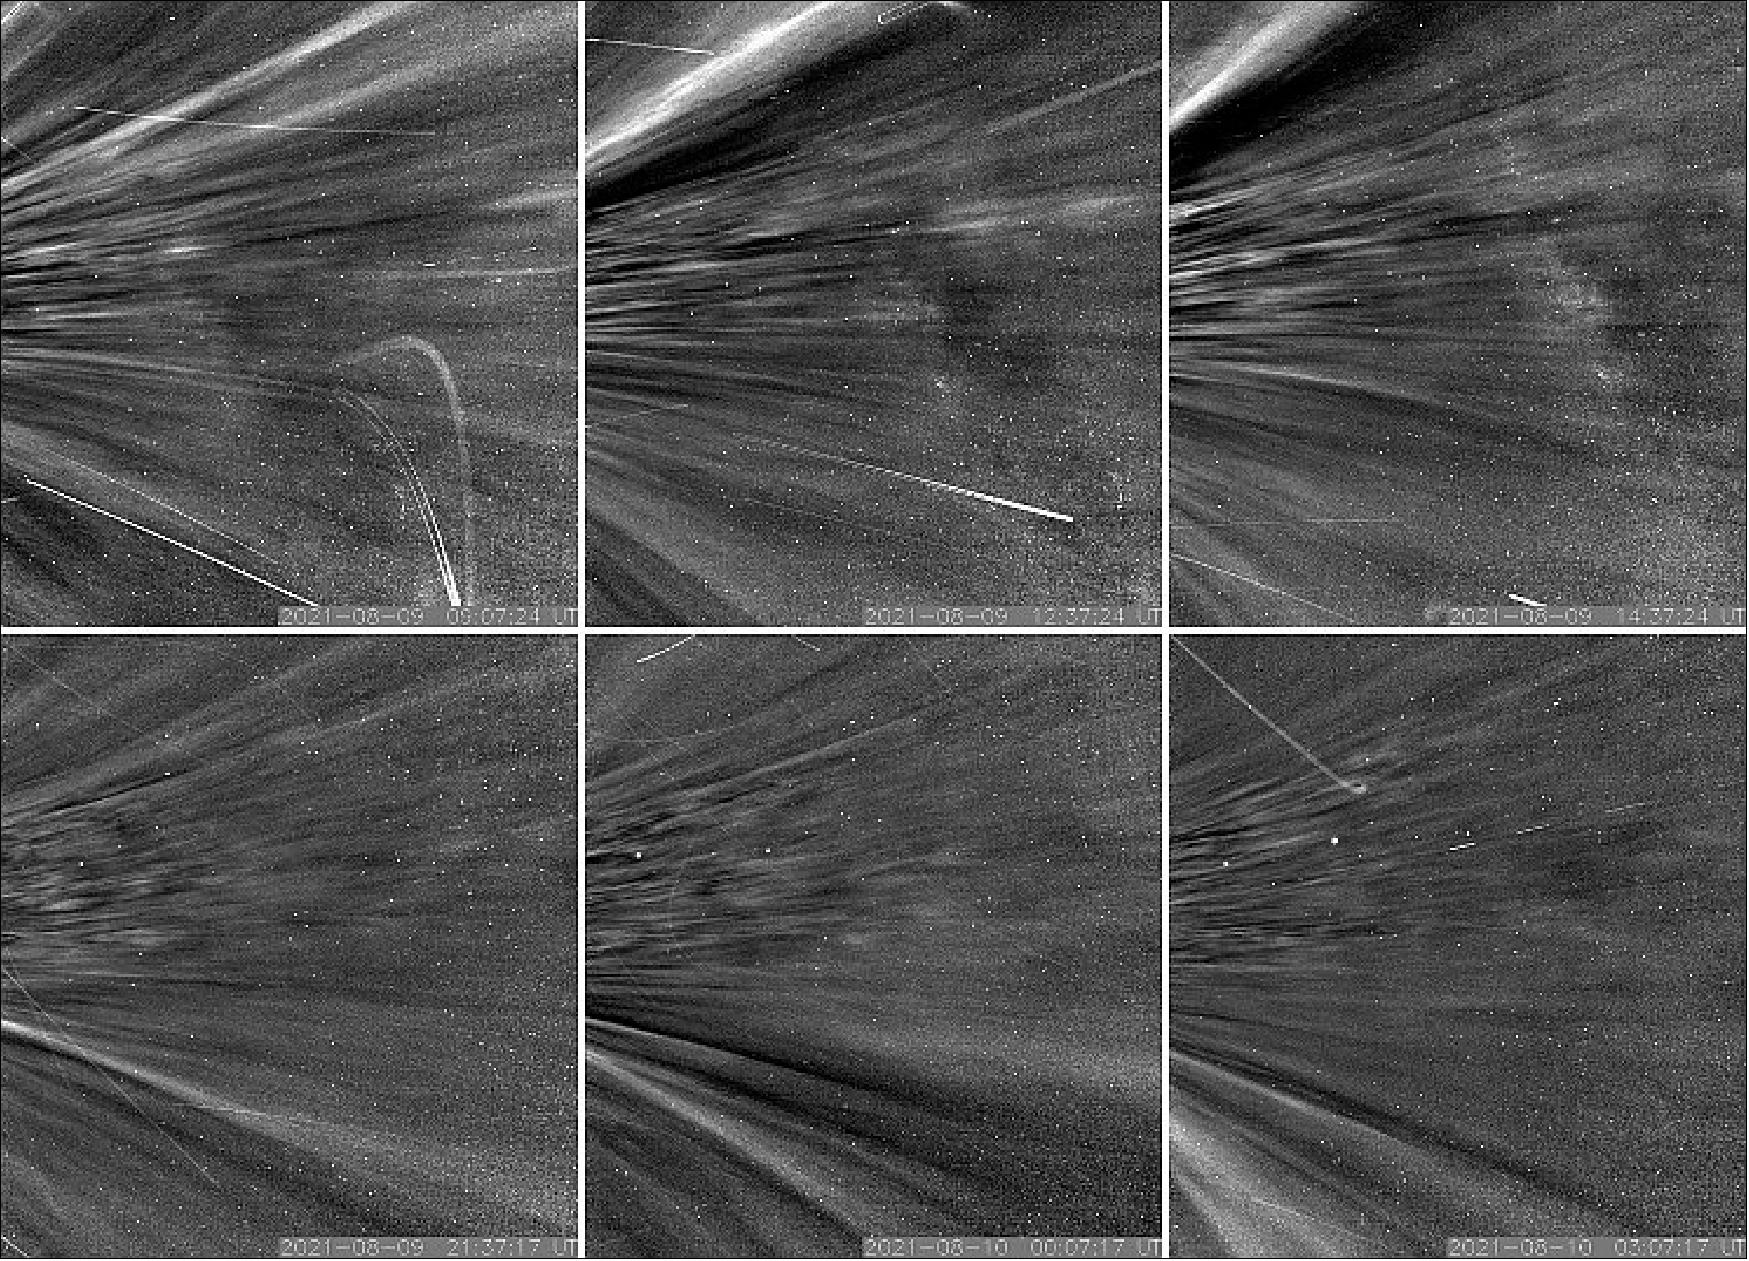
- "Flying so close to the Sun, Parker Solar Probe now senses conditions in the magnetically dominated layer of the solar atmosphere – the corona – that we never could before," said Nour Raouafi, the Parker project scientist at the Johns Hopkins Applied Physics Laboratory in Laurel, Maryland. "We see evidence of being in the corona in magnetic field data, solar wind data, and visually in images. We can actually see the spacecraft flying through coronal structures that can be observed during a total solar eclipse."
Closer Than Ever Before
- Parker Solar Probe launched in 2018 to explore the mysteries of the Sun by traveling closer to it than any spacecraft before. Three years after launch and decades after first conception, Parker has finally arrived.
- Unlike Earth, the Sun doesn't have a solid surface. But it does have a superheated atmosphere, made of solar material bound to the Sun by gravity and magnetic forces. As rising heat and pressure push that material away from the Sun, it reaches a point where gravity and magnetic fields are too weak to contain it.
- That point, known as the Alfvén critical surface, marks the end of the solar atmosphere and beginning of the solar wind. Solar material with the energy to make it across that boundary becomes the solar wind, which drags the magnetic field of the Sun with it as it races across the solar system, to Earth and beyond. Importantly, beyond the Alfvén critical surface, the solar wind moves so fast that waves within the wind cannot ever travel fast enough to make it back to the Sun – severing their connection.
- Until now, researchers were unsure exactly where the Alfvén critical surface lay. Based on remote images of the corona, estimates had put it somewhere between 10 to 20 solar radii from the surface of the Sun – 4.3 to 8.6 million miles. Parker's spiral trajectory brings it slowly closer to the Sun and during the last few passes, the spacecraft was consistently below 20 solar radii (91 percent of Earth's distance from the Sun), putting it in the position to cross the boundary – if the estimates were correct.
- On April 28, 2021, during its eighth flyby of the Sun, Parker Solar Probe encountered the specific magnetic and particle conditions at 18.8 solar radii (around 8.1 million miles) above the solar surface that told scientists it had crossed the Alfvén critical surface for the first time and finally entered the solar atmosphere.
- "We were fully expecting that, sooner or later, we would encounter the corona for at least a short duration of time," said Justin Kasper, lead author on a new paper about the milestone published in Physical Review Letters, and deputy chief technology officer at BWX Technologies, Inc. and University of Michigan professor. "But it is very exciting that we've already reached it."
Into the Eye of the Storm
- During the flyby, Parker Solar Probe passed into and out of the corona several times. This is proved what some had predicted – that the Alfvén critical surface isn't shaped like a smooth ball. Rather, it has spikes and valleys that wrinkle the surface. Discovering where these protrusions line up with solar activity coming from the surface can help scientists learn how events on the Sun affect the atmosphere and solar wind.
- At one point, as Parker Solar Probe dipped to just beneath 15 solar radii (around 6.5 million miles) from the Sun's surface, it transited a feature in the corona called a pseudostreamer. Pseudostreamers are massive structures that rise above the Sun's surface and can be seen from Earth during solar eclipses.
- Passing through the pseudostreamer was like flying into the eye of a storm. Inside the pseudostreamer, the conditions quieted, particles slowed, and number of switchbacks dropped – a dramatic change from the busy barrage of particles the spacecraft usually encounters in the solar wind.
- For the first time, the spacecraft found itself in a region where the magnetic fields were strong enough to dominate the movement of particles there. These conditions were the definitive proof the spacecraft had passed the Alfvén critical surface and entered the solar atmosphere where magnetic fields shape the movement of everything in the region.
- The first passage through the corona, which lasted only a few hours, is one of many planned for the mission. Parker will continue to spiral closer to the Sun, eventually reaching as close as 8.86 solar radii (3.83 million miles) from the surface. Upcoming flybys, the next of which is happening in January 2022, will likely bring Parker Solar Probe through the corona again.
- "I'm excited to see what Parker finds as it repeatedly passes through the corona in the years to come," said Nicola Fox, division director for the Heliophysics Division at NASA Headquarters. "The opportunity for new discoveries is boundless."
- The size of the corona is also driven by solar activity. As the Sun's 11-year activity cycle – the solar cycle – ramps up, the outer edge of the corona will expand, giving Parker Solar Probe a greater chance of being inside the corona for longer periods of time.
- "It is a really important region to get into because we think all sorts of physics potentially turn on," Kasper said. "And now we're getting into that region and hopefully going to start seeing some of these physics and behaviors."
Narrowing Down Switchback Origins
- Even before the first trips through the corona, some surprising physics was already surfacing. On recent solar encounters, Parker Solar Probe collected data pinpointing the origin of zig-zag-shaped structures in the solar wind, called switchbacks. The data showed one spot that switchbacks originate is at the visible surface of the Sun – the photosphere.
- By the time it reaches Earth, 93 million miles away, the solar wind is an unrelenting headwind of particles and magnetic fields. But as it escapes the Sun, the solar wind is structured and patchy. In the mid-1990s, the NASA-European Space Agency mission Ulysses flew over the Sun's poles and discovered a handful of bizarre S-shaped kinks in the solar wind's magnetic field lines, which detoured charged particles on a zig-zag path as they escaped the Sun. For decades, scientists thought these occasional switchbacks were oddities confined to the Sun's polar regions.
- In 2019, at 34 solar radii from the Sun, Parker discovered that switchbacks were not rare, but common in the solar wind. This renewed interest in the features and raised new questions: Where were they coming from? Were they forged at the surface of the Sun, or shaped by some process kinking magnetic fields in the solar atmosphere?
- The new findings, in press at the Astrophysical Journal, finally confirm one origin point is near the solar surface.
- The clues came as Parker orbited closer to the Sun on its sixth flyby, less than 25 solar radii out. Data showed switchbacks occur in patches and have a higher percentage of helium – known to come from the photosphere – than other elements. The switchbacks' origins were further narrowed when the scientists found the patches aligned with magnetic funnels that emerge from the photosphere between convection cell structures called supergranules.
- In addition to being the birthplace of switchbacks, the scientists think the magnetic funnels might be where one component of the solar wind originates. The solar wind comes in two different varieties – fast and slow – and the funnels could be where some particles in the fast solar wind come from.
- "The structure of the regions with switchbacks matches up with a small magnetic funnel structure at the base of the corona," said Stuart Bale, professor at the University of California, Berkeley, and lead author on the new switchbacks paper. "This is what we expect from some theories, and this pinpoints a source for the solar wind itself."
- Understanding where and how the components of the fast solar wind emerge, and if they're linked to switchbacks, could help scientists answer a longstanding solar mystery: how the corona is heated to millions of degrees, far hotter than the solar surface below.
- While the new findings locate where switchbacks are made, the scientists can't yet confirm how they're formed. One theory suggests they might be created by waves of plasma that roll through the region like ocean surf. Another contends they're made by an explosive process known as magnetic reconnection, which is thought to occur at the boundaries where the magnetic funnels come together.
- "My instinct is, as we go deeper into the mission and lower and closer to the Sun, we're going to learn more about how magnetic funnels are connected to the switchbacks," Bale said. "And hopefully resolve the question of what process makes them."
- Now that researchers know what to look for, Parker's closer passes may reveal even more clues about switchbacks and other solar phenomena. The data to come will allow scientists a glimpse into a region that's critical for superheating the corona and pushing the solar wind to supersonic speeds. Such measurements from the corona will be critical for understanding and forecasting extreme space weather events that can disrupt telecommunications and damage satellites around Earth.
- "It's really exciting to see our advanced technologies succeed in taking Parker Solar Probe closer to the Sun than we've ever been, and to be able to return such amazing science," said Joseph Smith, Parker program executive at NASA Headquarters. "We look forward to seeing what else the mission discovers as it ventures even closer in the coming years."
- Parker Solar Probe is part of NASA's Living with a Star program to explore aspects of the Sun-Earth system that directly affect life and society. The Living with a Star program is managed by the agency's Goddard Space Flight Center in Greenbelt, Maryland, for NASA's Science Mission Directorate in Washington. The Johns Hopkins University Applied Physics Laboratory in Laurel, Maryland, manages the Parker Solar Probe mission for NASA and designed, built, and operates the spacecraft.
• December 14, 2021: Sixty years ago, NASA set an out-of-this-world goal: to touch our Sun. Sending a spacecraft to the fiery star at the center of our solar system is no small feat. From engineering a spacecraft that could hurtle 430,000 mph through space to agreeing on what kinds of data it would capture, there was a lot to sort out. A half-century in the making, Parker Solar Probe finally launched in 2018. Now, three years later, it has touched the Sun. 36)
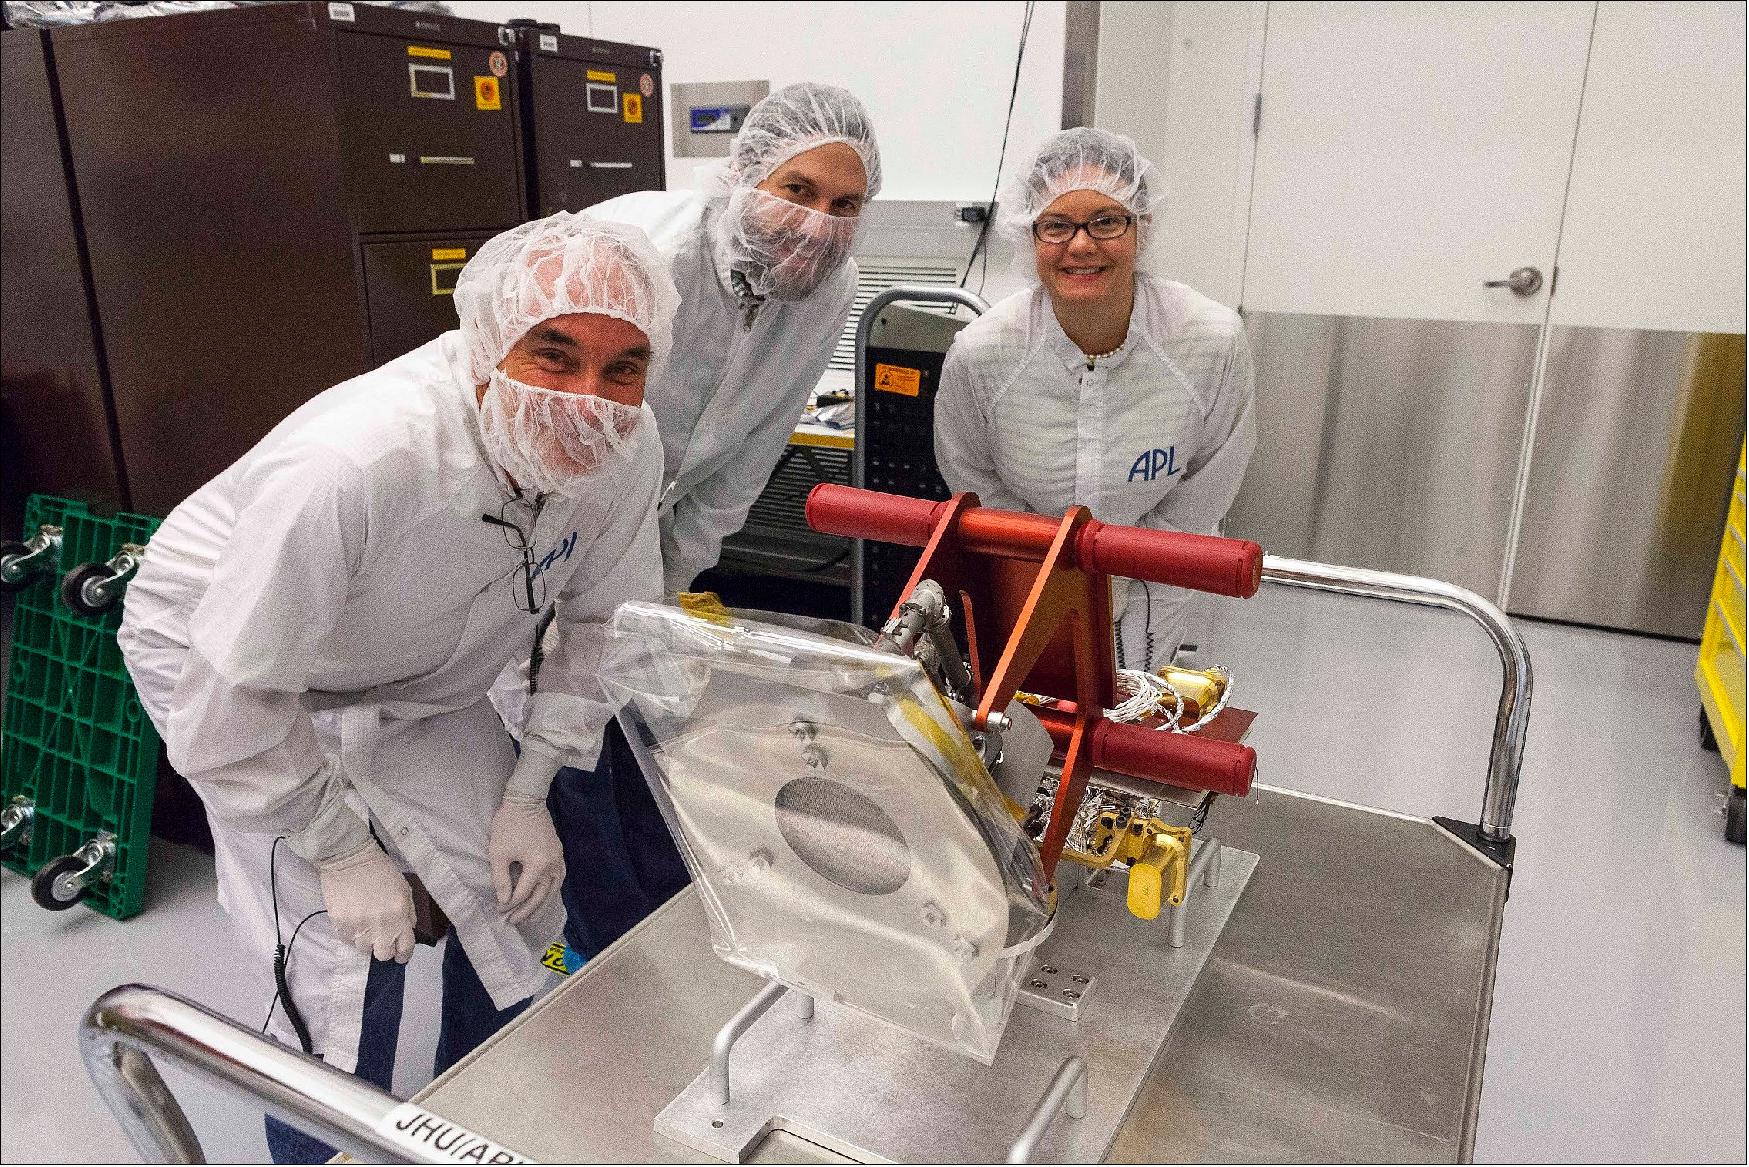
- NASA Program Scientist Kelly Korreck serves as head of science operations and project manager for the Solar Wind Electrons Alphas and Protons, or SWEAP, investigation. SWEAP is one of four instrument suites aboard Parker Solar Probe. SWEAP includes a cup that sits outside the spacecraft's heatshield to scoop up some of the Sun's plasma. At least one engineer has deemed it "The Bravest Little Instrument."
- Korreck shared some lessons she's learned throughout her career and explained why Parker Solar Probe — like so much at NASA, and in life — is fundamentally about perseverance.
How did you decide to become a scientist? Why solar science, specifically?
- I think science has always been part of my life in the form of curiosity. I went to the University of Michigan for undergrad and wound my way through chemistry and medicine. I eventually found my way to physics and astronomy. After graduating, I took a year off to figure out what I was most passionate about. I saw a video with images from NASA's TRACE satellite from the '90s and early 2000s and was totally enamored with all the physics I could see. It's not every day you can go from, "Hey, I'm thinking about this basic physics problem," to "Hey, that basic physics problem has an implication for society," so that's what drew me to solar physics.
- I nearly left research after grad school because it was hard to find a job at the time, and I just didn't know if this was my passion. And then I gave one last talk — my mentor said I had to — and got an offer from my boss at the Smithsonian. After that, it was just saying "yes" to every opportunity, like Parker Solar Probe.
What about when there's an opportunity but you're not sure you're ready, or you've never done something like it before?
- In general, I take the approach that I can learn just about anything. A lot of times someone will present a challenge and say, "We don't know how to do this." And I say, "Well, we can figure it out. We'll figure out the budget. We'll figure out how many staff we need. We'll figure out what data format is best." That was a lot of how my path came to be. Something needed to be done, and I said, "Let's figure it out."
- At this point, I also have 20 years of experience learning to tell when I can handle something and when I should ask for help. I know in the pit of my stomach when it's the right amount of uncomfortable and when it's time to say, "I need an adult — or at least someone to talk this through with."
What's some valuable advice you've received?
- One piece of advice that has stuck with me is, "know your why." Know why you're doing this. Because science is hard, right? I'm not going to lie and say it's easy. It takes a lot of hard work, and it takes a lot of long hours. So you have to know your why. And that "why" should be both academic — what scientific thing you want to study — and personal: Why are you serving humanity this way?
What's your "why"? What keeps you motivated when you encounter challenges?
- My "why" is taking care of our home here on Earth, but also taking care of space and figuring out how we explore and how we go to new places thoughtfully. How do we make sure we are respecting our humanity and striving for better as we explore?
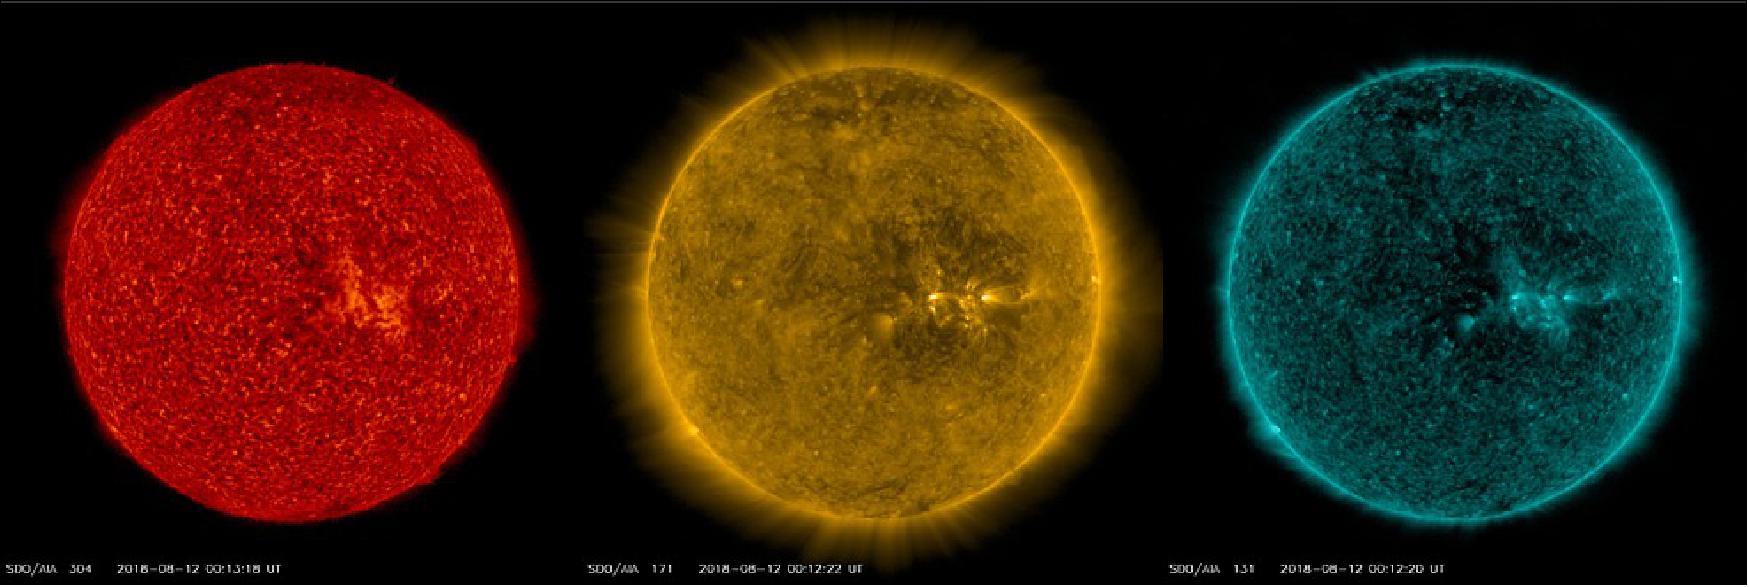
- I also make sure to connect with that joy and wonder that brought me here. I spend a lot of time looking at images from NASA's Solar Dynamics Observatory in the dark to remind myself, "This is why I'm doing it. This thing that is 93 million miles away? Our understanding of it has totally changed over my lifetime."
How do you think about failure?
- I'm still trying to get my head around failure. If someone else came to me and said, "Hey, this didn't work out," I would say, "Great, so we know one way that doesn't work. What else can we try?" I don't see it as failure for other people. It's just a way to learn. But I'm still working on that for myself. I heard on a podcast once that if you haven't had three major failures in a month, you haven't been pushing the envelope enough. I think that's so true. If you're getting everything right, it's no longer your best.
And then sometimes you try something challenging, and it's wildly successful. What was it like learning that Parker Solar Probe had touched the Sun?
- I was at a meeting, and someone mentioned the new Parker data was down. I hadn't looked at it yet, so I loaded it up on my computer. It just felt like, "Wow, we really did it." This is what we were aiming for, for the past 60 years. At the same time, it felt like, "What just happened?" Because it was just a normal Wednesday.
- It felt weird to have it happen during the pandemic, too. I'd imagined I'd be in our operations center looking at data with the folks I've worked with for a decade, but of course we were working remotely. It felt kind of uneventful; it wasn't that eureka moment. But I definitely feel a sense of pride and excitement. And the day I found out, I did take another half-hour to play with the data and sit there and look at it for a while, just to be with it. There's still kind of a tingly feeling when I think about what has happened.
What does this mission represent to you?
- The story of Parker Solar Probe, and Eugene Parker himself, is about perseverance. His paper on the solar wind was initially rejected. He had to convince the editor to publish it. The whole mission has been about perseverance. Putting a metal cup close to the Sun is not easy. It took a lot of work, perseverance, and a really amazing team to get that done. We know our goal is so worth it — that our "why" is there — so we keep going forward.
• November 12, 2021: Dr. Eugene Parker, University of Chicago physicist and namesake of NASA's Parker Solar Probe, received the 2020 Crafoord Prize in Astronomy. Dr. Nicky Fox, Director of Heliophysics at NASA and former project scientist for the Parker Solar Probe mission, traveled to Chicago to present him with the prize in person on Wednesday, Nov. 9. 37)
- Awarded every three years by the Royal Swedish Academy of Science, the Crafoord Prize promotes basic scientific research in mathematics and astronomy, geosciences, biosciences, and rheumatoid arthritis. It consists of a gold medal and a sum of six million Swedish krona (about $600,000).
- The Academy recognized Dr. Parker for his "pioneering and fundamental studies of the solar wind and magnetic fields from stellar to galactic scales." The award was announced on Jan. 30, 2020, but plans to travel to Sweden to accept it were delayed due to the COVID-19 pandemic.
- Dr. Parker's landmark 1958 paper predicted the existence of the solar wind, a stream of particles continuously escaping the Sun, confirmed four years later by NASA's Mariner 2 spacecraft. Parker's long career contributed many fundamental discoveries to the field of Heliophysics and in 2018, he became the first person to witness the launch of spacecraft bearing his name.
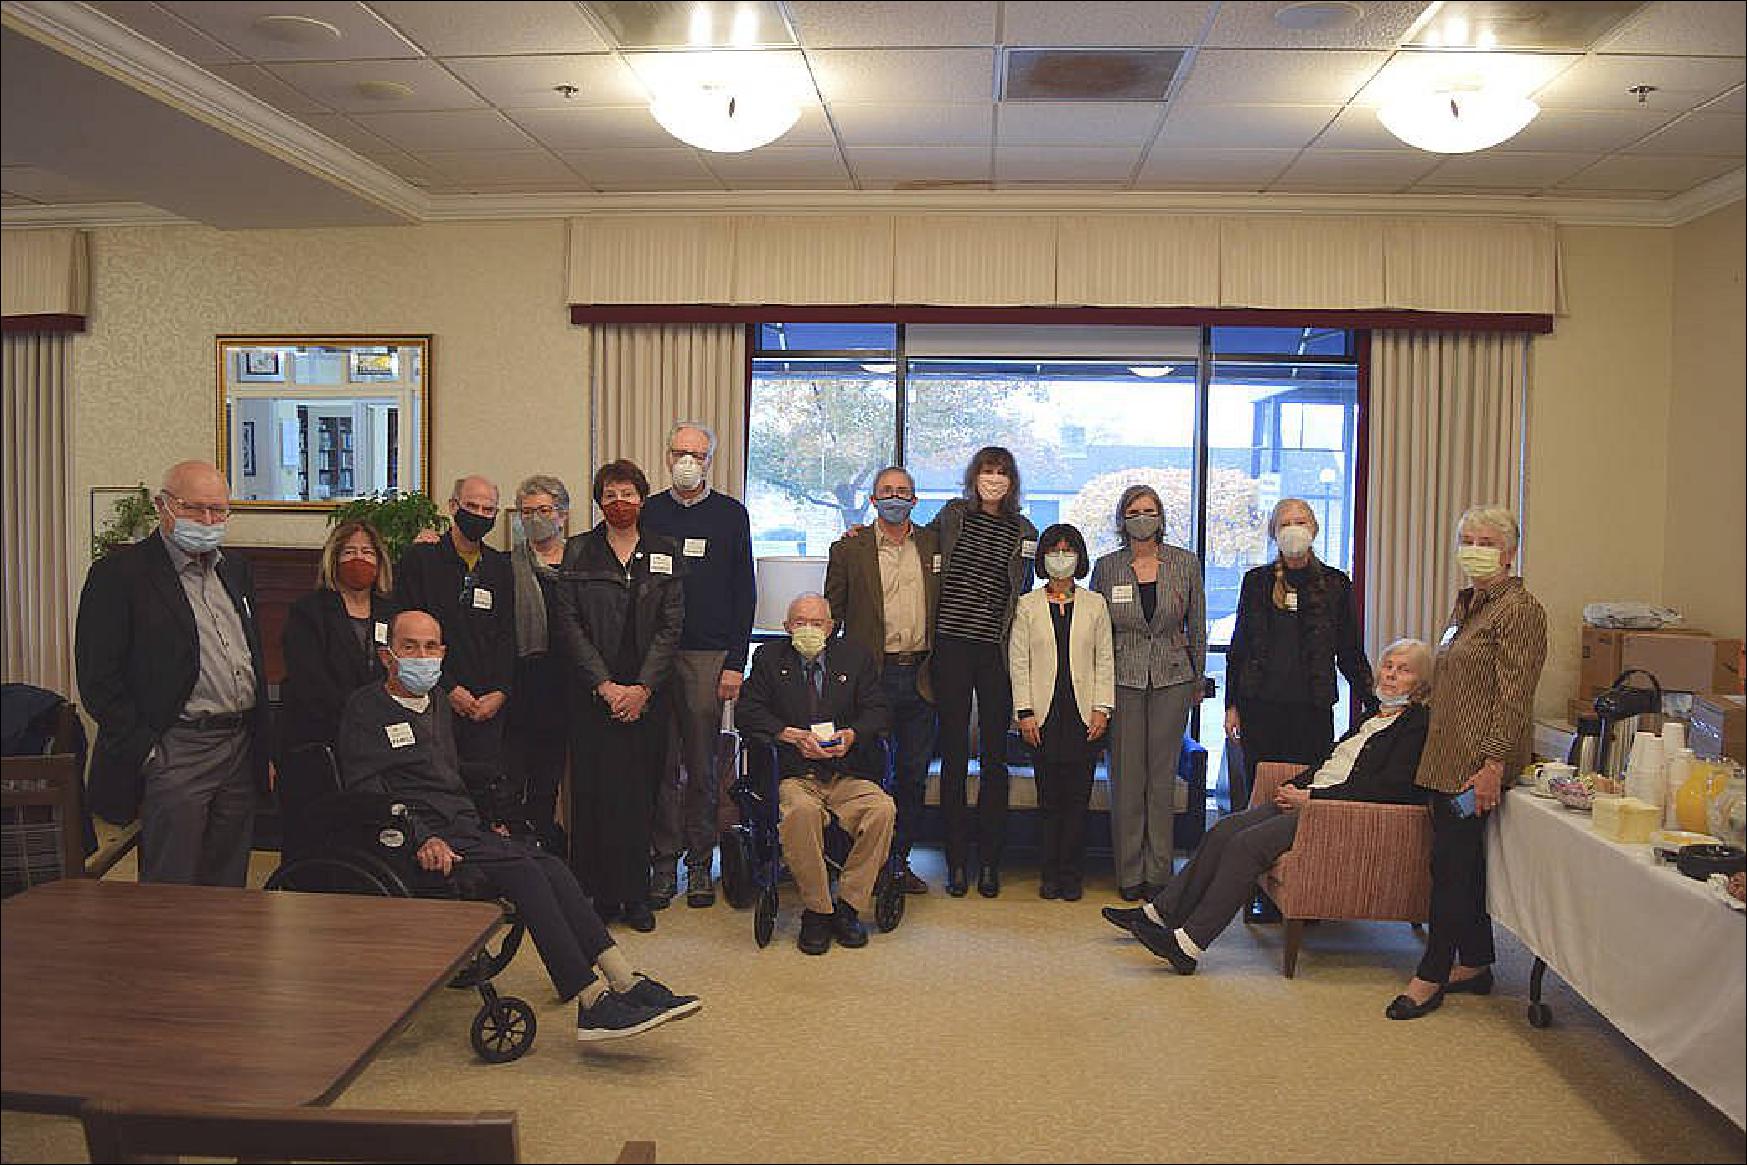
• November 10, 2021: Propelled by a recent swing past Venus, NASA's Parker Solar Probe is healthy and performing normally as it heads toward its next closest approach to the Sun on Nov. 21. 38)
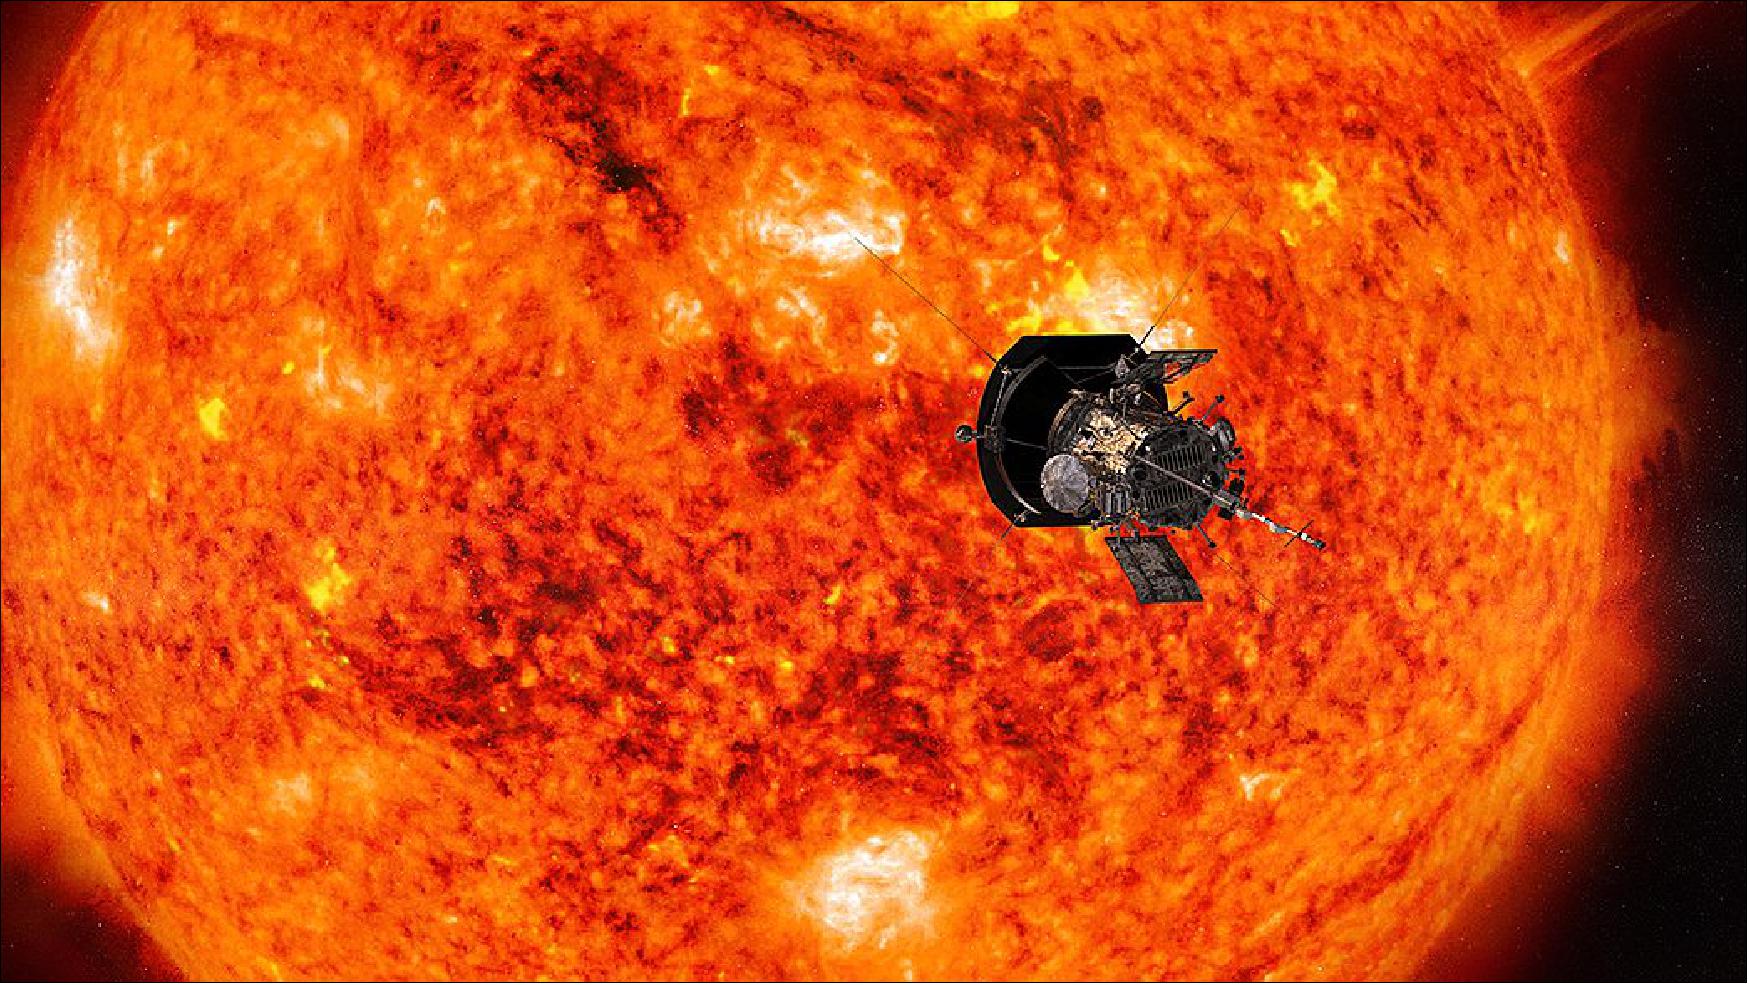
- Parker Solar Probe will break its own distance and speed records on that approach – the 10th of 24 planned, progressively closer trips around the Sun – when it comes about 5.3 million miles (8.5 million km) from the Sun's surface, while reaching top speeds of 101 miles (163 km) per second, or 364,621 miles per hour. The probe's science instruments are already queued up to measure the properties of the solar wind near its source, but the spacecraft is also making other critical, if not unexpected, discoveries.
- "We're observing higher than expected amounts of dust near the Sun," said Nour Raouafi, Parker Solar Probe project scientist at the Johns Hopkins Applied Physics Laboratory (APL) in Laurel, Maryland. "What's exciting about this is it's greatly improving our understanding of the innermost regions of our heliosphere, giving us insight into an environment that, until now, was a total mystery."
- Parker Solar Probe designed, built and now operated at APL, does not carry a dust detector. But as dust grains pelt the spacecraft along its path, the high-velocity impacts create clouds of plasma. These clouds produce unique electrical charges that are picked up by several sensors on the probe's FIELDS instrument, which is designed to measure the electric and magnetic fields near the Sun. Mission scientists have used this data, for example, to construct comprehensive pictures of the structure and behavior of the large cloud of dust that swirls through the innermost solar system.
- The visible imaging camera, WISPR, also picks up bits of material expelled from the spacecraft's structures after impact with those dust grains. But it also images dust structures far away from the spacecraft, such as the dust ring that shares Venus' orbit. While learning about space dust isn't a prime mission science goal, the WISPR and FIELDS have planned for specifically investigating near-Sun dust – in a region of the solar system where no mission has ever operated.
- The Parker Solar Probe team did prepare for the spacecraft's precarious trek through this potentially hazardous environment – as early as the initial mission concept phase – at least as well as our scientific community understood it before the probe's 2018 launch.
- "We designed materials and components that survive hypervelocity dust impacts and the effects of the even smaller particles created in these impacts," said Jim Kinnison, Parker Solar Probe mission systems engineer at APL. "We modeled the makeup and effects of the dust environment, tested how materials react to the dust particles, and installed fault-tolerant onboard systems that are keeping Parker Solar Probe safe in this unexplored region."
- The spacecraft team has noticed that occasionally, the star tracking cameras used as part of the guidance and control system see reflected light from dust and shattering particles that can momentarily disrupt their ability to see stars. Kinnison noted, however, that this doesn't compromise the safety of spacecraft or instrument operations, and the star trackers aren't the spacecraft's only method of controlling where it points. The guidance and control software uses data from the star trackers in tandem with an inertial measurement unit and solar-limb sensors to keep the Thermal Protection System – the heat shield – pointed toward the Sun.
- "Because the system was built to be robust and highly autonomous, loss of data from any one source doesn't affect the ability to control the spacecraft attitude, and in a worst-case situation, can work indefinitely with just the Solar Limb Sensors that watch for unexpected solar illumination on the spacecraft due to attitude errors," he said. "With PSP now in its 10th orbit around the Sun, the spacecraft is proving it can handle this unexpected dust environment."
- And that's good news, he added, with Parker Solar Probe only set to move closer to – and faster around – the Sun. Assisted by two more Venus flybys, in August 2023 and November 2024, Parker Solar Probe will eventually come within 4 million miles (6.2 million km) of the solar surface in December 2024, at speeds topping 430,000 miles per hour.
• July 14, 2021: As the Parker Solar Probe ventures closer to the sun, we are learning new things about our home star. In a new study, physicists led by the University of Iowa report the first definitive measurements of the sun's electric field, and how the electric field interacts with the solar wind, the fast-flowing current of charged particles that can affect activities on Earth, from satellites to telecommunications. 39)
- The physicists calculated the distribution of electrons within the sun's electric field, a feat made possible by the fact that the Parker Solar Probe jetted within 0.1 astronomical units (AU), or a mere 9 million miles, from the sun—closer than any spacecraft has approached. From the electrons' distribution, the physicists were able to discern the size, breadth, and scope of the sun's electric field more clearly than had been done before.
- "The key point I would make is you can't make these measurements far away from the sun. You can only make them when you get close," says Jasper Halekas, associate professor in the Department of Physics and Astronomy at Iowa and the study's corresponding author. "It's like trying to understand a waterfall by looking at the river a mile downstream. The measurements we made at 0.1 AU, we're actually in the waterfall. The solar wind is still accelerating at that point. It's really just an awesome environment to be in."
- The sun's electric field arises from the interaction of protons and electrons generated when hydrogen atoms are stripped apart in the intense heat generated by fusion deep within the sun. In this environment, electrons, with masses 1,800 times less than that of protons, are blown outward, less constrained by gravity than their weightier proton siblings. But the protons, with their positive charge, exert some control, reining in some electrons due to the familiar attraction forces of oppositely charged particles.
- "Electrons are trying to escape, but protons are trying to pull them back. And that is the electric field," says Halekas, a co-investigator for the Solar Wind Electrons, Alphas, and Protons instrument aboard the Parker Solar Probe, the NASA-led mission that launched in August 2018. "If there were no electric field, all the electrons would rush away and be gone. But the electric field keeps it all together as one homogenous flow."
- Now, imagine the sun's electric field as an immense bowl and the electrons as marbles rolling up the sides at differing speeds. Some of the electrons, or marbles in this metaphor, are zippy enough to cross over the lip of the bowl, while others don't accelerate enough and eventually roll back toward the bowl's base.
- "We are measuring the ones that come back and not the ones that don't come back," Halekas says. "There's basically a boundary in energy there between the ones that escape the bowl and the ones that don't, which can be measured. Since we're close enough to the sun, we can make accurate measurements of electrons' distribution before collisions occur further out that distort the boundary and obscure the imprint of the electric field."
- From those measurements the physicists can learn more about the solar wind, the million-mile-per-hour jet of plasma from the sun that washes over the Earth and other planets in the solar system. What they found is the sun's electric field exerts some influence over the solar wind, but less than had been thought.
- "We can now put a number on how much of the acceleration is provided by the sun's electric field," Halekas says. "It looks like it's a small part of the total. It's not the main thing that gives the solar wind its kick. That then points to other mechanisms that might be giving the solar wind most of its kick."
- The paper, "The sunward electron deficit: A telltale sign of the sun's electric potential," was published online July 14 in the Astrophysical Journal.
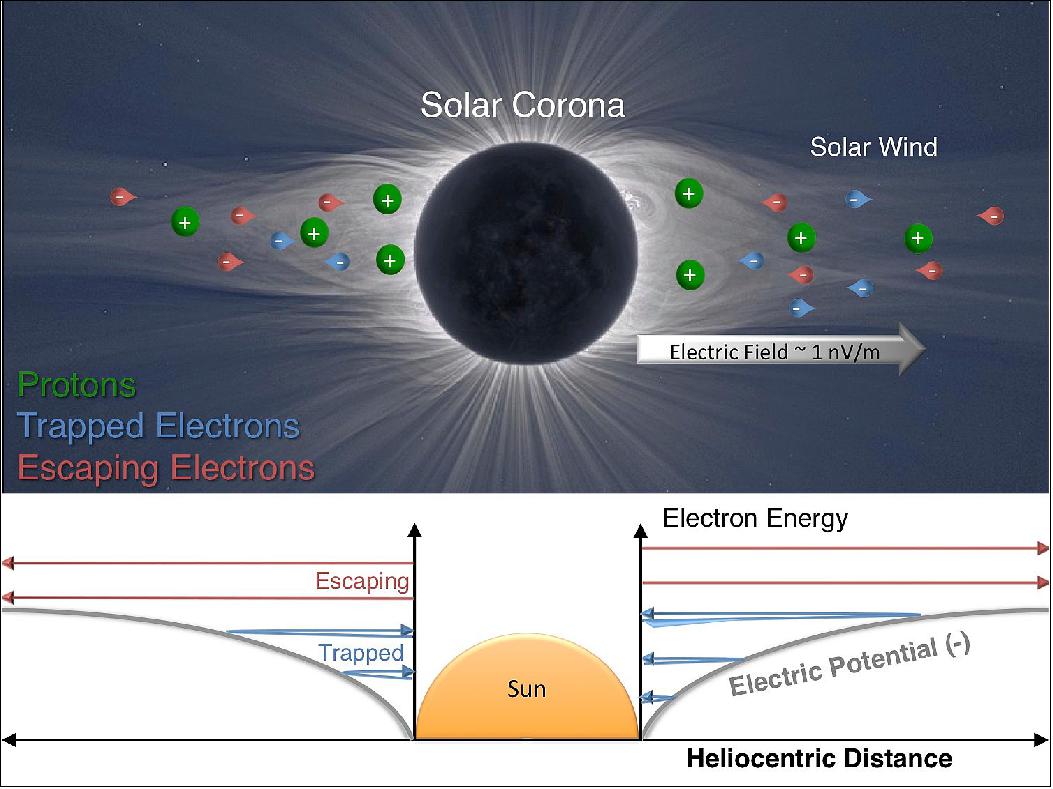
• July 1, 2021: After nearly three years in space, NASA's Parker Solar Probe has not only made numerous passes around our fiery orb, inching closer to the Sun than any spacecraft before it, but it has also ushered in discoveries that are shaping scientists' understanding of Earth's star. 40)
- For its efforts to untangle the long-standing mysteries of the complex solar environment, the Parker Solar Probe team has earned the National Space Club and Foundation's Nelson P. Jackson Award, which recognizes the most outstanding contribution to aerospace in the preceding year.
- "Goddard scientists are proud to work together with the diverse Parker Solar Probe science teams from universities and research laboratories, leading to groundbreaking discoveries of how our Sun shapes our space environment," said Dr. Adam Szabo, mission scientist for Parker Solar Probe at NASA's Goddard Space Flight Center in Greenbelt, Maryland.
- The Parker Solar Probe spacecraft has successfully endured the brutal conditions near the Sun's corona with the help of its cutting-edge heat shield, water-cooled solar panels and high-precision guidance and autonomy systems, allowing for unprecedented and long-awaited close-up observations of our star.
- These observations are addressing questions that puzzled scientists for decades, such as how the Sun's corona is heated and how the solar wind accelerates away from the Sun to inevitably impact our environment on Earth.
- The Parker Solar Probe team has started piecing that puzzle together, thanks to the intrepid spacecraft and its suite of instruments, which have given scientists hints at the previously unseen dust-free zone surrounding the Sun, as well as front-seat views of the turbulent activity near the Sun. For example, the magnetic field embedded in the solar wind – the Sun's constant outflow of material – whips back on itself until it is pointed in the opposite direction in a phenomenon dubbed "switchbacks." Along with observations of other plasma phenomena, Parker Solar Probe is helping scientists understand what drives energetic particle storms and coronal mass ejections, major events that can reverberate across the solar system and even on Earth.
- "This recognition is another testament to the mission's success and reflects how important it is to study not only the Sun and its immediate environment, but pursue space exploration in general, as the science community continues pushing the boundaries of space research," said Parker Solar Probe Project Scientist Dr. Nour Raouafi, of the Johns Hopkins University Applied Physics Laboratory in Laurel, Maryland. "Parker Solar Probe is exceeding all expectations, and the mission's science return has just been amazing."
- Parker Solar Probe — named for Dr. Eugene Parker, who first theorized the concept of the solar wind in the 1950s — launched in August 2018 and is on its way to completing 24 passes around the Sun, eventually moving within 4 million miles of the solar surface. During its most recent close approach to the Sun, called perihelion, in April 2021, Parker Solar Probe broke its own records for solar proximity and speed, coming within about 6.5 million miles (10.4 million km) of the Sun's surface while moving faster than 330,000 miles per hour (532,000 km/hr).
- Parker Solar Probe is part of NASA's Living with a Star program to explore aspects of the Sun-Earth system that directly affect life and society. The Living with a Star program is managed by the agency's Goddard Space Flight Center in Greenbelt, Maryland, for NASA's Science Mission Directorate in Washington. The Johns Hopkins University Applied Physics Laboratory in Laurel, Maryland, manages the Parker Solar Probe mission for NASA and designed, built, and operates the spacecraft.
- The National Space Club and Foundation bridges industry and government to foster excellence in space activity. A panel of experts spanning the aerospace and defense industries, government and academia selected the Parker Solar Probe mission for the honor, which is named for the club's founder and past president, Nelson Pete Jackson. Last year's award went to the Event Horizon Telescope Collaboration team for the first picture of a black hole, taken on April 10, 2019.
- The 2021 Jackson Award will be presented to the Parker Solar Probe team at the 64th Annual Goddard Memorial Dinner on Sept. 17.
• May 3, 2021: During a brief swing by Venus, NASA's Parker Solar Probe detected a natural radio signal that revealed the spacecraft had flown through the planet's upper atmosphere. This was the first direct measurement of the Venusian atmosphere in nearly 30 years — and it looks quite different from Venus past. A study published today confirms that Venus' upper atmosphere undergoes puzzling changes over a solar cycle, the Sun's 11-year activity cycle. This marks the latest clue to untangling how and why Venus and Earth are so different. 41)
- Born of similar processes, Earth and Venus are twins: both rocky, and of similar size and structure. But their paths diverged from birth. Venus lacks a magnetic field, and its surface broils at temperatures hot enough to melt lead. At most, spacecraft have only ever survived a couple hours there. Studying Venus, inhospitable as it is, helps scientists understand how these twins have evolved, and what makes Earth-like planets habitable or not.
- On July 11, 2020, Parker Solar Probe swung by Venus in its third flyby. Each flyby is designed to leverage the planet's gravity to fly the spacecraft closer and closer to the Sun. The mission — managed by Johns Hopkins Applied Physics Laboratory in Laurel, Maryland — made its closest flyby of Venus yet, passing just 517 miles (833 km) above the surface.
- "I was just so excited to have new data from Venus," said Glyn Collison of NASA's Goddard Space Flight Center in Greenbelt, Maryland, the lead scientist on the study, published today in Geophysical Research Letters. A Venus expert, Collinson has pored over all the Venus data available — from past missions like NASA's Pioneer Venus Orbiter and ESA's (the European Space Agency) Venus Express — several times. 42)
- One of Parker Solar Probe's instruments is FIELDS, named for the electric and magnetic fields it measures in the Sun's atmosphere. For just seven minutes — when Parker Solar Probe was closest to Venus — FIELDS detected a natural, low-frequency radio signal. The thin frown in the data caught Collinson's attention. The shape and strength of the signal seemed familiar, but he could not place it. "Then the next day, I woke up," he said. "And I thought, ‘Oh my god, I know what this is!'"
- Collinson recognized the signal from his previous work with NASA's Galileo orbiter, which explored Jupiter and its moons before the mission ended in 2003. A similar frown appeared whenever the spacecraft passed through the ionospheres of Jupiter's moons.
- Like Earth, Venus sports an electrically charged layer of gas at the upper edge of its atmosphere, called the ionosphere. This sea of charged gases, or plasma, naturally emits radio waves that can be detected by instruments like FIELDS. When Collinson and his team identified that signal, they realized Parker Solar Probe had skimmed Venus' upper atmosphere — a pleasant surprise, though one they might have expected based on previous data, he said.
- In the years that followed, data from ground-based telescopes suggested big changes were taking place as the Sun settled into its calm phase, solar minimum. While the bulk of the atmosphere remained the same, the ionosphere — which is at the top, where gases can escape to space — was much thinner during solar minimum.
- Without direct measurements, it was impossible to confirm.
- The observations from Parker Solar Probe's recent flyby, which occurred six months after the latest solar minimum, verify the puzzle in Venus' ionosphere. Indeed, Venus' ionosphere is much thinner compared to previous measurements taken during solar maximum.
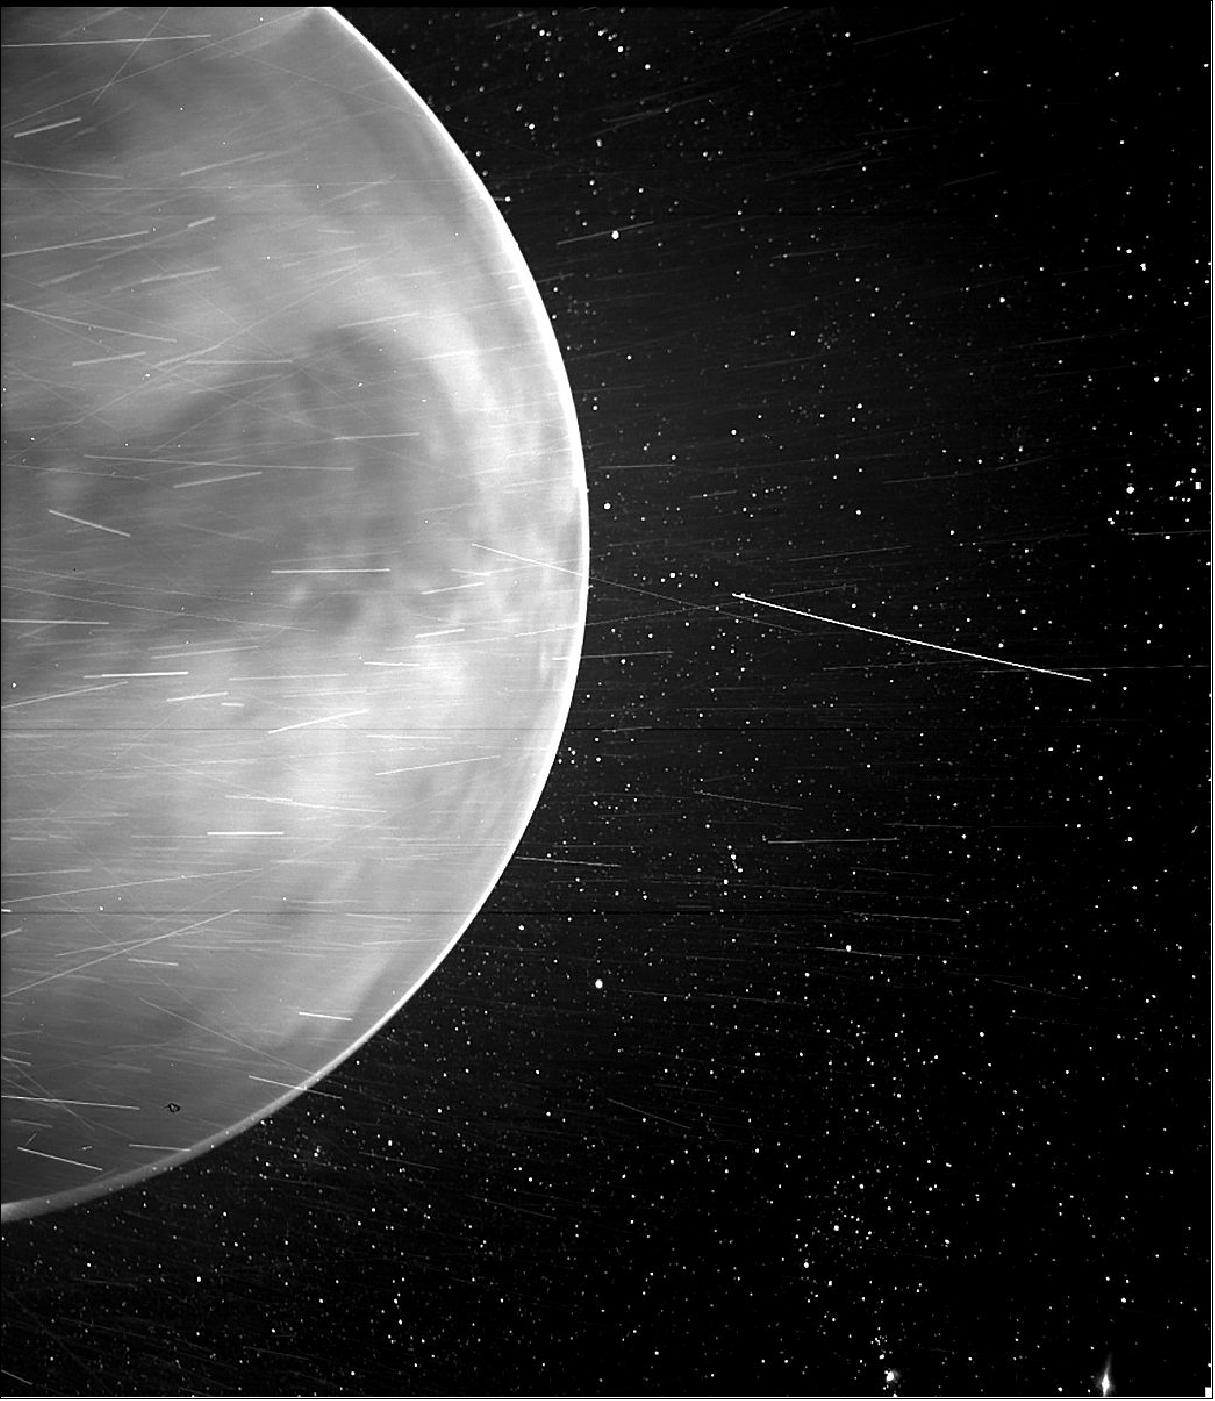
- "When multiple missions are confirming the same result, one after the other, that gives you a lot of confidence that the thinning is real," said Robin Ramstad, a study co-author and post-doctoral researcher at the Laboratory of Atmospheric and Space Physics at the University of Colorado, Boulder.
- Understanding why Venus' ionosphere thins near solar minimum is one part of unraveling how Venus responds to the Sun — which will help researchers determine how Venus, once so similar to Earth, became the world of scorching, toxic air it is today. For example, Venus' ionosphere is prone to leaking, meaning the escape of energized gases into space. Gathering data on this and other changes in the ionosphere is key to understanding how Venus' atmosphere has evolved over time.
- This study was some 30 years in the making. It took a mission to Venus, and decades later, a state-of-the-art mission to the Sun. "The goal of flying by Venus is to slow down the spacecraft so that Parker Solar Probe can dive closer to the Sun," said Nour E. Raouafi, Parker Solar Probe project scientist at the Applied Physics Laboratory. "But we would not miss the opportunity to gather science data and provide unique insights into a mysterious planet such as Venus."
- Collinson likened the research to hitchhiking. Venus scientists were eager to piggyback off Parker Solar Probe's flyby for new data and views of Earth's twin planet. "To see Venus now, it's all about these little glimpses," he said.
• On May 2, 2021, at 3:00 a.m. EDT, mission controllers at the Johns Hopkins University Applied Physics Laboratory, in Laurel, Maryland, received a "tone one" beacon from Parker Solar Probe, indicating that all systems were healthy and operating normally after the spacecraft's eighth close approach to the Sun on April 29. 43)
- During this close pass by the Sun — called perihelion — Parker Solar Probe broke its own records for spacecraft distance from the Sun and speed, coming to within about 6.5 million miles (10.4 million km) of the Sun's surface, while moving faster than 330,000 miles per hour (532,000 km/hr). - Science data collection for this solar encounter continues through May 4.
• April 16, 2021: NASA's Parker Solar Probe mission has given scientists the first complete look at Venus' orbital dust ring, a collection of microscopic dust particles that circulates around the Sun along Venus' orbit. Though earlier missions have made some observations of Venus' orbital dust ring, Parker Solar Probe's images are the first to show the planet's dust ring for nearly its entire 360º span around the Sun. 44)
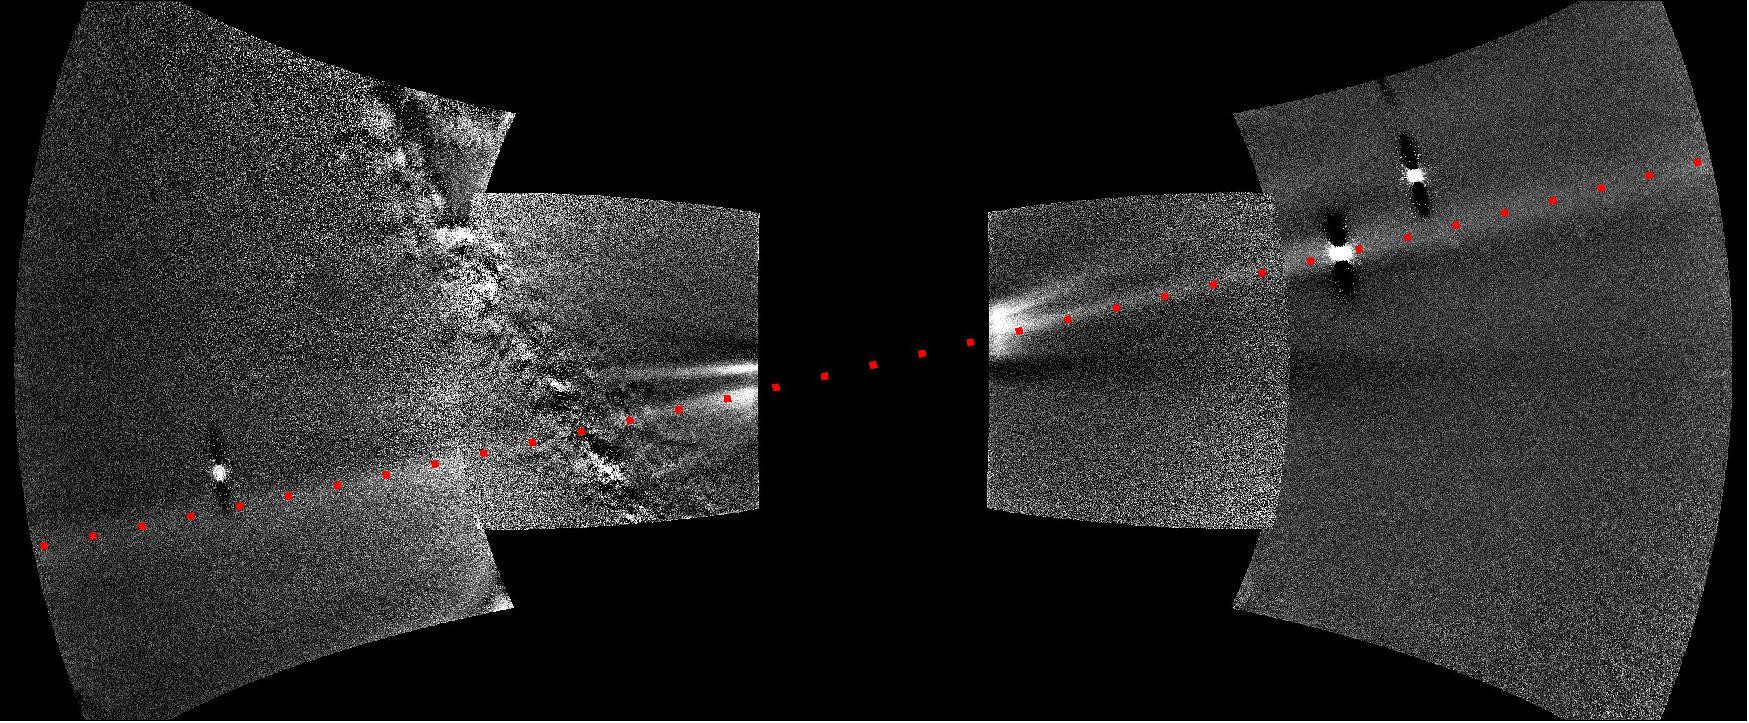
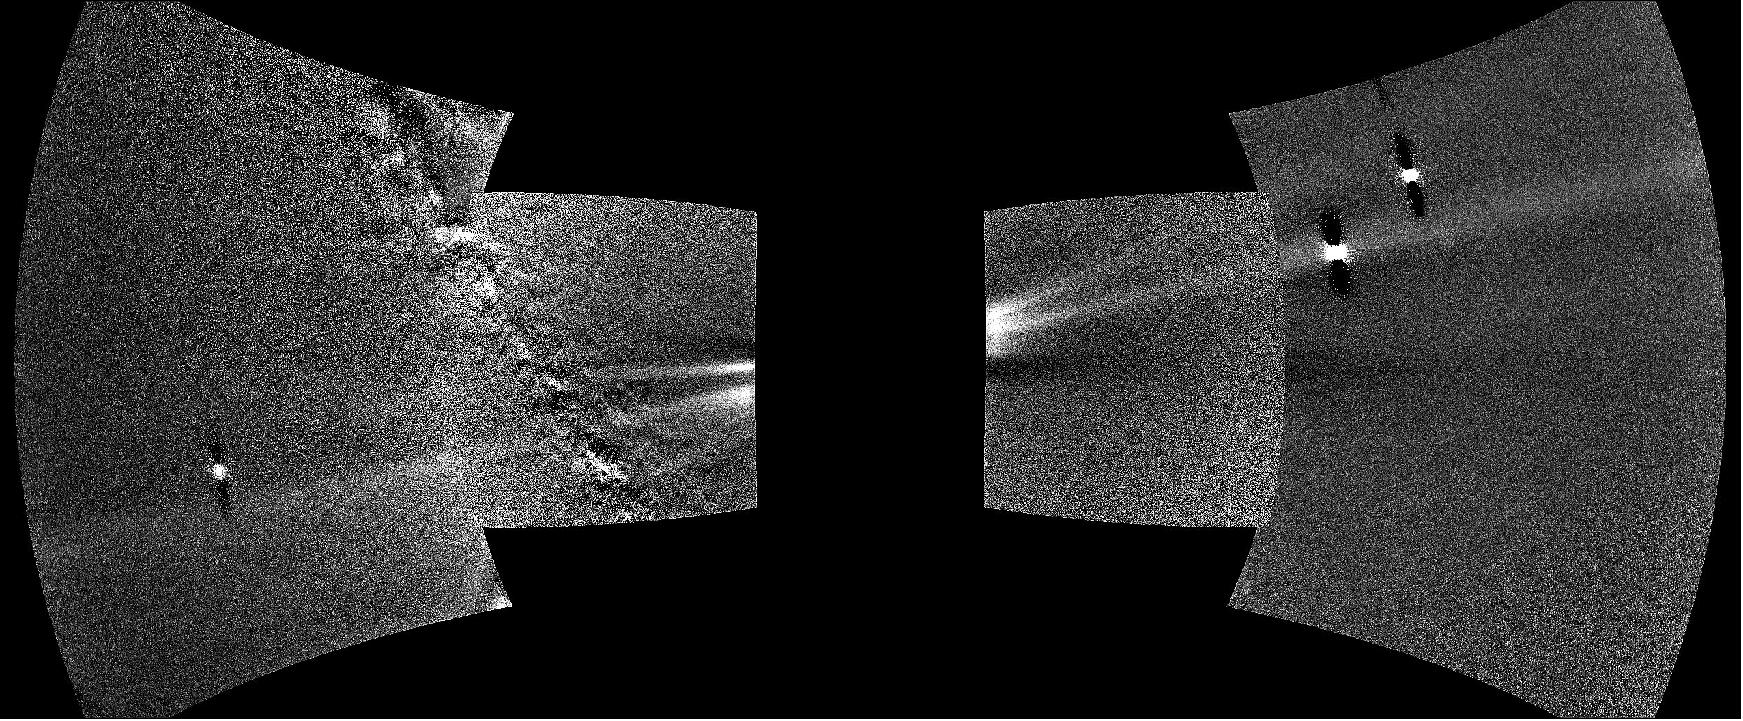
- Parker Solar Probe's WISPR instrument — short for Wide-field Imager for Solar Probe — is designed to study the solar wind, the Sun's constantly outflowing material. Space is teeming with dust, which reflects so much light that it typically shines at least a hundred times brighter than the solar wind. (The light reflected from space dust is what creates the zodiacal light, sometimes visible from Earth as a faint column of light rising upward from the horizon.)
- In order to see the solar wind with WISPR, scientists use image processing to remove the dust background and stars from the images. This process worked so well that Venus' orbital dust ring — which appears as a bright band stretching across the images — was subtracted as well. It wasn't until Parker Solar Probe performed rolling maneuvers to manage its momentum on its way to its next solar flyby, which changed the orientation of its cameras, that the static dust ring was noticed by scientists. Based on the relative brightness, scientists estimate that the dust along Venus' orbit is about 10% more dense than in neighboring regions. The results were published on April 7, 2021, in The Astrophysical Journal. 45) Read more about Parker Solar Probe's observations from the Johns Hopkins University Applied Physics Laboratory, which designed, built, and operates the spacecraft.
- The German-American Helios spacecraft and NASA's STEREO (Solar Terrestrial Relations Observatory) mission, have both made earlier observations of the dust ring along Venus' orbit. Those measurements have allowed scientists to develop new models of the origins of dust along Venus' orbit. Parker Solar Probe's sensitive imagers and unique orbit have given scientists an unprecedented peek at Venus' dust ring — something the science team aimed for since the mission's early days.
- As Parker Solar Probe flies ever-closer to the Sun over the course of its mission, the science team also expects to make the first observations of a long-hypothesized dust-free zone, a region close to the Sun where dust has been heated and vaporized by the intense sunlight. If there is a dust-free zone near the Sun — an idea supported by regions of thinning dust that Parker Solar Probe has already observed from afar — this would not only confirm theories about the interaction between our star and its nearby dust, but could also help astrophysicists who study more distant objects: Just as space dust can interfere with seeing the solar wind, it can also muddle measurements of stars and galaxies.
- However, for many scientists, the dust itself is what's interesting. For example, the exact origins of the dust that fills the solar system isn't settled science. For decades, scientists have largely thought the dust is debris from comets and asteroids — but new research using data from NASA's Juno mission to Jupiter suggests that dust storms on Mars could be the source of much of the solar system's dust.
- Space dust may also form the building blocks of stars and planets, carry gases between star systems, and provide a nurturing environment for young planets. These were some of the questions in mind for scientists on the DUST sounding rocket mission — short for Determining Unknown yet Significant Traits — which launched in 2019 to investigate how dust grains coagulate in the microgravity of space.
- Parker Solar Probe is part of NASA's Living with a Star program to explore aspects of the Sun-Earth system that directly affect life and society. The Living with a Star program is managed by the agency's Goddard Space Flight Center in Greenbelt, Maryland, for NASA's Science Mission Directorate in Washington. Johns Hopkins APL in Laurel, Maryland, manages the Parker Solar Probe mission for NASA and designed, built, and operates the spacecraft. The Naval Research Laboratory in Washington, D.C, designed, developed, and operates the WISPR instrument on Parker Solar Probe.
• March 9, 2021: When NASA's Parker Solar Probe sent back the first observations from its voyage to the Sun, scientists found signs of a wild ocean of currents and waves quite unlike the near-Earth space much closer to our planet. This ocean was spiked with what became known as switchbacks: rapid flips in the Sun's magnetic field that reversed direction like a zig-zagging mountain road. 46)
- Scientists think piecing together the story of switchbacks is an important part of understanding the solar wind, the constant stream of charged particles that flows from the Sun. The solar wind races through the solar system, shaping a vast space weather system, which we regularly study from various vantage points around the solar system – but we still have basic questions about how the Sun initially manages to shoot out this two-million-miles-per-hour gust.
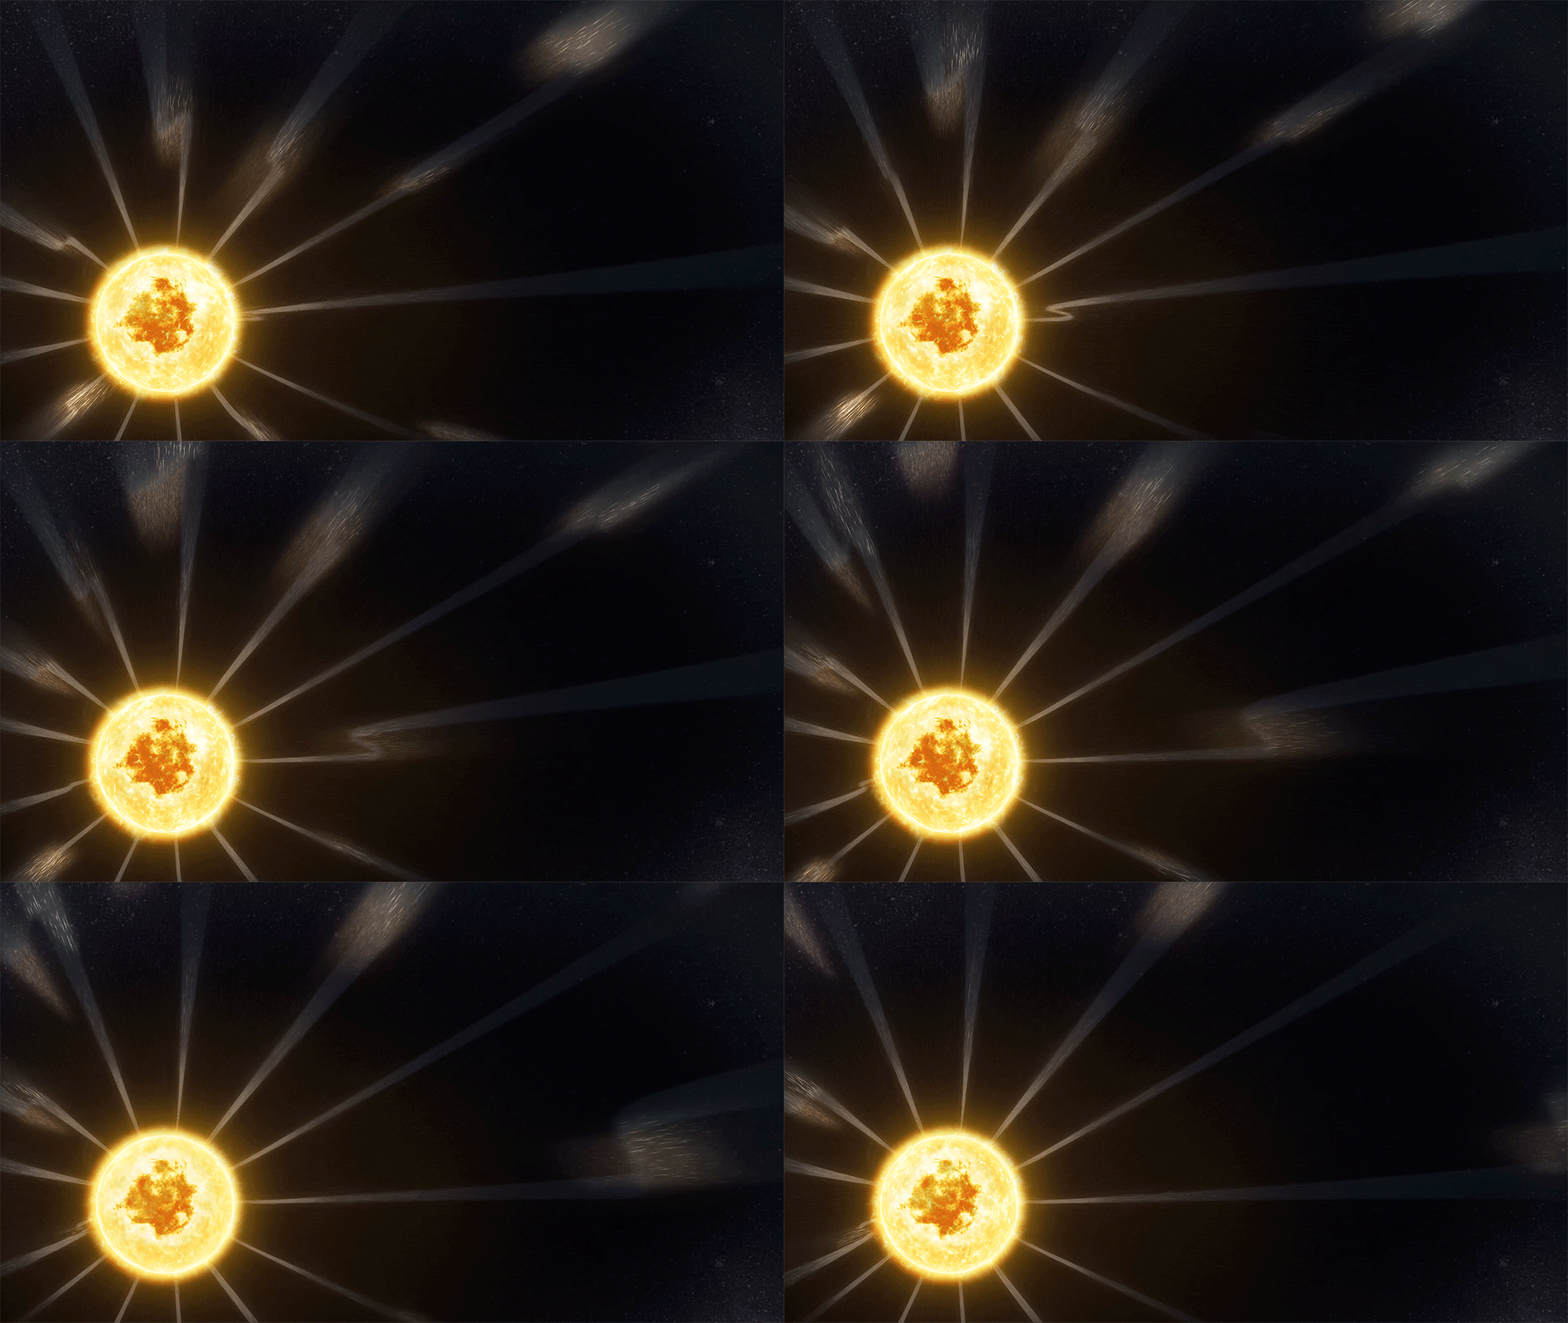
- Solar physicists have long known the solar wind comes in two flavors: the fast wind, which travels around 430 miles per second, and the slow wind, which travels closer to 220 miles per second. The fast wind tends to come from coronal holes, dark spots on the Sun full of open magnetic field. Slower wind emerges from parts of the Sun where open and closed magnetic fields mingle. But there is much we've still to learn about what drives the solar wind, and scientists suspect switchbacks – fast jets of solar material peppered throughout it – hold clues to its origins.
- Since their discovery, switchbacks have sparked a flurry of studies and scientific debate as researchers try to explain how the magnetic pulses form.
- "This is the scientific process in action," said Kelly Korreck, Heliophysics program scientist at NASA Headquarters. "There are a variety of theories, and as we get more and more data to test those theories, we get closer to figuring out switchbacks and their role in the solar wind."
Magnetic fireworks
- On one side of the debate: a group of researchers who think switchbacks originate from a dramatic magnetic explosion that happens in the Sun's atmosphere.
- Signs of what we now call switchbacks were first observed by the joint NASA-European Space Agency mission Ulysses, the first spacecraft to fly over the Sun's poles. But when the data streamed down from Parker Solar Probe decades later, scientists were surprised to find so many.
- As the Sun rotates and its superheated gases churn, magnetic fields migrate around our star. Some magnetic field lines are open, like ribbons waving in the wind. Others are closed, with both ends or "footpoints" anchored in the Sun, forming loops that course with scorching hot solar material. One theory – initially proposed in 1996 based on Ulysses data – suggests switchbacks are the result of a clash between open and closed magnetic fields. An analysis published last year by scientists Justin Kasper and Len Fisk of the University of Michigan further explores the 20-year-old theory.
- When an open magnetic field line brushes against a closed magnetic loop, they can reconfigure in a process called interchange reconnection – an explosive rearrangement of the magnetic fields that leads to a switchback shape. "Magnetic reconnection is a little like scissors and a soldering gun combined into one," said Gary Zank, a solar physicist at the University of Alabama Huntsville. The open line snaps onto the closed loop, cutting free a hot burst of plasma from the loop, while "gluing" the two fields into a new configuration. That sudden snap throws an S-shaped kink into the open magnetic field line before the loop reseals – a little like, for example, the way a quick jerk of the hand will send an S-shaped wave traveling down a rope.
- Other research papers have looked at how switchbacks take shape after the fireworks of reconnection. Often, this means building mathematical simulations, then comparing the computer-generated switchbacks to Parker Solar Probe data. If they're a close match, the physics used to create the models may successfully help describe the real physics of switchbacks.
- Zank led the development of the first switchbacks model. His model suggests not one, but two magnetic whips are born during reconnection: One travels down to the solar surface and one zips out into the solar wind. Like an electric wire made from a bundle of smaller wires, each magnetic loop is made of many magnetic field lines. "What happens is, each of these individual wires reconnects, so you produce a whole slew of switchbacks in a short period of time," Zank said.
- Zank and his team modelled the very first switchback Parker Solar Probe observed, on Nov. 6, 2018. This first model fit the observations well, encouraging the team to develop it further. The team's results were published in The Astrophysical Journal on Oct. 26, 2020. 47)
- Another group of scientists, led by University of Maryland physicist James Drake, agrees on the import of interchange reconnection. But they differ when it comes to the nature of switchbacks themselves. Where others say switchbacks are a kink in a magnetic field line, Drake and his team suggest what Parker is observing is the signature of a kind of magnetic structure, called a flux rope.
- In Drake's simulations, the kink in the field didn't travel very far before fizzling out. "Magnetic field lines are like rubber bands, they like to snap back to their original shape," he explained. But the scientists knew the switchbacks had to be stable enough to travel out to where Parker Solar Probe could see them. On the other hand, flux ropes – which are thought to be core components of many solar eruptions – are sturdier. Picture a magnetic striped candy cane. That's a flux rope: strips of magnetic field wrapped around a bundle of more magnetic field.
- Drake and his team think flux ropes could be an important part of explaining switchbacks, since they should be stable enough to travel out to where Parker Solar Probe observed them. Their study – published in Astronomy and Astrophysics on Oct. 8, 2020 – lays the groundwork for building a flux rope-based model to describe the origins of switchbacks. 48)
- What these scientists have in common is they think magnetic reconnection can explain not only how switchbacks form, but also how the solar wind is heated and slings out from the Sun. In particular, switchbacks are linked to the slow solar wind. Each switchback shoots a gob of hot plasma into space. "So we're asking, ‘If you add up all those bursts, can they contribute to the generation of the solar wind?'" Drake said.
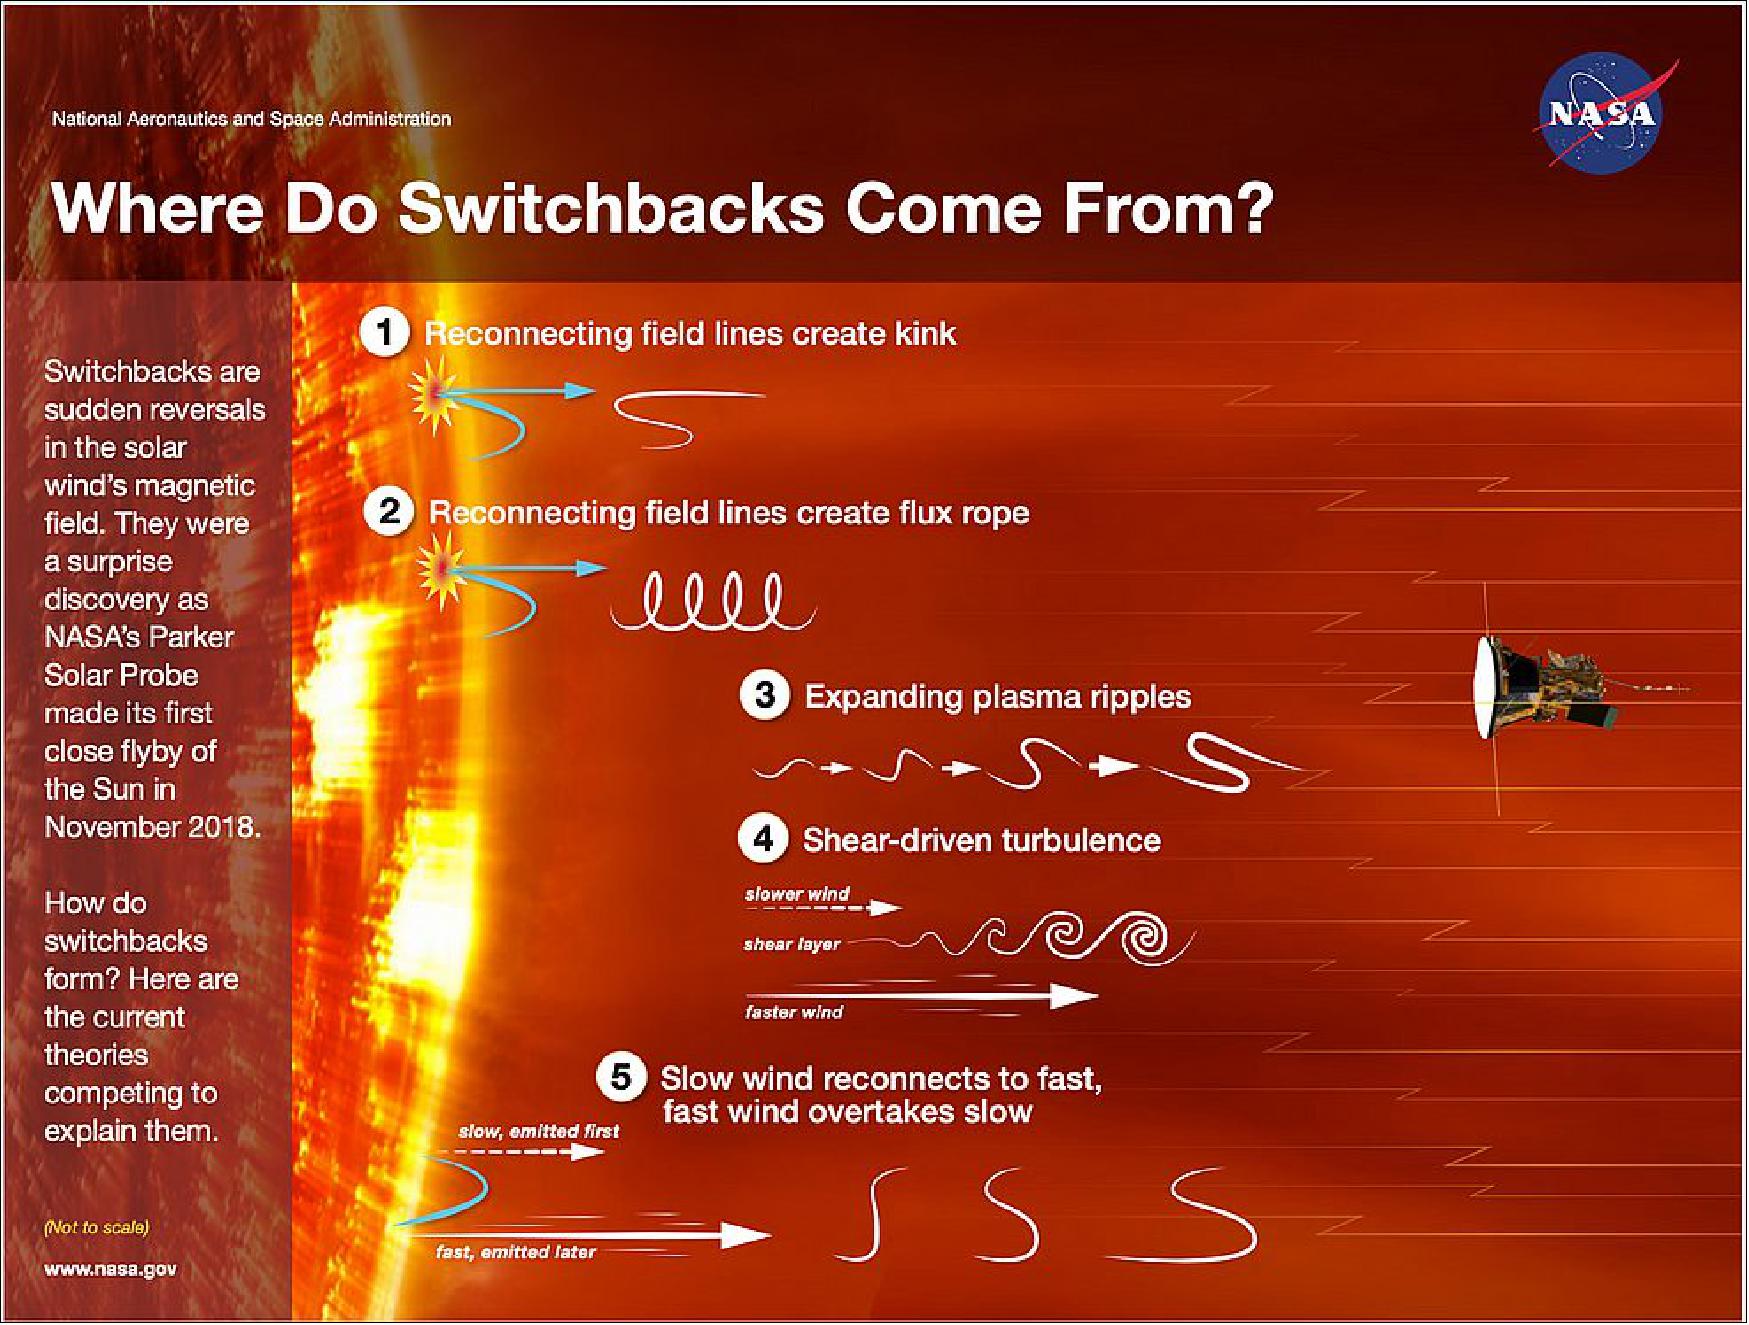
Going With the Flow
- On the other side of the debate are scientists who believe that switchbacks form in the solar wind, as a byproduct of turbulent forces stirring it up.
- Jonathan Squire, space physicist at New Zealand's University of Otago, is one of them. Using computer simulations, he studied how small fluctuations in the solar wind evolved over time. "What we do is try and follow a small parcel of plasma as it moves outwards," Squire said.
- Each parcel of solar wind expands as it escapes the Sun, blowing up like a balloon. Waves that undulate across the Sun create tiny ripples in that plasma, ripples that gradually grow as the solar wind spreads out.
- "They start out first as wiggles, but then what we see is as they grow even further, they turn into switchbacks," Squire said. "That's why we feel it's quite a compelling idea – it just happened by itself in the model." The team didn't have to incorporate any guesses about new physics into their models – the switchbacks appeared based on fairly agreed-upon solar science.
- Squire's model, published on Feb. 26, 2020, suggests switchbacks form naturally as the solar wind expands into space. Parts of the solar wind that expand more rapidly, he predicts, should also have more switchbacks – a prediction already testable with the latest Parker dataset. 49)
- Other researchers agree that switchbacks begin in the solar wind, but suspect they form when fast and slow streams of solar wind rub against one another. One October 2020 study, led by Dave Ruffolo at Mahidol University in Bangkok, Thailand, outlined this idea.
- Bill Matthaeus, a co-author on the paper and space physicist at the University of Delaware in Newark, points to the shearing at the boundary between fast and slow streams. This shearing between fast and slow creates characteristic swirls seen all over in nature, like the eddies that form as river water flows around a rock. Their models suggest that these swirls ultimately become switchbacks, curling the magnetic field lines back on themselves.
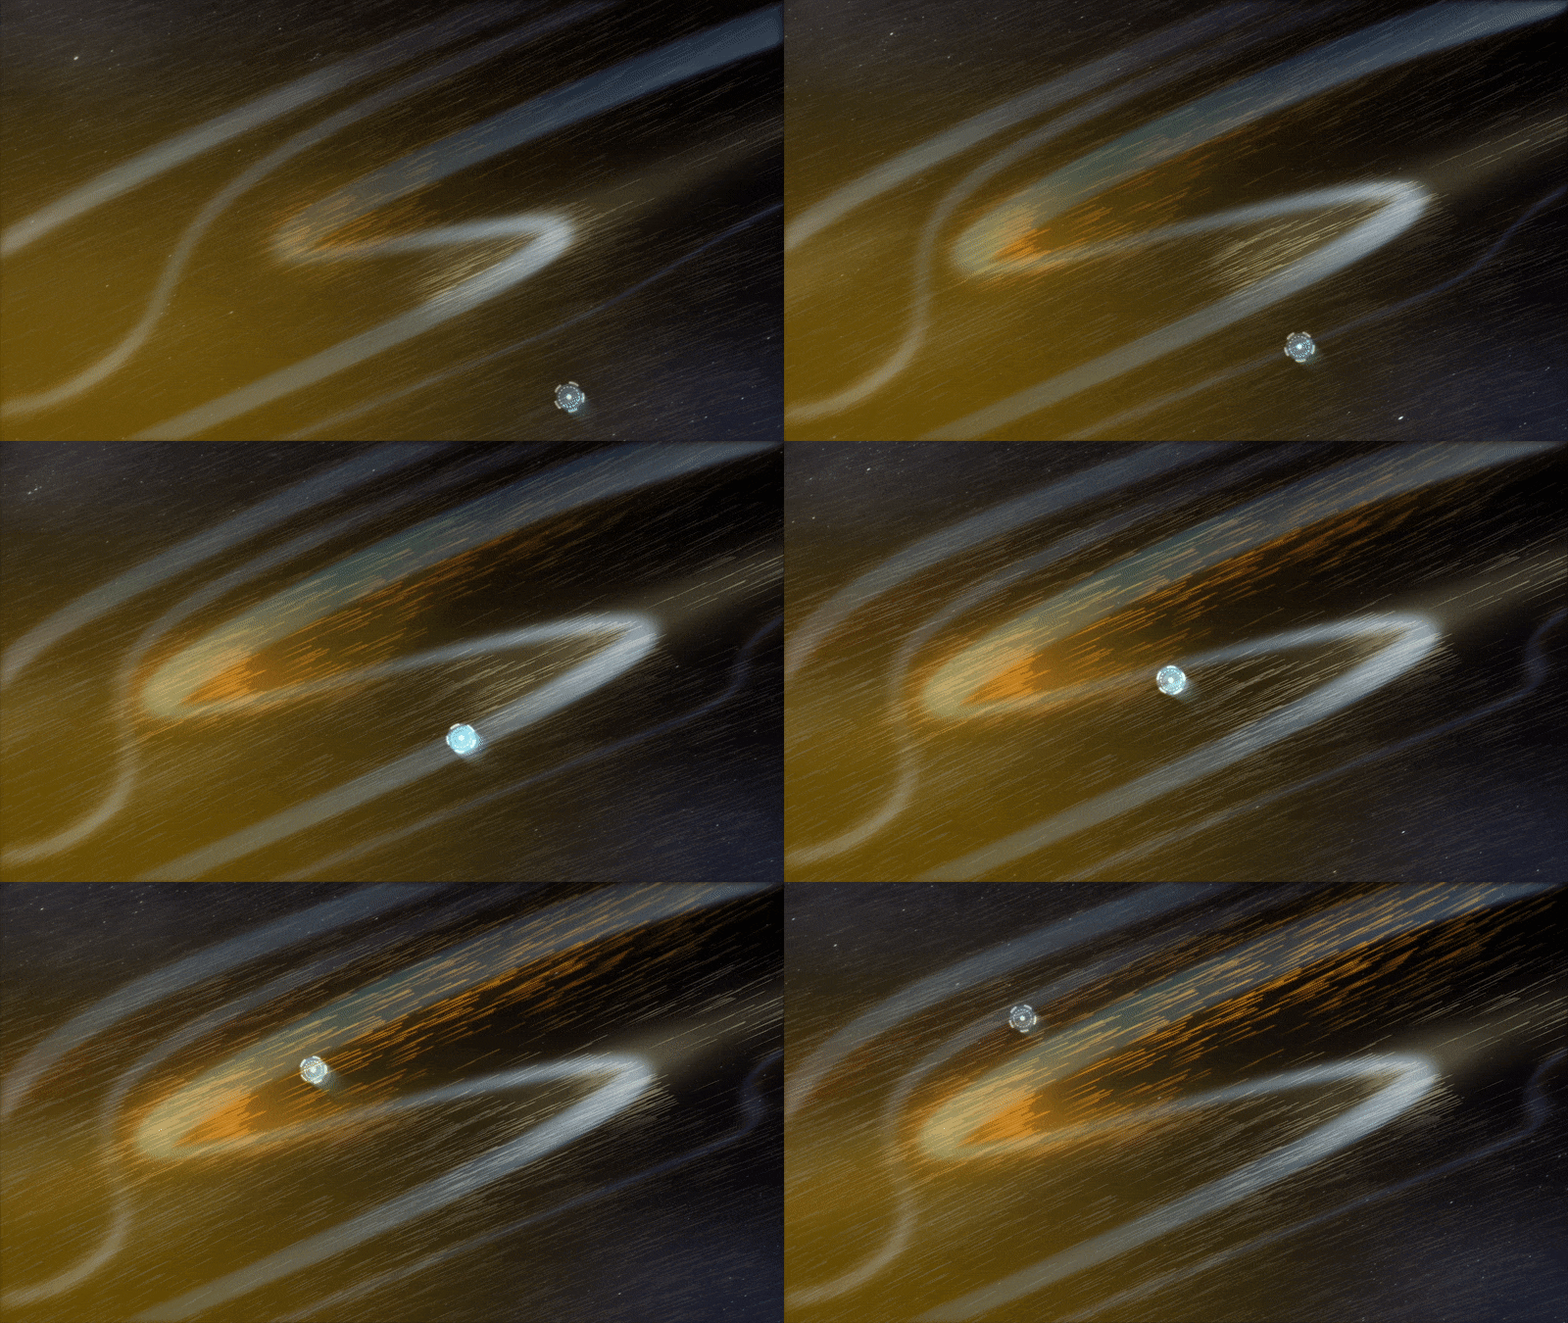
- But the swirls don't form immediately – the solar wind has to be moving pretty fast before it can bend its otherwise rigid magnetic field lines. The solar wind reaches this speed about 8.5 million miles from the Sun. Mattheaus' key prediction is that when Parker gets significantly closer to the Sun than that – which should happen during its next close pass 6.5 million miles from the Sun, on April 29, 2021 – the switchbacks should disappear.
- "If this is the origin, then as Parker moves into the lower corona this shearing can't happen," Mattheaus said. "So, the switchbacks caused by the phenomenon we're describing should go away."
- One aspect of switchbacks that these solar wind models haven't yet successfully simulated is the fact that they tend to be stronger when they twist in a particular direction – the same direction of the Sun's rotation. However, both simulations were created with a Sun that was still, not rotating, which may make the difference. For these modelers, incorporating the actual rotation of the Sun is the next step.
Twisting in the Wind
- Finally, some scientists think switchbacks stem from both processes, starting with reconnection or footpoint motion at the Sun but only growing into their final shape once they get out into the solar wind. A paper published today by Nathan Schwadron and David McComas, space physicists at the University of New Hampshire and Princeton University, respectively, adopts this approach, arguing that switchbacks form when streams of fast and slow solar wind realign at their roots. 50)
- After this realignment fast wind ends up "behind" slow wind, on the same magnetic field line. (Imagine a group of joggers on a race track, Olympic sprinters at their heels.) This could happen in any case where slow and fast wind meet, but most notably at the boundaries of coronal holes, where fast solar wind is born. As coronal holes migrate across the Sun, scooting underneath streams of slower solar wind, the footpoint from the slow solar wind plugs into a source of fast wind. Fast solar wind races after the slower stream ahead of it. Eventually the fast wind overtakes the slower wind, inverting the magnetic field line and forming a switchback.
- Schwadron thinks the motion of coronal holes and of solar wind sources across the Sun is also a key puzzle piece. Reconnection at the leading edge of coronal holes, he suggests, could explain why switchbacks tend to "zig" in a way that's aligned with the Sun's rotation.
- "The fact that these are oriented in this particular way is telling us something very fundamental," Schwadron said.
- Though it starts with the Sun, Schwadron and McComas think those reconnecting streams only become switchbacks within the solar wind, where the Sun's magnetic field lines are flexible enough to double-back on themselves.
- As Parker Solar Probe swoops closer and closer to the Sun, scientists will eagerly look for clues that will support – or debunk – their theories. "There are different ideas floating around," Zank said. "Eventually something will pan out."
• March 5, 2021: During Parker Solar Probe's seventh swing by the Sun, culminating in its closest solar approach, or perihelion, on Jan. 17, 2021, celestial geometry posed a special opportunity. The configuration of this particular orbit placed Parker Solar Probe on the same side of the Sun as Earth — meaning that Earth-bound observatories could observe the Sun and its outpouring of solar wind from the same perspective as Parker's. This comes on the heels of a similar observation campaign in the winter of 2020. 51)
- "Along with the global science community, the Parker Solar Probe team can't wait to see this new data," said Nour Raouafi, the Parker Solar Probe project scientist from the Johns Hopkins Applied Physics Laboratory in Laurel, Maryland. "Combining it with contributions from observatories around the globe will help us to put Parker observations in a broader context and build a complete picture of the phenomena observed in the solar atmosphere."
- Following are snapshots from a few missions that observed the Sun and the solar system during Parker Solar Probe's seventh solar encounter.
Solar-B/Hinode Mission of JAXA/ISAS
SDO (Solar Dynamics Observatory) of NASA
IRIS (Interface Region Imaging Spectrograph) of NASA
GONG (Global Oscillation Network Group)
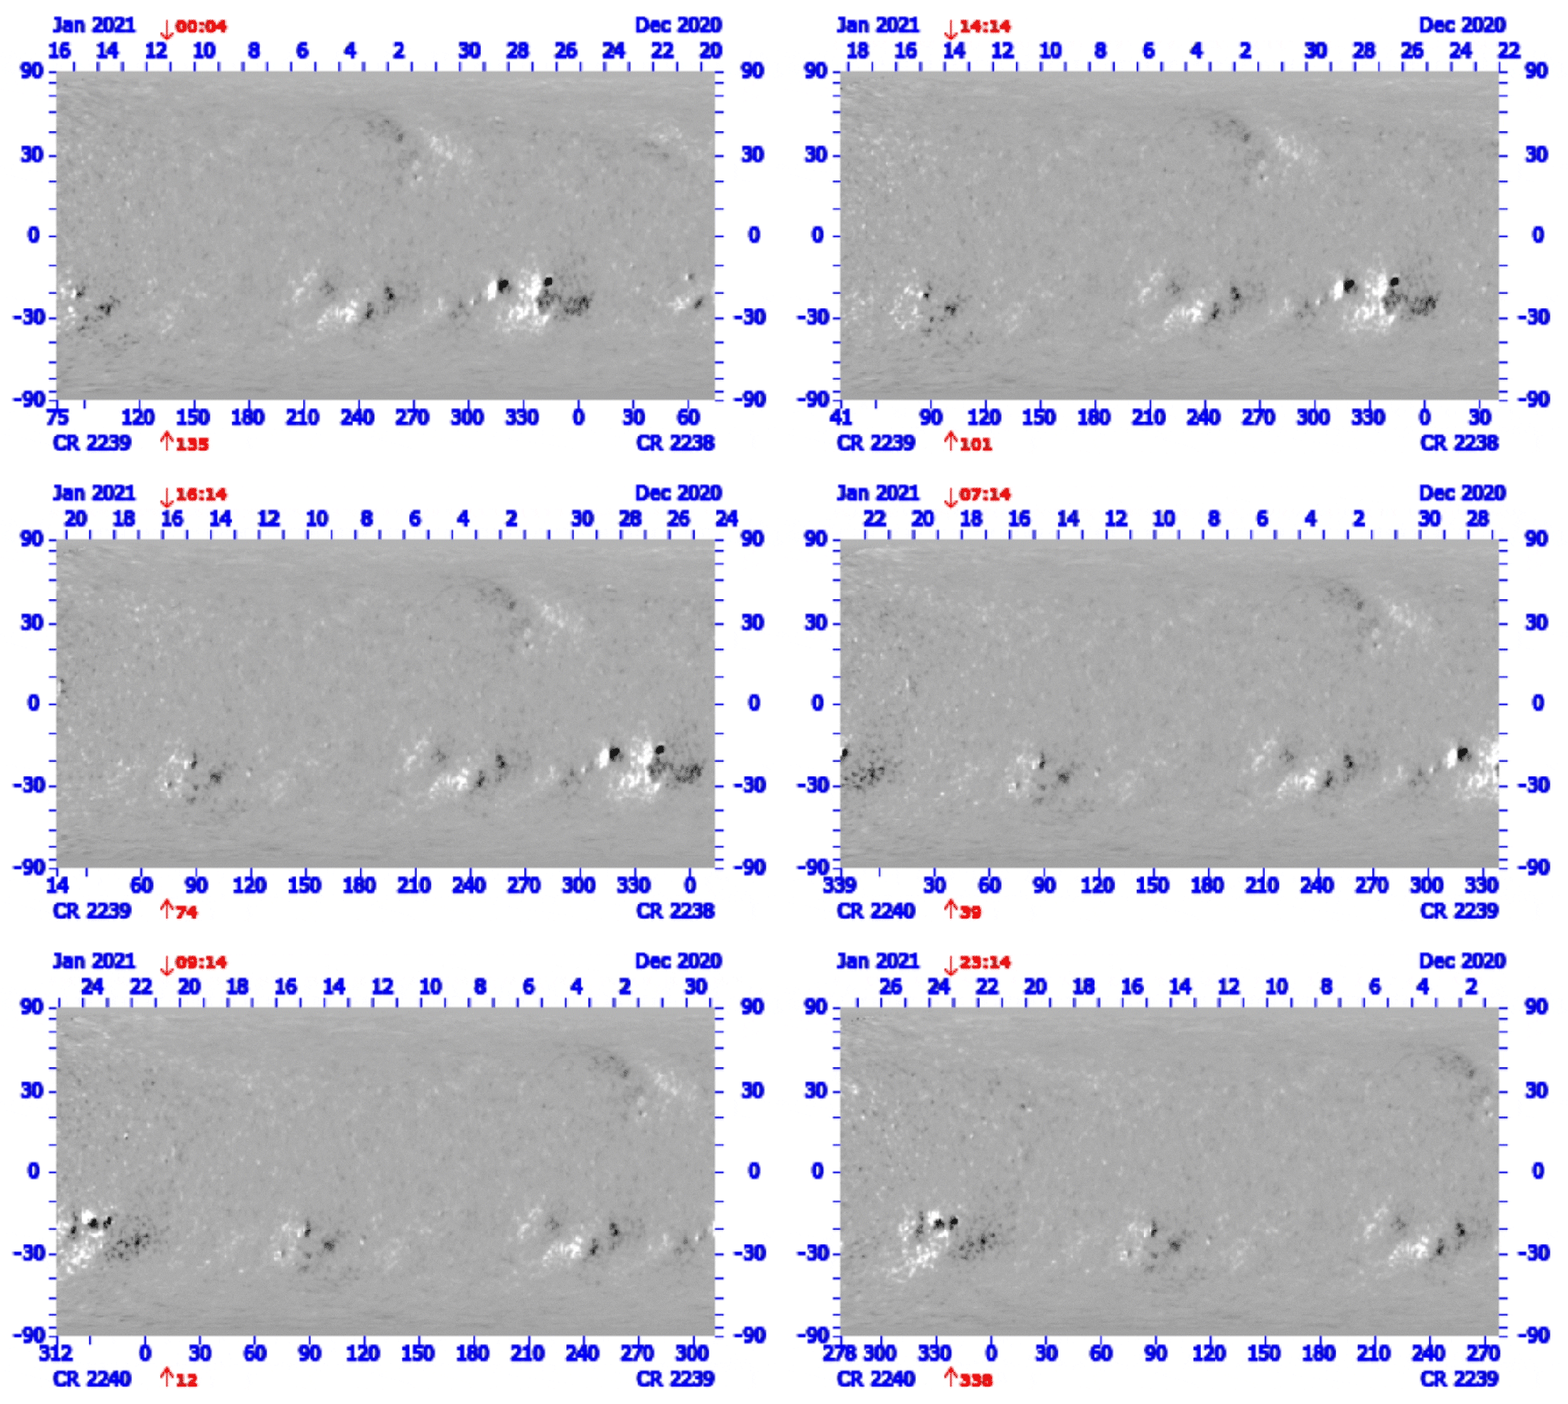
THEMIS (Time History of Events and Macroscale Interactions during Substorms) mission of NASA
- A trio of NASA's THEMIS spacecraft orbit Earth to measure particles and electric and magnetic fields in near-Earth space. THEMIS' data helps researchers untangle the complicated factors that govern the response of near-Earth space to dynamics in Earth's magnetic field, changes in the Sun's constantly outflowing solar wind, and activity on the Sun.
- These measurements were taken by THEMIS-E, one of the spacecraft in orbit around Earth, on Jan. 20. It takes about two to three days for solar wind to cross the tens of millions of miles from the Sun to Earth, so the solar wind conditions observed by Parker Solar Probe during its close solar approach on Jan. 17 did not begin to influence near-Earth space until about Jan. 19-20.
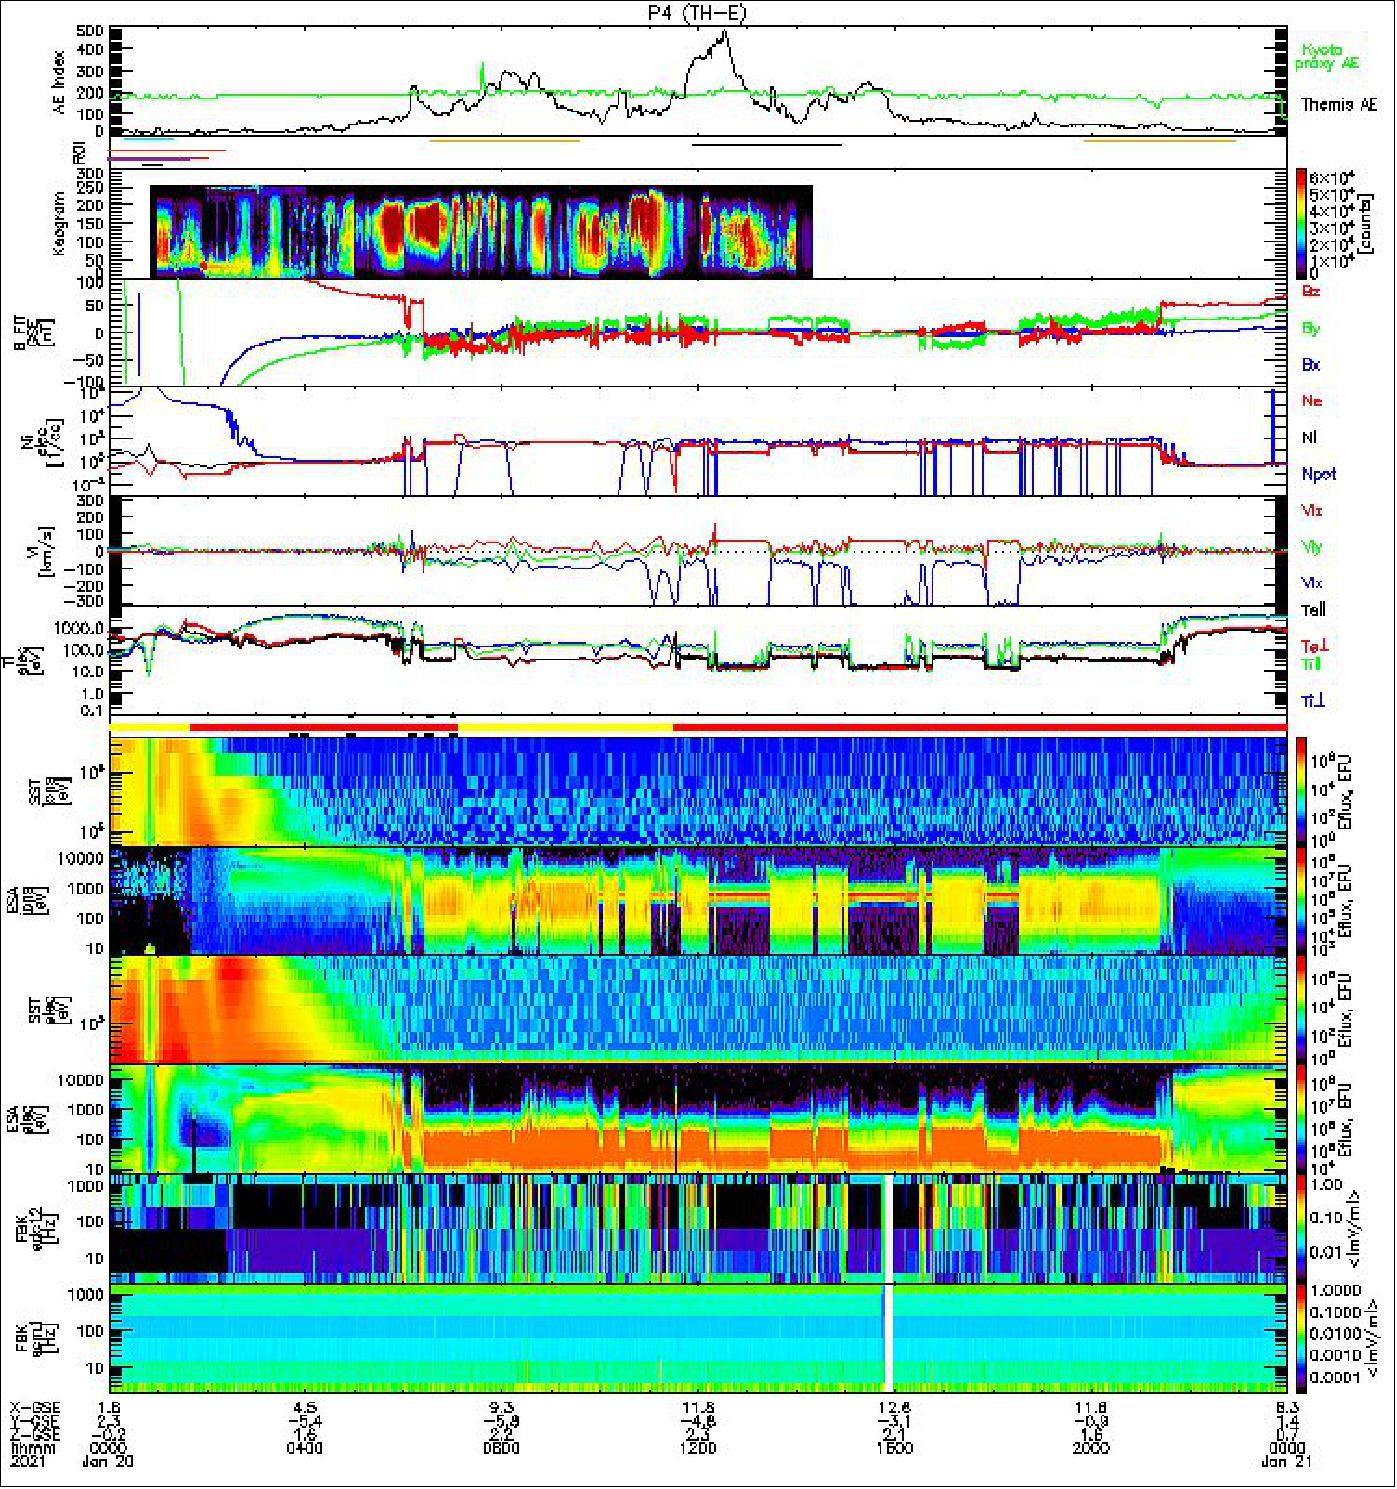
• February 24, 2021: NASA's Parker Solar Probe captured stunning views of Venus during its close flyby of the planet in July 2020. 52)
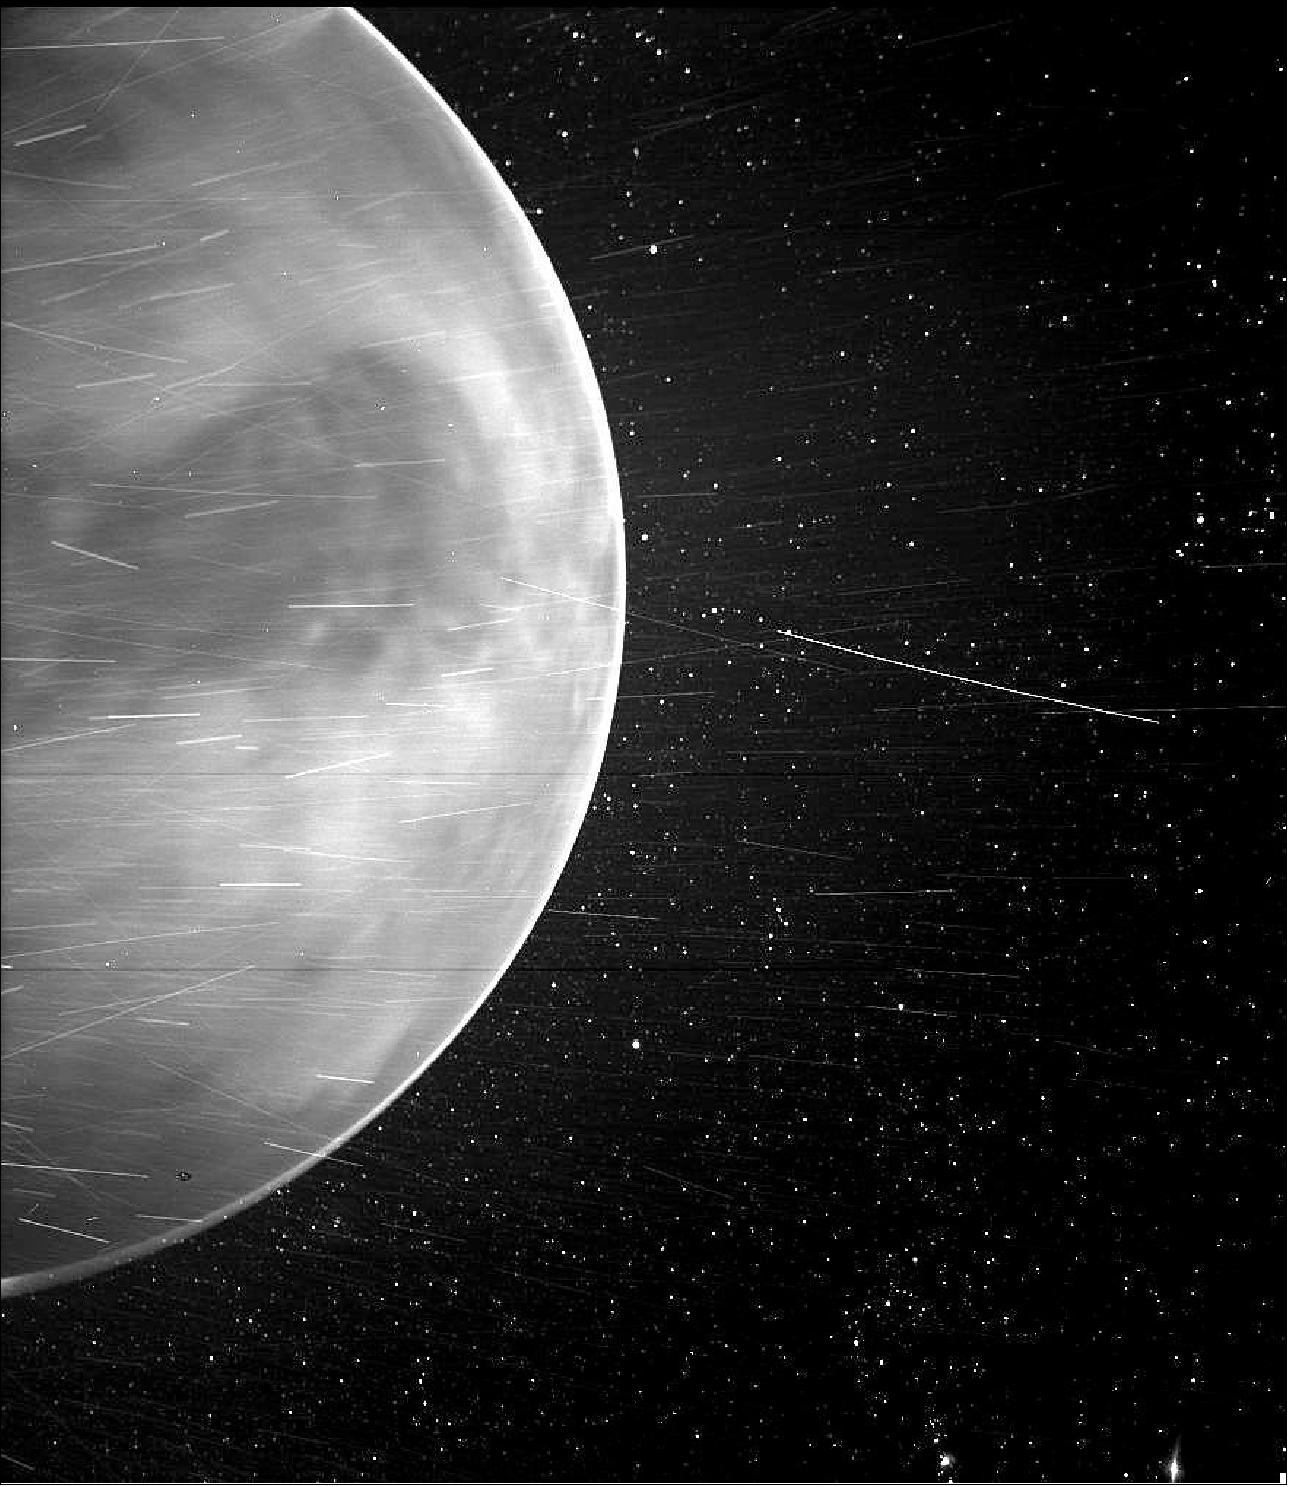
- WISPR is designed to take images of the solar corona and inner heliosphere in visible light, as well as images of the solar wind and its structures as they approach and fly by the spacecraft. At Venus, the camera detected a bright rim around the edge of the planet that may be nightglow — light emitted by oxygen atoms high in the atmosphere that recombine into molecules in the nightside. The prominent dark feature in the center of the image is Aphrodite Terra, the largest highland region on the Venusian surface. The feature appears dark because of its lower temperature, about 85 degrees Fahrenheit (30 degrees Celsius) cooler than its surroundings.
- That aspect of the image took the team by surprise, said Angelos Vourlidas, the WISPR project scientist from the Johns Hopkins Applied Physics Laboratory (APL) in Laurel, Maryland, who coordinated a WISPR imaging campaign with Japan's Venus-orbiting Akatsuki mission. "WISPR is tailored and tested for visible light observations. We expected to see clouds, but the camera peered right through to the surface."
- "WISPR effectively captured the thermal emission of the Venusian surface," said Brian Wood, an astrophysicist and WISPR team member from the U.S. Naval Research Laboratory in Washington, D.C. "It's very similar to images acquired by the Akatsuki spacecraft at near-infrared wavelengths."
- This surprising observation sent the WISPR team back to the lab to measure the instrument's sensitivity to infrared light. If WISPR can indeed pick up near-infrared wavelengths of light, the unforeseen capability would provide new opportunities to study dust around the Sun and in the inner solar system. If it can't pick up extra infrared wavelengths, then these images — showing signatures of features on Venus' surface — may have revealed a previously unknown "window" through the Venusian atmosphere.
- "Either way," Vourlidas said, "some exciting science opportunities await us."
- For more insight into the July 2020 images, the WISPR team planned a set of similar observations of the Venusian nightside during Parker Solar Probe's latest Venus flyby on Feb. 20, 2021. Mission team scientists expect to receive and process that data for analysis by the end of April.
- "We are really looking forward to these new images," said Javier Peralta, a planetary scientist from the Akatsuki team, who first suggested a Parker Solar Probe campaign with Akatsuki, which has been in orbiting Venus since 2015. "If WISPR can sense the thermal emission from the surface of Venus and nightglow — most likely from oxygen — at the limb of the planet, it can make valuable contributions to studies of the Venusian surface."
- Parker Solar Probe is part of NASA's Living with a Star program to explore aspects of the Sun-Earth system that directly affect life and society. The Living with a Star program is managed by the agency's Goddard Space Flight Center in Greenbelt, Maryland, for NASA's Science Mission Directorate in Washington. Johns Hopkins APL designed, built and operates the spacecraft.
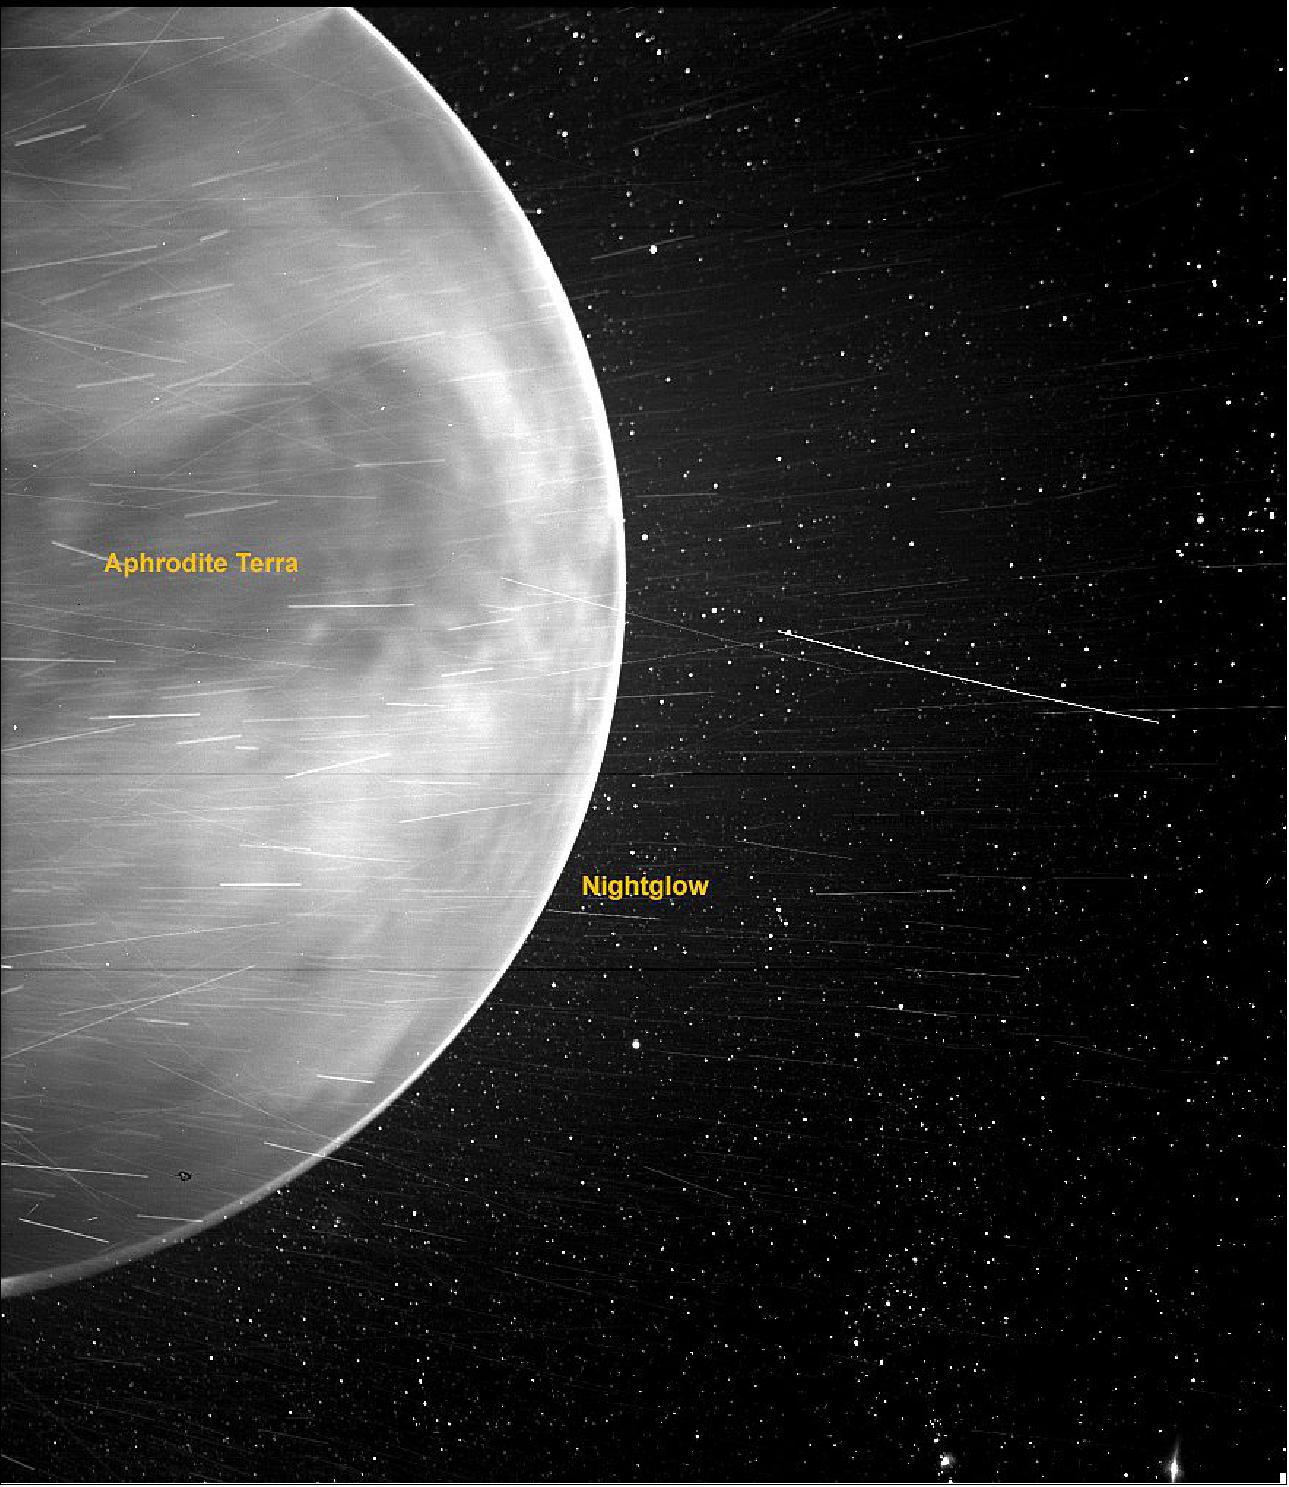
• January 29, 2021: Though they focus on the star at the center of our solar system, some Sun-watching spacecraft recently captured unique views of Earth and other planets. Each mission has a distinct orbit, so the perspectives are different from each other and from our view from Earth. 53)
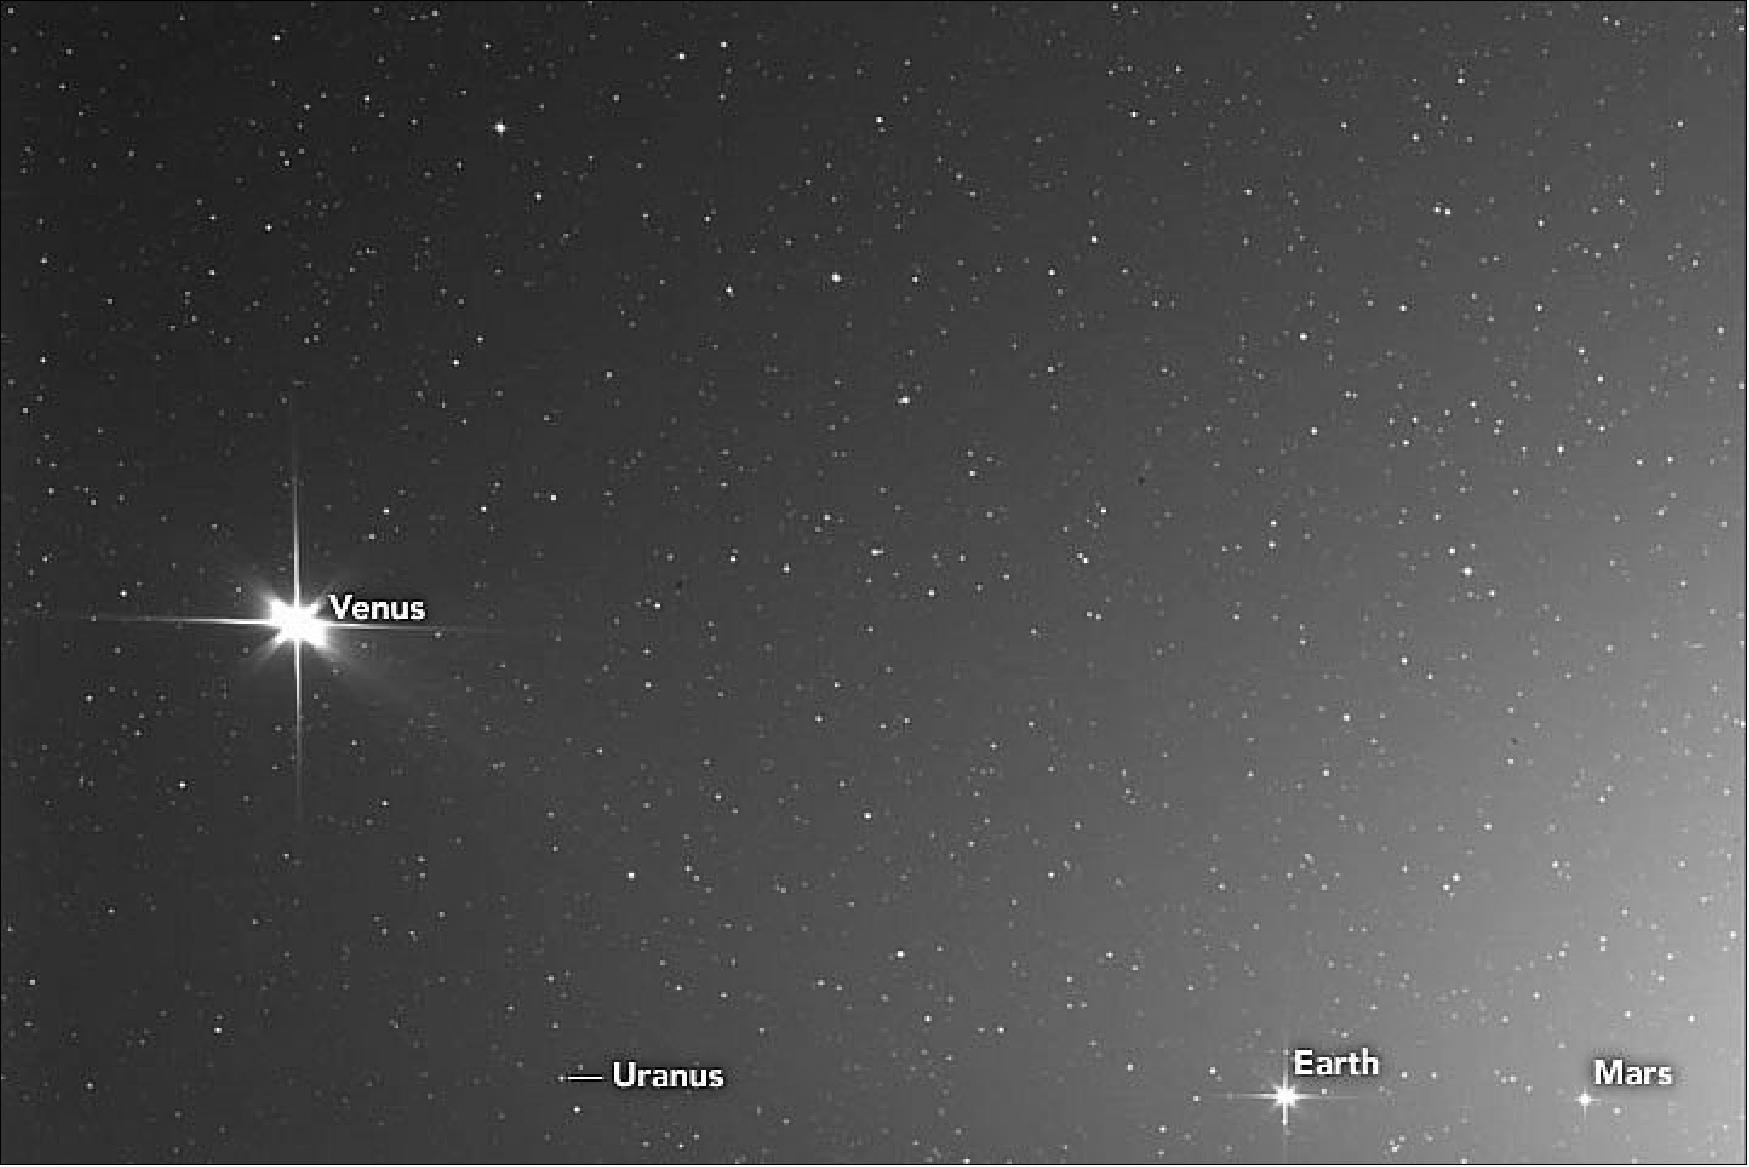
- Solar Orbiter and the Parker Solar Probe both carry instruments to study the Sun and its influence on space. Among those instruments are low-light cameras that can observe the Sun's outer atmosphere and the solar wind. It's these instruments that saw several planets pass through their fields of view in 2020.
- Solar Orbiter is a joint mission of the European Space Agency (ESA) and NASA that launched in February 2020. The spacecraft returned its first images in July 2020, including closest-ever views of the Sun. SoloHI, one of ten instruments on the spacecraft, looks off to the side of the Sun to observe the solar wind and the dust that fills the space between the planets.
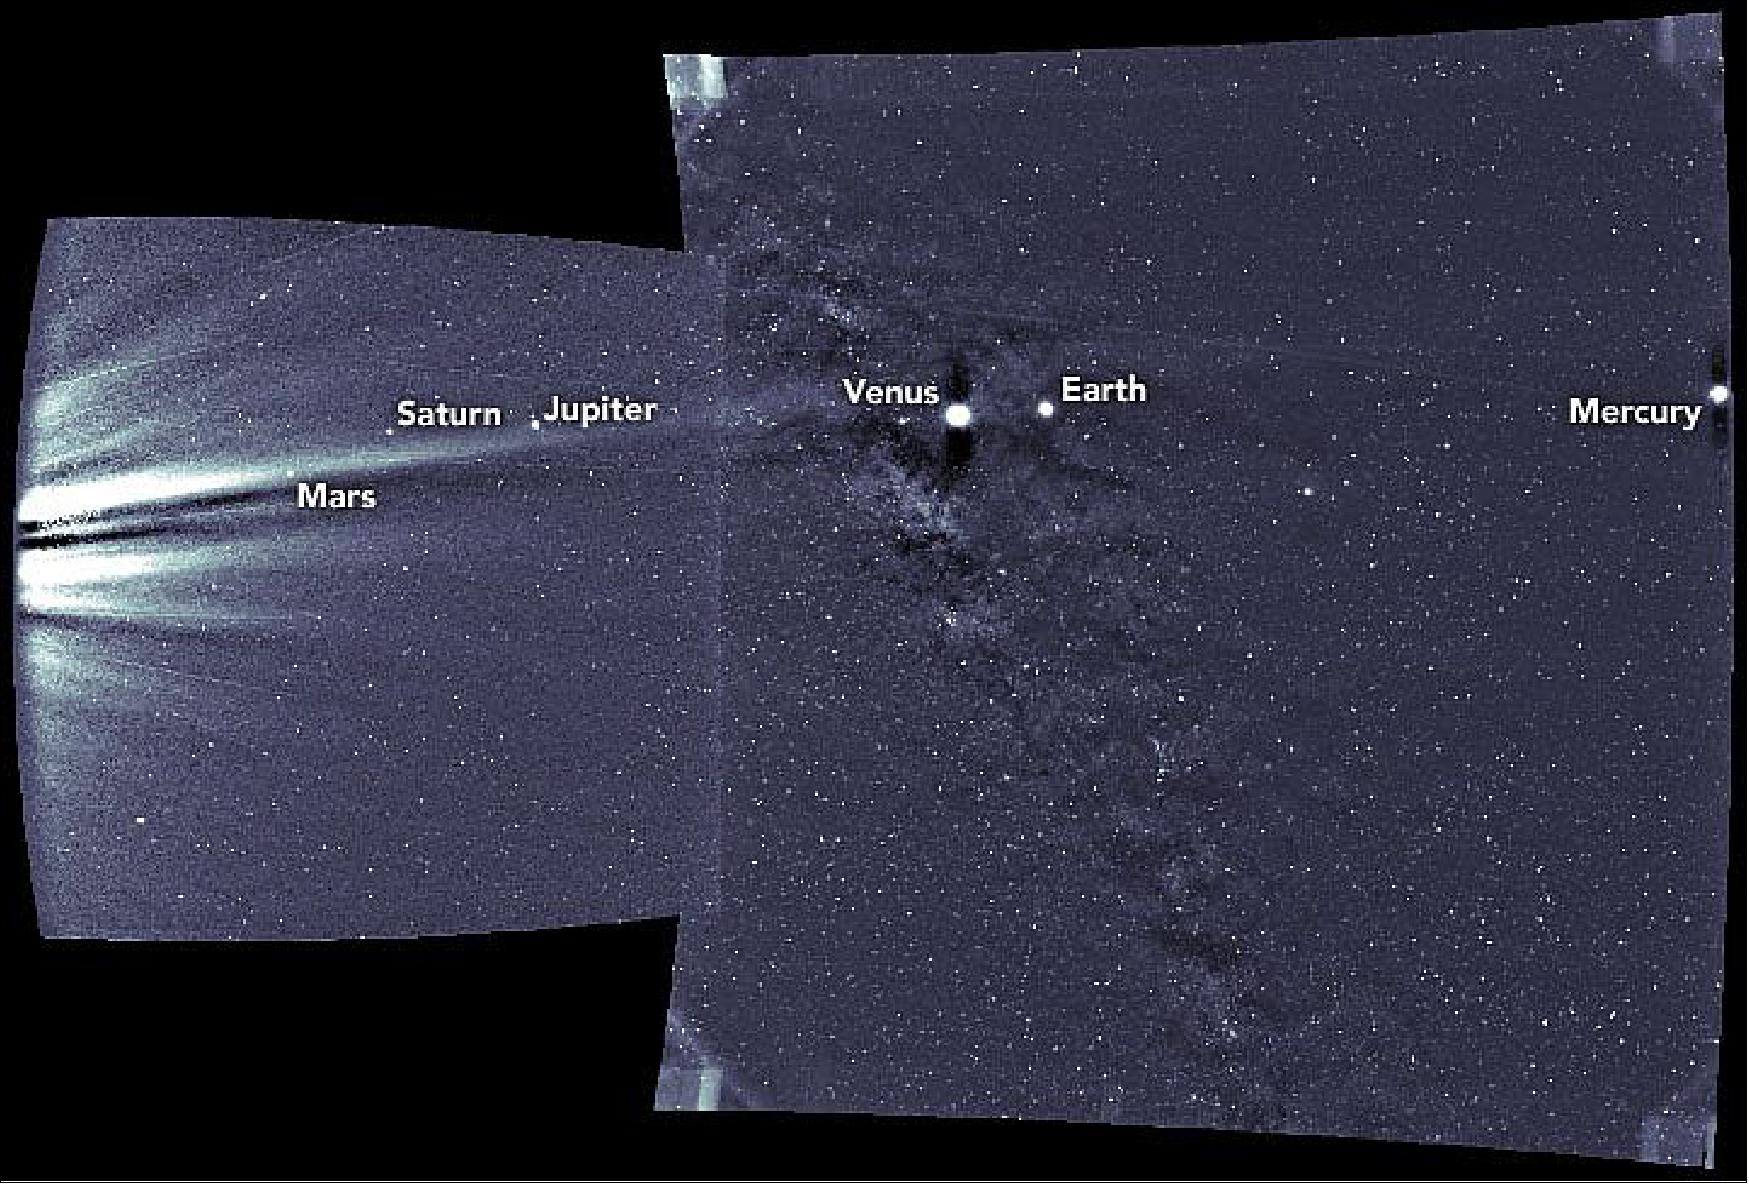
- WISPR takes images of the solar corona and the inner heliosphere in visible light, while also observing the solar wind and other structures as they approach and pass the spacecraft. The NASA spacecraft was approximately 18.7 million kilometers (11.6 million miles) from the Sun at the time, and about 158 million kilometers (98 million miles) from Earth. See a schematic of Parker's position and field of view.
- One of the spacecraft in NASA's Solar and Terrestrial Relations Observatory (STEREO) also observed most of the planets on June 7, 2020. View that image here.
• January 21, 2021: There are lots of eyes on the Sun this week, as NASA's Parker Solar Probe swings around our star on the seventh of its 24 scheduled orbits. 54)
- None are closer than Parker Solar Probe, which passed just 8.4 million miles (13.5 million kilometers) from the Sun's surface while flying at 289,932 miles/hour (466,600 km/hour) on Jan. 17, essentially matching its own records for solar proximity and speed. Around this same time, several spacecraft and dozens of earthbound telescopes were primed to contribute observations that will give scientists a comprehensive and coordinated picture of solar activity.
- On Jan. 21, the spacecraft transmitted a "tone one," indicating all systems were healthy and operating normally after the spacecraft's close approach to the Sun and heading into the final stretch of the solar encounter, which runs through Jan. 23.
- The geometry of this particular orbit means that Parker Solar Probe's closest approach to the Sun, or perihelion, was in direct view of Earth. Some 40 observatories around the globe, including major installations in Hawaii, the southwestern United States, Europe, and Asia, trained their telescopes on the Sun over the several weeks around the perihelion. About a dozen spacecraft, including NASA's STEREO, Solar Dynamics Observatory, TIMED, and Magnetospheric Multiscale missions, ESA and NASA's Solar Orbiter, and ESA's BepiColombo made simultaneous observations of activity stretching from the Sun to Earth.
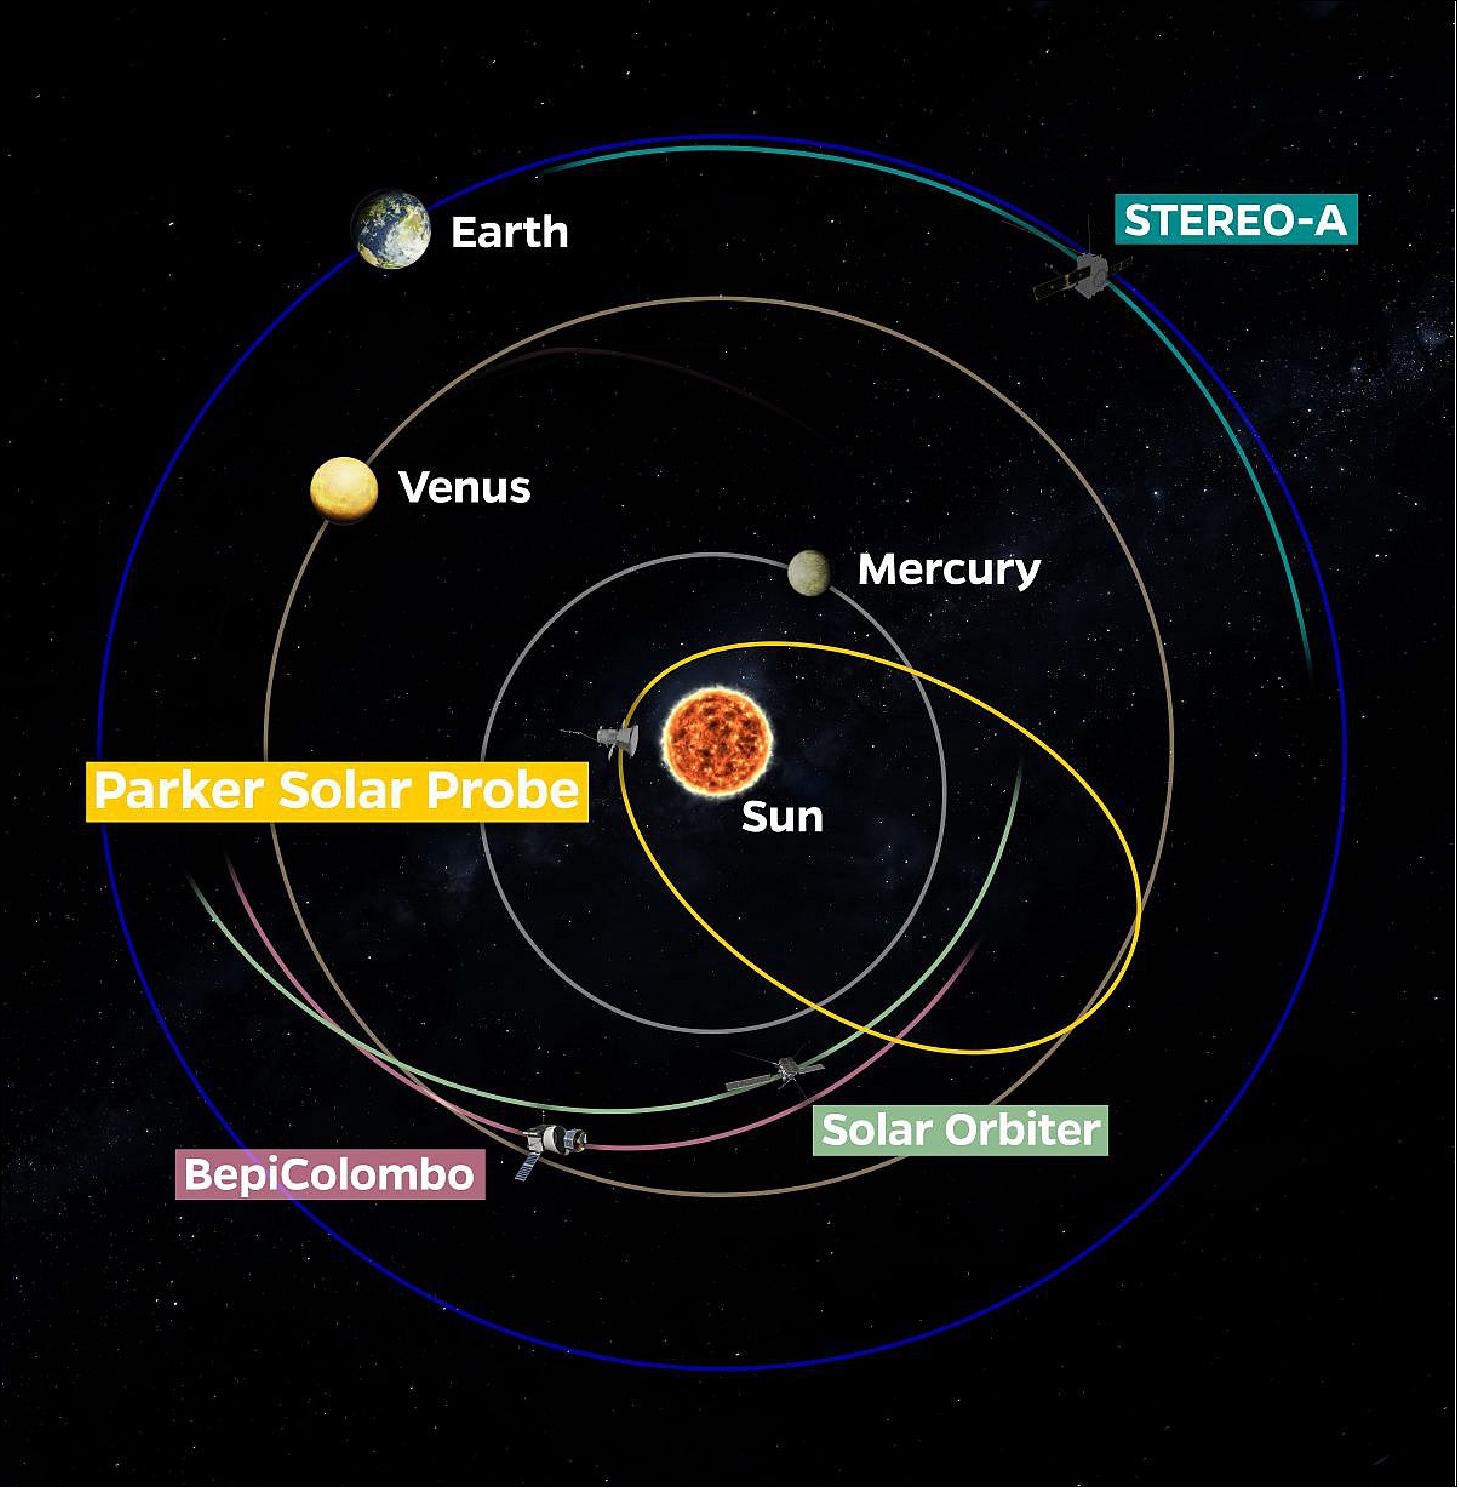
- "Parker Solar Probe has shown us that there is a lot more interconnected activity near the Sun than we once thought," said Parker Solar Probe Project Scientist Nour Raouafi of the Johns Hopkins University Applied Physics Lab, or APL, in Laurel, Maryland. "With this closest approach visible from Earth, we have a fantastic opportunity to put as many eyes as we can on the Sun to help us build a big picture. And we really appreciate the enthusiastic cooperation of so many observatory and mission teams to make that happen."
- Now just over two years into its seven-year mission, the Parker Solar Probe spacecraft will eventually travel within 4 million miles of the Sun's surface. The mission's primary goal is to provide new data on solar activity and the workings of the Sun's outer atmosphere – the corona – which contributes significantly to our ability to forecast major space weather events that impact life on Earth.
- The spacecraft will make three more progressively close passes to the Sun in 2021 alone, as well as two gravity-assist flybys at Venus in February and October to adjust the trajectory of its orbit. After zipping past Venus on Feb. 20, Parker Solar Probe will again make close approaches to the Sun on April 29 and Aug. 9. Following another Venus gravity assist on Oct. 16, the spacecraft will make an even closer solar pass on Nov. 21, with perihelion just 5.3 million miles from the Sun's surface.
- "This is our busiest year since launch, and it only gets busier as our trajectory takes us closer and closer to the Sun," said Parker Solar Probe Project Manager Helene Winters of APL. "This is exactly what the spacecraft was designed for – it's operating just as we expected and is giving us even more data than anticipated. We're ready for a range of discoveries in this unexplored region of the Sun."
• September 25, 2020: Propelled by a midsummer flyby of Venus, NASA's Parker Solar Probe has started yet another record-setting, science-gathering swing around the Sun, its sixth flyby of our star. 55)
- Some instruments on the spacecraft have been turned on since late August, collecting data on the near-Sun environment and the solar wind as it streams from our star. At closest approach (called perihelion) on Sept. 27, Parker Solar Probe will come within about 8.4 million miles (13.5 million km) of the Sun's surface while moving 289,927 miles per hour (466,592 km/hr) — shattering its own records on both counts.
- This also marks the first time Parker Solar Probe will dip to within 0.1 astronomical units of the Sun's center; an "AU" is 93 million miles, the average distance between Earth and the Sun.
- "After our last orbit — during which we started science operations much farther out than this encounter — we're returning our focus to the solar wind closer to the Sun," said Nour Raouafi, Parker Solar Probe project scientist at the Johns Hopkins Applied Physics Laboratory in Laurel, Maryland. "We always wonder if we'll see something new as we get closer and closer. And as the solar cycle rises and the Sun becomes more active, we'll be able to observe that activity from an unprecedented vantage point."
- Two years into its journey, Parker Solar Probe remains healthy and operating normally. As it continues its seven-year mission, the spacecraft will eventually travel within 4 million miles of the Sun's extremely hot surface. The mission's primary goal is to provide new data on solar activity and the workings of the Sun's outer atmosphere — the corona — which contributes significantly to our ability to forecast major space weather events that impact life on Earth.
- This weekend's perihelion was set up by the probe's third Venus flyby. On July 11, the spacecraft came within 518 miles above Venus' surface — much lower than the previous two flybys but still well above Venus' atmosphere — putting it on a path that brings it 3.25 million miles closer to the Sun than the last perihelion, on June 7. Mission Design and Navigation Manager Yanping Guo of APL noted that the gravity assist provided the mission's largest orbital speed reduction since launch, trimming the spacecraft's velocity by 8,438 miles per hour (13,579 km/hour).
• December 9, 2020: Researchers from the Laboratory for Atmospheric and Space Physics (LASP) at the University of Colorado Boulder are diving into the dusty environment that surrounds the sun—a search that could help to reveal how planets like Earth come into being. 56)
- The pursuit comes by way of NASA's Parker Solar Probe—a pioneering mission that has taken scientists closer to Earth's home star than any spacecraft to date. Over two years, the probe has circled the sun six times, hitting maximum speeds of roughly 290,000 miles per hour.
- In the process, the Parker team has learned a lot about the microscopic grains of dust that lie just beyond the sun's atmosphere, said David Malaspina, a space plasma physicist at LASP. In new research, for example, he and his colleagues discovered that the densities of these bits of rock and ice seem to vary wildly over the span of months—not something scientists were expecting.
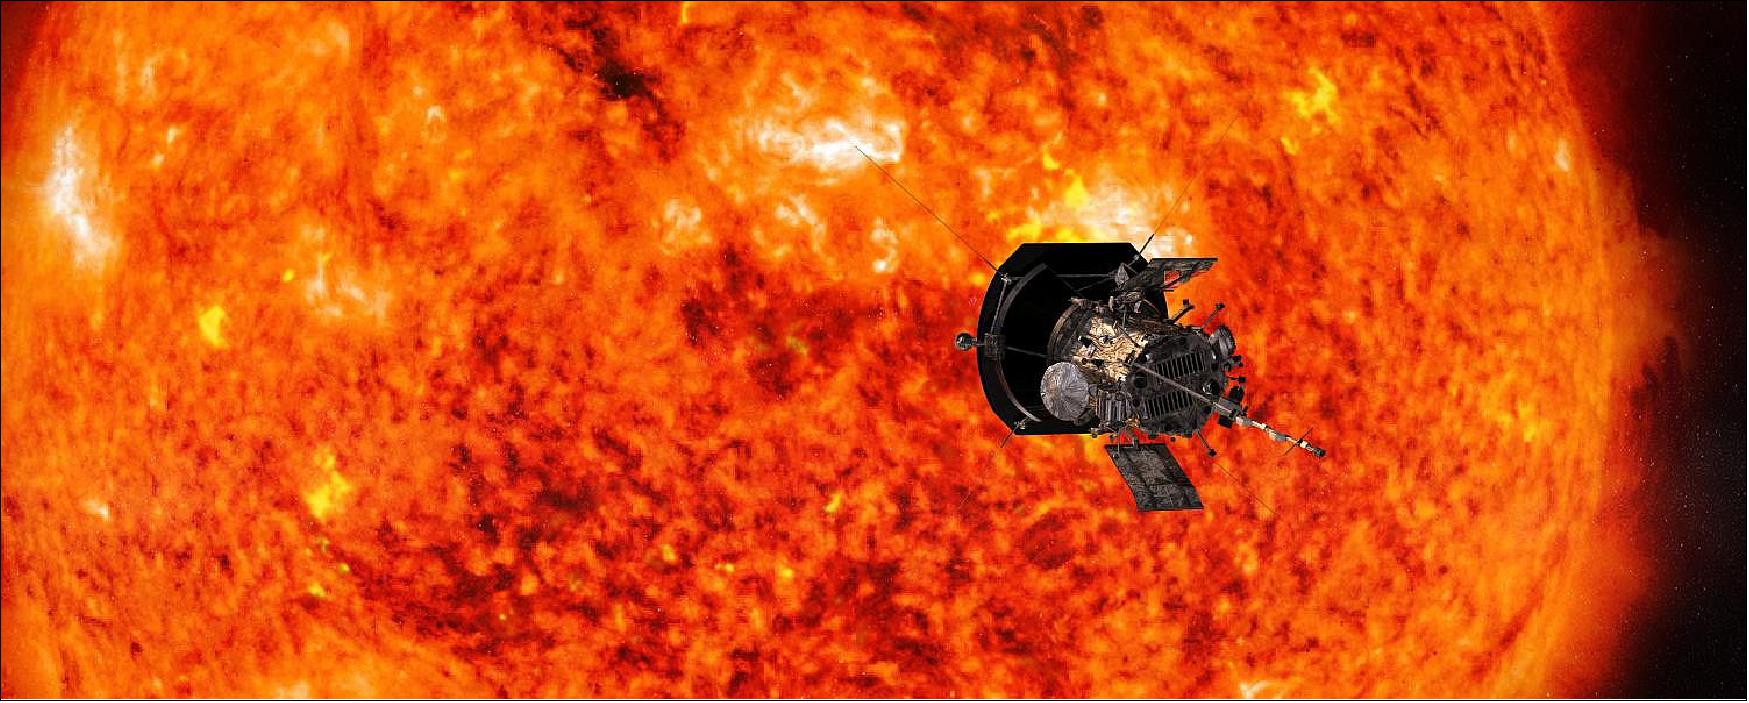
- "Every time we go into a new orbit, and we think we understand what we're seeing around the sun, nature goes and surprises us," said Malaspina, also an assistant professor in the Department of Astrophysical and Planetary Sciences.
- He presented the group's results this week at the 2020 virtual fall meeting of the American Geophysical Union (AGU).
- Malaspina said that dust can give researchers an unexpected, and tiny, window into the processes that formed Earth and its neighboring planets more than 4.5 billion years ago.
- "By learning how our star processes dust, we can extrapolate that to other solar systems to learn more about planet formation and how a cloud of dust becomes a solar system," he said.
Solar Dyson
- The area just around the sun, a hot and radiation-rich environment, is often dustier than you might imagine, Malaspina said. It contains more grains of dust by volume than most other open expanses of space in the solar system. That's because the star, through gravity and other forces, pulls dust toward it from millions to billions of miles away, a bit like a vacuum cleaner.
- But this vacuum cleaner is imperfect. As dust particles get closer to the sun, its radiation pushes on them more and more—some of those grains of dust will begin to blow in the other direction and can even fly out of the solar system entirely. The Wide-Field Imager for Parker Solar Probe (WISPR) instrument suite onboard the spacecraft found the first evidence for the existence of this dust-devoid region, known as the dust-free zone, more than 90 years after it was predicted.
- "What you get is this really interesting environment where all of these particles are moving inward, but once they reach the near-sun environment, they can be blown away," Malaspina said.
- Since launching in 2018, Parker Solar Probe—built and operated by the Johns Hopkins Applied Physics Laboratory, which also leads the mission for NASA—has flown to within about 11.6 million miles of the Sun's surface.
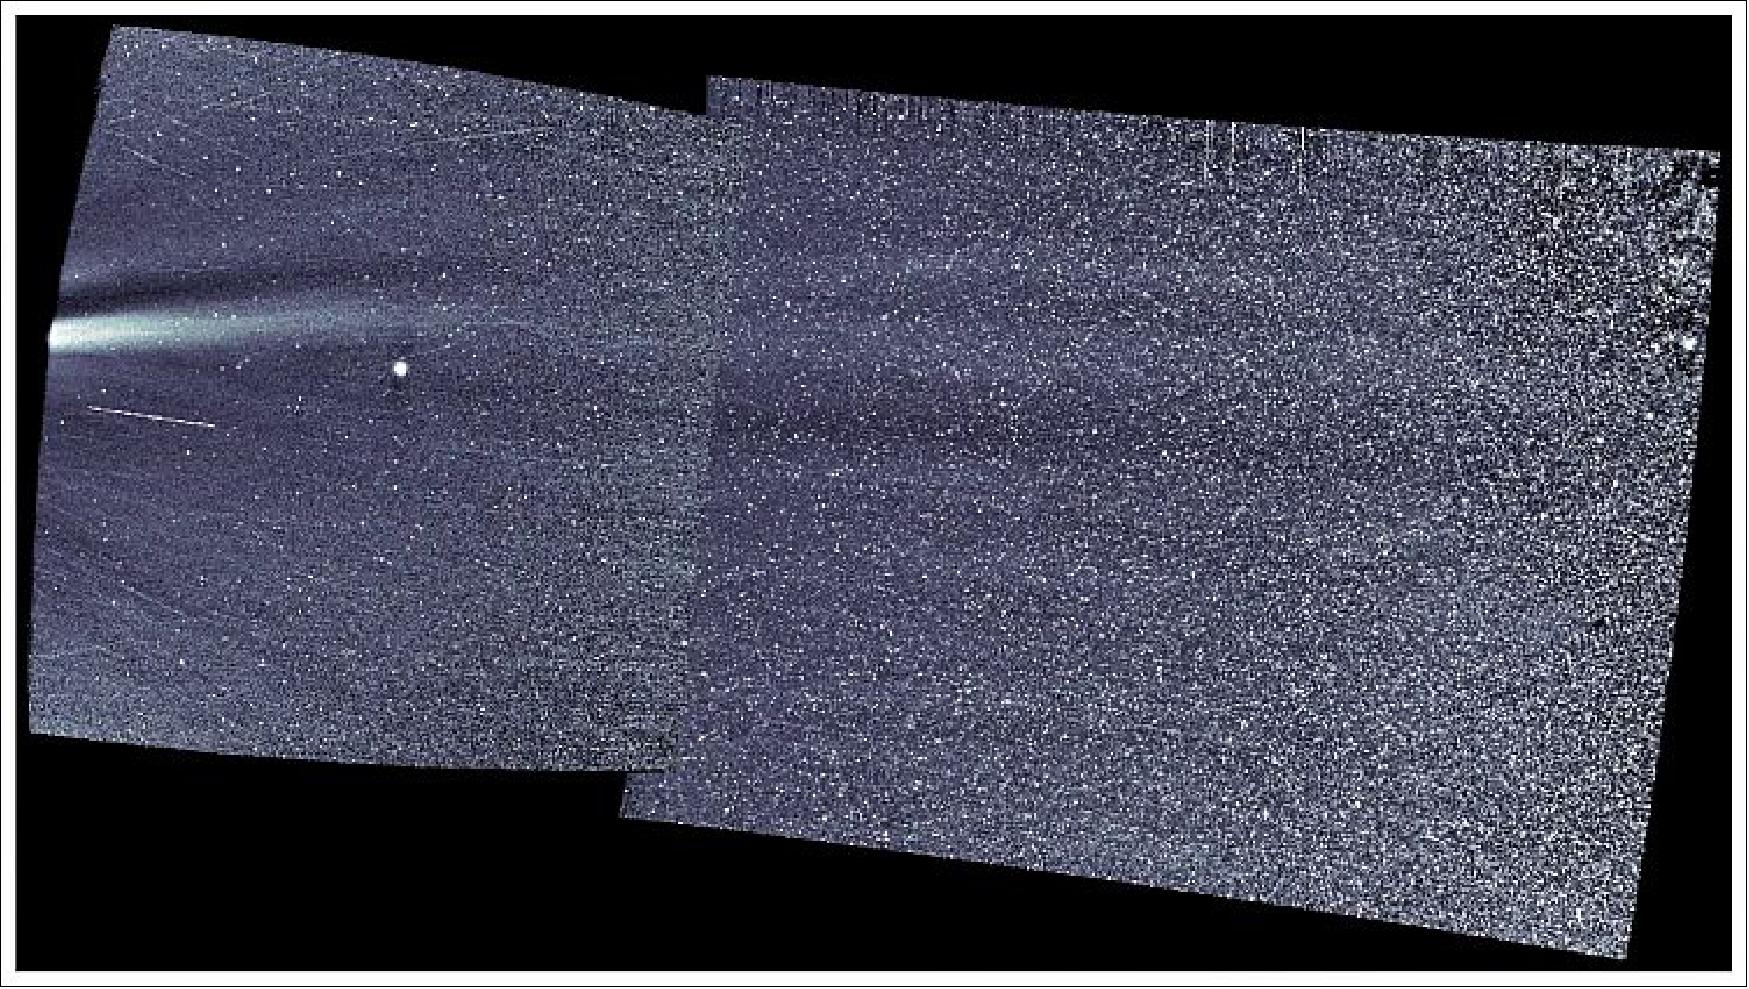
- On each of Parker's orbits around the sun, the spacecraft collided with thousands of grains of dust. Many of these particles vaporize on the spot, creating a small burst of charged particles that the probe can detect using the five antennae that are part of its FIELDS Experiment. LASP plays an important role in this experiment, which is led by the University of California, Berkeley. Think of it like studying insect populations by counting the splatters on your car's windshield.
- "You get a small puff of plasma," Malaspina said. "By looking at these spikes, we can understand how many dust impacts we're getting hit by."
New Mysteries
- Malaspina and his colleagues were originally hoping to use those puffs to pinpoint where exactly the solar system's inward-flying dust becomes outward-flying dust. But they stumbled on something puzzling in the process: The concentrations of dust that the team recorded seemed to vary by as much as 50% between Parker's six orbits around the Sun.
- "That's really interesting because the timescale that it takes for dust to move in toward the Sun is thousands to millions of years," Malaspina said. "So how do we get variation in just three or four months?"
- This dusty environment, in other words, may be a lot more complicated and fast-shifting than scientists previously thought. Malaspina said that the team will need to wait for Parker to complete more orbits to know exactly what's happening. He's just excited to be part of this once-in-a-lifetime chance to run a finger along the Sun's dusty shelves.
- "This is the only in-situ measurement we are going to get for a long time in the inner solar system," Malaspina said. "We're trying to make the best of it and learn as much as we can."
• July 10, 2020: Early on July 11, 2020 (UTC), the spacecraft will perform its first outbound flyby of Venus, passing approximately 516 miles above the surface as it curves around the planet. Such Venus gravity assists play an integral role in the Parker Solar Probe mission. The spacecraft relies on the planet to rid itself of orbital energy, which in turn allows it to travel ever closer to the Sun after each Venus flyby. The mission's previous two Venus flybys swooped past the Sun-facing side of the planet, and this will be Parker Solar Probe's first pass on Venus' night side. 57)
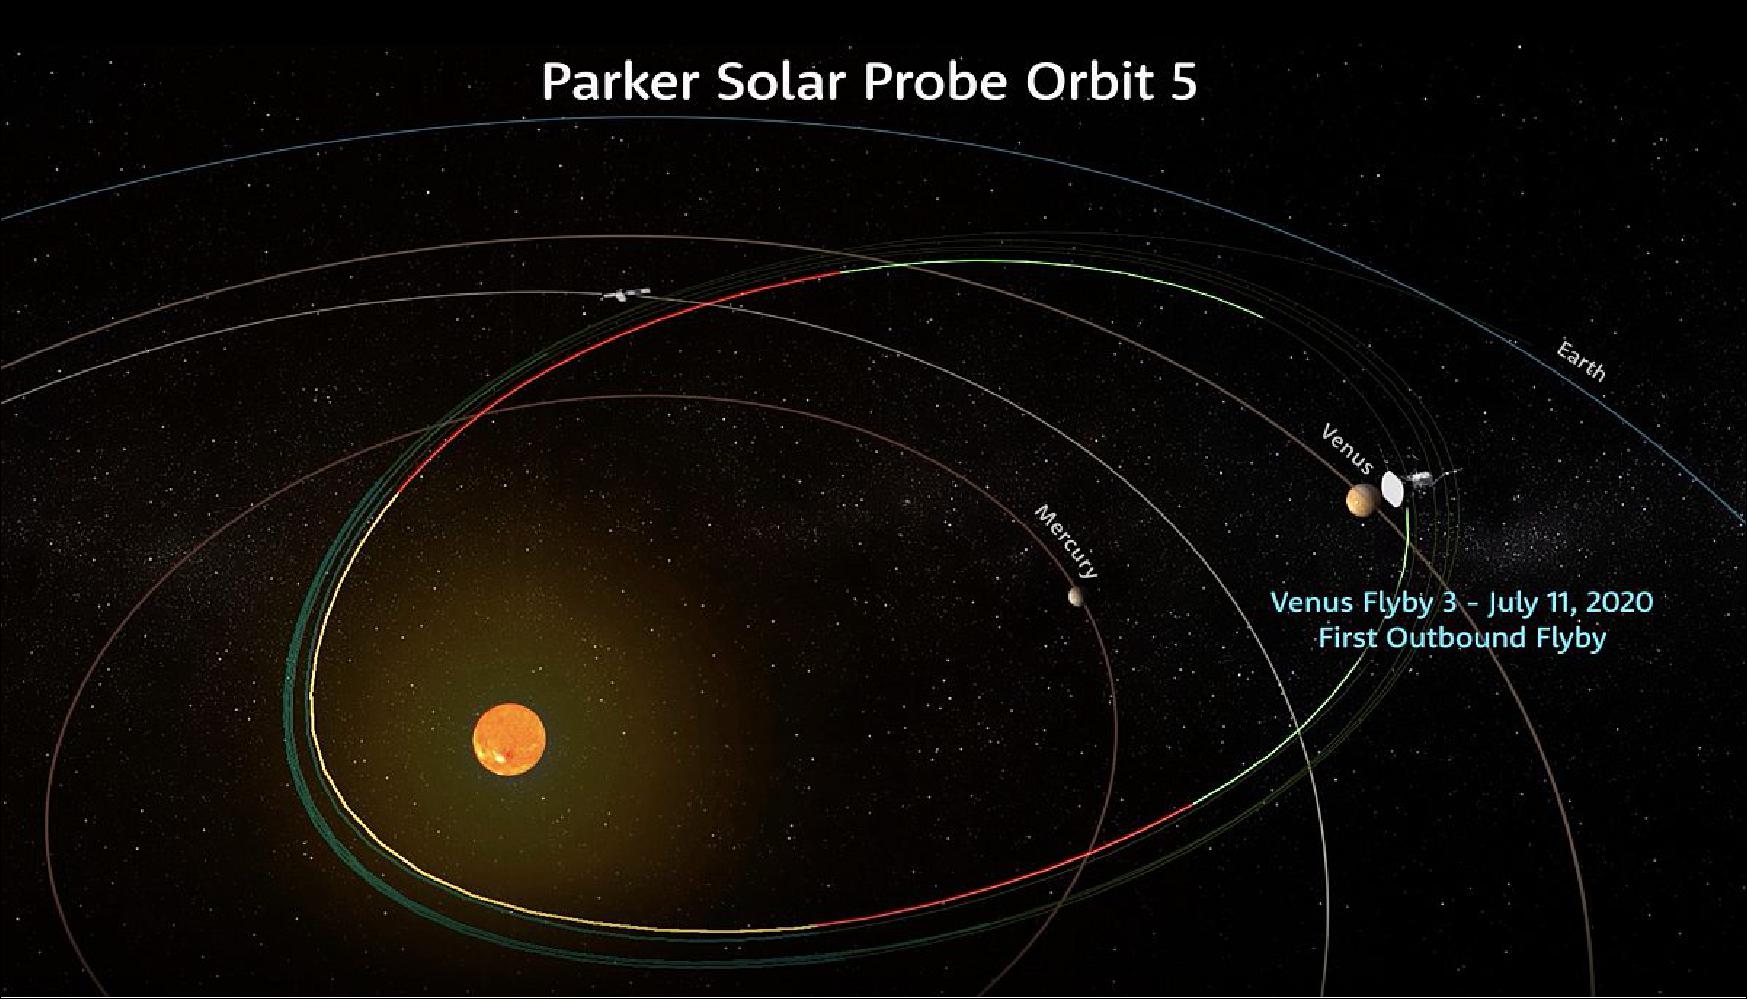
- Parker Solar Probe will witness a brief 11-minute solar eclipse during the maneuver while passing through the shadow of the planet. Utilizing powerful telescopes, the Apache Point Observatory in New Mexico, Lick Observatory in California, and the Keck Observatory in Hawaii will search for Venus aurora from the ground in coordination with Parker Solar Probe's pass around the planet, weather permitting. Scientists will combine these ground-based observations with data collected by Parker Solar Probe during the flyby to take an unprecedented look at the interactions between Venus and the solar wind.
- This Venus flyby sets Parker Solar Probe up for its sixth close pass by the Sun, slated for September 27. During this perihelion, Parker Solar Probe will travel even closer to the Sun, setting a new record when it passes approximately 8.3 million miles from the solar surface, more than 3 million miles closer than the previous perihelion at 11.6 million miles from the solar surface. The spacecraft's seventh perihelion is slated for January 17, 2021.
• June 12, 2020: At the heart of understanding our space environment is the knowledge that conditions throughout space — from the Sun to the atmospheres of planets to the radiation environment in deep space — are connected. Studying this connection – a field of science called heliophysics — is a complex task: Researchers track sudden eruptions of material, radiation, and particles against the background of the ubiquitous outflow of solar material. 58)
- A confluence A confluence of events in early 2020 created a nearly ideal space-based laboratory, combining the alignment of some of humanity's best observatories — including Parker Solar Probe, during its fourth solar flyby — with a quiet period in the Sun's activity, when it's easiest to study those background conditions. These conditions provided a unique opportunity for scientists to study how the Sun influences conditions at points throughout space, with multiple angles of observation and at different distances from the Sun.
- The Sun is an active star whose magnetic field is spread out through the solar system, carried within the Sun's constant outflow of material called the solar wind, which affects spacecraft and shapes the environments of worlds throughout the solar system. We've observed the Sun, space near Earth and other planets, and even the most distant edges of the Sun's sphere of influence for decades. And 2018 marked the launch of a new, game-changing observatory: Parker Solar Probe, with a plan to ultimately fly to about 3.83 million miles from the Sun's visible surface.
- Parker has now had four close encounters of the Sun. (The data from Parker's first encounters with the Sun has already revealed a new picture of its atmosphere.) During its fourth solar encounter, spanning parts of January and February 2020, the spacecraft passed directly between the Sun and Earth. This gave scientists a unique opportunity: The solar wind that Parker Solar Probe measured when it was closest to the Sun would, days later, arrive at Earth, where the wind itself and its effects could be measured by both spacecraft and ground-based observatories. Furthermore, solar observatories on and near Earth would have a clear view of the locations on the Sun that produced the solar wind measured by Parker Solar Probe.
- "We know from Parker data that there are certain structures originating at or near the solar surface. We need to look at the source regions of these structures to fully understand how they form, evolve, and contribute to the plasma dynamics in the solar wind," said Nour Raouafi, project scientist for the Parker Solar Probe mission at the Johns Hopkins Applied Physics Laboratory in Laurel, Maryland. "Ground-based observatories and other space missions provide supporting observations that can help draw the full picture of what Parker is observing."
- This celestial alignment would be of interest to scientists under any circumstances, but it also coincided with another astronomical period of interest to scientists: solar minimum. This is the point during the Sun's regular, approximately 11-year cycles of activity when solar activity is at its lowest level — so sudden eruptions on the Sun such as solar flares, coronal mass ejections and energetic particle events are less likely. And that means that studying the Sun near solar minimum is a boon for scientists who can watch a simpler system and thus untangle which events cause which effects.
- "This period provides perfect conditions to trace the solar wind from the Sun to Earth and the planets," said Giuliana de Toma, a solar scientist at the High Altitude Observatory in Boulder, Colorado, who led coordination among observatories for this observation campaign. "It is a time when we can follow the solar wind more easily, since we don't have disturbances from the Sun."
- For decades, scientists have pulled together observations during these periods of solar minimum, an effort co-led by Sarah Gibson, a solar scientist at the High Altitude Observatory, and other scientists. For each of the past three solar minimum periods, scientists pooled observations from an ever-expanding list of observatories in space and on the ground, hoping the wealth of data on the undisturbed solar wind would unveil new information about how it forms and evolves. For this solar minimum period, scientists began gathering coordinated observations starting in early 2019 under the umbrella Whole Heliosphere and Planetary Interactions, or WHPI for short.
- This particular WHPI campaign comprised a broader-than-ever swath of observations: covering not only the Sun and effects on Earth, but also data gathered at Mars and the nature of space throughout the solar system — all in concert with Parker Solar Probe's fourth and closest-yet flyby of the Sun.
- The WHPI organizers brought together observers from all over the world — and beyond. Combining data from dozens of observatories on Earth and in space gives scientists a chance to paint what might be the most comprehensive picture ever of the solar wind: from images of its birth with solar telescopes, to samples shortly after it leaves the Sun with Parker Solar Probe, to multi-point observations of its changing state throughout space.
- Some samples of the kinds of data captured during this international collaboration of Sun and space observatories.
Parker Solar Probe
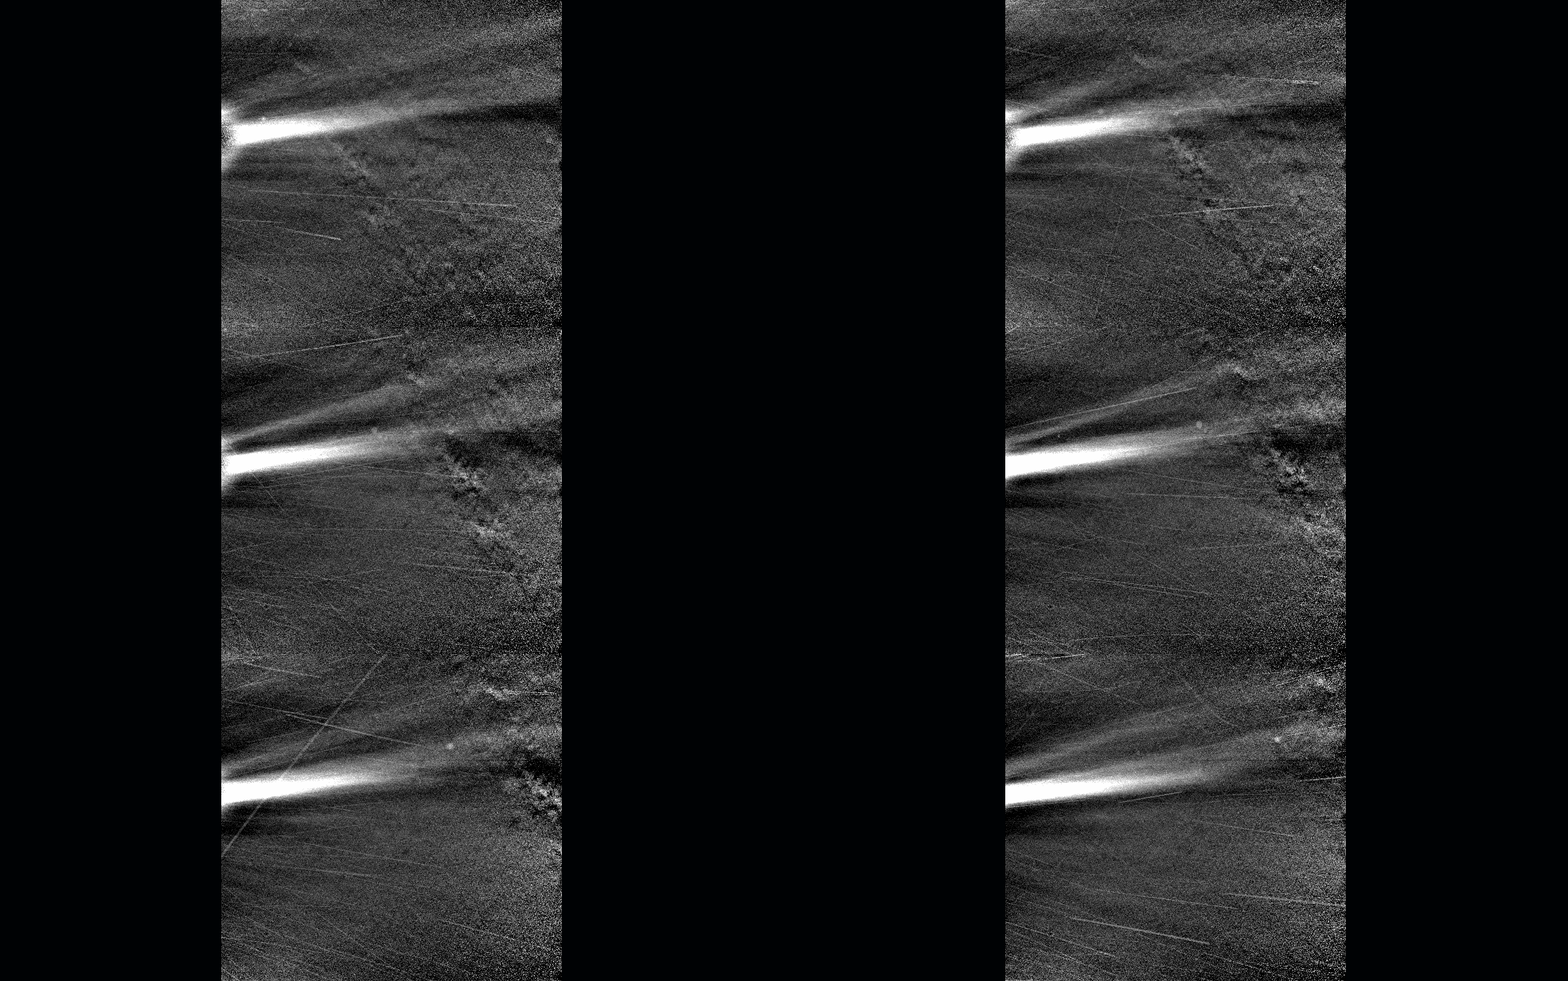
- Early data from Parker Solar Probe's close pass by the Sun during the WHPI campaign shows a solar wind system more dynamic than what's visible in observations near Earth. In particular, scientists hope the full set of data — downlinked to Earth in May 2020 — will reveal dynamic structures, like tiny coronal mass ejections and magnetic flux ropes in their early stages of development, that can't be seen with other observatories watching from farther away. Connecting structures like this, previously too small or too distant to see, with solar wind and near-Earth measurements may help scientists better understand how the solar wind changes throughout its lifetime and how its origins near the Sun affect its behavior throughout the solar system.
Mauna Loa Solar Observatory
- Parker Solar Probe's close-up views of solar wind structures are complemented by solar observatories on Earth and in space, which have a larger field of view to capture solar wind structures.
- Data from the Mauna Loa Solar Observatory in Hawaii shows a jet of material being ejected near the Sun's south pole on Jan. 21, 2020. Coronal jets like this are one solar wind feature that scientists hope to observe more closely with Parker Solar Probe, as the mechanisms that create them could shed more light on the solar wind's birth and acceleration.
- "It would be extremely fortunate if Parker Solar Probe observed this jet, since it would provide information on plasma and the field in and around the jet not long after its formation," said Joan Burkepile, lead scientist for the Coronal Solar Magnetism Observatory K-coronagraph instrument at the Mauna Loa Solar Observatory, which captured these images.
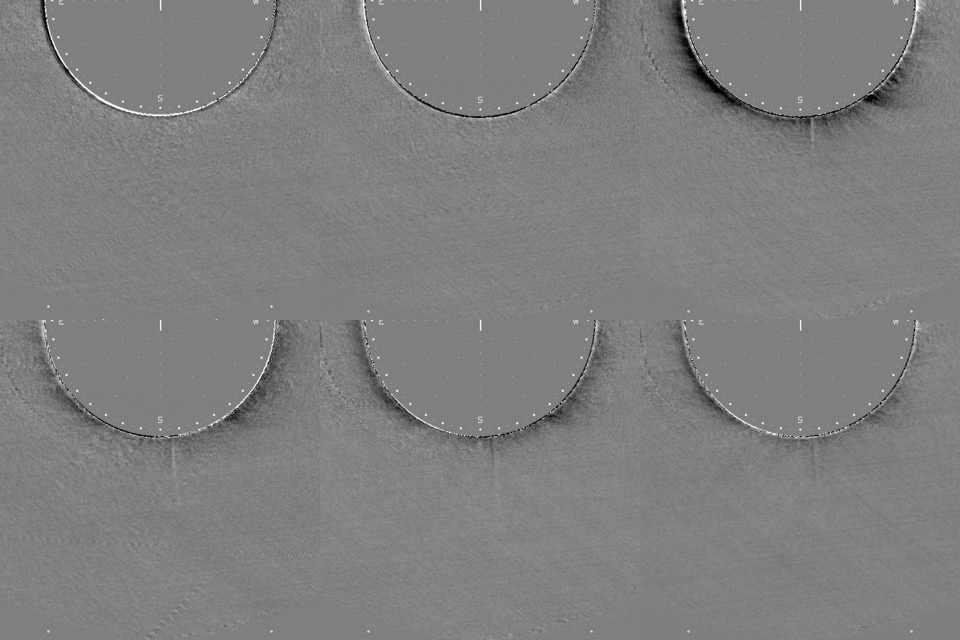
Solar and Terrestrial Relations Observatory
- Along with observations of the solar wind from Parker Solar Probe and near Earth, scientists also have detailed images of the Sun and its atmosphere from spacecraft like NASA's SDO (Solar Dynamics Observatory) and the STEREO (Solar and Terrestrial Relations Observatory). NASA's Solar and Terrestrial Relations Observatory, or STEREO, has a distinct view of the Sun from its vantage point about 78 degrees away from Earth.
- During this WHPI campaign, scientists took advantage of this unique viewing angle. From Jan. 21-23 — when Parker Solar Probe and STEREO were aligned — the STEREO mission team increased the exposure length and frequency of images taken by its coronagraph, revealing fine structures in the solar wind as they speed out from the Sun.
- These difference images are created by subtracting the pixels of a previous image from the current image to highlight changes — here, revealing a small CME that would otherwise be difficult to see.
Solar Dynamics Observatory
- SDO takes high-resolution views of the entire Sun, revealing fine details on the solar surface and the lower solar atmosphere. These images were captured in a wavelength of extreme ultraviolet light at 171 Angstroms, highlighting the quiet parts of the Sun's outer atmosphere, the corona. This data — along with SDO's images in other wavelengths — maps much of the Sun's activity, allowing scientists to connect solar wind measurements from Parker Solar Probe and other spacecraft with their possible origins on the Sun.
Modeling the Data
- Ideally, scientists could use these images to readily pinpoint the region on the Sun that produced a particular stream of solar wind measured by Parker Solar Probe — but identifying the source of any given solar wind stream observed by a spacecraft is not simple. In general, the magnetic field lines that guide the solar wind's movement flow out of the Northern half of the Sun point in the opposite direction than they do in the Southern half. In early 2020, Parker Solar Probe's position was right at the boundary between the two – an area known as the heliospheric current sheet.
- "For this perihelion, Parker Solar Probe was very close to the current sheet, so a little nudge one way or the other would make the magnetic footpoint shift to the south or north pole," said Nick Arge, a solar scientist at NASA's Goddard Space Flight Center in Greenbelt, Maryland. "We were on the tipping point where sometimes it went north, sometimes south."
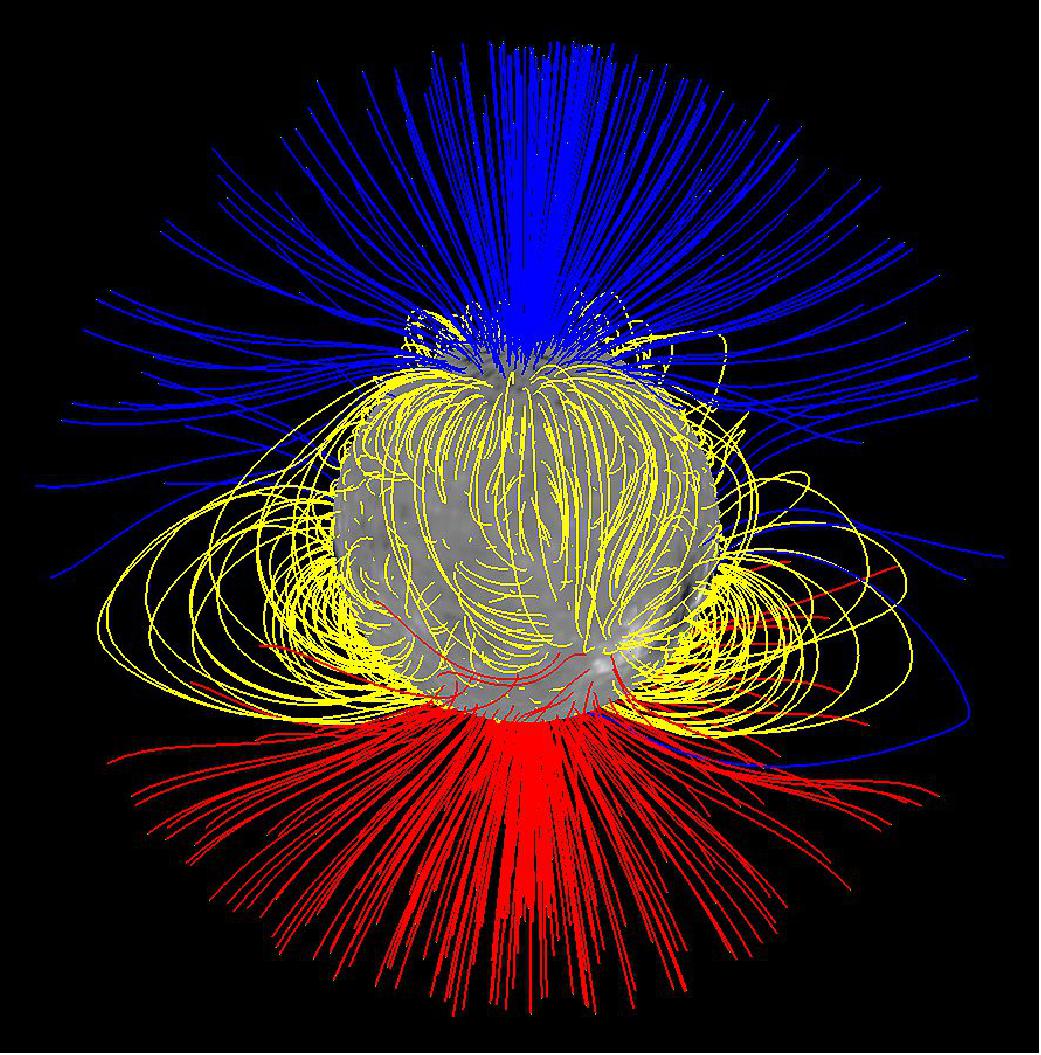
- Predicting which side of the tipping point Parker Solar Probe was on was the responsibility of the modeling teams. Using what we know about the Sun's magnetic field and the clues we can glean from distant images of the Sun, they made day-by-day predictions of where, precisely, on the Sun birthed the solar wind that Parker would fly through on a given day. Several modeling groups made daily attempts to answer just that question.
- Using measurements of the magnetic field at the Sun's surface, each group made a daily prediction for the source region producing the solar wind that Parker Solar Probe was flying through.
- Arge worked with Shaela Jones, a solar scientist at NASA Goddard who did daily forecasting during the WHPI campaign, using a model originally developed by Arge and colleagues Yi-Ming Wang and Neil Sheeley, called the WSA model. According to their forecasts, the predicted source of the solar wind switched between hemispheres suddenly during the observation campaign, because Earth's orbit at the time was also closely aligned with the heliospheric current sheet – that region where the direction of magnetic polarity and the source of the solar wind switches between north and south. They predicted that Parker Solar Probe, flying in a similar plane as Earth, would experience similar switches in solar wind source and magnetic polarity as it flew near the Sun.
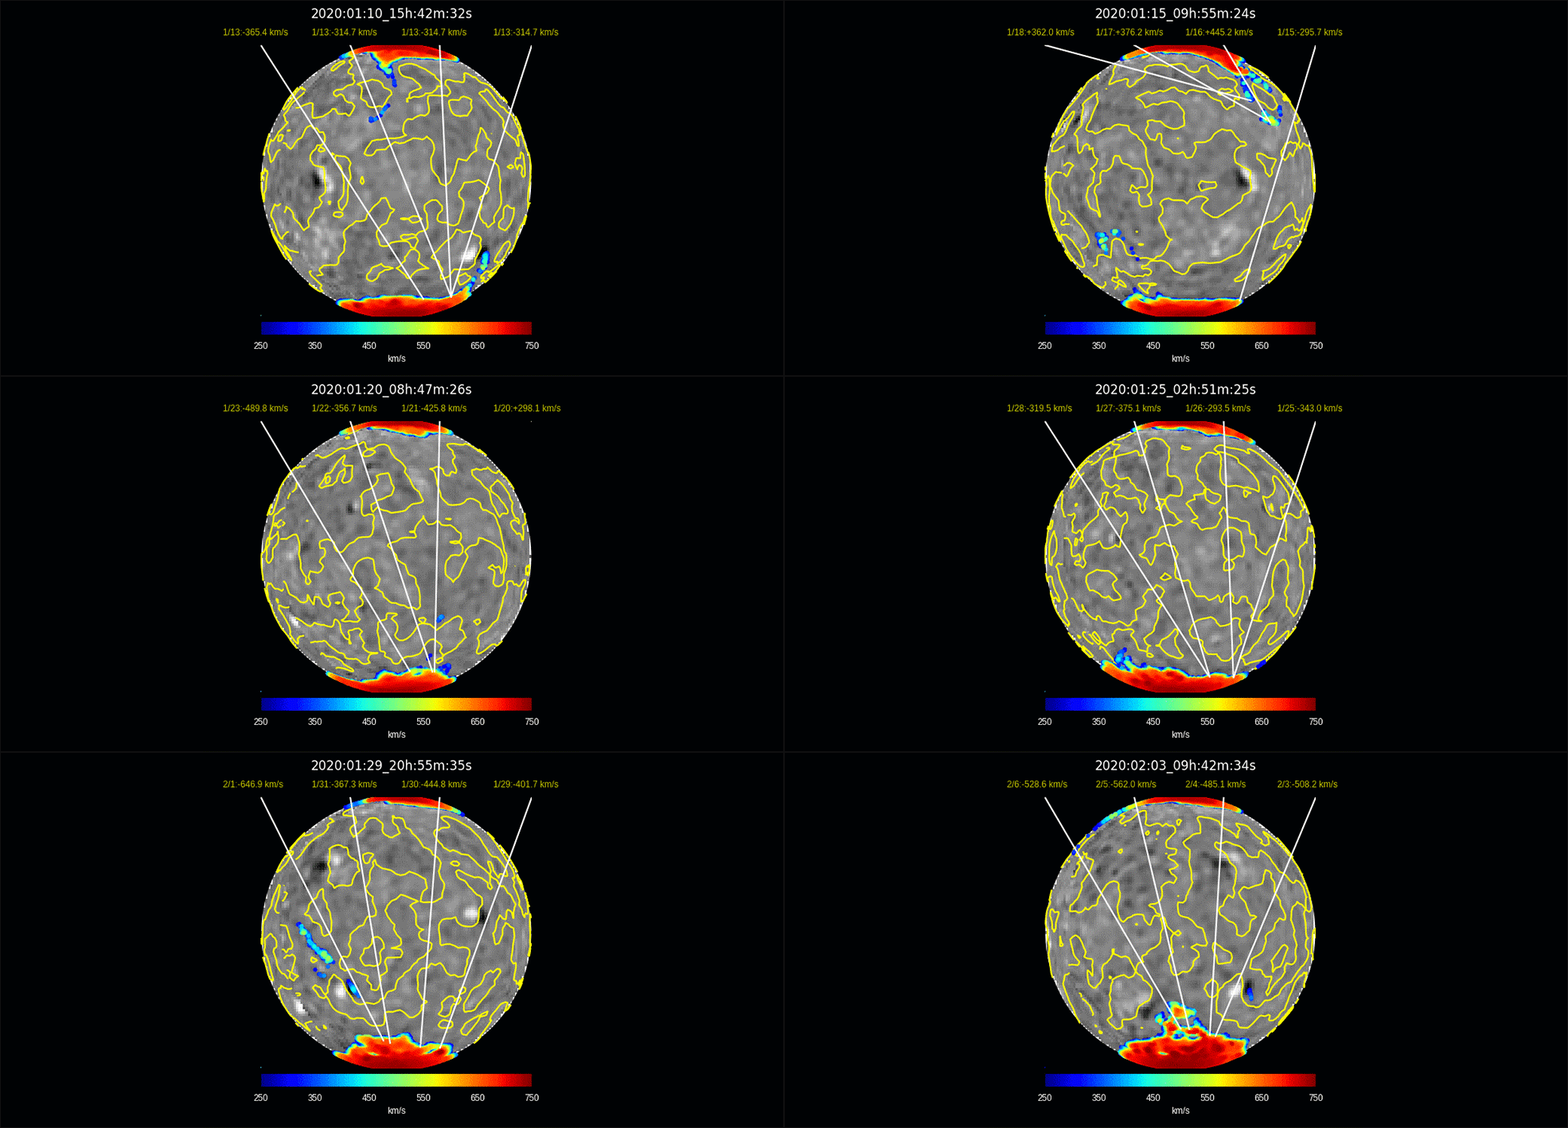
- Solar wind models rely on daily measurements of the Sun's surface magnetic field — the black and white image underlaid. This particular model used measurements from the National Solar Observatory's Global Oscillation Network Group and a model that focuses on predicting how the Sun's surface magnetic field will change over several days. Creating these magnetic surface maps is a complicated and imperfect process unto itself, and some of the modeling groups participating in the WHPI campaign also used magnetic measurements from multiple observatories. This, along with differences in each group's models, created a spread of predictions that sometimes placed the source of Parker Solar Probe's solar wind stream in two different hemispheres of the Sun. But given the inherent uncertainty in modeling the solar wind's source, these different predictions can actually make for more robust operations.
- "If you can observe the Sun in two different places with two telescopes, you have a better chance to get the right spot," said Jones.
Poker Flat Incoherent Scatter Radar
- The solar wind carries with it both an enormous amount of energy and the embedded magnetic field of the Sun. When it reaches Earth, it can ring our planet's natural magnetic field like a bell, making it bend and deform — which produces a measurable change in magnetic field strength at certain points on Earth's surface. We track those changes because magnetic field oscillations can lead to a host of space weather effects that interfere with spacecraft or even, occasionally, utility grids on the ground.
- A host of ground-based magnetometers have tracked these effects since the 1850s, and they're one of the many sets of data scientists are gathering in connection with this campaign. Other ground-based instruments can reveal the invisible effects of space weather in our atmosphere. One such system is the PFISR (Poker Flat Incoherent Scatter Radar) — a radar system based at the Poker Flat Research Range near Fairbanks, Alaska.
- This radar is specially tuned to detect one of most reliable indicators of a disturbance in Earth's magnetic field: electrons in Earth's upper atmosphere. These electrons are created when particles trapped in the magnetosphere are sent zooming into Earth's atmosphere by a complex series of events, a set of circumstances known as a magnetospheric substorm.
- On Jan. 16, PFISR measured the changing electrons in Earth's upper atmosphere during one such substorm. During a substorm, particles cascade into the upper atmosphere, not only creating the shower of electrons measured by the radar, but driving a more visible effect: the aurora. PFISR uses multiple beams of radar oriented in different directions, which allowed scientists to build up a three-dimensional picture of how electrons in the atmosphere changed throughout the substorm.
- Because this substorm took place so early in the observation campaign — only one day after data collection began — it's unlikely that it was caused by conditions on the Sun observed during the campaign. But even so, the connection between magnetospheric substorms and the broader, global-scale effects created by the solar wind — called geomagnetic storms — isn't entirely understood.
- "This substorm didn't happen during a geomagnetic storm time," said Roger Varney, principal investigator for PFISR at SRI International in Menlo Park, California. "The solar wind during this event is fluctuating, but not particularly strongly — it's basically background noise. But solar wind is basically never steady; it's constantly putting some energy into the magnetosphere."
- This deposit of energy into Earth's magnetic system has far-reaching effects: for one, changes in the composition and density of Earth's upper atmosphere can garble communications and navigation signals, an effect often characterized by total electron content. Changes in density can also affect the orbits of satellites to great degree, introducing uncertainty about precise position.
MAVEN
- Earth isn't the only planet where the solar wind has measurable effects — and studying other worlds in our solar system can help scientists understand some of the solar wind's effects on Earth and how it influenced the evolution of Earth and other worlds throughout the solar system's history.
- At Mars, the solar wind coupled with Mars' lack of a global magnetic field may be a major factor in the dry, barren world the Red Planet is today. Though Mars was once much like Earth — warm, with liquid water and a thick atmosphere — the planet has changed drastically over the course of its four-billion-year history, with most of its atmosphere being stripped away to space. With similar processes observed here on Earth, scientists leverage understanding of solar-planetary interactions at Mars to determine how processes leading to atmospheric escape has the ability to change whether a planet is habitable or not. Today, the MAVEN (Mars Atmosphere and Volatile Evolution mission) studies these processes at Mars. MAVEN observations at Mars are available for this latest WHPI campaign.
- Over the coming months, heliophysicists around the world will begin to study data from these observatories in depth, hoping to draw connections that reveal new knowledge about the Sun and its changes that influence Earth and space across the solar system.
- Parker Solar Probe is part of the NASA Heliophysics Living with a Star program to explore aspects of the Sun-Earth system that directly affect life and society. The Living with a Star program is managed by the agency's Goddard Space Flight Center in Greenbelt, Maryland, for NASA's Science Mission Directorate in Washington. The Johns Hopkins Applied Physics Laboratory in Laurel, Maryland, designed, built and operates the spacecraft and manages the mission for NASA.
- The research discussed in this story includes work supported by the Poker Flat Incoherent Scatter Radar which is a major facility funded by the National Science Foundation through cooperative agreement AGS-1840962 to SRI International and work at the National Center for Atmospheric Research funded by the National Science Foundation through cooperative agreement AGS-1852977. Support for the WHPI Campaigns is provided through the NASA's Heliophysics System Observatory Connect (HSO Connect) program.
• January 14, 2020: There's a wind that emanates from the Sun, and it blows not like a soft whistle but like a hurricane's scream. Made of electrons, protons and heavier ions, the solar wind courses through the solar system at roughly 1 million mph (1.6 million km/h), barreling over everything in its path. 59)
- Yet through the wind's roar, NASA's Parker Solar Probe hears the small chirps, squeaks and rustles that hint at the origin of this mysterious and ever-present wind. And now the Parker Solar Probe team is getting their first chance to hear them, too.
- "We are looking at the young solar wind, being born around the Sun," said mission Project Scientist Nour Raouafi, from the Johns Hopkins Applied Physics Laboratory (APL), in Laurel, Maryland. "And it's completely different from what we see here near Earth."
- Scientists have studied the solar wind for more than 60 years, but they're still puzzled over some of its behaviors. While they know it comes from the Sun's million-degree upper atmosphere called the corona, the solar wind, for example, doesn't slow down as it leaves the Sun — it speeds up, and it has a sort of internal heater that keeps it from cooling as it zips through space. With growing concern about the solar wind's ability to interfere with GPS satellites and disrupt power grids on the ground, it's become imperative to better understand it.
- Just 17 months since launch, and after three orbits around the Sun, Parker Solar Probe — designed, built and now operated by Johns Hopkins APL for NASA — has not disappointed.
- "We expected to make big discoveries because we're going into uncharted territory," Raouafi said. "What we're actually seeing is beyond anything anybody imagined."
- Researchers suspected that plasma waves within the solar wind could be responsible for some of the wind's odd characteristics. Just as fluctuations in air pressure cause winds that force rolling waves on the ocean, fluctuations in electric and magnetic fields can cause waves that roll through the clouds of electrons, protons and other charged particles that make up the plasma racing away from the Sun. Particles can ride these plasma waves much like the way a surfer rides an ocean wave, propelling them to higher speeds.
- "Plasma waves certainly play a part in heating and accelerating the particles," Raouafi said. Scientists just don't know how much of a part.
- That's where Parker Solar Probe comes in. The spacecraft's FIELDS instrument can eavesdrop on the electric and magnetic fluctuations caused by plasma waves. And it can "hear" when the waves and particles interact with one another, recording frequency and amplitude information about these plasma waves that scientists could then play as sound waves. And it results in some striking sounds.
- Take, for example, whistler-mode waves. These are caused by energetic electrons bursting out of the Sun's corona. These electrons follow magnetic field lines that stretch from the Sun out to the solar system's farthest edge, spinning around them like they're riding a carousel. When a plasma wave's frequency matches how frequently those electrons are spinning, they amplify one another. And it sounds like a scene out of "Star Wars."
- "Some theories suggest that part of the solar wind's acceleration is due to these escaping electrons," said David Malaspina, a member of the FIELDS team and an assistant professor at the University of Colorado, Boulder, and the Laboratory for Atmospheric and Space Physics. They could also be a critical clue to understanding one process that heats the solar wind.
- "We can use observations of these waves to work our way backward and probe the source of these electrons in the corona," Malaspina said.
- Another example are dispersive waves. These plasma waves quickly shift from one frequency to another as they move through the solar wind. These shifts create a sort of "chirp" that sounds like wind rushing over a microphone.
- "These waves haven't been detected in the solar wind before, at least not in any large numbers," Malaspina explained. They're rare near the Earth, so researchers thought they were unimportant. But closer to the Sun, these waves are everywhere. - "Nobody knows what causes these chirping waves or what they do to heat and accelerate the solar wind. That's what we're going to be determining," Malaspina said. "I think it's incredibly exciting."
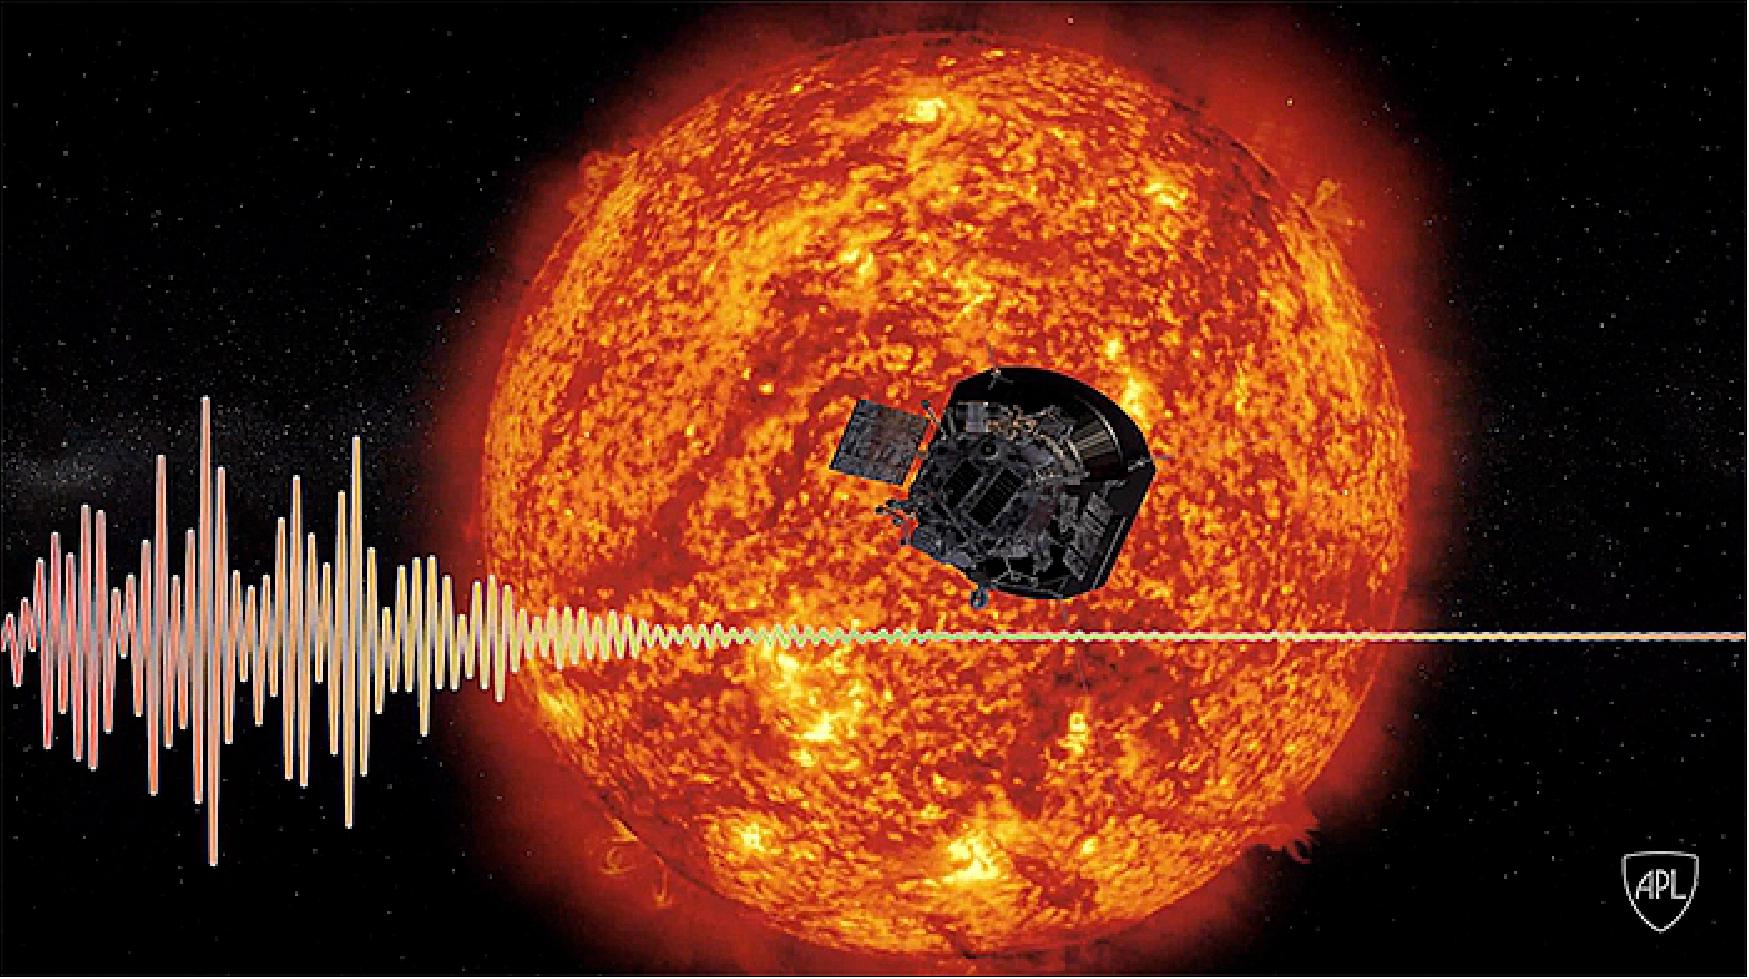
- Raouafi commented that seeing all of this wave activity very close to the Sun is why this mission is so critical. "We are seeing new, early behaviors of solar plasma we couldn't observe here at Earth, and we're seeing that the energy carried by the waves is being dissipated somewhere along the way, to heat and accelerate the plasma."
- But it wasn't just plasma waves that Parker Solar Probe heard. While barreling through a cloud of microscopic dust, the spacecraft's instruments also captured a sound resembling old TV static. That static-like sound is actually hundreds of microscopic impacts happening every day as dust from asteroids torn apart by the Sun's gravity and solar heating and particles stripped from comets as they graze the star strike the spacecraft at speeds close to a quarter of a million miles per hour.
- As Parker Solar Probe cruised through this dust cloud, the spacecraft didn't just crash into these particles — it obliterated them. Each grain's atoms burst apart into electrons, protons and other ions in a mini puff of plasma that the FIELDS instrument can "hear."
- Each collision, however, also chips away a tiny bit of the spacecraft. "It was well understood that this would happen," Malaspina explained. "What was not understood was how much dust was going to be there." APL engineers used models and remote observations to estimate how bad the situation might be well before the spacecraft launched. But in this uncharted territory, the number was bound to have some margin of error.
- James Kinnison, the Parker Solar Probe mission system engineer at APL, said this discrepancy in dust density is just one more reason why Parker being close to the Sun is so useful. "We protected almost everything from the dust," Kinnison said. And although the dust is denser than expected, nothing right now points to dust impacts being a concern for the mission, he added.
- Parker Solar Probe is scheduled to make another 21 orbits around the Sun, using five Venus flybys to draw itself increasingly closer. That will allow researchers to even better understand how these waves change their behavior closer to the Sun and allow scientists to build a more complete evolutionary picture of the solar wind.
Sensor Complement (SWEAP, WISPR, ISIS-EPI, FIELDS)
The experiments selected for Solar Probe Plus are specifically designed to solve two key questions of solar physics:
1) Why is the Sun's outer atmosphere so much hotter than the Sun's visible surface?
2) What propels the solar wind that affects Earth and our solar system?
The answers to these questions can be obtained only through in-situ measurements down in the corona. The solar physics community has been struggling with these questions for decades. There is hope that this mission should finally provide those answers.
In 2010 the Heliophysics Division of the Science Mission Directorate at NASA conducted a competitive “Announcement of Opportunity” procurement and in September of that year selected five science investigation teams to provide instruments and scientific study for the Solar Probe Plus Mission. These teams are: 60) 61)
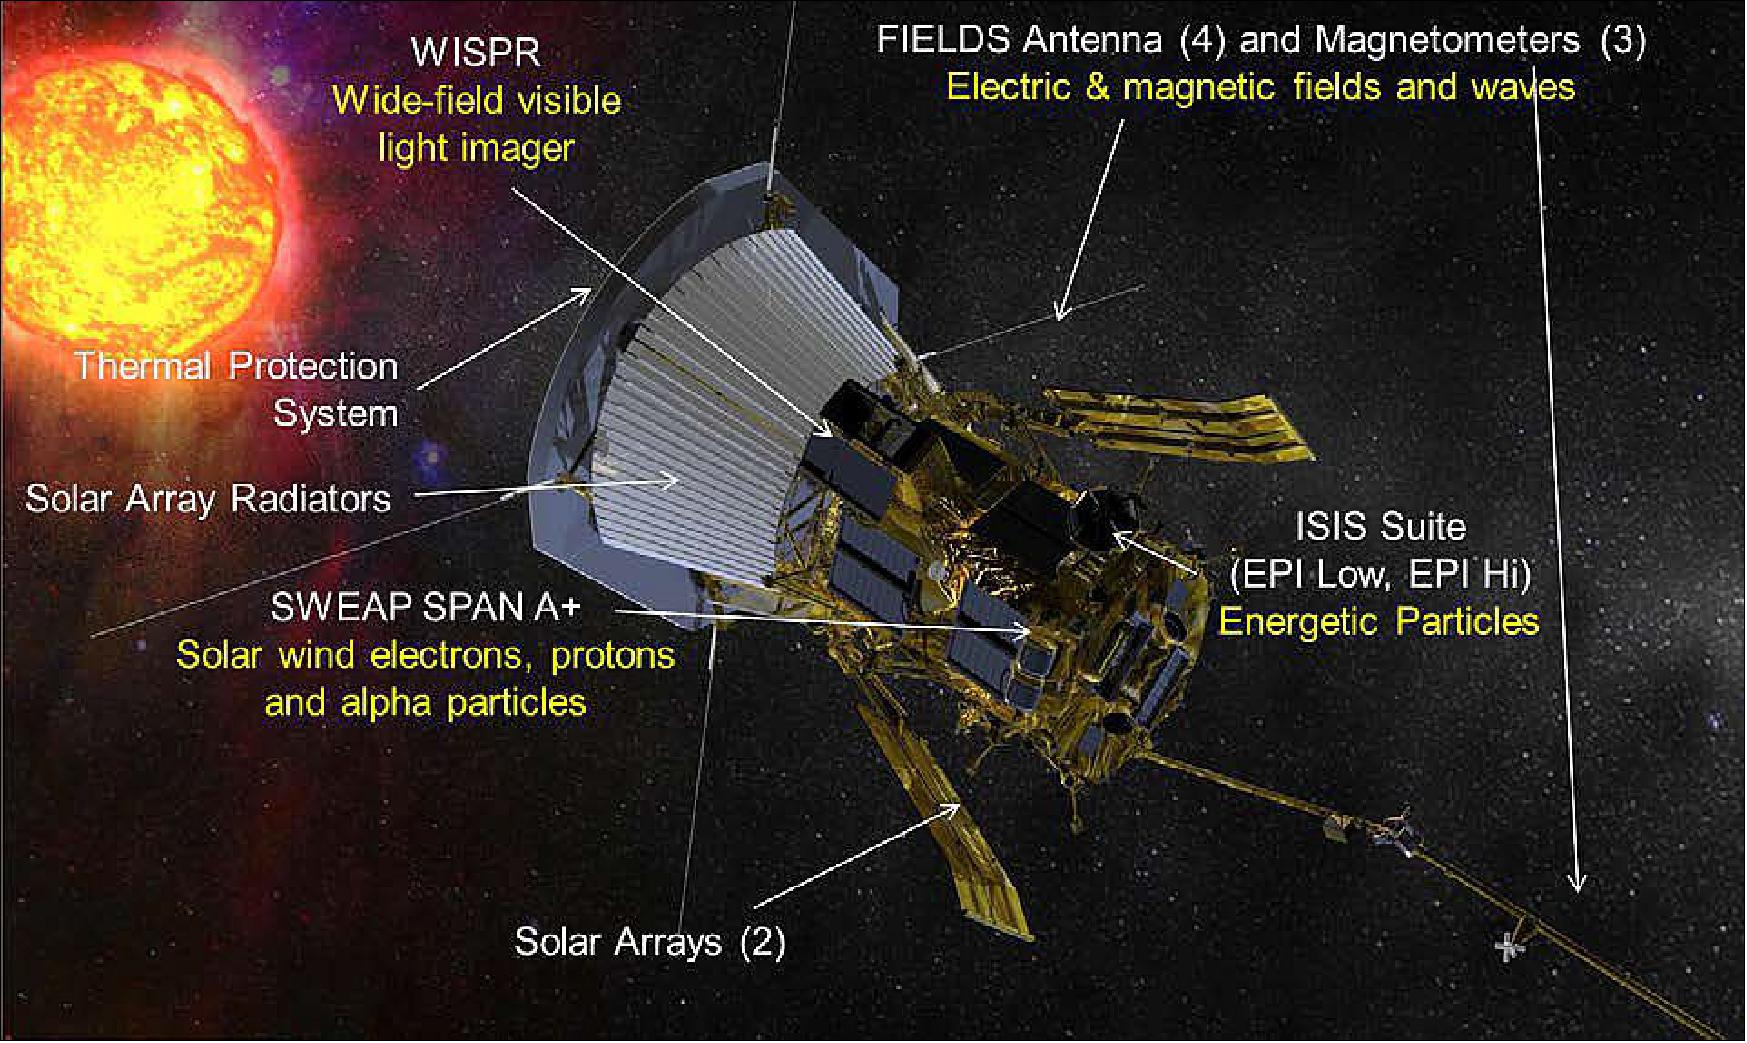
SWEAP (Solar Wind Electrons Alphas and Protons)
The SWEAP instrument is being developed at the Smithsonian Astrophysical Observatory (SAO) in Cambridge, MA, USA, PI: Justin Kasper. The instruments that make up the SWEAP investigation, are the SPC (Solar Probe Cup), and the SPAN (Solar Probe Analyzers). SPC is a Faraday Cup that looks around the spacecraft heat shield directly at the Sun and makes rapid measurements of the bulk properties of the solar wind. SPAN is a set of three ESAs (Electrostatic Analyzers) behind the spacecraft heat shield that make detailed measurements of the three dimensional velocity distribution functions of ions and electrons. 62) 63)
SPAN is divided into two modules on either side of the spacecraft bus. SPAN-A is on the ram side of the spacecraft and has an ion and electron ESA. SPAN-B is on the anti-ram side of the spacecraft and has an ESA. SPAN-A, SPAN-B and SPC measurements include:
• Electron pitch angle distributions, moments, ion moments
• Full 3D electron velocity distribution functions
• Full 3D ion velocity distribution functions
• Proton bulk properties
• Ion 2D VDFS
• Ion/Electron total flux and flow angles at high cadence.
The advantages of the SWEAP suite include the following:
• By including SPC, the suite is able to observe the solar wind flow throughout each encounter. This significantly increases the probability of observing significant events within the inner heliosphere such as interplanetary shocks and coronal mass ejections.
• SPC is also able to make burst measurements of the flow angles of the solar wind faster than 100Hz, enabling measurements of ion fluctuations above the cyclotron frequency
• The electron fields of view of SPAN-A and SPAN-B cover most of the sky, allowing SWEAP to detect energetic beams of electrons flowing along the local magnetic field, regardless of its orientation. This allows us to identify times when both ends of the magnetic field line passing through the spacecraft are connected to the solar surface.
• An onboard interface between SWEAP and FIELDS permits generation of 2D VDFs, triggered bursts, and wave-particle correlation functions.
SWEAP Overview
The overall organizational structure of the SWEAP Investigation at the time of the PDR (Preliminary Design Review). The investigation is managed by SAO (Smithsonian Astrophysical Observatory). In addition to the management of the suite, SAO is also responsible for the SWEAP Science Operations Center (SOC) and the Solar Probe Cup (SPC). The UCB/SSL (University of California, Berkeley /Space Sciences Laboratory) is responsible for the SPAN (Solar Probe Analyzers) and SWEM (SWEAP Electronics Module), which controls the instruments, distributes power, formats SWEAP data products, and serves as the single interface to the spacecraft. Additional science team members are from institutions in the United States and France including the University of Michigan, NASA Marshall Space Flight Center, NASA Goddard Space Flight Center, University of Alabama Huntsville, Los Alamos National Laboratory, Massachusetts Institute of Technology, and the University of New Hampshire.
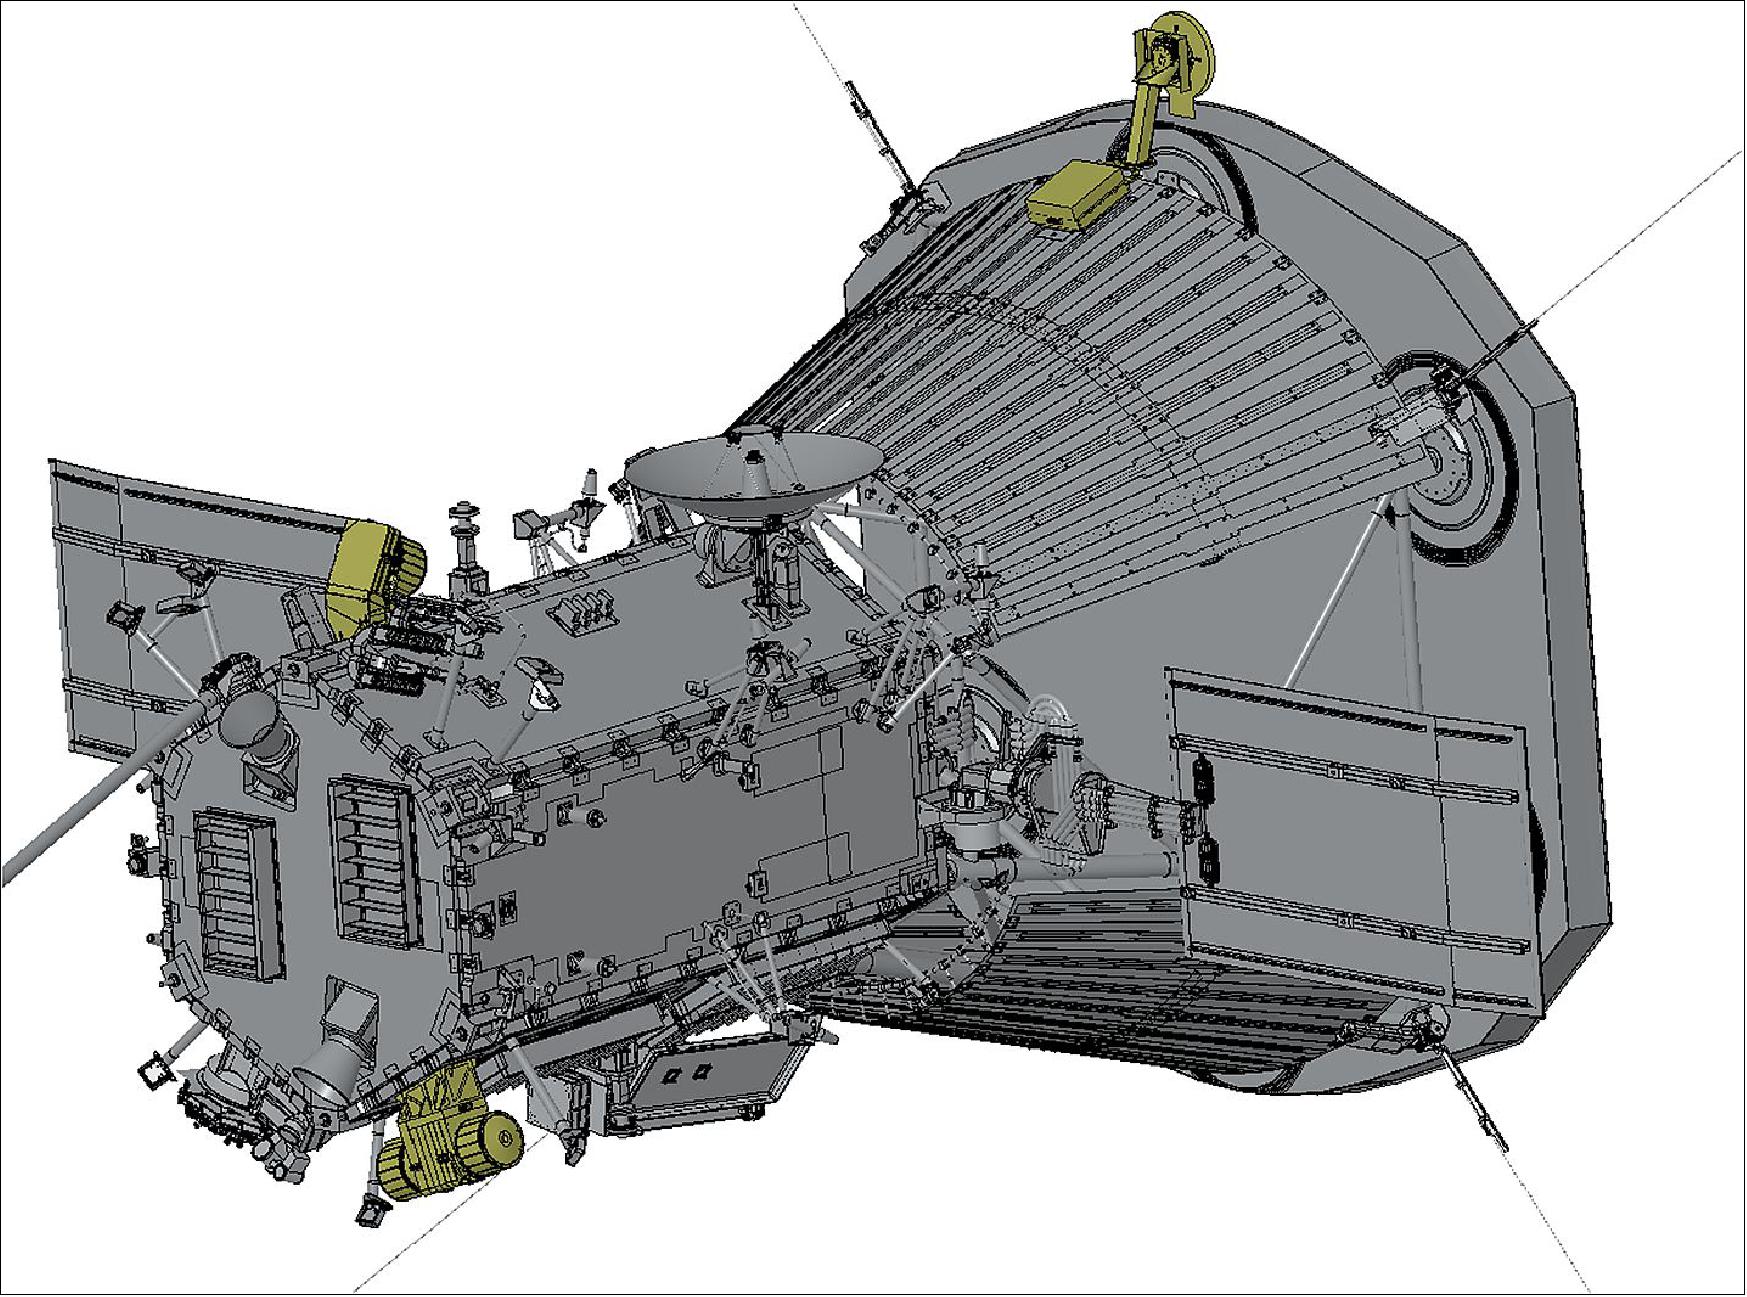
Figure 69 illustrates the current mechanical design of the Solar Probe Plus spacecraft, along with the placement and orientations of the SPC, SPAN-A, and SPAN-B instruments, which are highlighted. In this image the spacecraft is oriented with the heat shield on the right and the spacecraft bus on the left, the ram-facing side of the spacecraft is pointing down and the anti-ram side of the spacecraft is pointing up. SPC can be seen on the edge of the heat shield with a small suite-provided strut that allows the sensor of the instrument to face the Sun while the high voltage and signal detection electronics sit in the shadow in the small box at the end of the strut. SPAN-A with its two electrostatic analyzers (electrons and ions) is visible on the lower left side of the image on the ram facing side of the spacecraft. SPAN-B, with its electron electrostatic analyzer, is visible on the upper left side of the image. Not seen in this image is the SWEAP Electronics Module (SWEM), which is embedded within the spacecraft bus.
From these locations the instruments are able to detect electrons over almost the entire sky, and ions from within thirty degrees of the Sun and from the ram direction. The SPC strut is designed to place the instrument sufficiently close to the front of the spacecraft heat shield that there are no obstructions to its field of view, which is a 60º full-width cone in the sunward direction. The SPAN electron fields of view and planned angular pixels are shown in a two dimensional projection of the sky in Figure 70. This presents the SPAN-A field of view and pixels as the blue contours, the SPAN-B field of view as the yellow contours, and the outline of the spacecraft, as seen from SPAN-A, as the white trace. See how SPAN-B observes electrons over the region of sky blocked by the spacecraft for SPAN-A. Higher angular resolution in the SPAN pixels is determined by the size of anode detectors within the instruments. Regions of higher angular resolution are oriented to provide the best chance of resolving the electron heat flux when the solar wind magnetic field is in the standard Parker spiral configuration in the ecliptic plane. The fields of view of the SPAN instruments are unobstructed except for minor features including the FIELDS antennas, the FIELDS magnetometer boom, and the solar panels. Note that as the spacecraft approaches the Sun the solar panels move closer to the spacecraft and further from the SPAN fields of view. Adaptive masks will be used to discard pixels too close to the solar panels from processing of electron observations for science products.
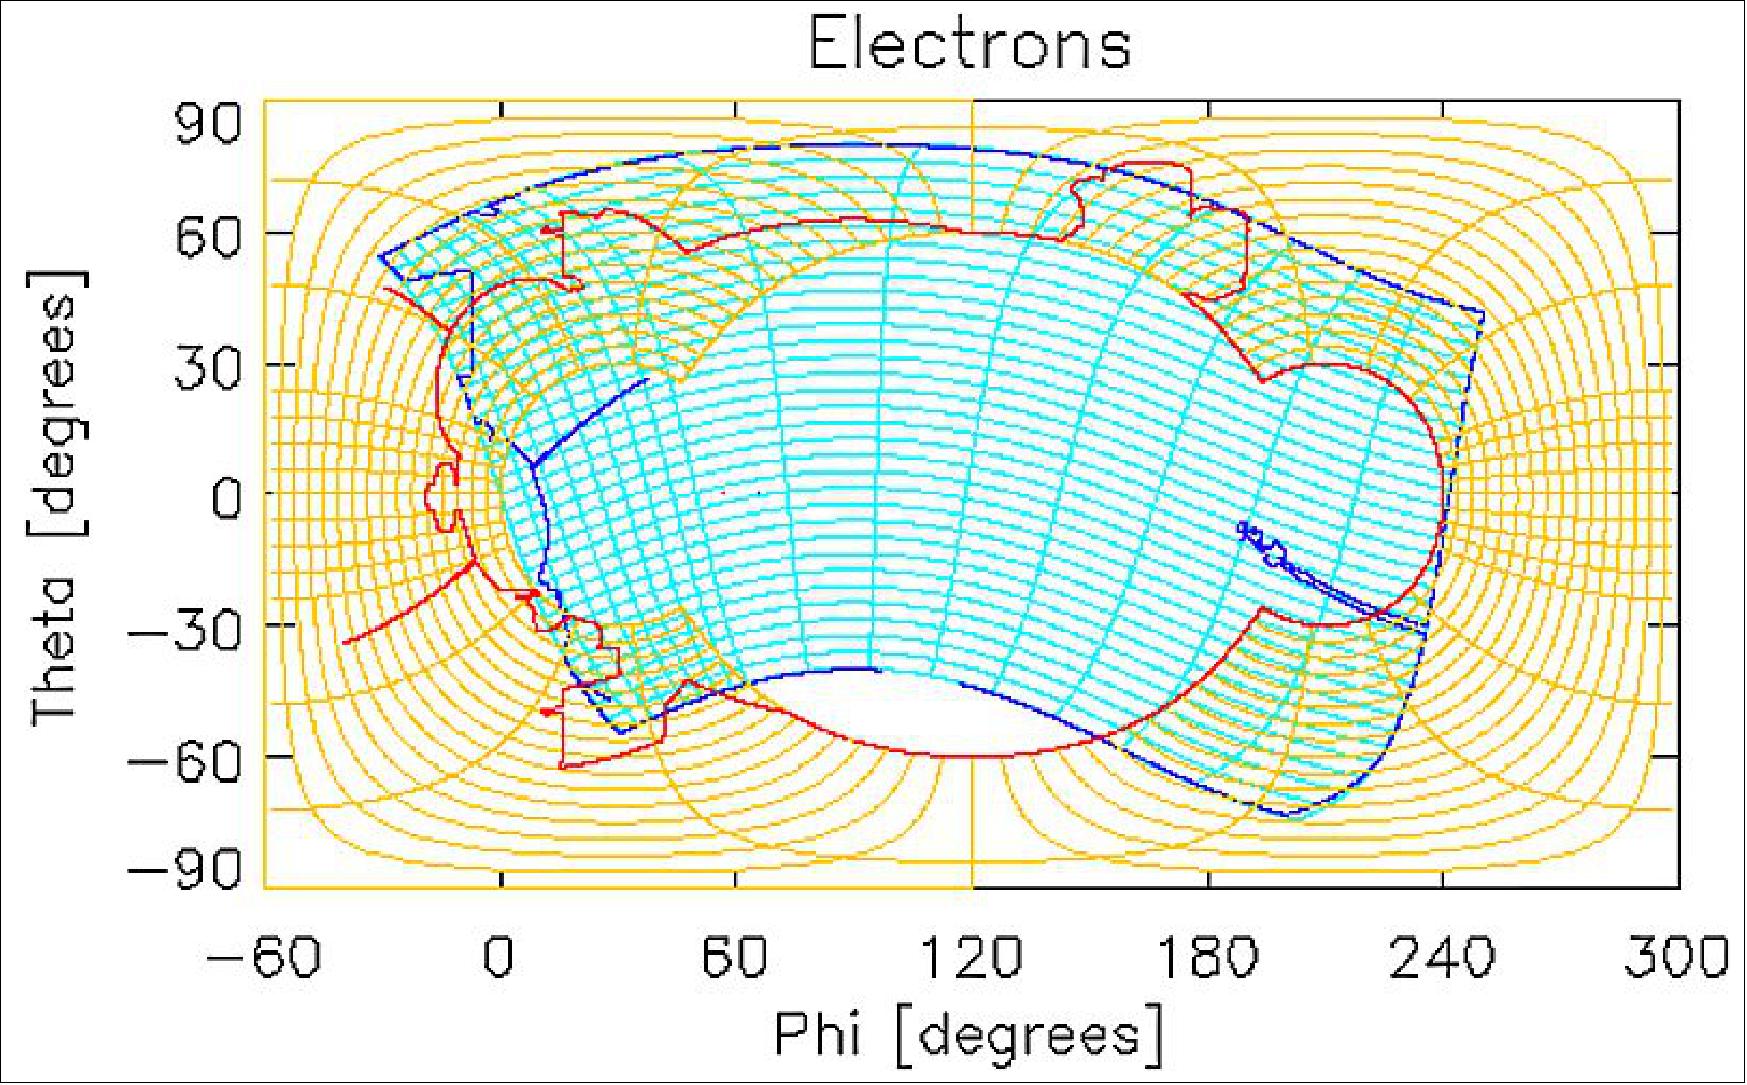
Suite Electrical Interface and SWEM: The SWEM (SWEAP Electronics Module) is the data and power interface between the SPC and SPAN instruments and the spacecraft. It provides intermediate data processing (moment calculations, mode switching, data compression and data storage) for the SWEAP data as well as centralized power conditioning. In general, the SWEM acts as the SWEAP suite central processing unit, housing command scripts for sensor initialization and configuration, high voltage control, and attenuator actuation and accumulating data into various packets for inclusion into the data stream to be transferred to the SPP SSR (Solid State Recorder).
The SWEM houses most of the spacecraft interface electronics for SWEAP in a single box to reduce mass, to simplify harnessing and interfaces, and to reduce duplication of interface logic, power converters and other common services. SWEM allows for a single interface to the spacecraft DPU, easing integration and test activities later in the project. The module is composed of 2 separate approximately 6U-VME sized boards (160 x 200 mm): the DCB (Data Controller Board), and the LVPS (Low Voltage Power Supply board).
The SWEM derives its design from THEMIS, HESSI, STEREO, and MAVEN, and makes extensive use of the technical capabilities demonstrated in the IDPUs (Instrument Data Processing Units) developed for these missions. The suite data interface and control design is derived from the MAVEN DCB , modified slightly to incorporate the different SPP interfaces. The Coldfire processor implementation was qualified for use by MAVEN, and the design will be copied for SWEAP. The remaining circuitry needed on the DCB and LVPS are standard designs used extensively in previous missions.
DCB (Data Controller Board): This board receives commands and timing signals from the SPP DPU, and generates initialization and configuration messages for the SPANs and SPC. It acts as a router during data collection and provides intermediate processing such as on-board moment, pitch angle and averaging computations. Upon low voltage turn-on of the SPC and SPAN, the DCB will configure the sensors, enable the low voltage line that powers the high voltage supplies and execute the HV ramp-up commands that bring the supplies to nominal voltage. The DCB includes hardware and software safety latches to prevent accidental high voltage turn on. Attenuator position is controlled by the DCB, which also compresses the data into averages and calculates onboard moments, implemented in a single FPGA/embedded processor. The DCB FPGA also provides the SWEAP to SPP DPU interface, controlling the flow of raw data through the system. It receives commands from the SPP DPU processor and manages the SWEAP suite. Following the RBSP and MAVEN architecture, the DCB has memory on-board (rad-hard and SEE tolerant 10 x 8 GB Flash Memory that is the same as is currently flying on MAVEN) and takes formatted packetized data from the instruments directly making them available when requested for transmission to the ground without further processing. Support circuitry on this board includes address/data demultiplexing and an ADC for housekeeping data.
FSW (Flight Software): The core of the SWEM DCB is a Coldfire processor implemented in an FPGA, as an IP-core. The Coldfire processor was used on MAVEN and builds on heritage code that has flown on many missions. This processor and the board electrical design was developed for UCB’s Instrument package on RBSP, allowing SWEAP to take advantage of both hardware and software heritage.
The SWEAP FSW architecture uses dedicated FPGAs for routine data and memory management, instrument interfaces, and other repetitive tasks in order to leave the processor free for specialized duties and less frequent, higher level functions. Instrument housekeeping and commanding is implemented via low speed serial data interfaces in a point-to-point architecture. Instrument science data is relayed over separate, higher speed serial lines to the DCB where data is directly fed into on-board memory, formatted as packets, and sent to the S/C mass memory for eventual downlink transmission. There are no time intensive tasks and CPU usage as a fraction of total available resources is low. Computation intensive tasks are performed in the instrument FPGAs using dedicated HW, the CPU only supports their operation.
LVPS (Low Voltage Power Supply board ): The SWEM LVPS generates the various voltages required by the SWEAP instrument suite. Regulated voltages are PWM (Pulse Width Modulated) and regulated to better than ±5 %. This board also provides current monitors for secondary voltages. Each power supply is current limited on its primary side and is galvanically isolated primary to secondary. The input from the 28 V spacecraft power is soft started and filtered to meet EMI (Electromagnetic Interference) requirements.
Science Data and Operations: The Suite is operated through the SWEM. The science data is taken along with calibration sequence run according to a command plan uploaded and then executed by the SWEM.
The SWEM has a number of independent operating configurations, which mainly affect instrument science data accumulation rates. Only two basic modes (Safe and Science Mode) affect power consumption and dissipation. In Safe Mode, only the core systems are powered on. Safe Mode is the power on condition, with only the core power and processing system powered on (the instrument sensors are not powered on). Science Mode is the normal operating state. In this mode, SWEAP is ready for full science data collection and is autonomously controlled using table driven mode configurations. In Science Mode, sensor data is sent to the SWEM at a constant rate. While the specific contents of SPC and SPAN data are different, all communication between the SWEM and instruments is accomplished through the standardized CCSDS protocol. Upon receipt of instrument data the SWEM makes use of FPGA-based logic to steer incoming data to the assigned memory locations in real-time based on programmable tables. Once in memory, the FPGA logic moves data through the data processing and compression pipeline, completes the data packetization, inserting ApIDs, and queues the data for transfer to the spacecraft.
Operation of SPC by the SWEM is a simple matter of uploading operating parameters to the SPC FPGA. The FPGA will then control the high-voltage modulator board and record telemetry that is then sent back to the SWEM. The SWEM contains a number of pre-programmed configurations to place SPC into the various combinations of ion, electron, peak-tracking, full-sweep, flux-angle and calibration modes. SPC sends 1 science packet/s to the SWEM.
The SPAN sensors are powered on via command from the SPP DPU to the SWEM. The SWEM contains command scripts for SPAN sensors to initialize the LV electronics and place the sensors in a default test mode, enable HV and bring HV to programmable levels, run various test sequences that confirm proper operations, and command the sensor into an instrument mode. The SPANs always make measurements at the same rate, but SWEM can load new high voltage lookup tables and/or trigger a switch between the operative high voltage table in the SPANs, which affects the energies and angles that a SPAN sensor scans in each measurement cycle. SWEM can also load and/or trigger a switch between the lookup tables that determine how counts are accumulated and binned in the SPAN sensor FPGAs. The combination of high voltage and product lookup tables defines the instrument operation, with the resulting sensor operational modes.
SPC (Solar Probe Cup):
SPC is a Faraday Cup (FC) with a 60º FOV (full width) that views the Sun from the edge of the SPP heat shield and measures the RDF (Reduced Distribution Function) and flow angles of ions and electrons as a function of energy/charge at high frequency. SPC measurements are essential for SPP and SWEAP because otherwise the solar wind would often be blocked by the heat shield. FCs measure the current produced on a metal plate by charged particles with sufficient energy/charge to pass through a grid placed at a variable HV (High Voltage). The underlying technology is straightforward and similar to the operating principles of vacuum tubes. SPC filters charged particles based on the component (E||/q) of their energy/charge parallel to the instrument line of sight. For a given E||/q, particles with any E/q can enter SPC as long as their flow angle is within the FOV. In a single measurement the HV oscillates between two voltages. The population of plasma with E||/q between these two voltages produces an AC current on the plate, and electronics isolate the AC signal and record it. SPC measures the currents produced on a circular plate divided into four quadrants and placed behind a smaller circular aperture. A cross section of the SPC sensor and an illustration of the measurement process is provided in Figure 71.
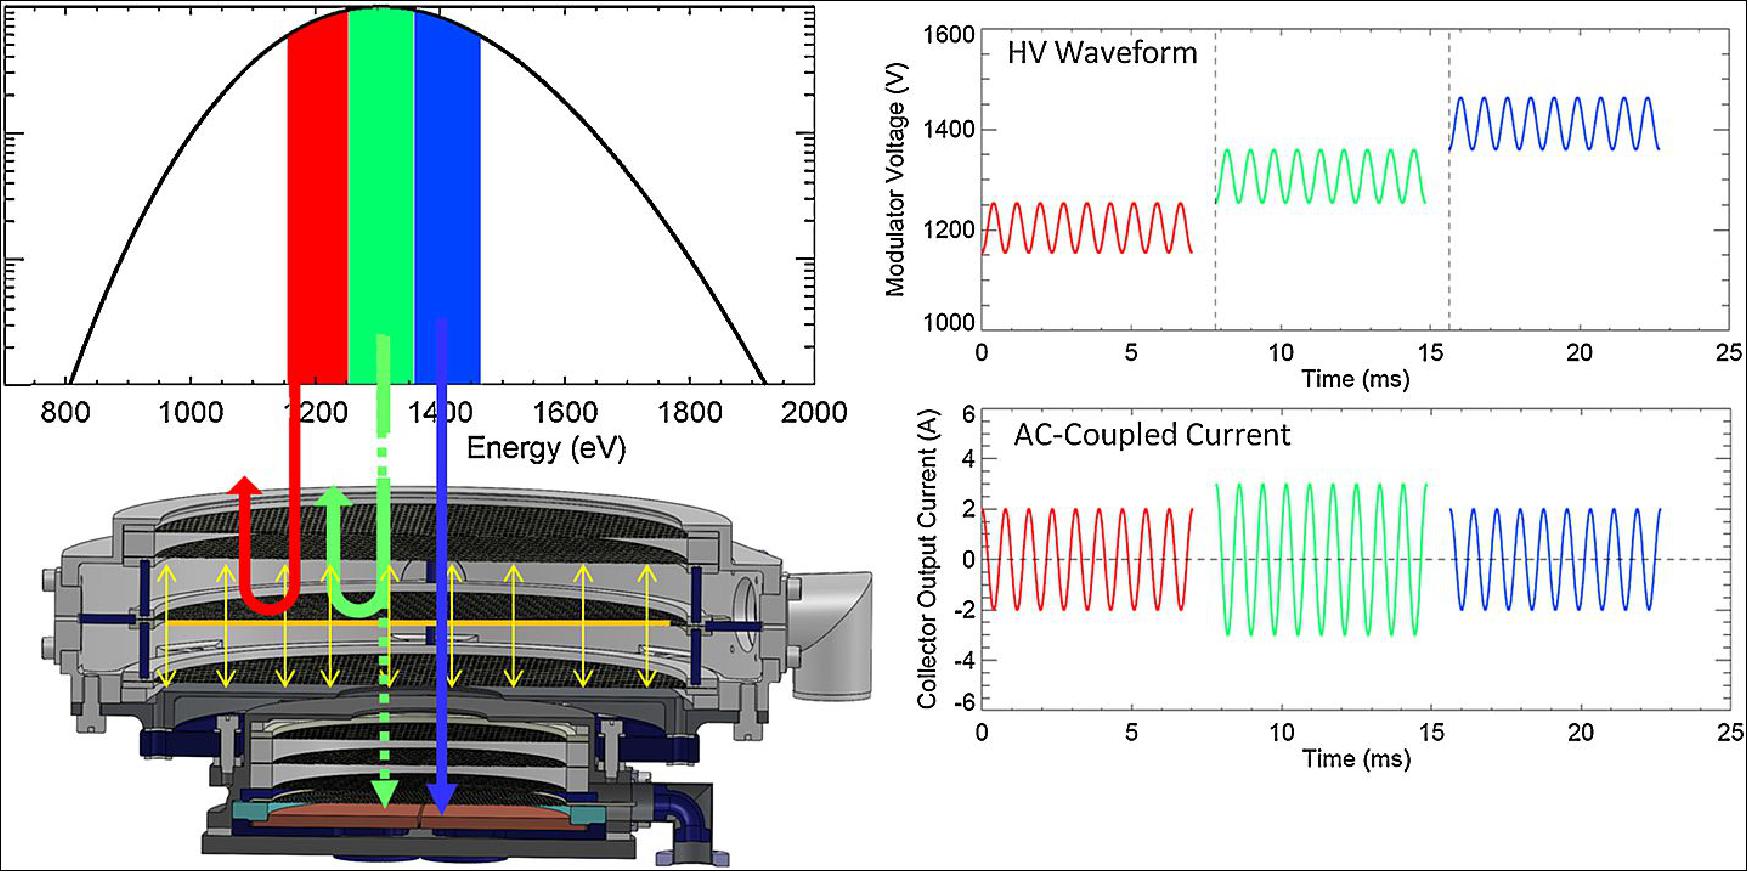
The combined currents are directly related to the RDF, and ratios of the currents recorded by the different collector plates can be solved for the precise flow angle of the plasma as a function of energy/charge. Detailed properties of the solar wind such as velocity, density, and anisotropic temperatures are then determined by convolving a model velocity distribution function with a detailed instrument response function and deriving the best fit solar wind parameters. The AC detection process makes SPC insensitive to lower-frequency noise sources, such as thermionic emission from hot surfaces, photoelectron emission from surfaces exposed to sunlight, and penetrating radiation from intense energetic particle events.
The FC has been a workhorse for space plasma measurements from the beginning of space exploration. FCs have flown on Explorers 10, 18, 21, 28, 33, 35, 47 and 50, SOLRAD A and B, Pioneer-6 and -7, Mariners-3, -4, -5 and -10, OGO-1 and OGO-3, Voyager-1 and -2, and Wind. FCs have played a major discovery role in exploring space, from the first observations of ion fluxes in space through the first observations of the termination shock. The FCs on Voyager-2 and Wind are still operating and providing invaluable solar wind measurements. The FC components and measurement process both function in a high temperature environment. Since the sensor is simply a metal plate, the response of the instrument is stable with time. The FCs on Wind have a drift in response of about 0.01%/year.
A significant effort has been expended in an assessment of materials for SPC, solar furnace testing of materials in an optical, thermal, and radiation environment well in excess of the closest SPP solar encounters, design and fabrication of a prototype, and successful operation a prototype instrument in a flight-like environment. Thermal and optical simulations predict that SPC temperatures at closest approach will reach over 1600ºC. Standard aerospace materials at these high temperatures can evaporate or outgas, especially when sputtering of solar wind ions and electron beam heating are factored in, leading to changes in thermal/optical properties and degrading performance. Due to the Sun-exposed materials at high voltage, the project must also factor in thermionic emission due to both the hot cathode and field emission mechanisms, along with photoelectron induced emission hundreds of times more intense than generally seen near Earth. For the grids, the project found the best materials to withstand the harsh conditions are high purity tungsten (W). Tungsten has a high work function and the highest melting temperature of the refractory metals, and is also simple to etch into grid patterns. Other materials employed in the sensor include pure Niobium, and an alloy of molybdenum, titanium and zirconium called TZM. The niobium is employed in the heat shield and in wires due to its flexibility and the ease with which it can be laser welded. The TZM was selected mainly because it is able to retain its strength at high temperatures and due to the relative ease with which it can be machined. Sapphire has emerged as the preferred material for insulating surfaces due to its high electrical resistivity at high temperatures combined with its relative mechanical strength compared to other materials such as pyrolytic Boron Nitride.
SPC is divided into several smaller units, which are described and shown in Figure 72. The FSU (FC Sensor Unit) is the actual FC sensor that is exposed to sunlight. Two annular niobium plates at the front of the FSU permit plasma to flow into the instrument while shielding the edges of the SPC from sunlight. The FSU is mounted on the end of a titanium strut that interfaces SPC to the SPP transition structure. The FEU (Faraday cup Electronics Unit) is located on a platform directly next to the interface point on the SPP transition structure. The FEU contains preamplifiers that amplify the signals from each of the four collector plates. An FPGA and ADC (Analog-to-Digital Converter) in the FEU digitize the amplified waveforms and perform the synchronous detection algorithm. The digitized currents are sent from the FEU to the APB (Analog Processing Board) in the SWEM, where further calculations are performed and the resulting packets are sent to the spacecraft solid-state recorder. The FEU also contains the HMB (High-voltage ModulatorBoard), which is driven by the FPGA and generates the High Voltage (HV) waveforms that drive the HV modulator grid within the FSU. The FEU is within the shadow of the SPP heat shield, allowing for a relatively benign operating environment, with maximum temperatures expected in the electronics box to be approximately 70ºC.
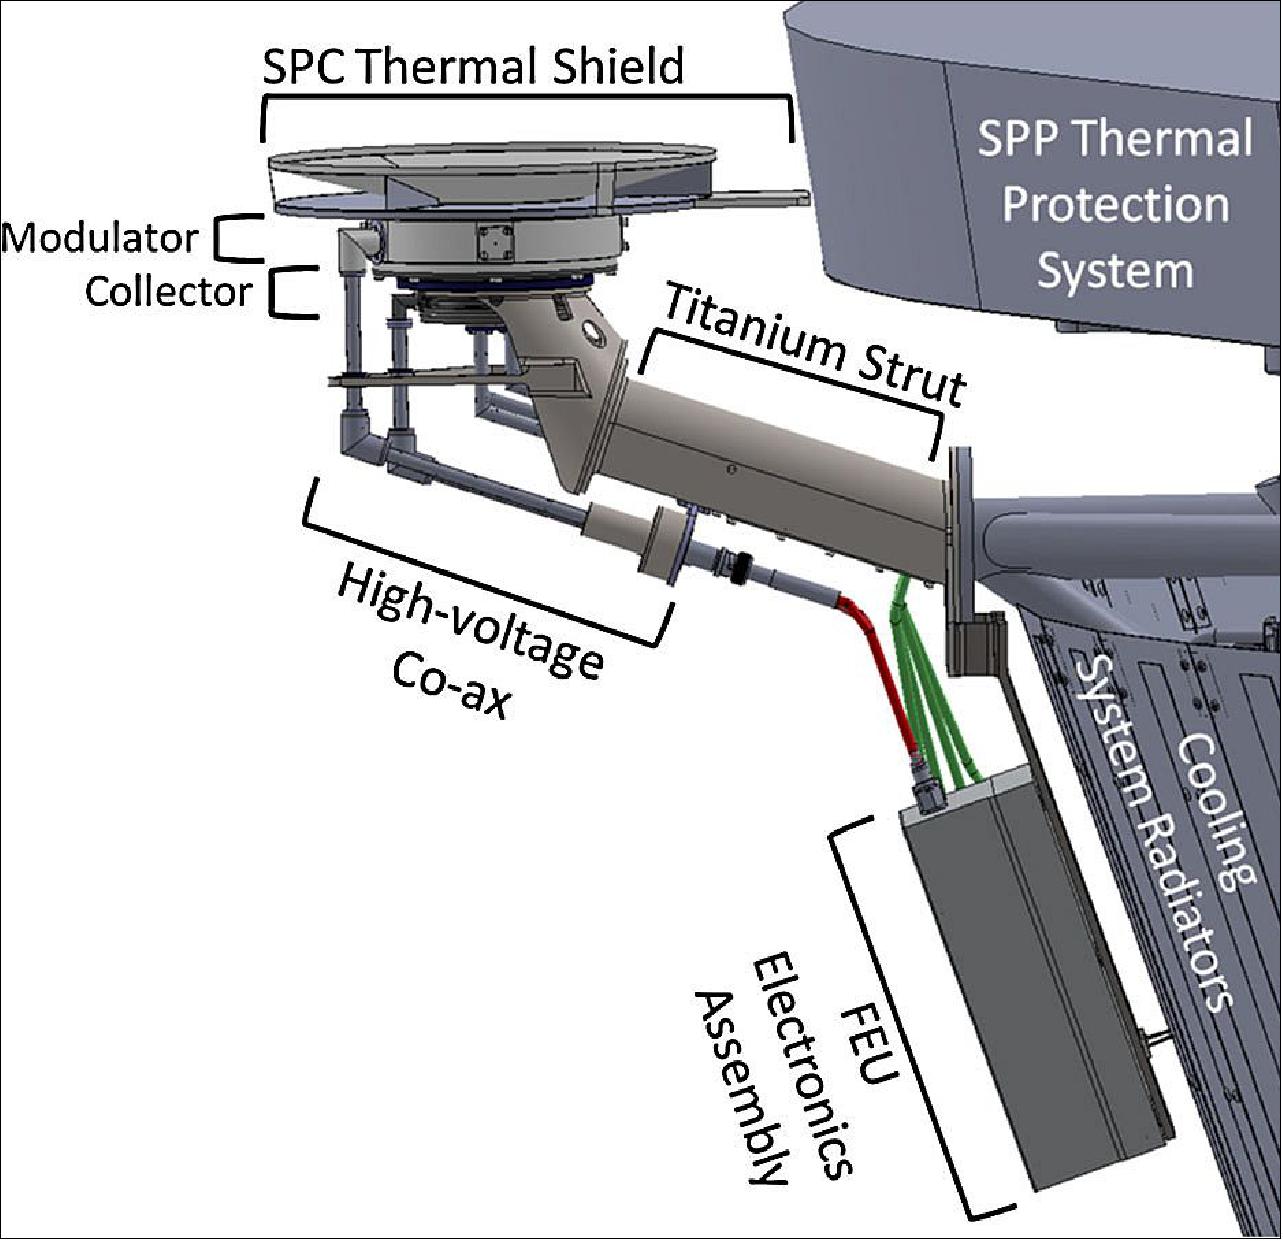
A cross section of the FSU is shown in Figure 73. The modulator assembly filters particles by energy/charge and the smaller collector assembly records the flux and flow angles of the particles. Plasma enters the FSU through the large circular entrance aperture at the top of the instrument and enters the modulator assembly. The entrance aperture is designed to be sufficiently large so that the smaller limiting aperture between the modulator and collector assemblies is always fully illuminated by plasma over the entire range of angles of incidence. The limiting aperture is sized to detect the minimum flux with sufficient signal to noise, including the drop in signal strength due to the transparency of the grids. Fine conducting grids with high transparency throughout both assemblies act to filter particles and shield stray electric fields. After the entrance aperture a grounded grid prevents stray fields from leaving the instrument to ensure compatibility with electromagnetic instruments on the spacecraft.
Within the modulator are three more grids: a HV modulator grid with a time-varying retarding potential sandwiched between two grounded grids. The particles that pass through the limiting aperture then produce a current on one of four 90º wedge-shaped metal collector plates. The collector plates are larger than the limiting aperture, so an incident beam falls entirely on the collector plates. Three plates are sufficient to solve for flow angles, but a fourth plate provides an additional level of redundancy. A suppressor grid is maintained at -55 V immediately above the collector plates. The suppressor reflects secondary electrons kicked off the plates from ion impacts back onto the plates and prevents low energy electrons from thermionic and photoelectric emission at the front of the FSU from reaching the plates, although this is not necessary because they do not produce an AC signal. The currents from the four plates are fed through coaxial cable to the FEU, where the measurement electronics amplify and digitize the waveform.
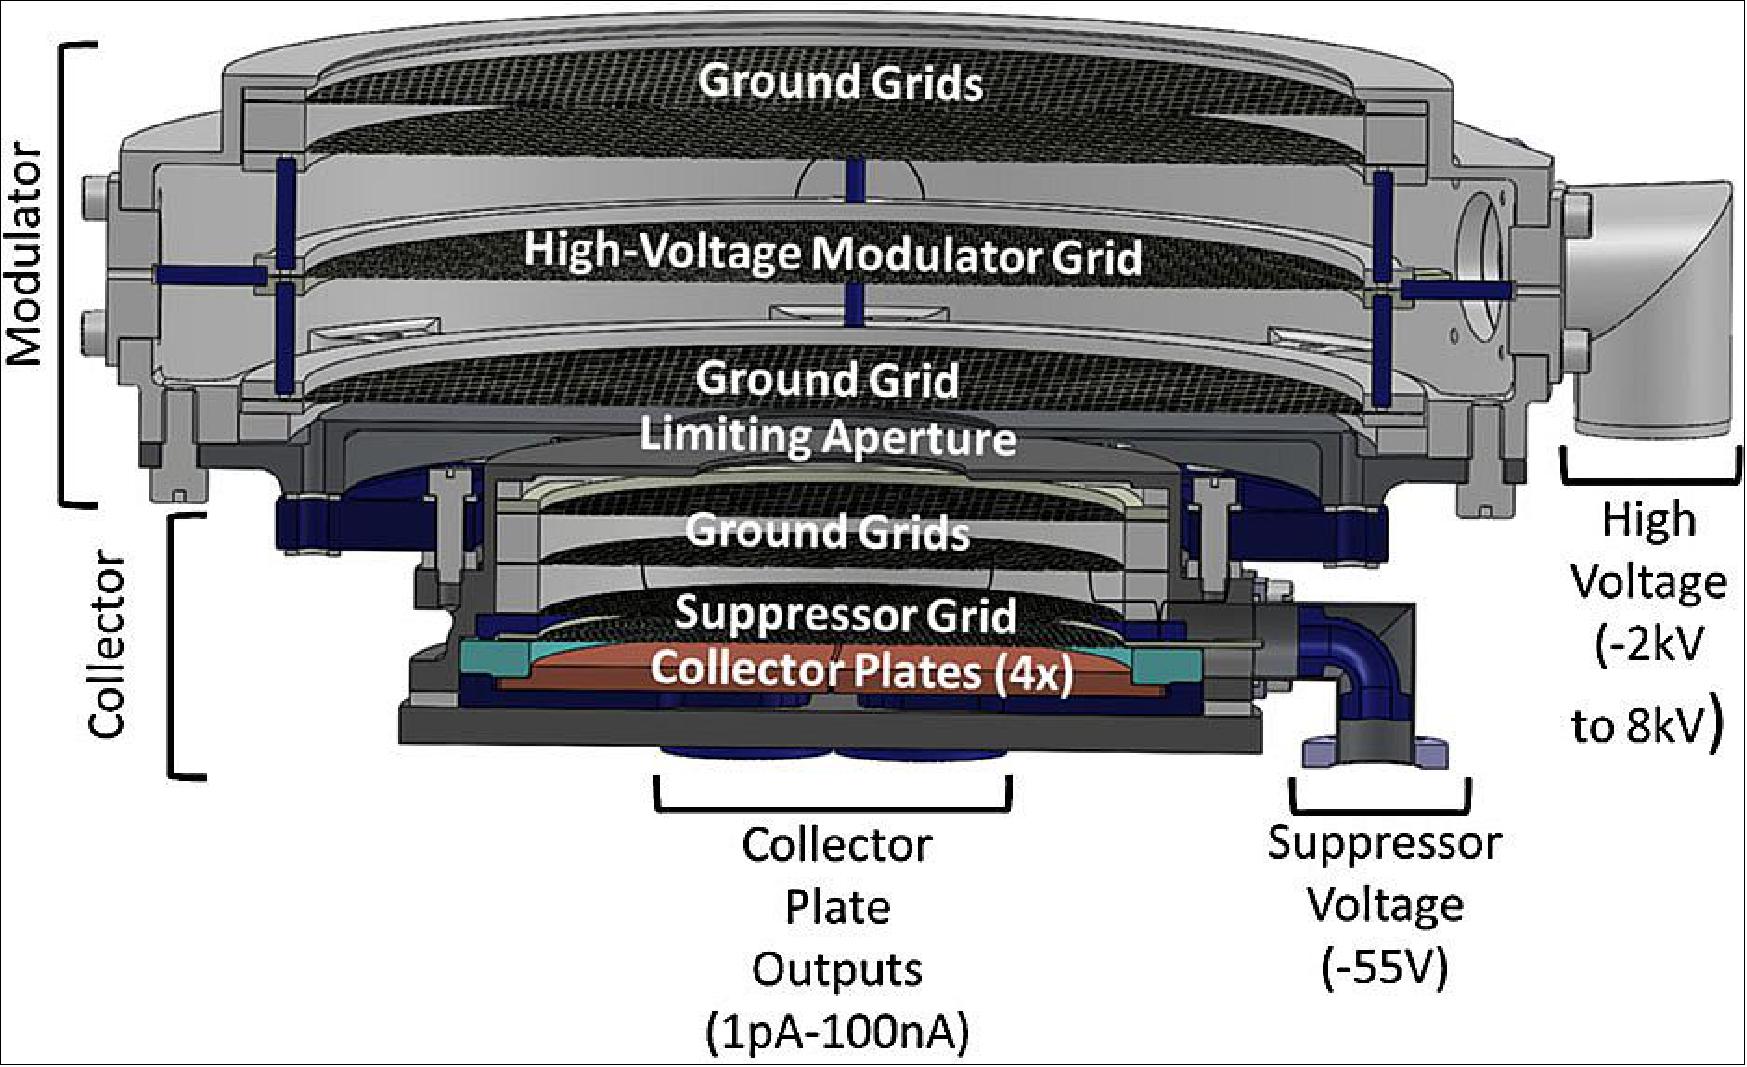
SPC Estimated Performance: The three key SPC performance parameters are energy resolution, signal to noise, and accuracy of angle measurements. Initial performance testing has been done with the SPC prototype and indicates that SPC will meet all of its high-level performance requirements. A twopronged testing approach was taken, with high-fidelity ion beam testing taking place at the SWF (Solar Wind Facility ) at MSFC (Marshall Space Flight Center) and solar illumination testing taking place in a custom-built chamber at the SAO (Smithsonian Astrophysical Observatory). In order to provide some simultaneous testing, the SWF was fitted with a contact heater used to raise the temperature of the back of the collector housing and collector plates and the chamber at SAO was fitted with a lower precision ion source. Performance testing of the prototype in phase B demonstrated that SPC is able to meet all of its level-1 performance requirements.
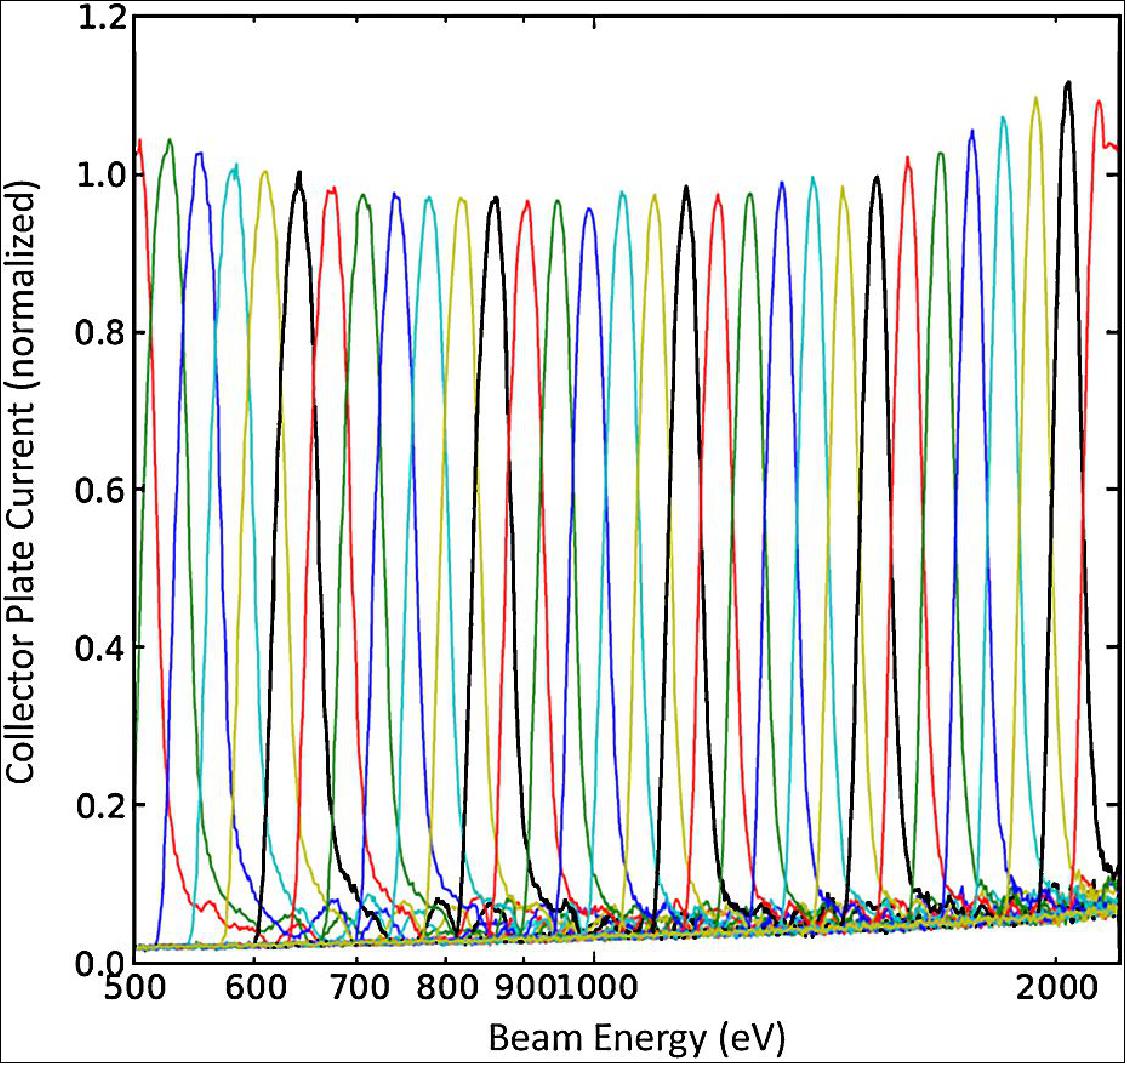
To measure the energy resolution of SPC, a prototype was tested using the ion source at SAO. The instrument was run in a limited ‘full-scan’ mode, in which the current is measured in successive voltage windows by scanning in an upward direction and then again in a downward direction. In this case, the voltage windows are 7 % wide and overlap by about 2 %. The energy of the beam is then incrementally increased in a slow manner, so that multiple measurements are made in each voltage window at each beam energy. The results are shown in Figure 74. Voltage windows are shown as different colors (the colors repeat every 6th window). The peak of each voltage window is separated from the adjacent windows, showing that the instrument is able to resolve the energy of an ion beam to better than the separation of these energies windows (in this case 5 %). Further tests in phase C will further quantify the energy resolution of the instrument.
The angular response of the SPC prototype was measured using the SWF ion beam facility. A mono-energetic ion beam was produced that covered the full aperture of the SPC prototype. The instrument was then rotated through a range of angles while being exposed to this beam. Figure 75 shows the normalized current (in color) as a function of the angle of incidence of the ion beam and the energy window.
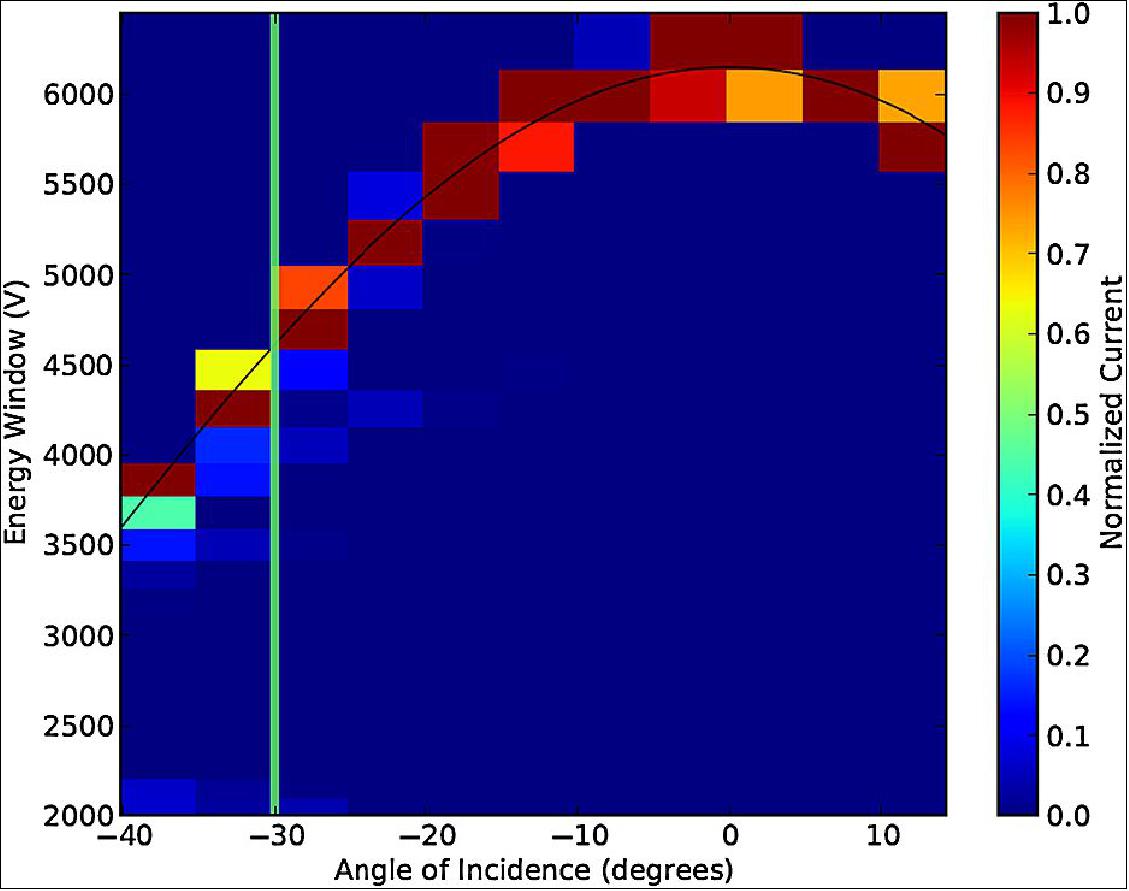
As the instrument is rotated, the ion beam appears in different energy windows because the modulator portion of the instrument affects only the parallel energy of the incoming ions. As such we expect a cos2(θ) dependence of energy on incidence angle. The expected response is shown as a black line. The vertical green bar indicates SPC’s FOV requirement. The beam is easily measured up to 10º beyond the 30º requirement. Testing was also performed to demonstrate the angular resolution of the instrument. Observations showed that the resolution is much better than 1º. This is confirmed by an analysis of the geometry of the cup and the measured noise performance of the measurement circuitry. Further testing in phase C will continue characterizing the angular response of the instrument.
SPC Electrical: The SPC Electronics Module is located at the base of the SPC strut and consists of a HVPS (High Voltage Power Supply), a LVPS (Low Voltage Power Supply), and a signal processing and control board referred to as the FEU (Faraday cup Electronics Unit). The HVPS provides the modulator and suppressor grid voltages. The modulation voltage is adjustable from -2 kV to +8 kVDC with an adjustable amplitude 50–800 V, 1280 Hz, AC component. The high voltage DC, AC component peak to peak voltage, and frequency are programmable via digital interface. The suppressor grid voltage is nominally -55 VDC. For each collector plate, the signal processing electronics first convert the input current waveform to a voltage waveform. This voltage waveform is amplified by four parallel gain stages, with the resultant waveforms are digitized by an ADC. The digitized waveforms are then routed to an FPGA that implements a discrete Fourier transform at the modulation frequency. The output of this algorithm is the peak-to-peak amplitude of the collector plate current at the modulation frequency. The gain-stage with the best SNR without saturating the amplifier is then selected and stored. The noise level of the system is about 5 x10-13 A, and currents (including both alphas and protons) are expected to range between 5 x 10-13 to 10-7 A. Thus, the SNR in a single measurement will range between 1 and 105. Protons, being the dominant species, will always have an SNR of more than 10.
SPC Mechanical - FSU materials and Fabrication: The dimensions of the FSU are directly derived from the desired sensitivity (the limiting aperture sized for the minimum expected current at 0.25 AU), range of observable flow angles (56º FOV) and energy range (modulator sized to withstand 8 kV). The FSU was designed following standard practices for solar wind FCs but with certain mechanical parts replaced with components made from materials more appropriate for higher temperatures. A stack of two thin annular niobium plates mounted to the front of the FSU limit direct exposure of the FSU and strut to sunlight while permitting access to the limiting aperture. The modulator and collector assemblies are machined from a high-temperature alloy called Molybdenum TZM (moly-TZM). The Delran insulators that have historically been used in Faraday cup to hold the HV grid in place and isolated from the modulator walls has been replaced with machined sapphire rods. The woven tungsten wire meshes used previously have been replaced with monolithic grids etched from single wafers of high purity W. We have found that these new grids are significantly stronger and more suitable for FCs than the old wire meshes, which were prone to failure through breaking wires and took weeks to manufacture.
Components are stacked within each subassembly, which is then sealed from the back with a TZM plate. The stack consists of niobium spacer rings, individual grids, and sapphire spacer rods and rings. High-voltage is transmitted to the modulator grid using a niobium wire fed from the side of the modulator assembly and bonded to a niobium annulus via crimping and laser-welding. The HV grid is then sandwiched between the niobium annulus and a tungsten annulus. The HV wire exits the side of the modulator housing and enters a custom hard coaxial cable. In that cable, sapphire tubes insulate the HV wire from a niobium outer tube, which is at ground. In the modulator assembly, ground grids make a firm mechanical and electrical connection to each other, to the ends of the assembly, and to the niobium spacer rings. This stacking technique makes assembly straightforward and permits mechanical flexibility in the presence of temperature gradients.
The structure of the collector assembly is similar, but ends with the four Niobium collector plates seated within a shallow sapphire cup. Signal wires are laser welded to the protrusions on the back of each collector plate that extend through the collector housing cap. Each signal wire then runs through hard coaxial cable (of similar construction as the HV coaxial cable) to the FEU. Figure 76 shows an image of the collector plate assembly which is the final component to be stacked into the collector housing. The four niobium collector plates sit on a bed of sapphire and are then clamped in place by a sapphire annulus that is held down by four bolts. In final stack-up, the suppressor grid would be placed directly against the top surface of the upper sapphire annulus.
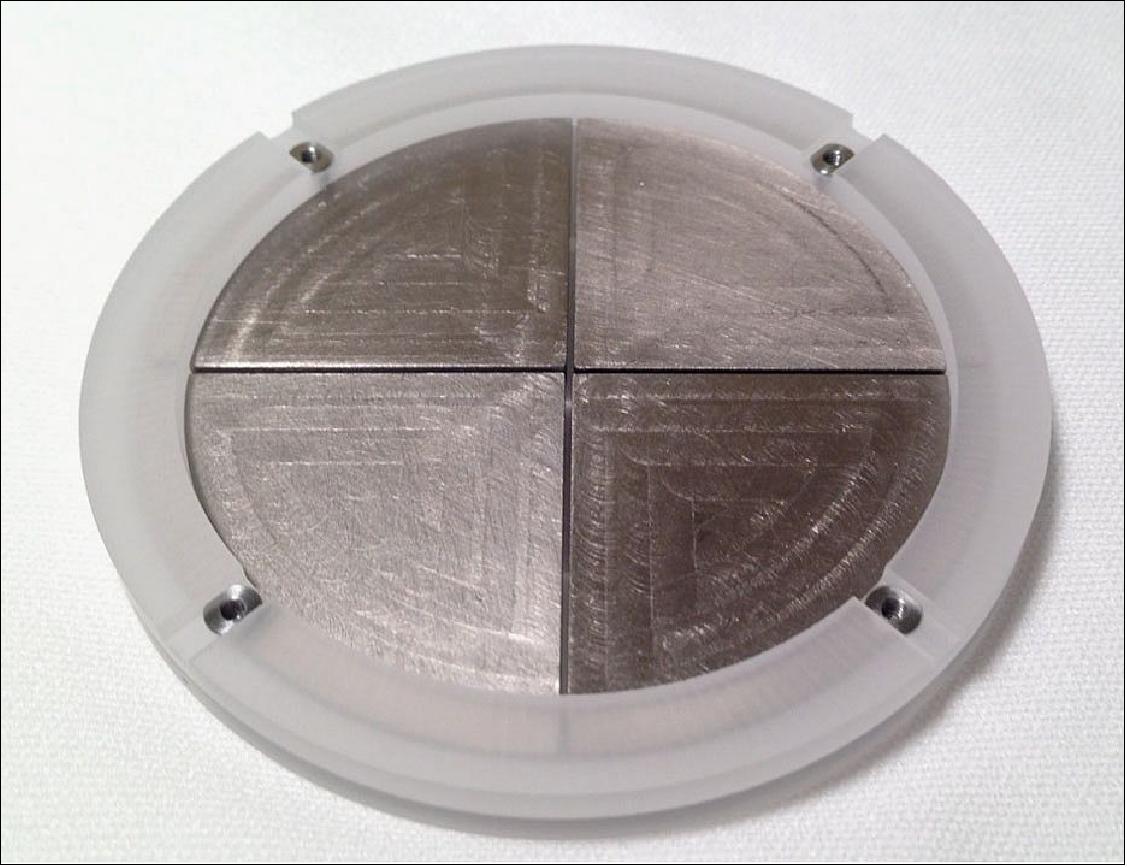
SPC Thermal: Four factors motivate keeping temperatures low within SPC: electron emission, mechanical integrity, signal amplification, and heat conduction to SPP. Hot conducting surfaces will generate thermionic emission that will be enhanced in the presence of strong electric fields by field-effect emission. These low energy electrons (several eV) can draw power from the HV supply by flowing to the modulator grid, and potentially interfere with the SPC solar wind signals. Thermionic emission from W materials peaks at about 1200 °C and is predicted to produce no more than 0.1 mW extra power draw on the SPC HV supply. Note that the accuracy of SPC flow angle and flux measurements are decoupled from any thermal or mechanical changes within the modulator assembly. Any change in the spacing between grids does not change the energy cutoff because they are maintained at a fixed voltage. Since the limiting aperture is always illuminated it is insensitive to any shifting of the entrance aperture.
Thermal simulations of SPC have been performed and results are shown in Figure 77. During closest encounters the first grid in the FSU will reach above 1600ºC and the modulator housing walls will reach 1000ºC. Though still hot, the components at the anti-sunward side of the cup are relatively cooler; the collector plates will be about 700 ºC and the back of the collector housing will be approximately 600 ºC. This is well below the temperature range the materials and components have been tested to.
The thermal model was compared to measurements taken under realistic illumination conditions with the phase B prototype in the SES ( Solar Environment Simulator). The SES uses four short-arc Xenon lamps with broad-spectrum reflectors, water cooled mirrors and focusing optics, and a water-cooled window into a vacuum chamber to deliver precisely calibrated, stable light that mimics the intensity, spectrum, and angular spread of sunlight at different phases in the SPP mission.
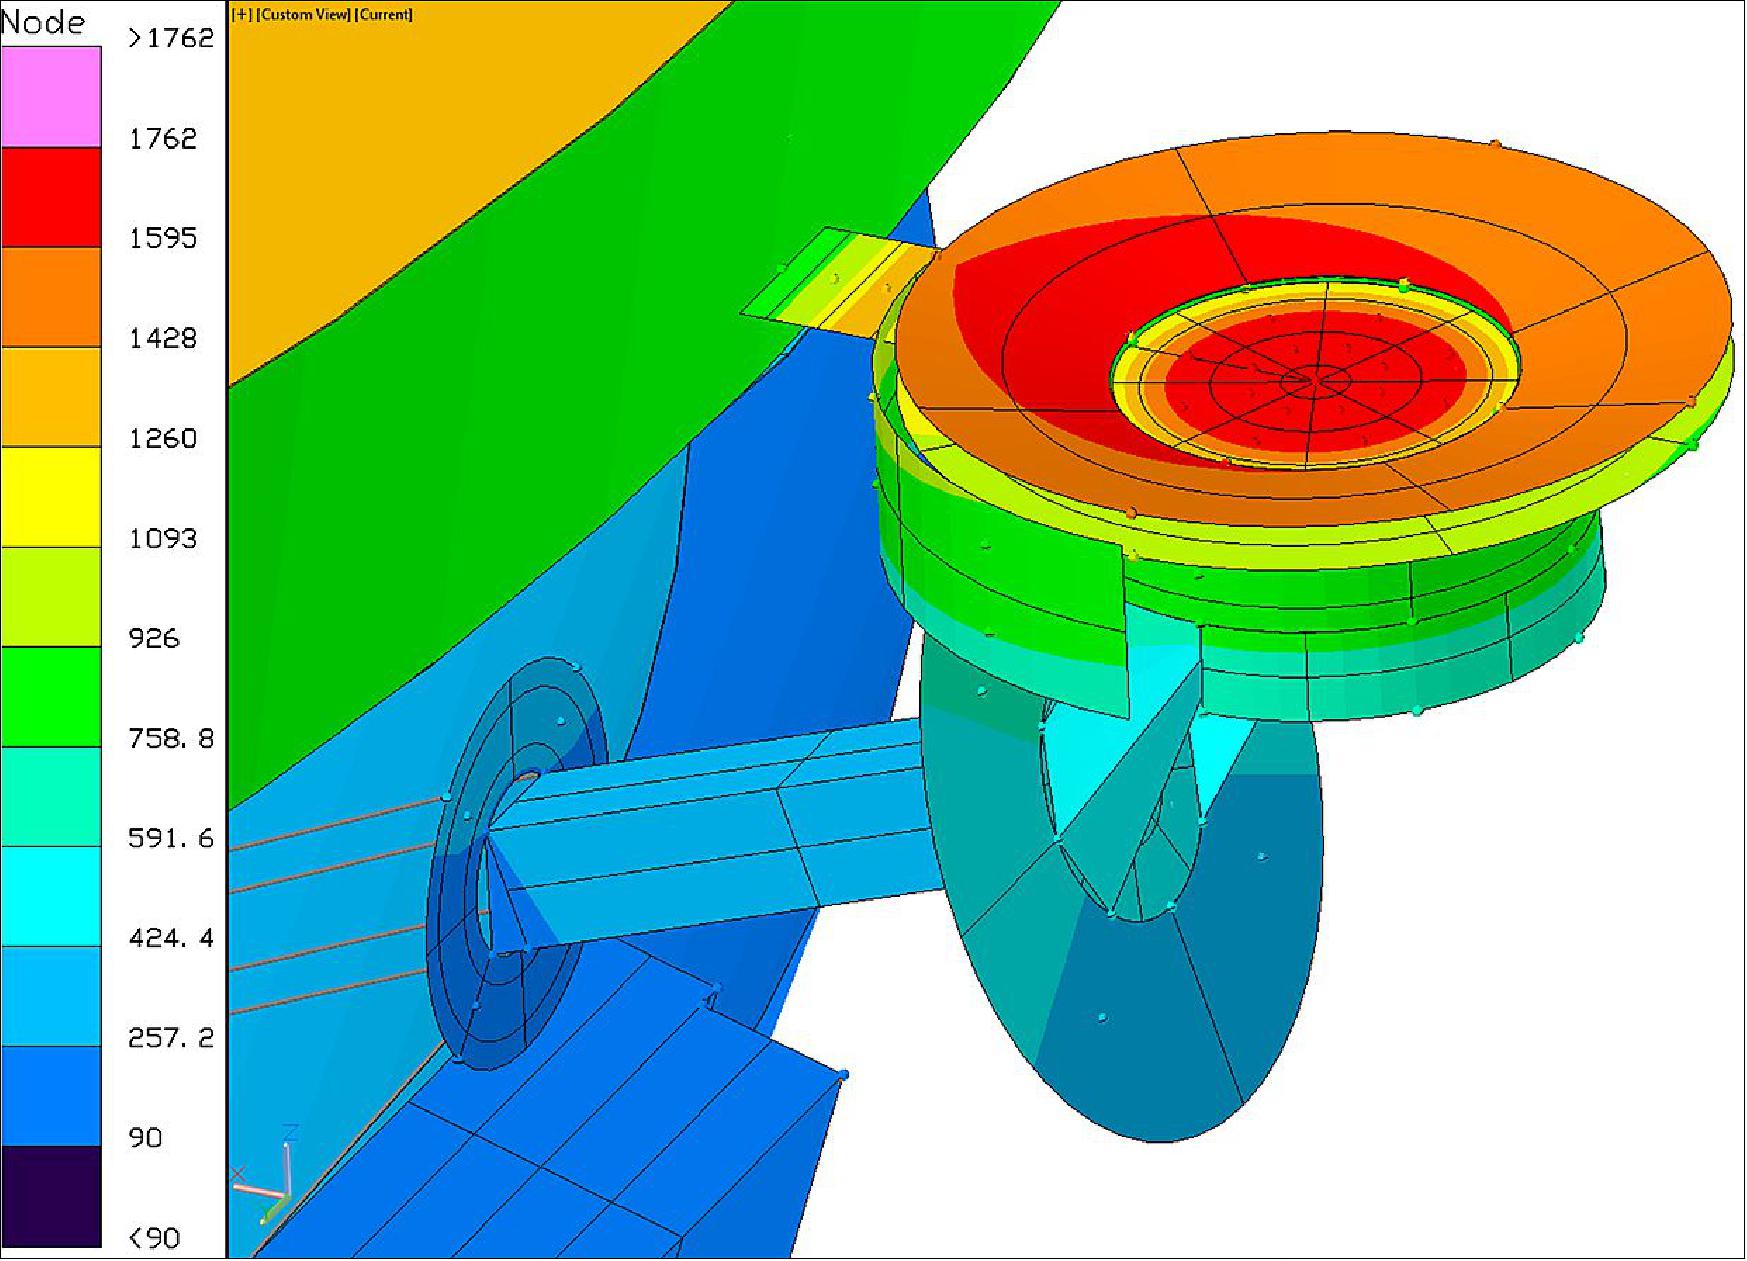
A scanning optical thermopile with NIST-traceable calibration is used to calibrate and control the photon flux of the SES onto SPC, allowing us to precisely validate the optical and thermal performance of the instrument against a known photon input. A comparison of the thermal model and measurements from thermocouples distributed throughout the instrument prototype is shown in Figure 78. In this particular exposure three different illumination cases were presented to the instrument, with the temperatures allowed to come to equilibrium before moving to the next case. One can clearly see that not only is the model a good predictor of the equilibrium temperatures, it also performs well during the transition periods, providing further confidence that the assumptions in the thermal model are accurately reflecting the instrument. In addition to validating the instrument thermal design and performance, the SES has also been used to demonstrate that the instrument can survive the extreme thermal gradients and mechanical strains included by the photon-induced heating, to confirm predictions of thermionic and photoelectric emission, to verify that the instrument high voltage performance as expected over temperature, and to confirm the energy resolution and measurement noise are uneffected by changes in light level and temperature.
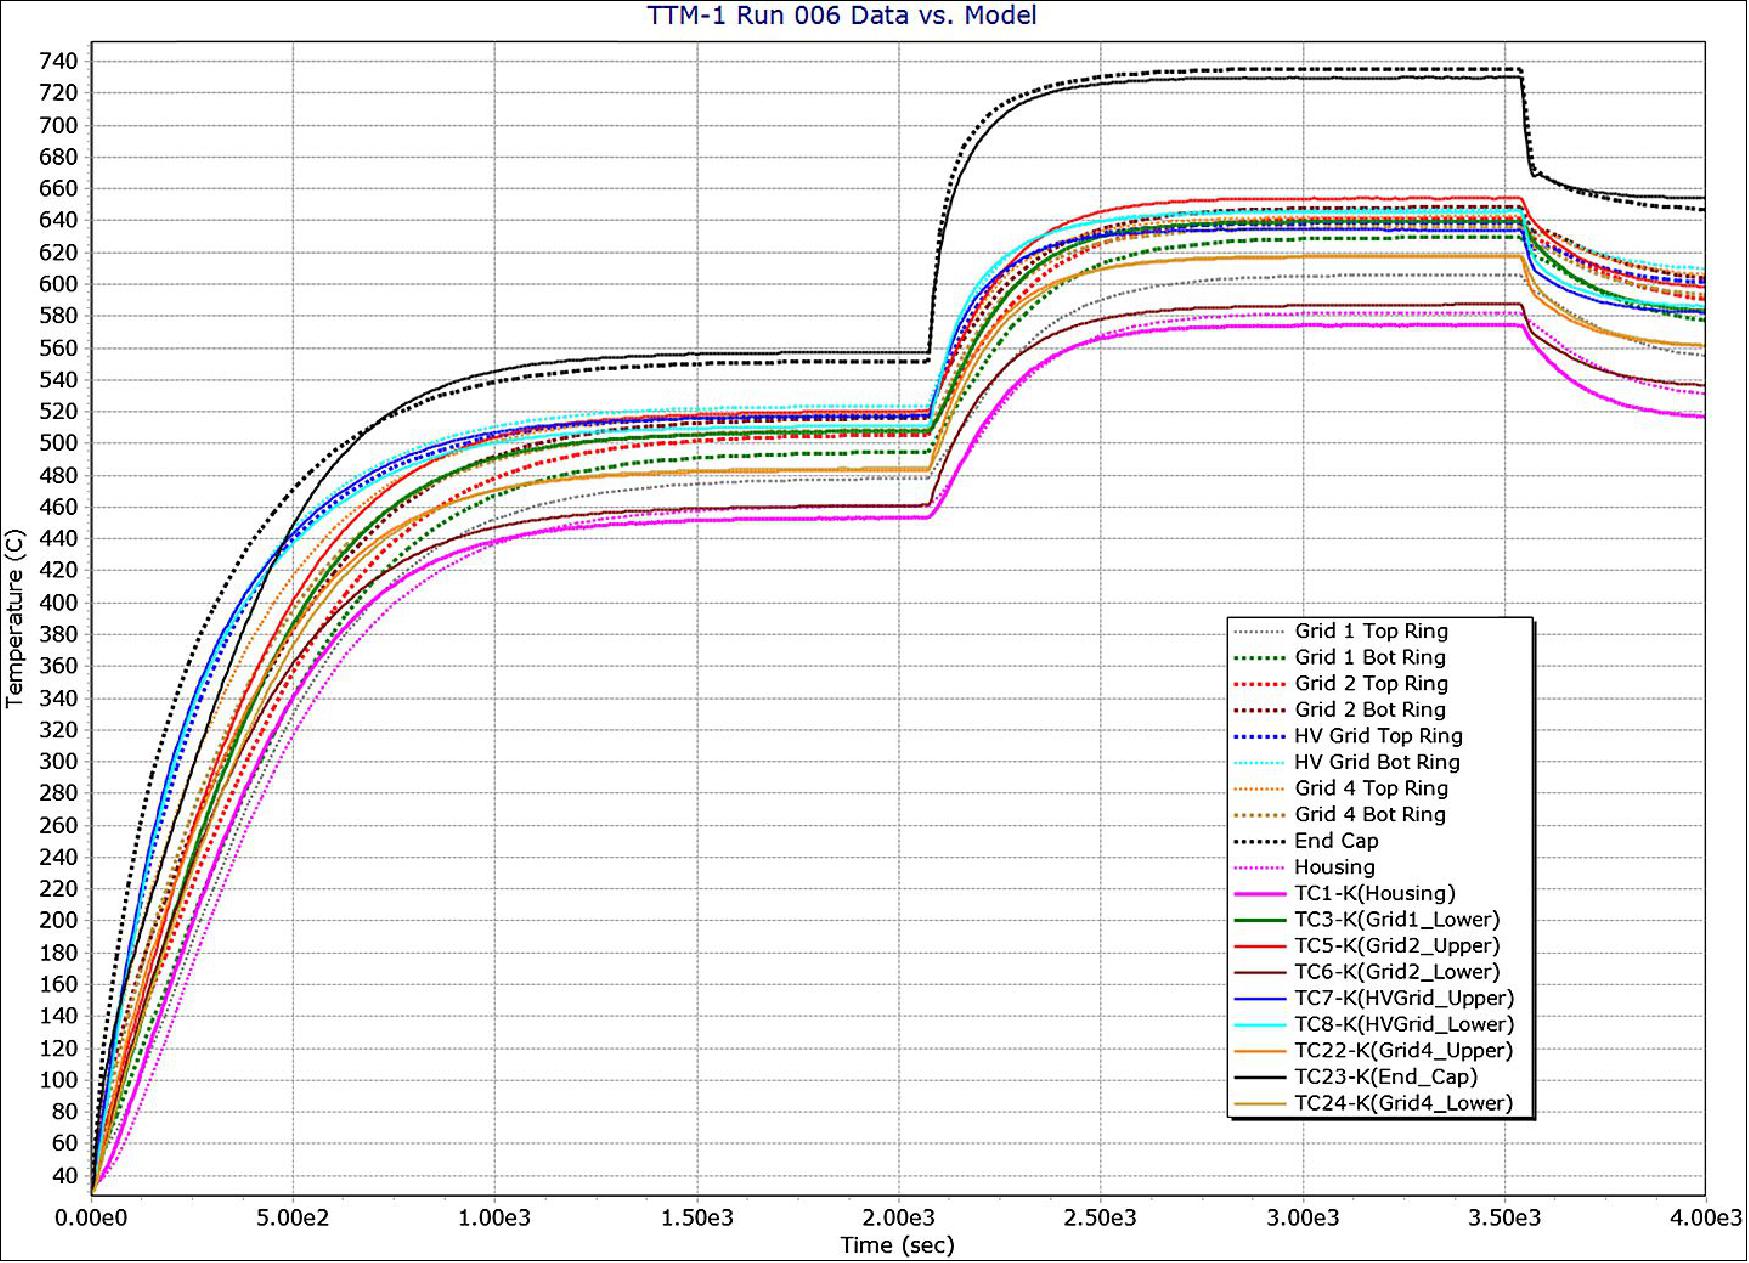
SPAN (Solar Probe ANalyzers):
SWEAP has three ESAs (Electrostatic Analyzers) to measure the three dimensional velocity distribution functions of ions and electrons with high angular, temporal, and energy resolution. The SPAN-A module has two ESAs to measure ions and electrons from the ram direction and nadir, and SPAN-B consists of a single ESA to measure electrons from the anti-ram direction. SPAN-A is located on the ram-direction side of SPP and SPAN-B is on the anti-ram side. Significant savings in mass are realized by combining the electron and ion ESAs (a lesson learned from FAST and THEMIS). Electrostatic deflectors extend the narrow planar intrinsic angular FOV of each ESA to 240° x 120°. Together the SPAN electron sensors provide a nearly 4π sr FOV for electrons (excluding the region of the sky blocked by the heat shield). Meanwhile, SPAN-A and SPC provide a continuous view of the solar wind ions, with SPAN-A providing the primary measurement at closest approach, when the velocity aberration from the lateral motion of the spacecraft brings the solar wind into the field of view. SPAN-A includes a pre-acceleration stage and carbon foils, closely based on the MAVEN STATIC design, allowing the separation of solar wind protons, alpha particles, and heavier species. All three sensors include both mechanical and electrostatic attenuators that provide a broad dynamic range, allowing optimal sensitivity over the entire SPP orbit.
SPAN Estimated Performance: In the plane of the instrument aperture, the intrinsic azimuthal resolution of the SPAN sensors is very high because of the focusing properties of the top-hat electrostatic analyzer, but the actual azimuthal angular resolution is determined by the size of the discrete anodes. In order to minimize power required from the discrete preamplifiers, angular resolution over the 240° FOV of both the SPAN-A and SPAN-B electron sensors is divided into eight high resolution 6° anodes, and eight lower resolution 24° anodes. The high-resolution anodes are chosen to image near the sun in order to capture the electron strahl. The SPAN-A and SPAN-B electron sensor FOVs are oriented to optimize their combined FOV. This orientation, with the SPAN-B FOV rotated 90° relative to the SPAN-A FOV, provides optimal coverage of electrons up to 4.5 keV over the whole sky. The finely segmented anodes are placed optimally to measure the strahl, and the alignment of the electron FOVs ensures full energy coverage towards the Sun.
All three SPAN sensors typically operate in “Alternating Sweep” mode, interleaving low resolution measurements of the entire available phase space (sparsely sampled) with full resolution targeted measurements of selected portions of the distribution (fully sampled). In Figure 79, an example measurement of the solar wind protons is shown to demonstrate SPAN-A’s ability to cover all of phase space, while still resolving the peak, at high cadence (both distributions can be obtained within less than half a second). The alpha particles, also present in this energy range, are separated using the mass-resolving capability of SPAN-A, and not shown in this Figure. With the expected mass/charge resolving capability of SPAN-A, the project will be able to generate fully distinct VDFs for protons and alphas.
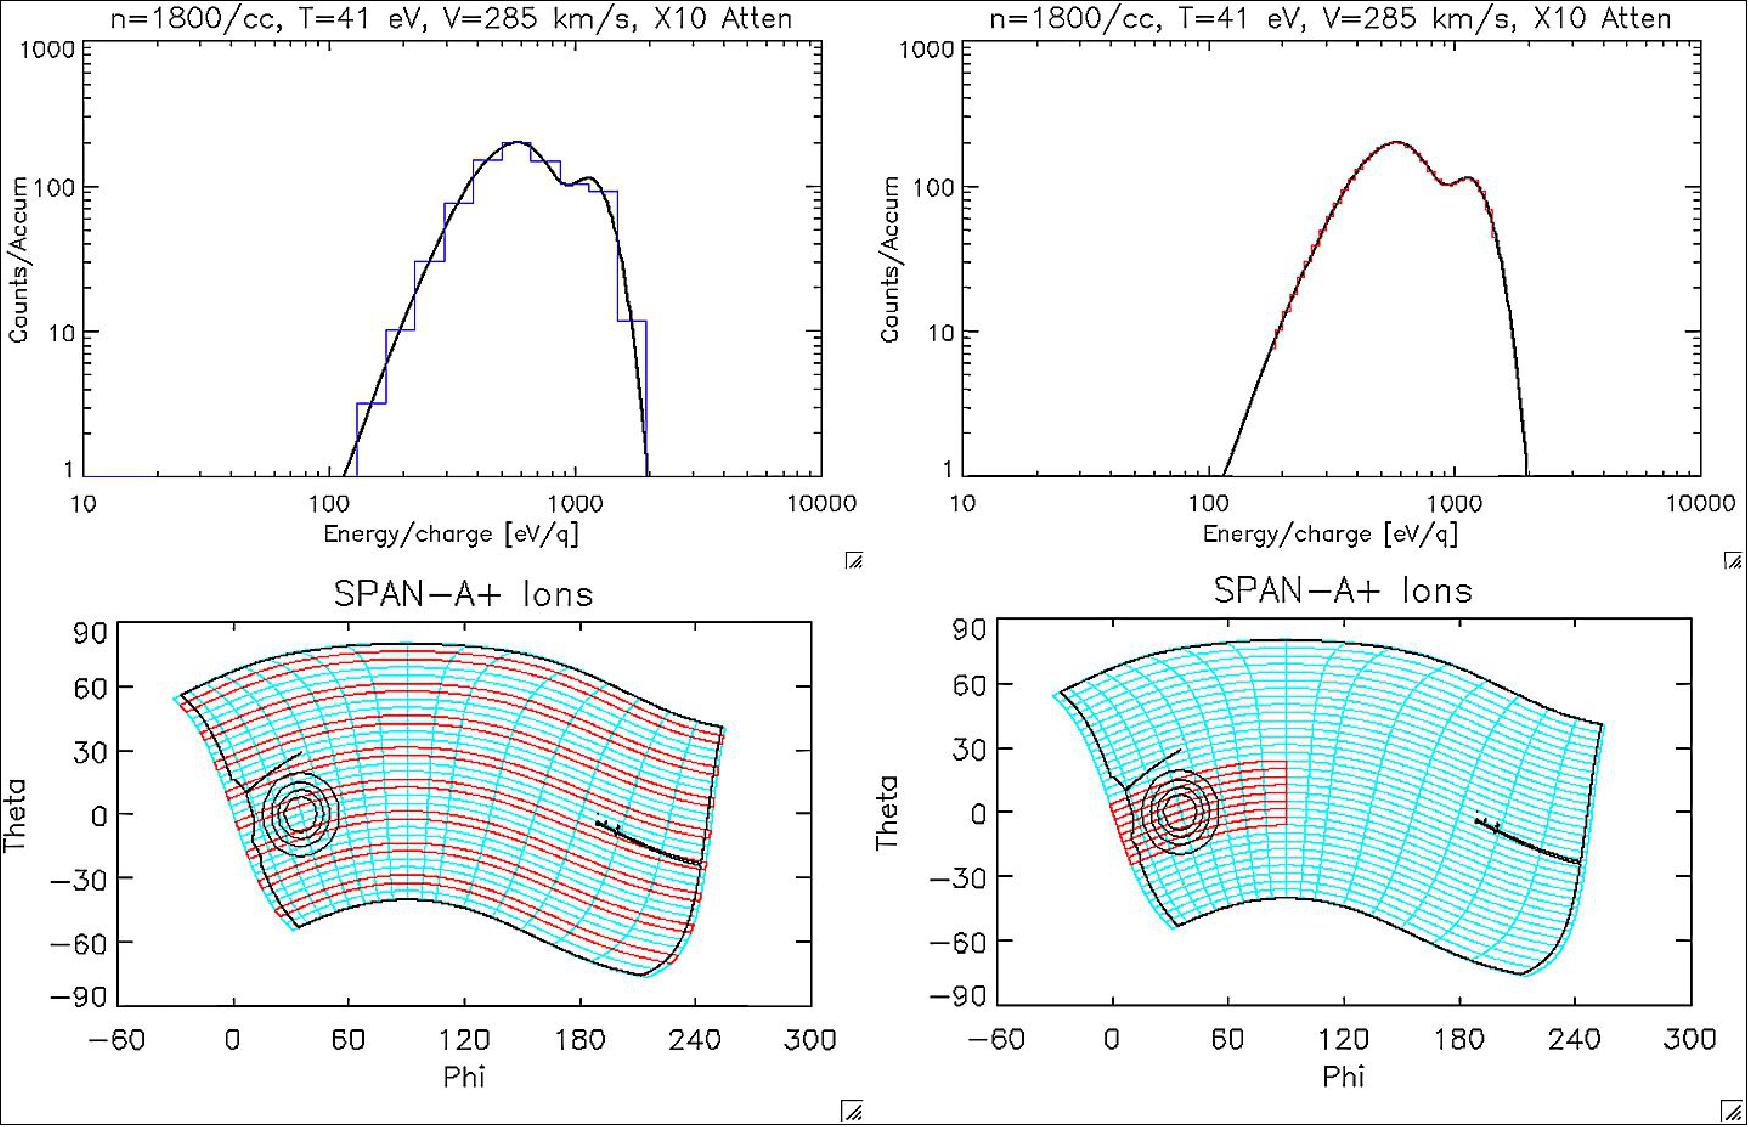
SPAN Electrical: Primary power for each SPAN sensor is provided by the SWEM. Each sensor has a low voltage power converter that receives regulated 22 V from the SWEM and converts it to provide analog and digital secondary voltages isolated from the primary service. These voltages are used to operate a digital board, high voltage power supplies, and front end electronics. A backplane also provides interconnects between the individual electronics boards, some of which are also connected directly by stacking connectors.
The high voltage power supplies provide fixed (adjustable) bias voltages for the MCP (Microchannel Plate) detectors and sweeping (lookup table-driven) voltages for the inner hemisphere, electrostatic deflectors and spoiler electrostatic attenuator. For the ions, an additional 15 kV supply provides a pre-acceleration voltage for the time of flight section. The sweeping supplies utilize optocoupler circuitry for the outputs. The high voltage supplies utilize the primary 22 V from the SWEM, switched through the digital board, and controlled by DAC outputs from the digital board. For the electrons, all high voltage power supplies share one board, while for the ions the pre-acceleration and MCP supply are housed on a separate board from the sweep supplies.
The front end for the electron sensors consists of a single board which provides a mounting point for the MCPs, collects charge pulses from the back face of the MCPs on a segmented anode, and utilizes a 16-channel preamplifier ASIC to produce digital pulses suitable for accumulation in the digital board.
The front end for the ion sensors consists of an anode board that provides a mounting point for the Z-stack microchannel plates and collects output pulses on segmented start and stop anodes. Each anode is capacitively coupled to an ASIC-based constant fraction discriminator providing a digital output pulse. These pulses are fed into a time-to-digital conversion utilizing ASIC parts, located on the digital board.
SPAN Mechanical: The mechanical design of SPAN-A and SPAN-B as of Mission PDR is summarized in Figure 80 (SPAN-B) and Figure 81 (SPAN-A). Since the electron ESA in SPAN-A is essentially identical to the electron ESA in SPAN-B, we begin with a review of SPAN-B.
Starting from the left side of Figure 80, the top of SPAN-B consists of a deployable onetime cover (re-closeable on the ground) that protects the ESA from contamination before launch. Immediately below the cover is a mechanical attenuator that is used to regulate the geometric factor of the sensor. The main optics section begins with a broad entrance aperture surrounding a pair of electrostatic deflectors that steer the instantaneous field up and down. After passing through the deflectors, particles travel between a pair of hemispheres, which have a voltage between them that only allows particles in a narrow band of energy to reach the exit. By placing a small voltage on the bottom half of the outer hemisphere (“the spoiler”) we can reduce the sensitivity of the analyzer by an order of magnitude, essentially be de-tuning the response of the analyzer. Particles that successfully traverse the electrostatic optics impact a chevron pair of microchannel plates with a high voltage bias across them, which produce a secondary electron cascade with a multiplication factor of a few million, producing a pulse with measurable amplitude that is collected on a segmented anode.
A central tower penetrates the anode and digital boards, bringing high voltage to the inner hemisphere from the high voltage power supply. The anode board is directly mounted in a transition plate which provides a smooth join between the analyzer and the electronics box, while the succeeding electronics cards (digital, high voltage power supply, and low voltage power converter) are mounted in frames which stack together, with a back plane mounted perpendicularly and providing signal and power routing between electronics boards.
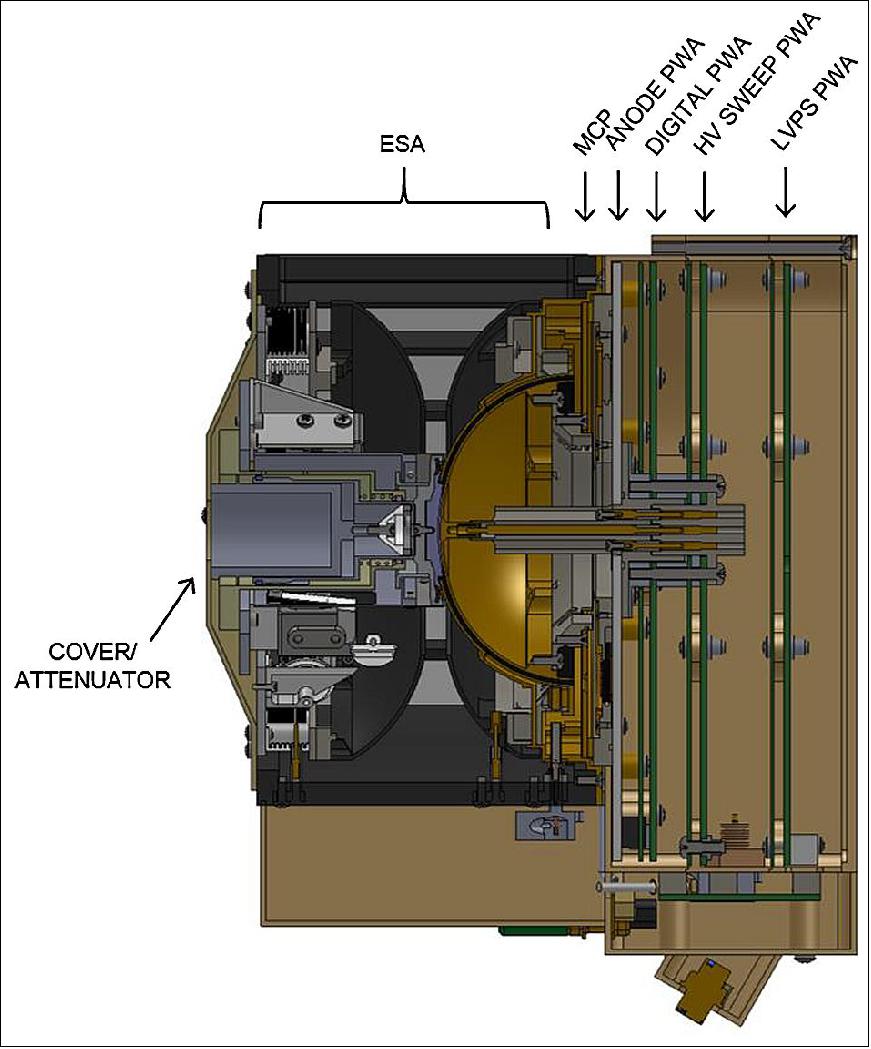
SPAN-A is shown in cross section in Fig. 81. The SPAN-A electron sensor has an identical mechanical design to SPAN-B, but is mounted together with the SPAN-A ion sensor. The ion sensor also has a nearly identical design, including the same analyzer optics, but with a few critical differences. Instead of an anode board directly at the exit of the analyzer, the SPAN-A ion sensor has a time of flight sensor. A pre-acceleration voltage accelerates ions to a high enough energy to reliably penetrate a carbon foil, producing start electrons that are then guided to the inner half of the microchannel plates. The ion then continues to a second carbon foil, generating a stop pulse. The stop electrons have sufficient energy to penetrate a thick foil and generate a stop pulse, while the primary ions stop in the thick foil, eliminating a primary background source for ion mass composition sensors. The remainder of the electronics box has a similar design, albeit with more boards than the electron sensors in order to accommodate the additional high voltage power supply for the pre-acceleration.
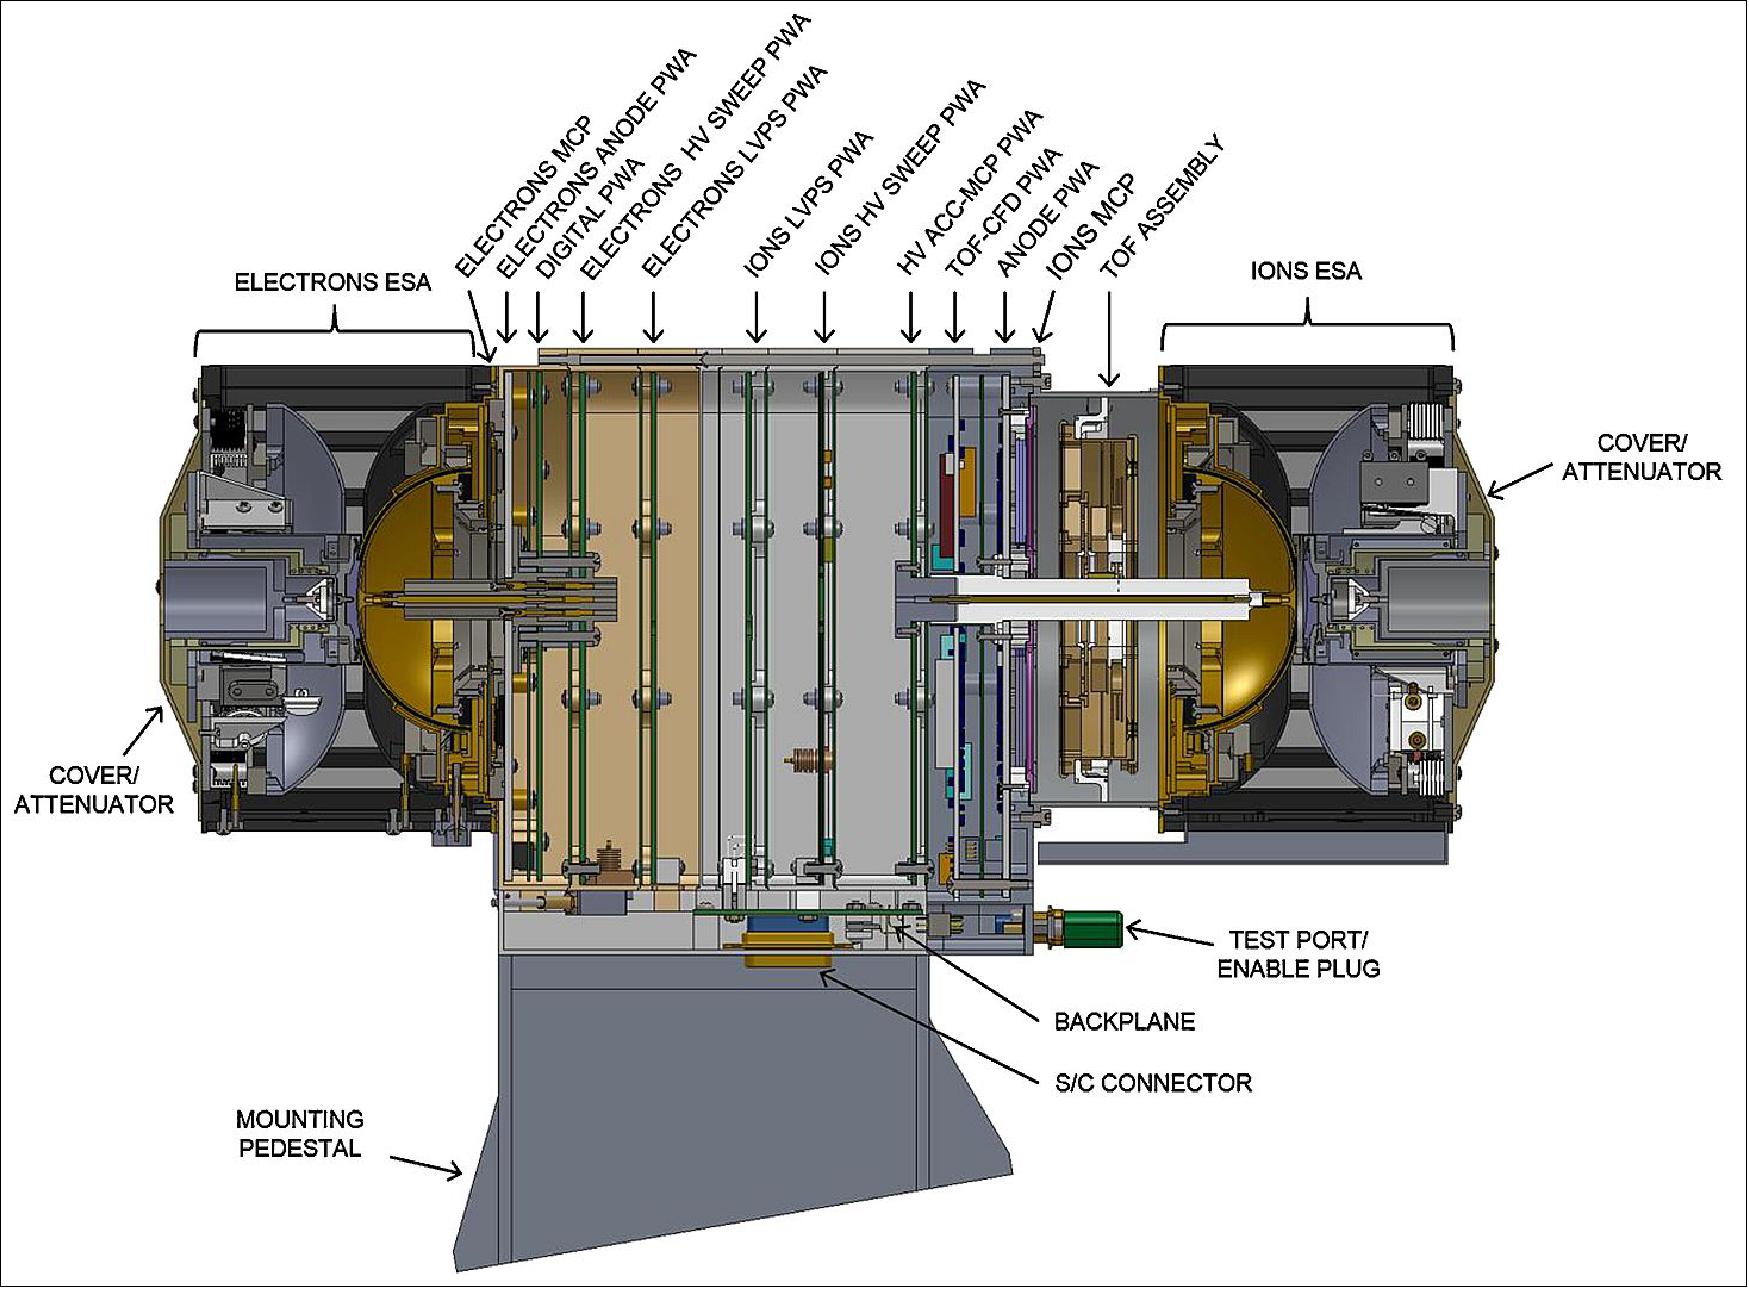
SPAN Thermal: Since the SPAN instruments are in shadow during scientific operations close to the Sun, the thermal design of these sensors is much more straightforward than for SPC. However, this does not mean that it is completely straightforward. Indeed, the SPAN sensors must contend with a somewhat non-intuitive thermal problem. Far from the Sun, the spacecraft must be able to rotate in order to orient the high gain antenna on the anti-ram side of the spacecraft toward Earth for communications. This results in prolonged illumination of the SPAN-B sensor. The level of heat absorbed by SPAN-B must be limited in order to prevent damage to the deployment and attenuator mechanisms in the electron ESA sensor. Unfortunately, treatment of SPAN-B surfaces to reduce absorption of heat far from the Sun when the spacecraft is rotated and the anti-ram side is illuminated results in very low operating temperatures for SPAN-B when it is close to the Sun. Ironically, at closest approach, while the Sun-facing instruments and spacecraft components struggle with extreme high temperatures, SPAN-B risks falling below its minimum operating temperature. As a result, an operational heater was added to SPAN-B.
Science Operations, Data Processing & Data Products:
The SWEAP instrument suite operates autonomously during each solar encounter, with the SWEM controlling each of the SWEAP sensors, formatting data products, archiving high resolution data to internal storage in the SWEM, and transmitting summary data to the spacecraft for quick transmission to Earth following each encounter. As of PDR, the SWEAP Suite was allocated 20 Gbit of data volume per orbit to meet the Level 1 science goals.
Science Operations: SPP runs on a bent-pipe operations scheme, in which the SPP MOC (Mission Operations Center) and the SPP spacecraft will act only as a pass through of the command plans and telemetry to and from the SWEAP Investigation SOC (Science Operations Center). The SWEAP SOC will plan orbital command plans, select full resolution data, data processing, distribution and archiving. The SOC will also be utilized during integration and test activities, mission simulations, and to commission the SWEAP Suite.
In summary, the SWEAP Investigation will obtain the thermal coronal and solar wind plasma observations needed by the scientific community to address these compelling questions. The four SWEAP sensors provide complete measurements from several eV to tens of keV of the velocity distribution functions of electrons and ionized helium and hydrogen (alpha particles and protons) that constitute the bulk of the solar wind and coronal plasma, along with properties of other ions sorted by their mass/charge. Entering a new and harsh environment for the first time, the instruments face technical challenges unlike any other mission to date.
WISPR (Wide-field Imager for Solar Probe)
WISPR is an NRL (Naval Research Laboratory) instrument. The imager is a telescope, which looks off to the side of the heat shield, and will make 2D images of the sun's corona as the spacecraft flies through. But like a medical CAT scan, the orbit of the spacecraft through the corona will enable 3D images and a determination of the 3D structure of the corona. The experiment actually will see the solar wind and provide 3D images of clouds and shocks as they approach and pass the spacecraft. 64) 65) 66)
- NRL is WISPR PI institution for NASA; consortium of US and international science partners
- NRL will develop the WISPR instrument and will operate it after launch
- Builds on successful NRL SECCHI heliospheric imagers on the NASA STEREO mission.
The objectives of WISPR are:
• Understand the morphology, velocity, acceleration, and density of evolving solar wind structures when they are close to the Sun.
• Derive the 3D structure of the solar corona through which in-situ measurements are made to determine the sources of the solar wind.
• Determine the roles of turbulence, waves, and pressure-balanced structures in the solar wind.
• Measure the physical properties of SEP (Solar Energetic Particle)-producing shocks and their CME drivers as they evolve in the corona and inner heliosphere.
WISPR, with a 95° radial by 58° transverse field of view, will image the fine-scale coronal structure of the corona, derive the 3D structure of the large-scale corona, and determine whether a dust-free zone exists near the Sun. Given the tight mass constrains of the mission, WISPR incorporates an efficient design of two wide-field telescopes and their associated focal plane arrays based on novel large-format (2 k x 2 k) APS CMOS detectors into the smallest heliospheric imaging package to date. The flexible control electronics allow WISPR to collect individual images at cadences up to 1 second at perihelion or sum several of them to increase the signal-to-noise during the outbound part of the orbit. The use of two telescopes minimizes the risk of dust damage which may be considerable close to the Sun. The dependency of the Thomson scattering emission of the corona on the imaging geometry dictates that WISPR will be very sensitive to the emission from plasma close to the spacecraft in contrast to the situation for imaging from Earth orbit. WISPR will be the first ‘local’ imager providing a crucial link between the large scale corona and the in-situ measurements.
WISPR Instrument Design
The WISPR instrument concept is in effect a miniaturization of the SECCHI/HI concept with adaptations from the SoloHI design. It is a two-telescope system, similar SECCHI/HI, with an inner telescope extending from 13.5 º to 53º and an outer telescope extending from 50º to 108º (Figure 2, right). The two-telescope implementation is driven by the need to baffle the telescope against the intrusion of two of the FIELDS antennas (Figure 2, left) into the WISPR unobstructed FOV. The instrument uses the heat shield as the first occulter and hence the alignment between the heat shield and the first occulter baffle, F1 is a critical element for the successful control of the stray light. The inner FOV cutoff is set at an elongation of 13.5º from sun center, corresponding to a heliocentric distance of 2.3 Rs at 9.86 Rs perihelion. The cutoff is dictated by two requirements: (1) to remain within the heat shield umbra (8º, including a 2º maximum spacecraft offpoint), and (2) to accommodate the instrument on the spacecraft bus at a reasonable height and with reasonable mass. The overall instrument characteristics are shown in Table 4.
Telescope type | Wide angle lenses, aperture stop placed in front of lens. |
Plate scale | 1.2 – 1.7 arcmin/pixel (inner-outer) |
FOV (Field of View) | 95º radial x 58º transverse, inner field limit 13.5º from Sun center |
Image quality | Predicted RMS spot including allowable tolerances at 20º from boresight: |
Detector | APS (Active Pixel Sensor), 10 µm pitch, 2048 x 1920 pixels |
Baffle Design / Stray Light Rejection | Front heat shield edge, forward baffle and diffraction light trap designed to reject incoming solar radiation, interior baffles and aperture enclosures designed to reject scattered solar radiation from spacecraft, structures, and thermal radiation from antennas. Average predicted stray light: <2 x 10⁻⁹ B/Bs @ 9.86Rs and <2 x 10-12 B/Bs @ 0.25 AU, well below the K+F corona. |
Pointing | Instrument axes aligned to S/C to < 0.5º, F1 and heat shield leading edge placement error < 13 mm. |
Calibration | <20% absolute radiometric, platescale <4%, pointing: accuracy 5 arcmin (3σ), jitter 0.8 arcmin (1σ), windowed stability 1.6 arcmin (1σ) |
Mass | WIM (WISPR Instrument Module) 9.8 kg; Instrument DPU (spacecraft provided) 1.1 kg |
Average power | 7 W (including 4W operational heater power) |
Envelope | WIM module: 58 cm x 30 cm x 46 cm (door closed) |
Average telemetry rate | Allocated data rate 26.6 kbit/s (during 10-day operational periods); 23 Gbit/orbit |
The instrument concept and s/c accommodation are shown in Figure 82. A set of forward occulters (F1-F3) are located on a ledge to reduce the diffraction from the heat shield. An internal baffle assembly I1-I7 reduces this stray light component further as well as stray light diffracted from the radio antennas and other spacecraft structures. A set of other baffles are located at the apertures of the two telescopes to prevent any further reflections from reaching the detectors. Because of the orbit profile, the WISPR stray light rejection requirements vary as a function of elongation angle and heliocentric distance by about an order of magnitude. The most stringent requirement is 1.8 x 10⁻¹² MSB (Mean Solar Brightness) at the outer edge of the FOV (90º elongation) at the largest distance from the Sun (0.25 AU).
The sophisticated baffle design allows WISPR to meet this requirement and allows for a high SNR (Signal-to-Noise Ratio) imaging, ranging from 20 at the inner FOV at closest perihelion to 5 at the largest distance and FOV angles. The detectors are 2048 x 1920 format APS (Active Pixel Sensor) CMOS devices developed for the SoloHI (Solar and Heliospheric Imager) instrument program. 67) APS devices are much less susceptible to radiation damage than the more common CCD devices and are therefore the best option for this mission. They also come with significant savings in terms of power and mass. These devices are described in more detail in the following reference. 68) The devices are cooled to -60ºC via a passive radiator. A one-shot door is used to protect the baffles and optics from contamination during ground operations, launch, and early flight operations.
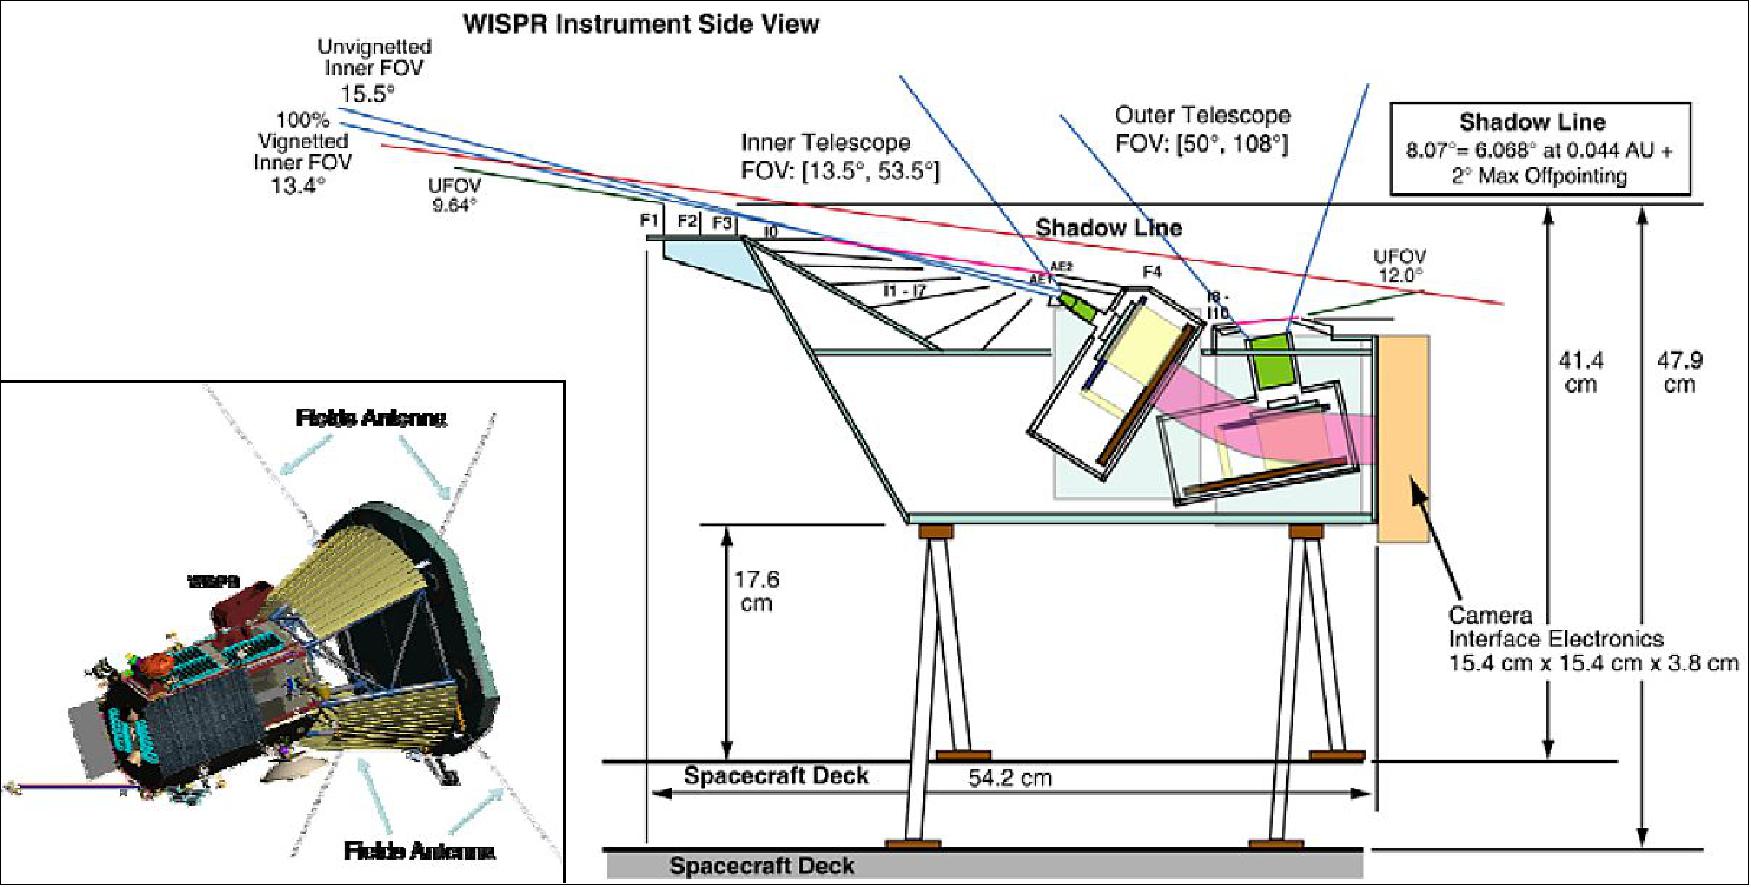
Optical Design: The WISPR optics comprises two lens assemblies with the parameters given in Table5 and shown in Figure 83. Both designs are based on the SECCHI/HI optics adjusted to the F# required for the WISPR application. The resolution is optimized for the FOV center, 33.5º and 79º, for the inner and outer telescope, respectively. Glasses such as LAK9G15, SF4, and SF6 were assumed for this design but the adoption of BK7 for the first lenses is being considered, because it may be more resistant to dust impacts . As can be seen from Table 2, the current optical design is excellent. It provides both fast lenses (low F#) and high spatial resolution (~2 pixels) for the inner and outer telescopes, respectively. This means that WISPR is potentially capable of capturing images at spatial resolutions of <2 arcmin (2200 km or ~ 3 arcsec from 1AU) which are comparable to eclipse imaging from Earth. This is truly remarkable for a wide-field coronal telescope and the capability will be exploited as mission and solar condition allow. However, the current observing plan is to obtain images with 2 x 2 binning, as is done for SECCHI/HI, to increase the SNR and reduce the telemetry load. Higher image binning (4 x 4) will be required at large heliocentric distances to maintain an SNR of 5 at the outer edge of the FOV.
| FOV | Spectral range (nm) | Entrance pupil (nm) | F# (F number) | No of lenses | RMS Spot Size (µm) |
Inner Telescope | 40º x 40º | 490-740 | 7.31 | 3.83 | 5-element | 19 |
Outer Telescope | 58º x 58º | 475-725 | 8.08 | 4.04 | 6-element | 20 |
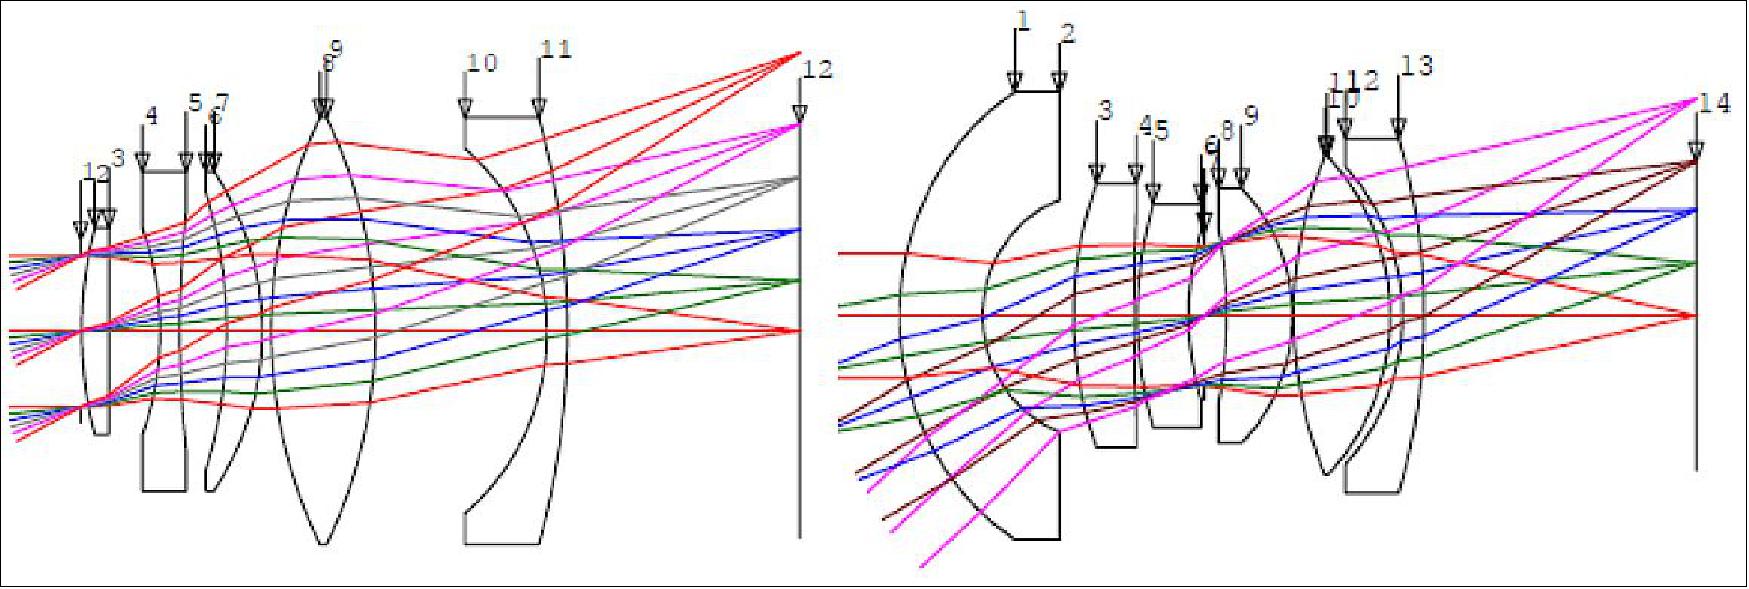
Stray Light Control: The control of stray light due to spacecraft accommodations has been the major focus of the WISPR team during the preliminary design phase of the project. The AO strawman payload outlined a very optimistic imager concept with a single wide-filed lens and an unobstructed 180º FOV because it did not take into account the accommodations of the radio antennas in the forward section of the s/c and into direct sunlight. As a result, two of these antennas impinged either directly into the WISPR FOV or extended into the unobstructed FOV allowing diffracted sunlight to enter the aperture at unacceptable levels. In addition, the tips of the antennas will get so hot (~1800ºC) that they will radiate into the visible creating another (and novel) source of stray light. The only solution for allowing the instrument to operate was to baffle directly those two sources of stray light. In order to achieve this without sacrificing most of its FOV, the WISPR single lens was split into two separate imaging assemblies.
This change allowed the design of peripheral baffles that capture the diffracted and radiated light from the antennas and reduce the stray light to acceptable levels as shown in Figure 84. This is a preliminary result, however. The optimization of the peripheral baffle system is still under way in an effort to reduce the stray light further within the outer telescope FOV. The stray light modeling is performed via Monte-Carlo techniques with the FRED Optical Engineering software using a CAD model of the instrument and FIELDS antennas. This approach allows not only the modeling of the antenna diffracted and radiated light but also the testing of various coatings for the baffle surface and even the modeling of the effects of dust impacts during the mission. These new stray light modeling methods, driven by the need to accommodate occulting-like imagers in crowed s/c environments, far exceed the corresponding modeling efforts in past coronagraphs and imagers where tight controls of structure intrusions in the unobstructed FOVs were possible. They demonstrate that visible light imagers can be accommodated and operate safely even when structures intrude into their direct FOVs.
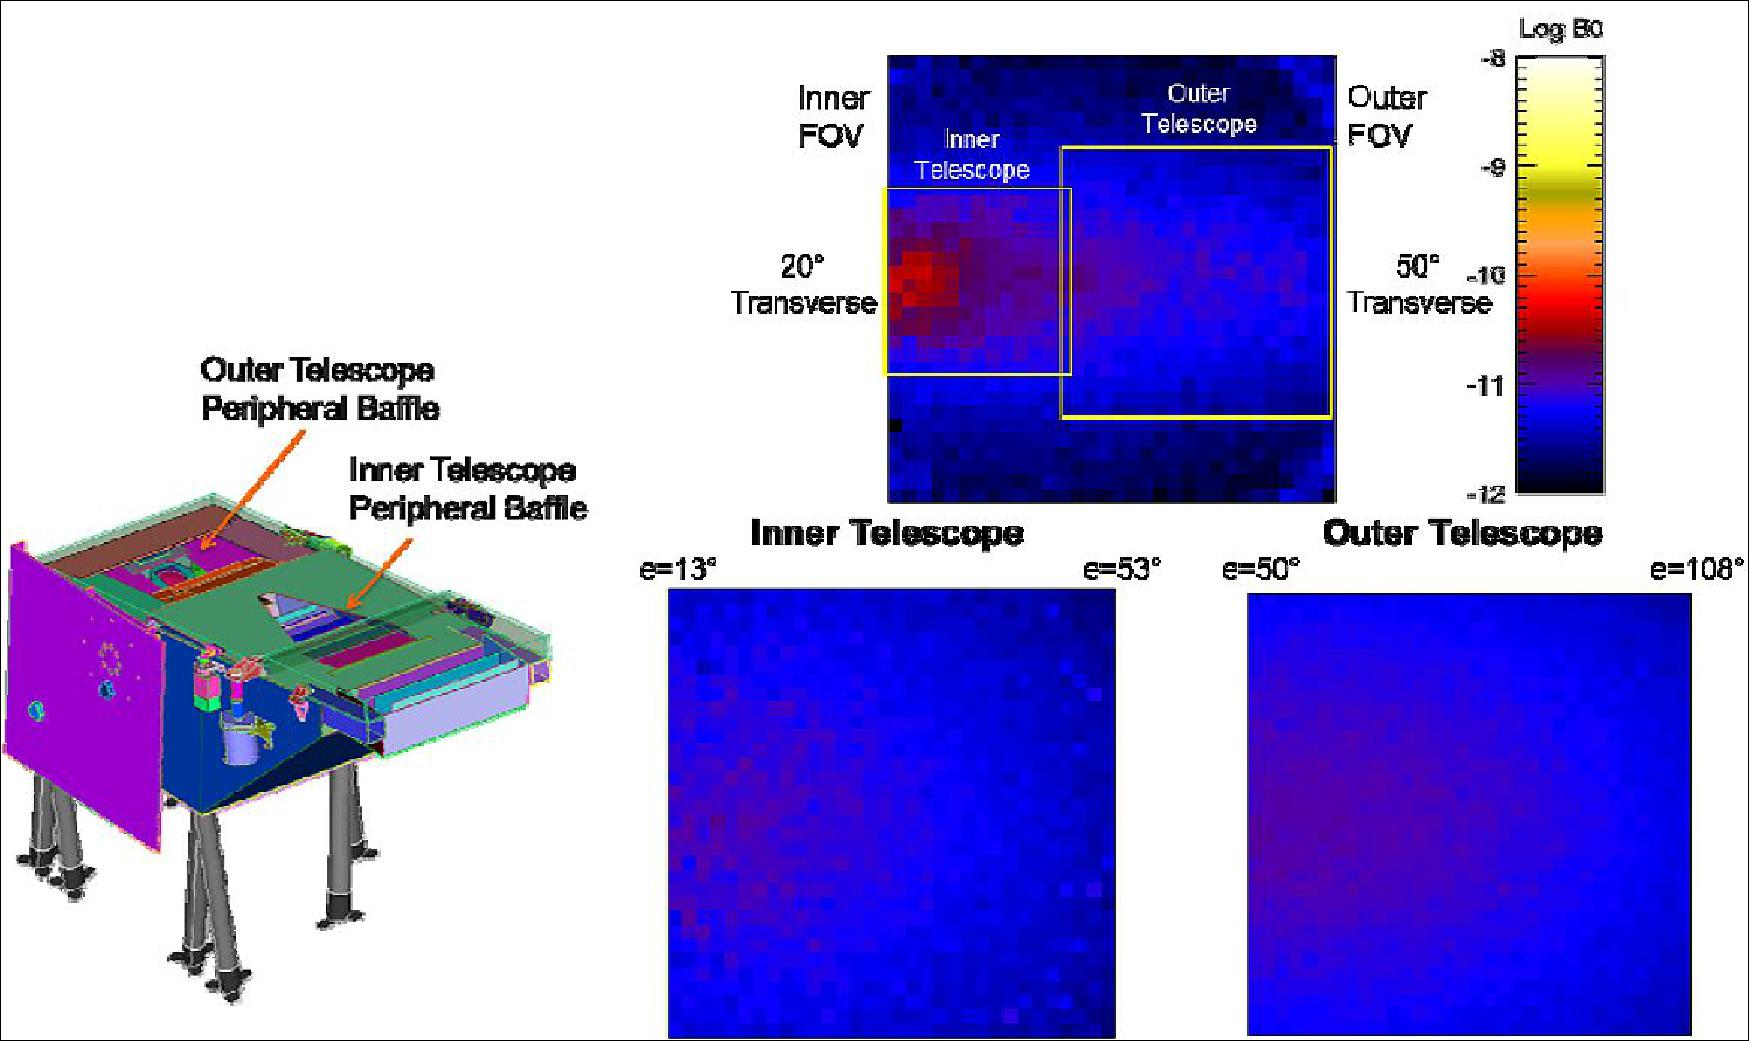
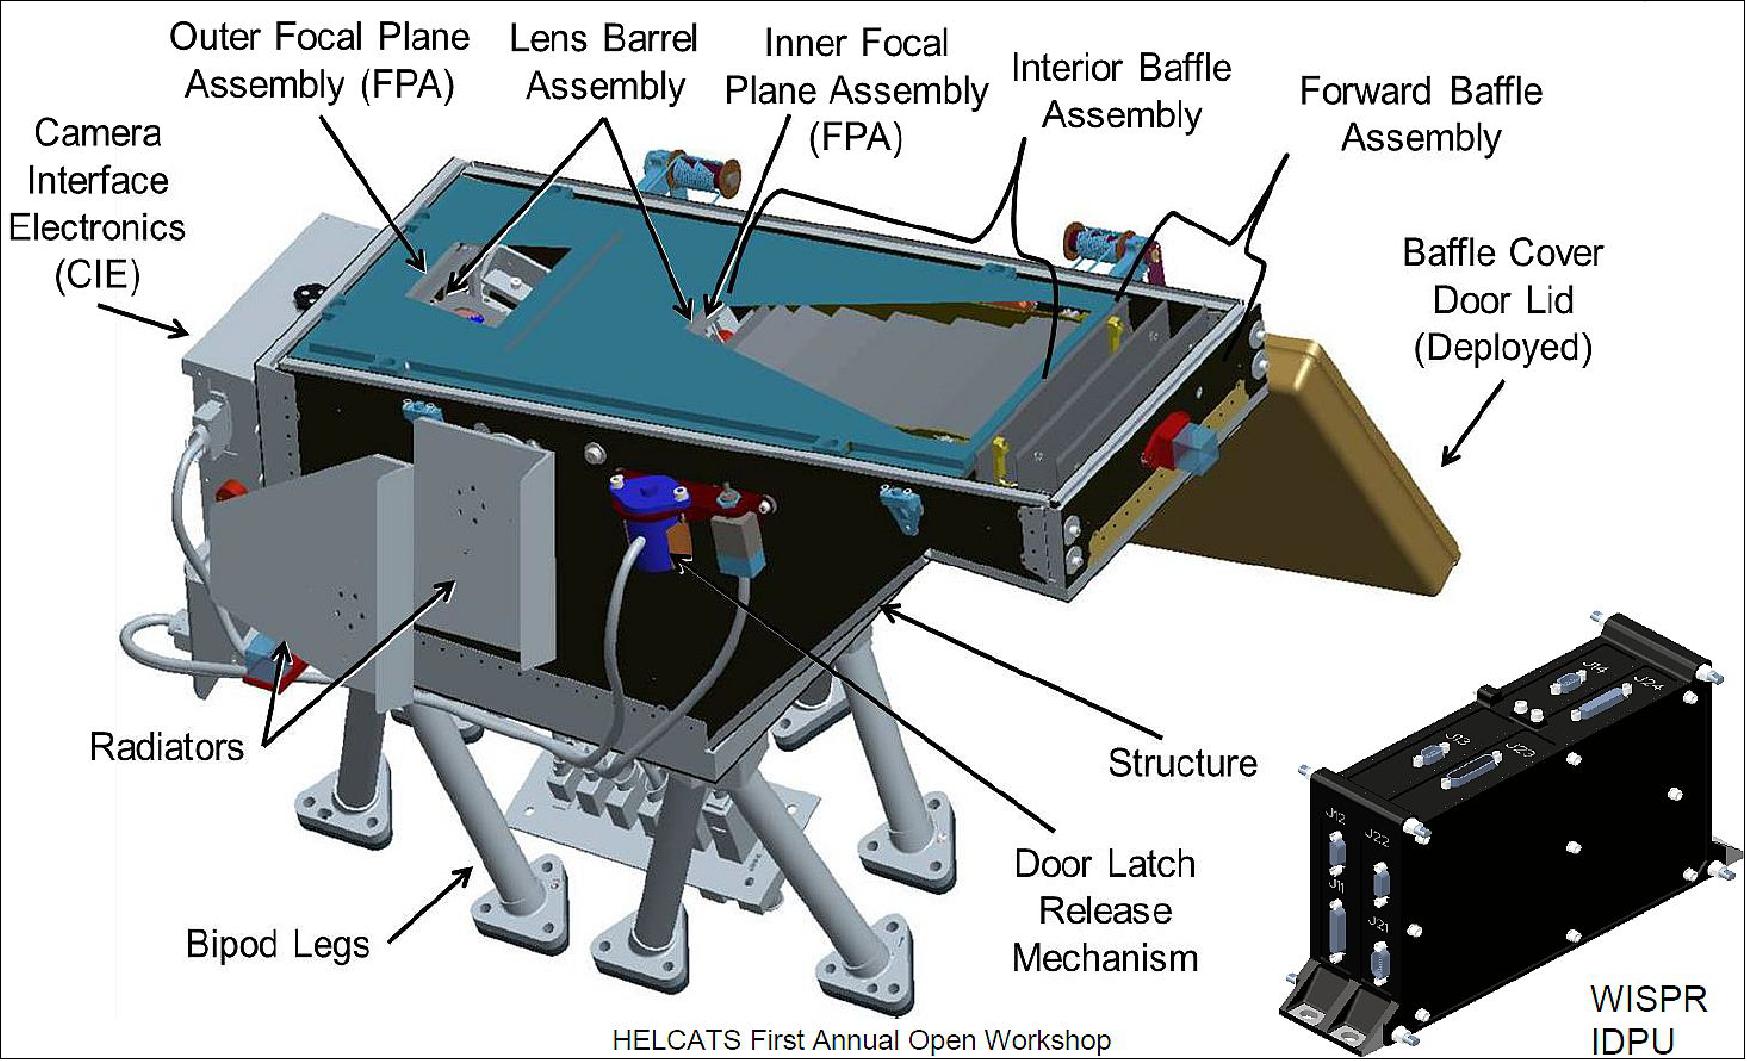
Detector and Electronics: The WISPR electronics are divided into two components: the WIM ( WISPR Instrument Module) which controls the two cameras, the door deployment and the operational heaters, and the IDPU (Instrument Data Processing Unit), which passes the commands to the WIM and receives the camera data from the WIM. The WIM controls the two cameras, receives the analog data, digitizes it to 14 bits, removes cosmic rays, and adds individual images together to increase SNR. The functional block diagram is shown in Figure 86. The IDPU is being developed by APL based on specifications provided by the NRL team. The WISPR CIE (Camera Interface Electronics) is an adaption of the SoloHI electronics. The data is transferred from WIM to IDPU via a Camera-Link interface, is compressed and packetized and is then transferred to the onboard SSR (Solid State Recorder) via SpaceWire.
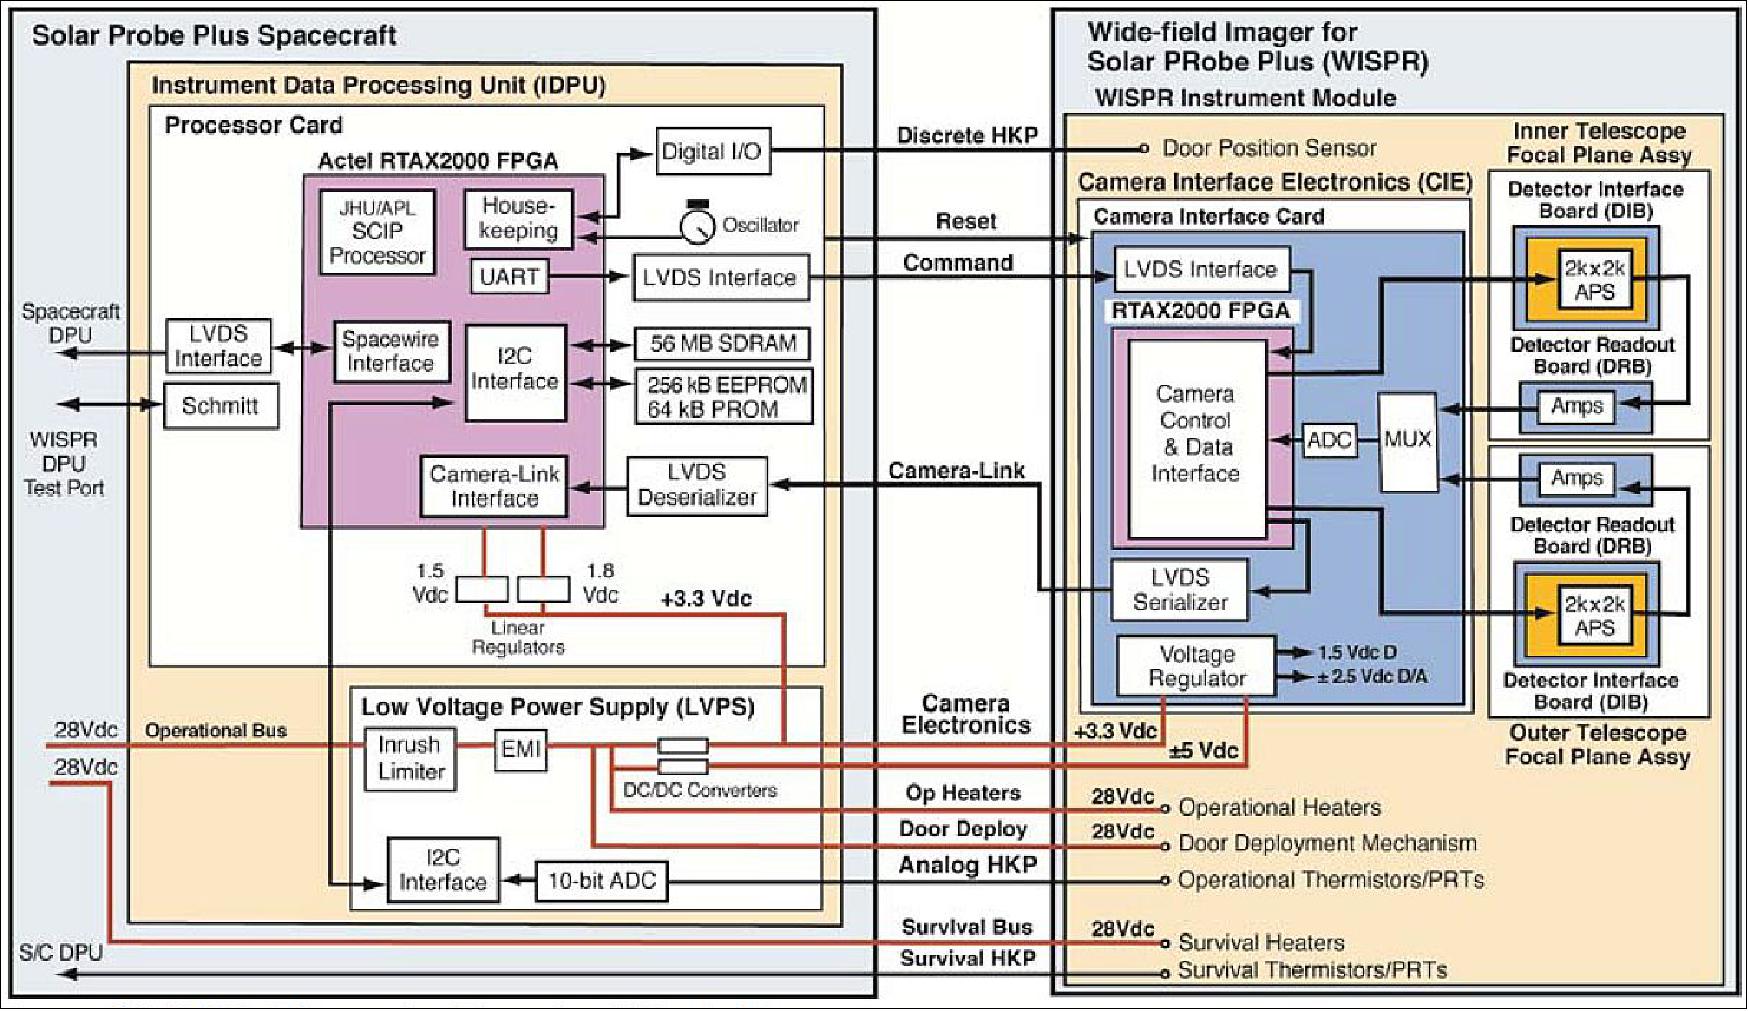
Testing and Modeling of High Speed Dust Impacts on the WISPR Optics: The orbital velocities at the SPP perihelia are very high (~170 km/s) and therefore the distribution of the kinetic energy of the dust particles and their fluence have to be accounted for in the WISPR design. The mass and size distributions are not known but models suggest that the majority of the particles will have diameters < 10 µm. For example, the APL/UTEP model predicts about 100 impacts from 10 µm particles and 1000 impacts from 0.1 µm particles at the heat shield during the seven years of the mission. Dust impacts pose two risks for WISPR: (1) they can damage the edges of the forward baffles and thus increase the stray light levels and, (2) they can damage the front lens surfaces and lead to increased stray light by pitting and/or cratering the glass surface. Larger particles can of course break the lens but the probability of a catastrophic hit is exceedingly small (<10-5 for >1mm particle).
There is very little information on the effects of high velocity impacts on optical systems since such environments have not been encountered before. To understand the effects of dust on instrument performance, the WISPR team has established a glass testing and modeling program during the design phase as part of the contribution of the WISPR Co-I team in Germany (V. Bothmer, PI). Although there is no dust accelerator that can accelerate particles to 100s km/s velocities, the Dust Accelerator at the MPIK (Max-Planck Institute für Kernphysik) in Heidelberg is potentially capable of up to 60 km/s velocities. The facility was used in October 2012 to test three different candidate glass materials for the WISPR optics; BK7, BK7 with a diamond coating, and Sapphire. The tests were performed with a variety of iron particle distributions (0.5 – 3 µm) and speeds (0.5 - 8 km/s) against three different impact angles (0º, 45º, 70º) (shaded area in Figure 87).

The examination of the impacted glasses showed that sapphire was the most impact-resistant material with very small (2 µm) and symmetric crates. The diamond-coated BK7, on the hand, did not perform well. The impact caused a halo around the impact crate. The project believes that the halo is the result of the detachment of the coating locally due to the heat produced by the impact. The regular BK7 has relatively small craters (~5 µm diameter). The spall diameters are very consistent with the APL/UTEP model and give confidence in the overall SPP project dust analysis and rick mitigation procedures.
An automated software program was developed to measure the sized and numbers of craters in the images to assess the extent of the damaged area. The results (Figure 88) show a relatively linear damage increase with dust speed. Based on these results, we decided to adopt the regular BK7 as the baseline for the WISPR optics.
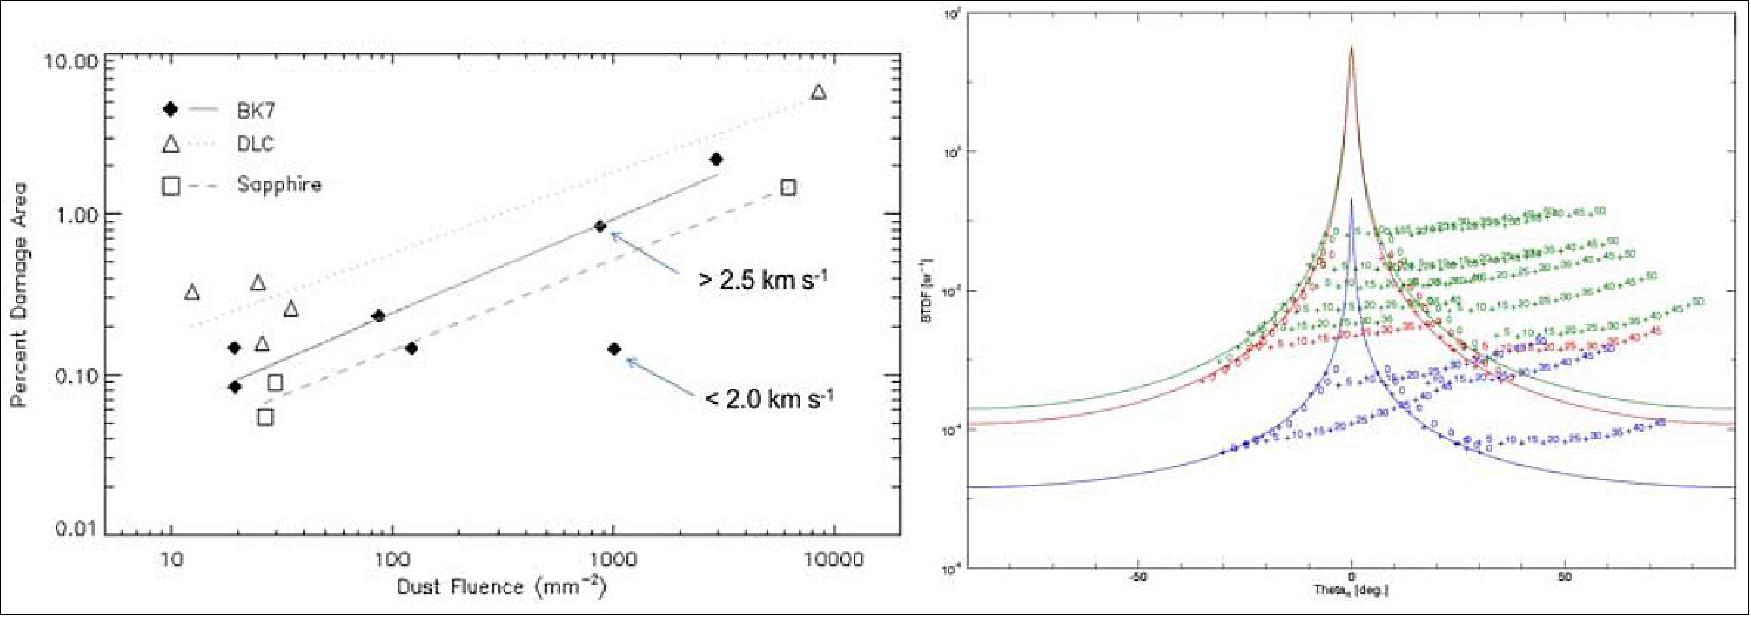
To study the effect on the imaging performance we then had to measure the change in the BSDF (Bidirectional Scattering Distribution Function) or Harvey-Shack function compared to the BSDF of the undamaged glass. So, the project measured the BTDF (Bidirectional Transmittance Distribution Function) of the damaged glasses and used the percent damaged area to make a linear fit to the BTDF (Figure 88, right). The measurements revealed that the model BK7 used in FRED was too conservative. We adjust those curves and run our stray light calculations for pristine and damaged WISPR lenses to calculate the beginning- and end-of-life performance of the optics. The results are shown in Figure 89.
To summarize, the dust testing and subsequent analysis has allowed the team to (1) validate the APL/UTEP model at those velocities and accepted for evaluating the risk for higher speeds, (2) reject exotic materials and coatings as an alternative to regular BK7, (3) develop a realistic BSDF model to evaluate the stray light effects of dust impacts on the imaging performance, and (4) get an estimate on the approximate damaged area of the WISPR optics. The team has kept the option open to return to MPIK for one more round of testing of either the flight glass or possibly a recently-identified ceramic glass material.
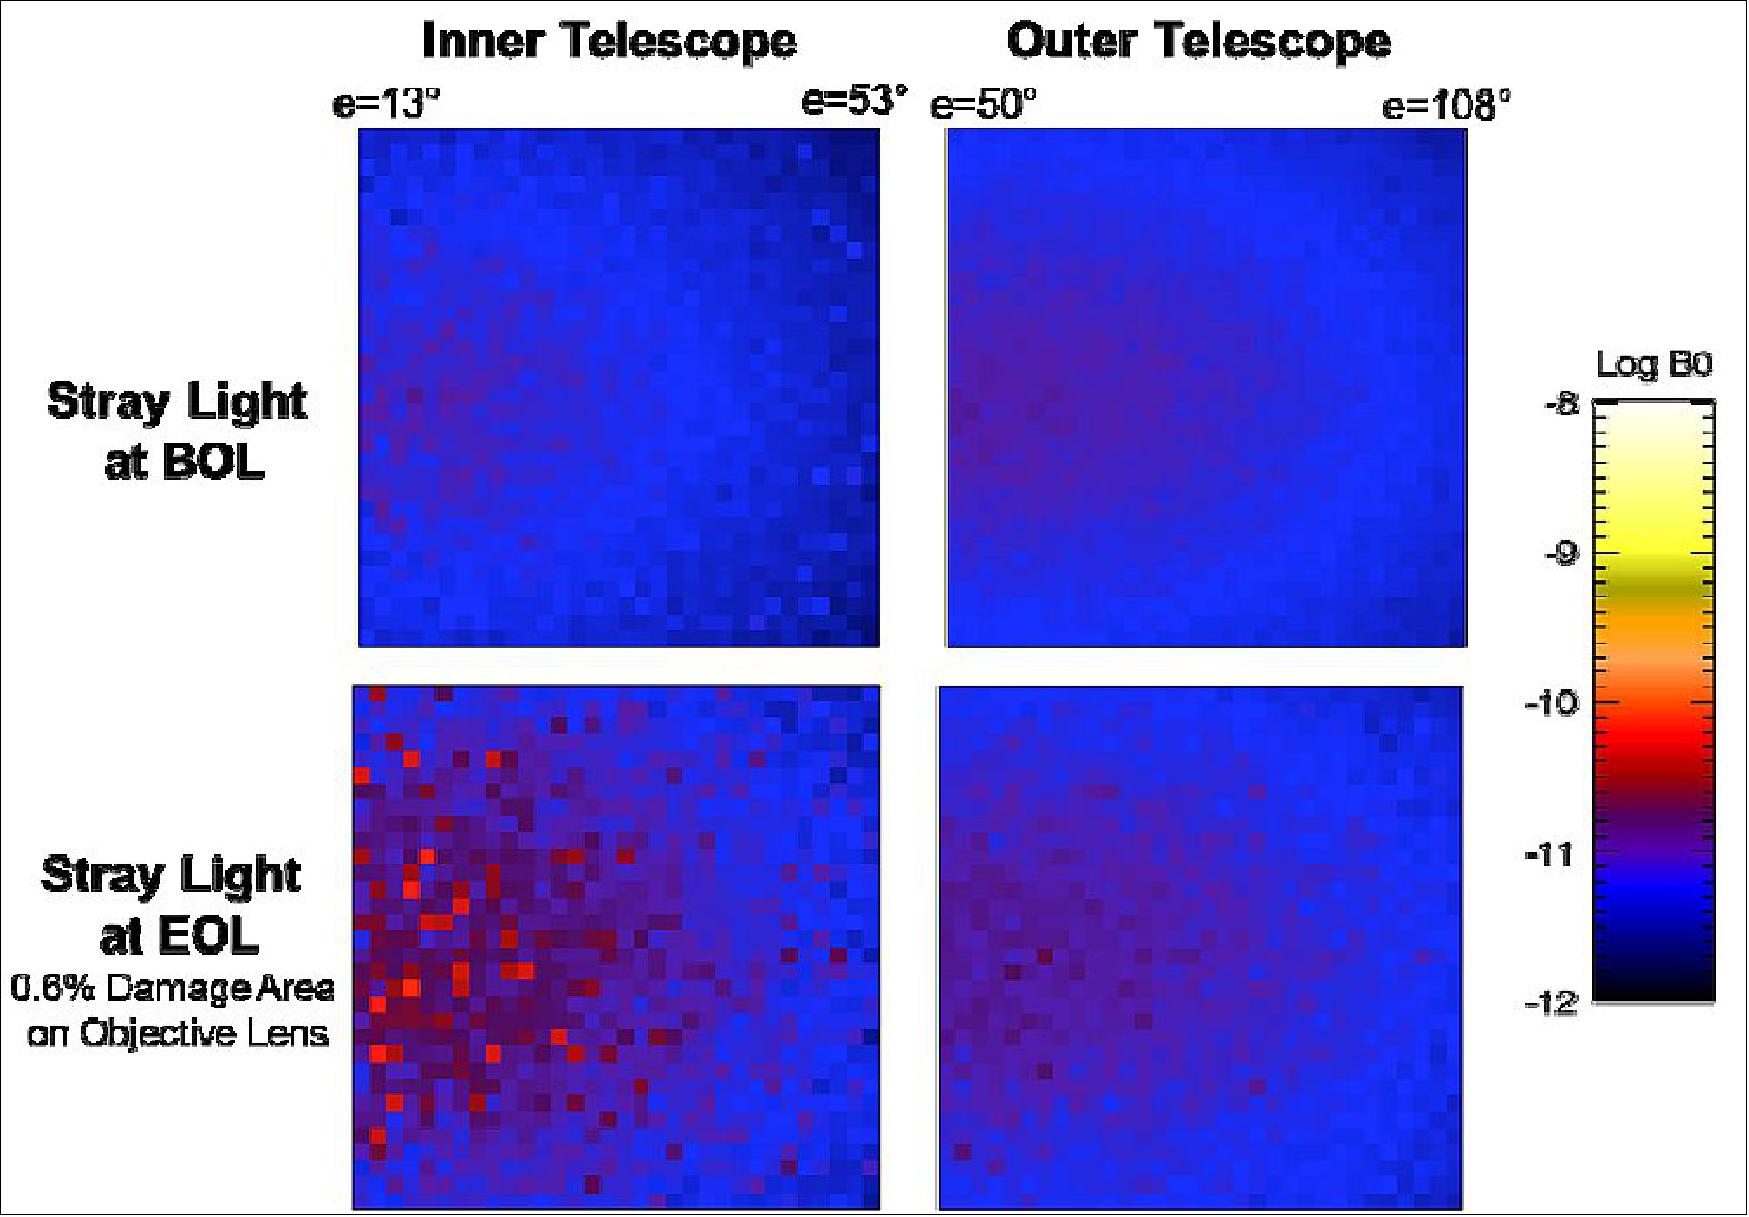
WISPR Science Overview (Ref. 69):
• Wide-Field, Visible Light Imager : 13.5º - 105º from the Sun
• WISPR will map the morphology, velocity, acceleration and density of evolving solar wind structures when they are close to the Sun, as they approach, and then as they pass over the spacecraft
• Small density “blobs” accelerate to 30 Rs – is this occurring all the time?
• Shocks are seen ahead of CMEs – When do they form and are they the source SEPs (Solar Energetic Particles) ?
• Streamer belt has longitudinal density fluctuations – What is this due to?
Summary:
• WISPR will image:
- Slow and fast solar wind structures and fluctuations directly
- CMEs /Coronal Mass Ejections) and shocks and follow their propagation, evolution, and connection to the site of production of SEPs
• WISPR will measure electron density turbulence:
- Fast cadence readout mode to generate power spectral density to compare to in-situ observations of density and magnetic field spectral density.
• WISPR provides the links between the:
- Solar wind structure and SPP in-situ instruments
- Solar Orbiter and Solar Probe Plus missions.
ISIS-EPI (Integrated Science Investigation of the Sun - Energetic Particle Instruments) / ISOIS
The ISIS instrument is being developed at SwRI (Southwest Research Institute), San Antonio, TX, PI: David McComas. The objective of ISIS-EPI is to find the sources and acceleration mechanisms of solar energetic particles that are dangerous for human space explorers and can adversely affect our highly technology-based lives here on Earth. 70) 71)
ISIS-EPI will measure key properties of the accelerated particles ejected from the Sun. The ISIS-EPI low energy instrument measures the composition and intensities of protons and heavy elements as well as energetic electrons in multiple directions at the lower energies where the acceleration processes begin, while the ISIS-EPI high energy instrument measures the energy spectra, composition, and angular distributions of protons, heavy elements and electrons at the higher, more hazardous energies.
• Determine in both gradual & impulsive Solar EP events:
- Energy spectra
- Composition (electrons, protons, major heavy elements)
- Timing
- Pitch angle distributions
• Measure 3He as a key indicator of impulsive events
• Measurements of other populations (CIRs, ACRs, and GCRs) provide important new information on the radial dependences of these particles
ISIS Science Requirements and Performance
ISIS provides comprehensive measurements of the energy spectra, anisotropy, and composition of suprathermal and solar energetic ions from ~0.02–200 MeV/nuc, as well as the energy spectra and arrival direction of ~0.025–6 MeV electrons (energy ranges indicate expected performance (Figure 90). The ISIS driving requirements were identified in the original ISIS proposal to NASA and have been vetted and agreed to through the development of various SPP Requirements documents. By combining measurements with other SPP instruments and from instruments on other spacecraft, ISIS addresses key questions concerning the origin, acceleration, and transport of different types of inner heliospheric particle populations, including those associated with CIRs (Corotating Interaction Regions), ACRs (Anomalous Cosmic Rays) and GCRs /Galactic Cosmic Rays). During the course of the SPP mission, ISIS will measure a sufficient number of impulsive and gradual SEP events (Figure 91) to meet all of its scientific objectives. Driving requirements for key instrument functional parameters are provided in Table 6; we note that while meeting these requirements is adequate to achieve all of our scientific objectives, the expected performance is even better.
Functional parameter | Measurement requirements |
Energy range | e-: <0.05 to >3 MeV; p+/ions: <0.05 to >50 MeV |
Energy binning (resolution) | >6 bins/decade |
Cadence | e-: <1 s for selected electron rates; p+/ions: 5 s for selected ion rates |
FOV (Field of View) | >π/2 ster coverage in both sunward and anti-sunward hemispheres, including coverage within 10 degrees of the nominal Parker spiral field direction at perihelion |
Angular sectoring | e-: <45º sectors; p+/ions: <30º sectors |
Composition | At least H, He, 3He, C, O, Ne,Mg, Si, Fe |
Max intensity <1 MeV | >106 particles cm-2 sr-1 s-1 |
Max intensity >1 MeV | >5×10⁵ particles cm-2 sr-1 s-1 |
Figure 91 shows that the numbers of gradual and impulsive SEP (Solar Energetic Particle) events expected to be observable with EPI-Hi during the SPP prime mission, as a function of particle fluence and heliocentric radius, are more than sufficient to address all the science questions discussed above and to enable great discovery science on the SPP mission.
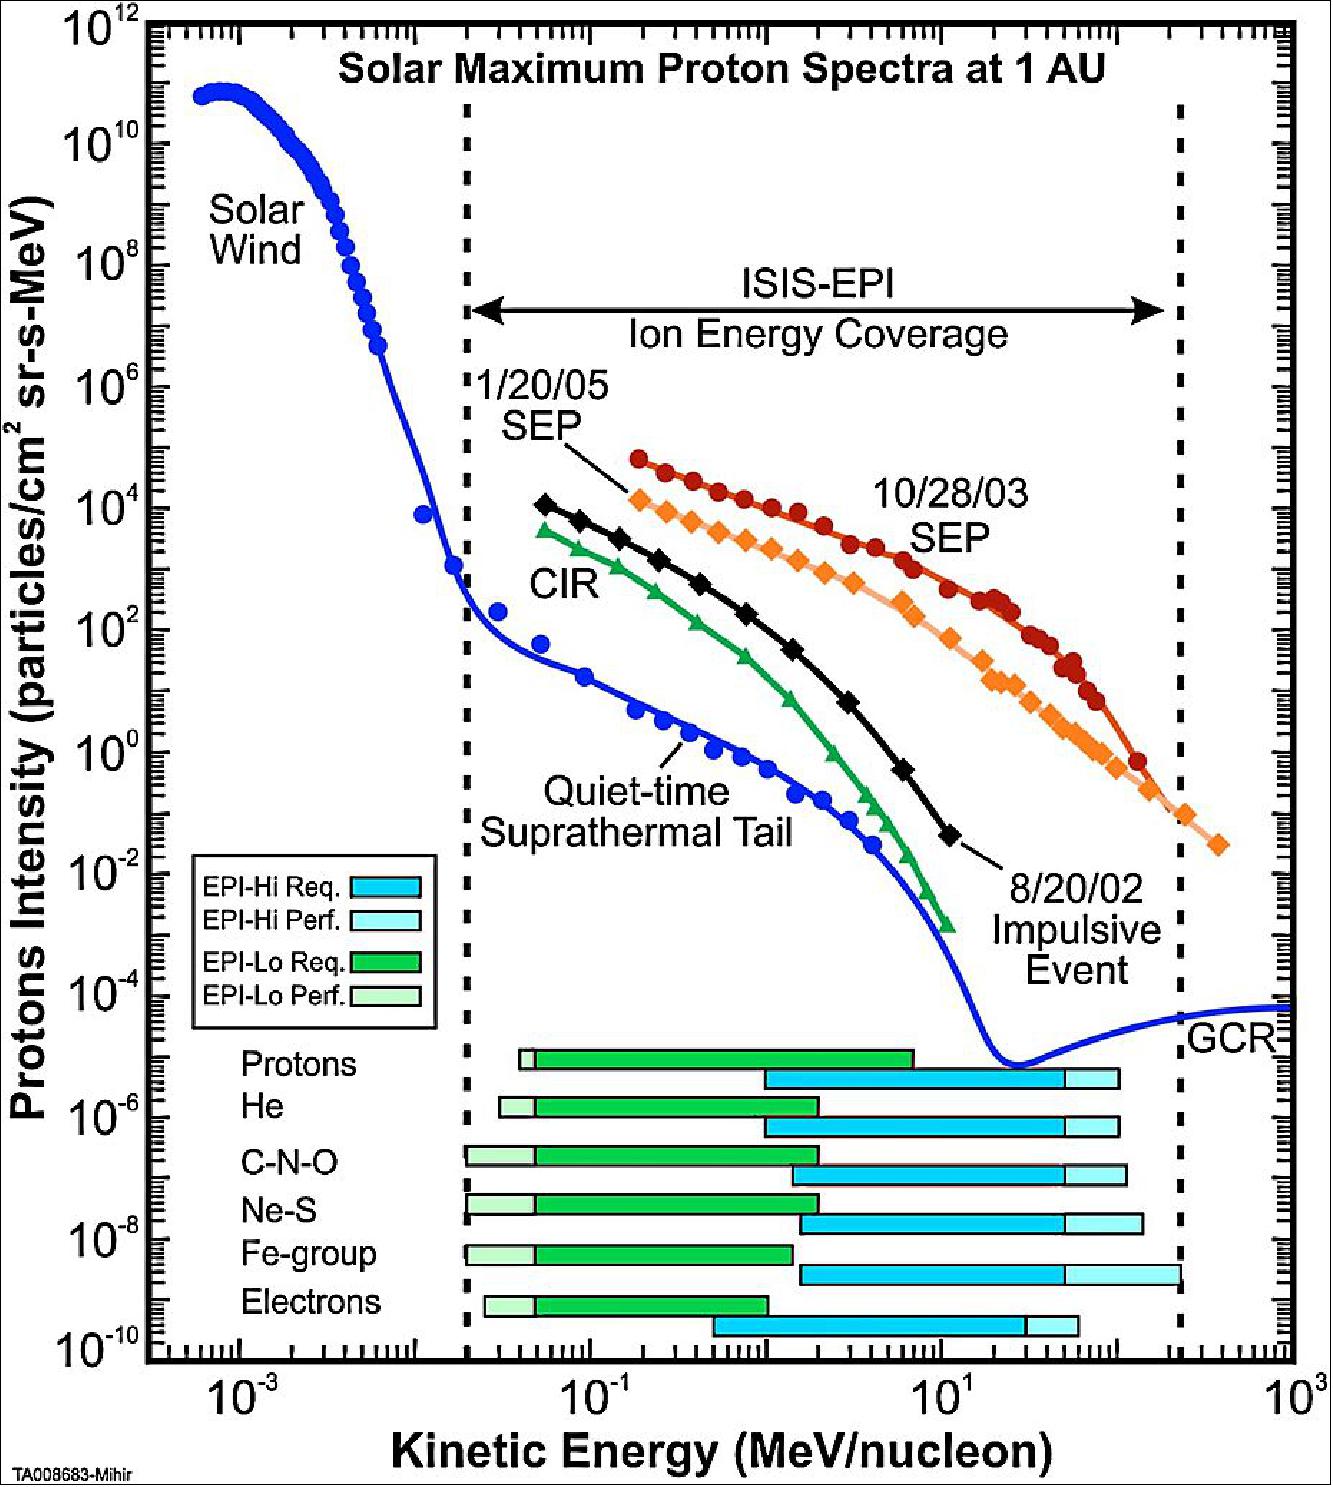
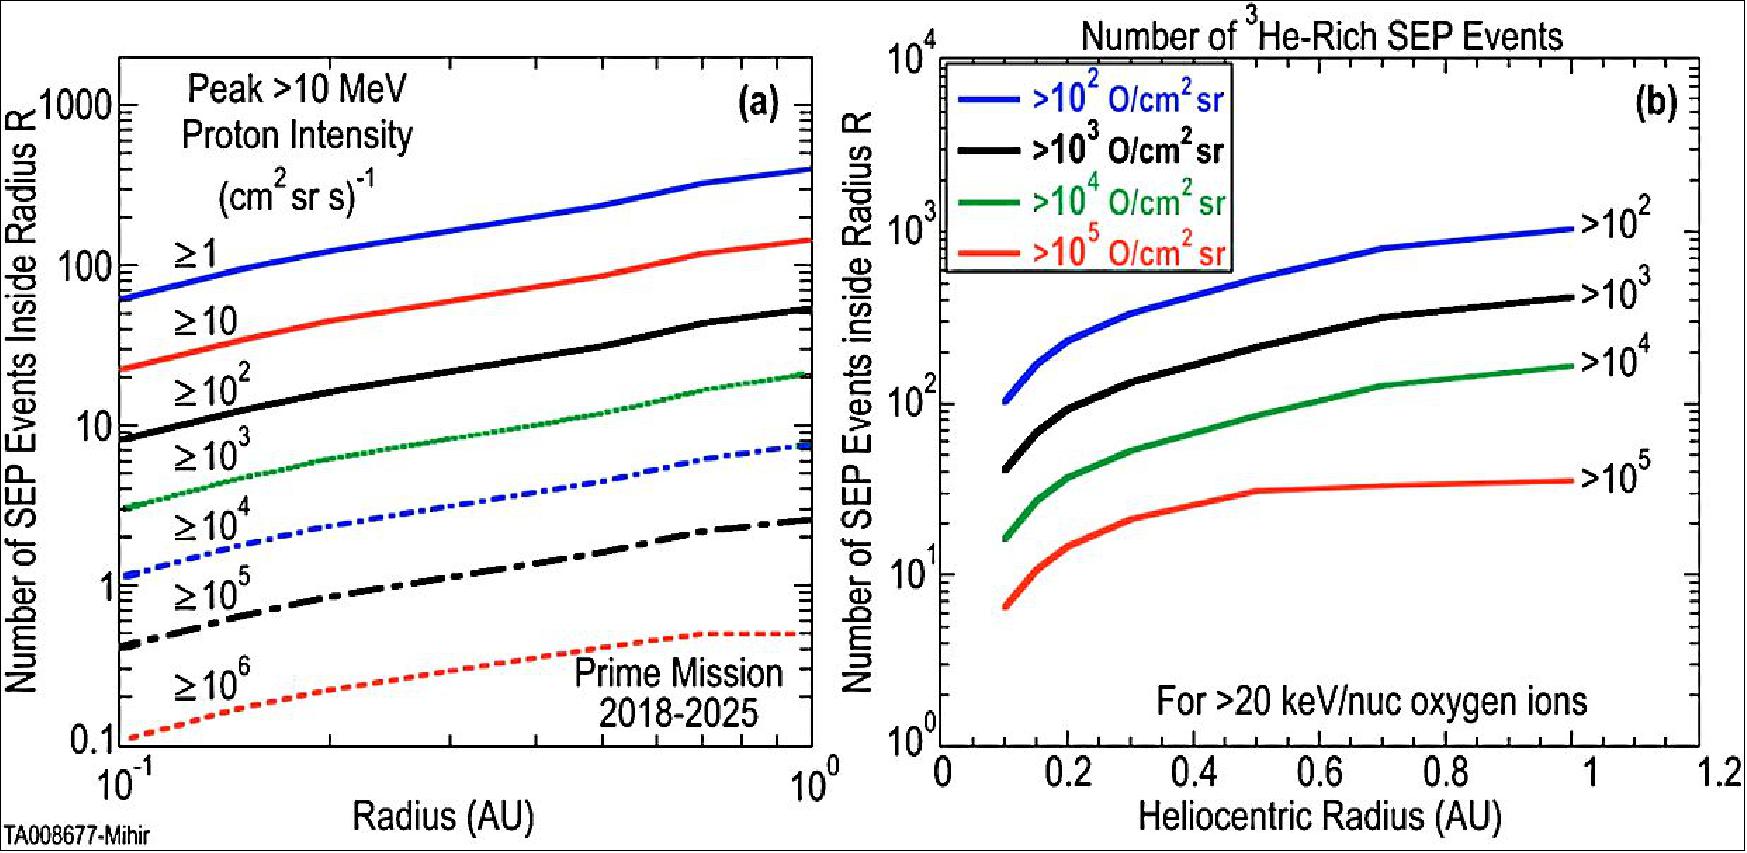
ISIS Suite Overview:
The ISIS Energetic Particle Suite measures energetic electrons, protons, and heavy ions across a broad range of energies. To provide this wide coverage, ISIS includes two instruments that contain multiple sensors with detectors optimized for various parts of the energy measurement range. The suite combines EPI-Lo and EPI-Hi mounted together on the ISIS Bracket (Figure 92). ISIS is mounted at the aft end of the ram side of the SPP spacecraft providing an open FOV toward the direction of the nominal Parker spiral over much of the solar encounter phase, while staying within the umbra of the SPP TPS (Thermal Protection System).
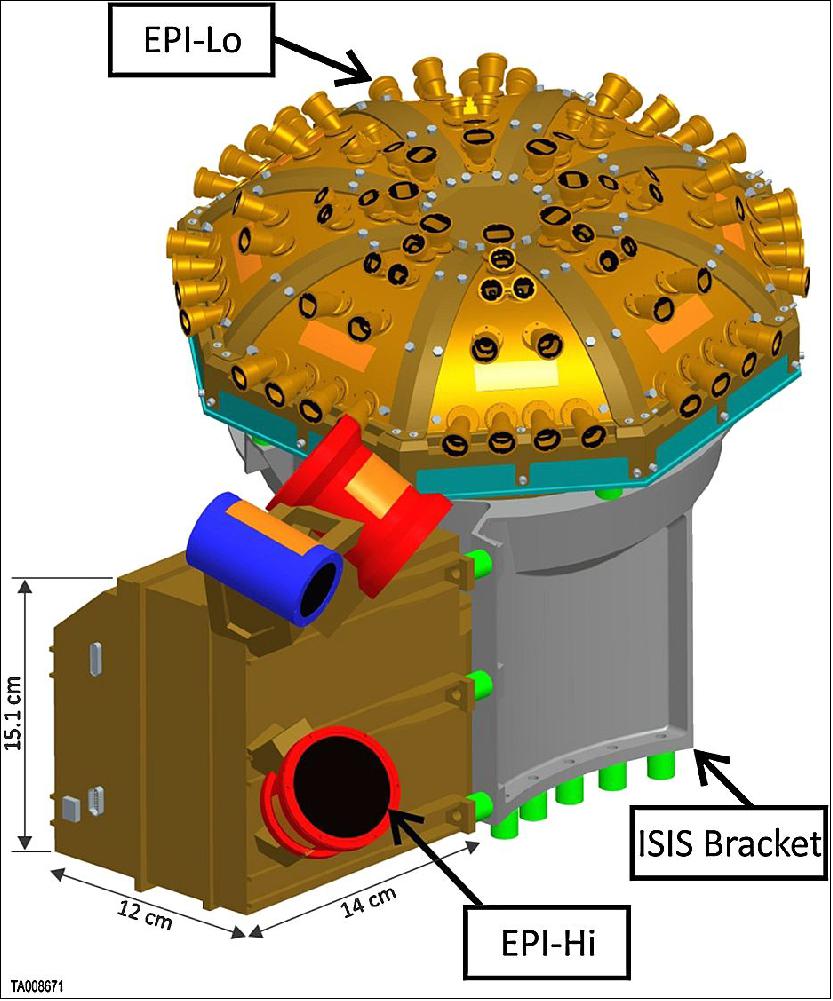
EPI-Lo (Figure 93) measures energetic ions from 0.02 MeV/nuc to ~15 MeV total energy and energetic electrons from 25–1000 keV. To provide a large FOV with hemispherical coverage, EPI-Lo has eight wedges. Each wedge has 10 apertures that collimate energetic particles into pathways through the electrooptics, which allows their speed and energy to be measured while also registering which aperture they passed through. The eight sensor wedges are serviced by an electronics box that contains the Event Board and the Power Board. The Event Board contains the analog and digital processing circuits to record the events and communicates to the spacecraft through command and telemetry channels. The Power Board contains both the low voltage power converters as well as the high voltage power required for the sensors.
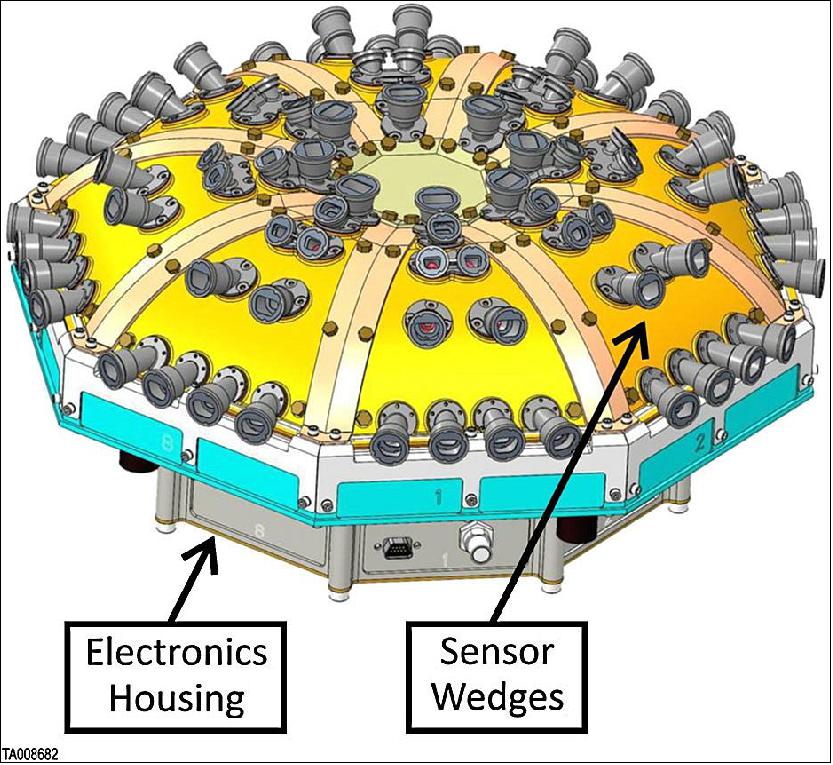
EPI-Hi (Figure 94) measures energetic protons and He nuclei from ~1 to ~100 MeV/nuc (and higher energies for heavier elements) and energetic electrons from ~0.5 to ~6 MeV. To cover this energy range, and to provide wide FOV coverage, EPI-Hi has three telescopes, a double-ended high energy telescope (HET), a double-ended LET1 (Low Energy Telescope), and a single-ended LET2 (Low Energy Telescope). These telescopes are mounted on the EPI-Hi Electronics Box, which contains an analog and digital processing electronics board for each telescope; a detector bias power supply; a digital processing unit for the instrument to coordinate its operations and communicate by command and telemetry channels with the spacecraft; and a low voltage power supply.
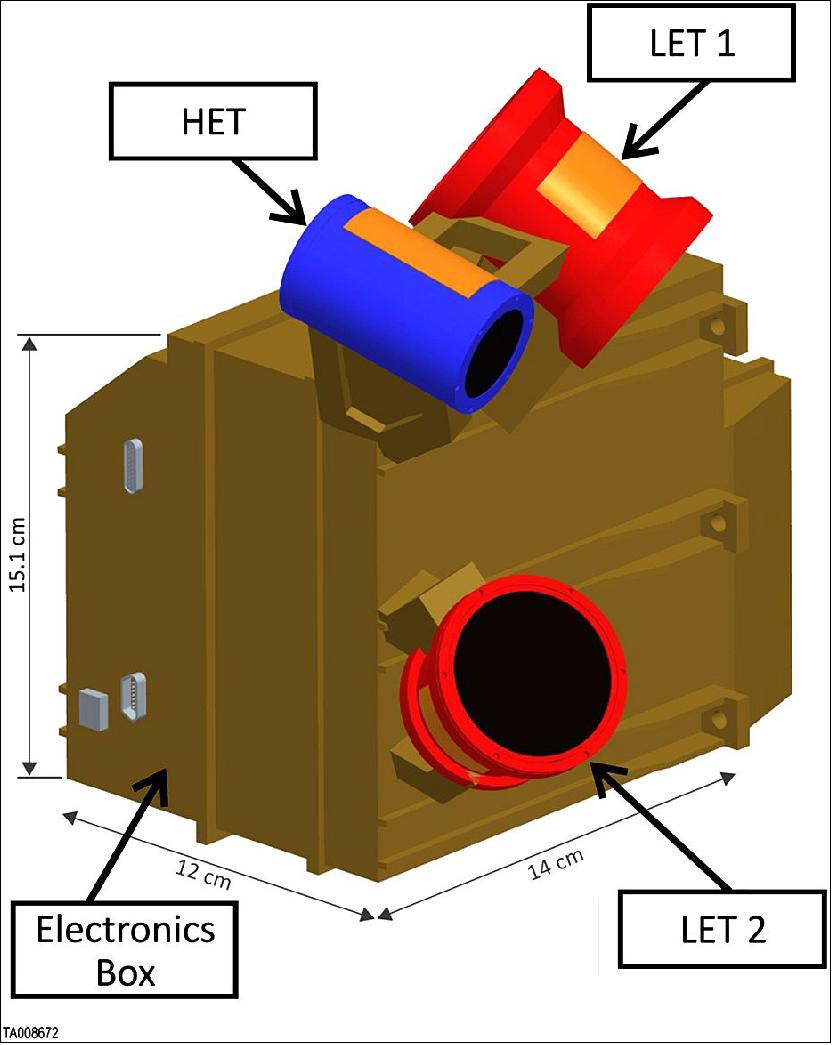
ISIS is located as far aft on the spacecraft body as possible, on the ram side, just inside the umbra line (Figure 95). This provides protection from direct solar heating, but still allows ISIS to view within 10º of the Sun-Probe line, thereby providing access to the nominal direction of the Parker Spiral magnetic field over much of the solar encounter phase.
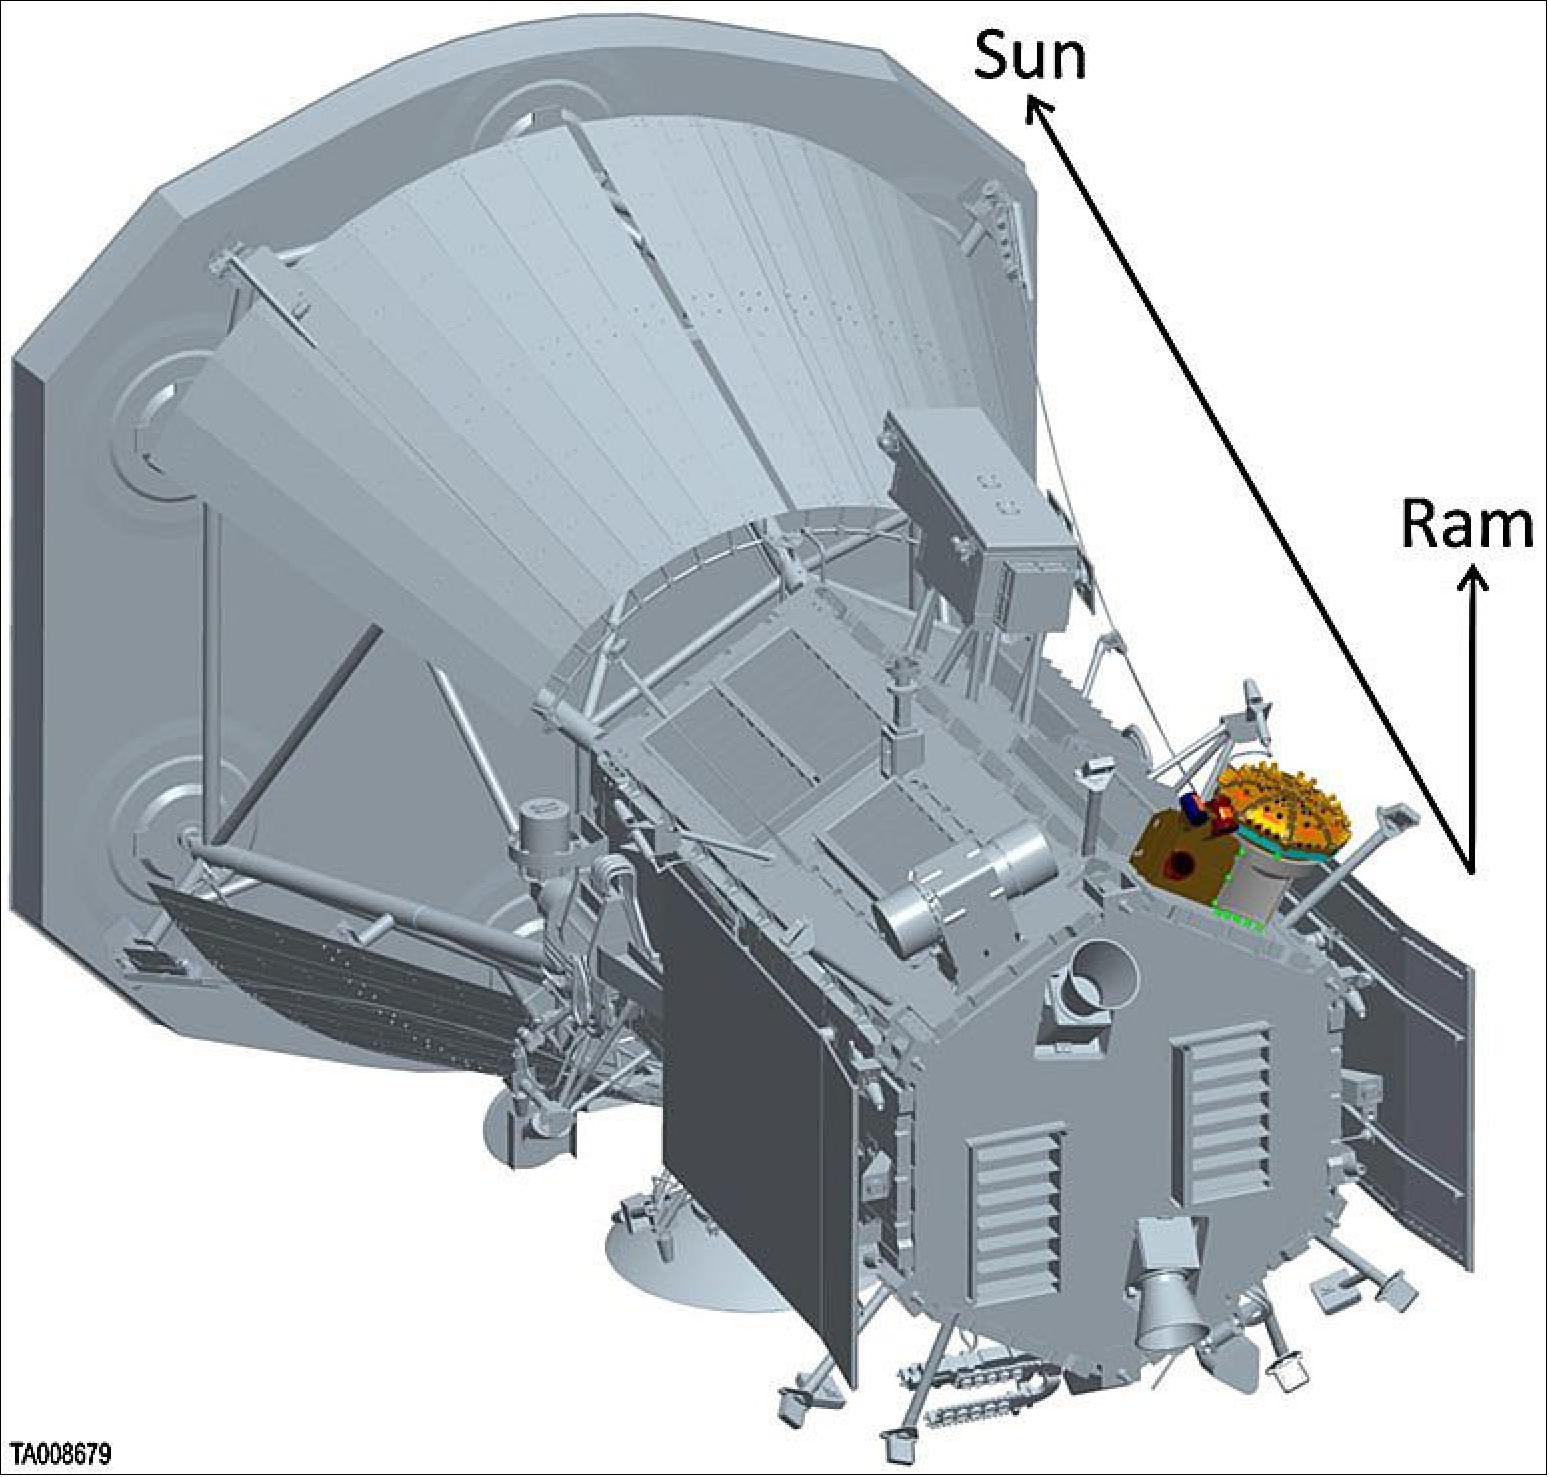
FOV Maps: Sionce ISIS must remain in the umbra, its FOV has several blockages from the spacecraft itself. The TPS is the predominant FOV blockage (Figure 96 and 97). At the extremes of ISIS’ FOV, there are small blockages due to the deployed solar arrays and the solar limb sensors. The EPI-Hi FOVs are a series of five overlapping 45º half-angle cones, three of which are provided by the low energy telescopes (the double-ended LET1, and the single-ended LET2). The other two 45º half-angle cones are provided by the double-ended, HET (Higher Energy Telescope). The EPI-Hi telescope FOVs are overlapped to provide full energy coverage in the sunward and anti-sunward direction in two, nearly-complete 45º half-angle cones. Further coverage is provided in the directions that are not blocked by the spacecraft by the low energy telescopes alone. The EPI-Lo FOV is an array of 80 apertures, ten on each of eight wedges. These apertures are arranged to sample a hemispherical FOV that includes viewing in the sunward and anti-sunward hemispheres as well as coverage near the direction of the nominal Parker spiral.
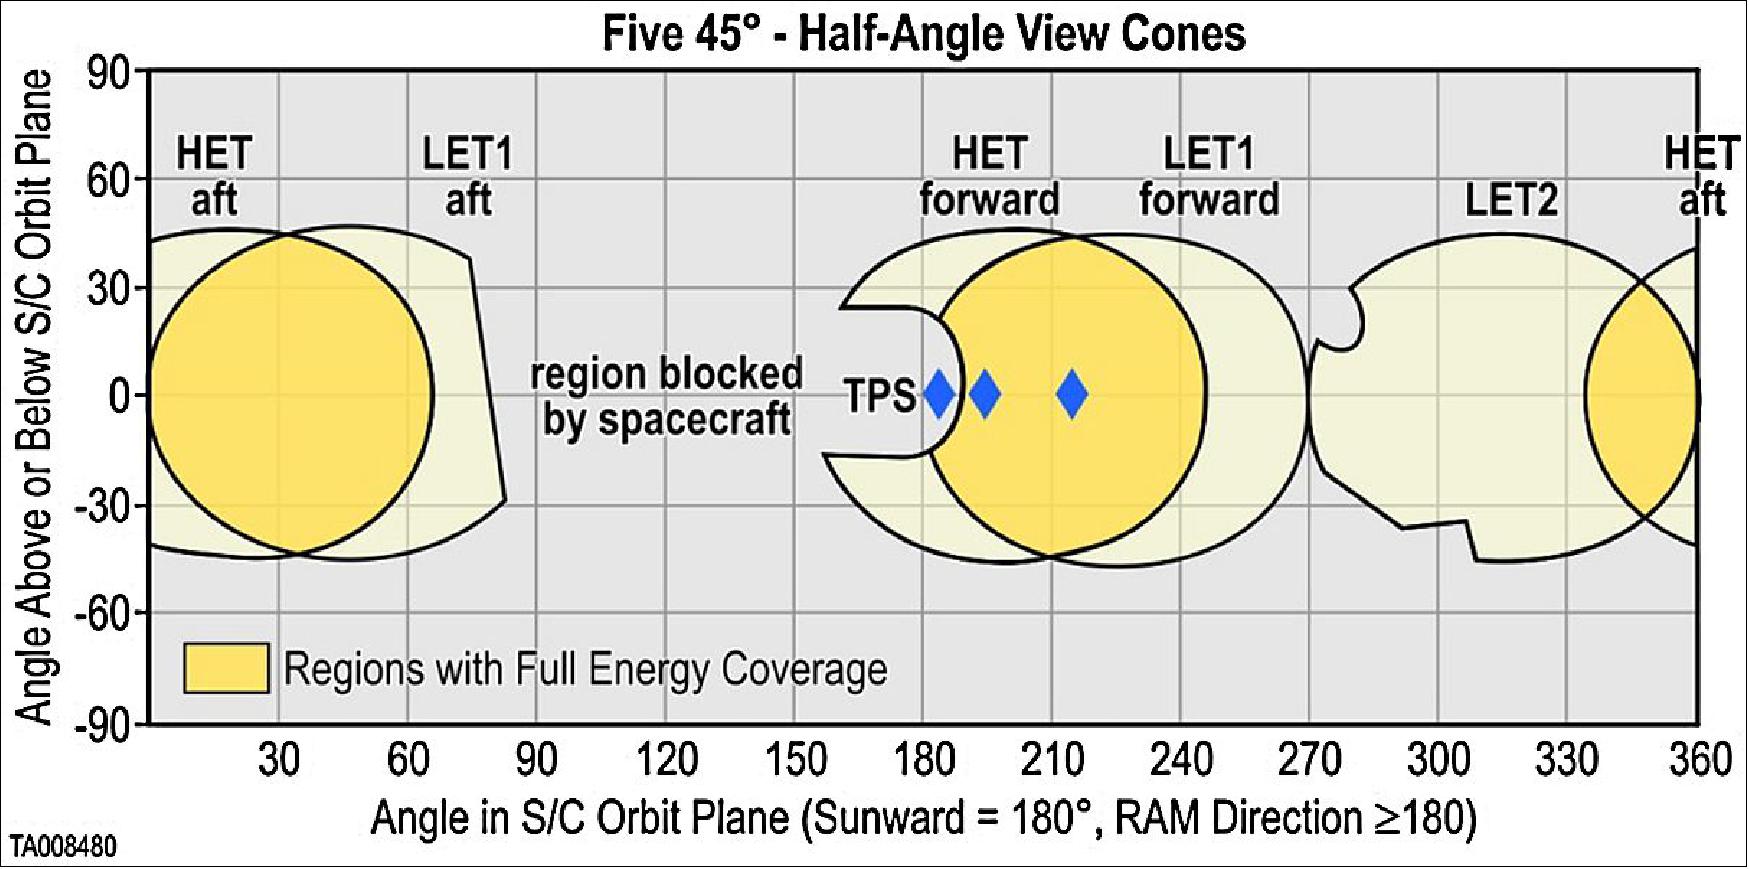
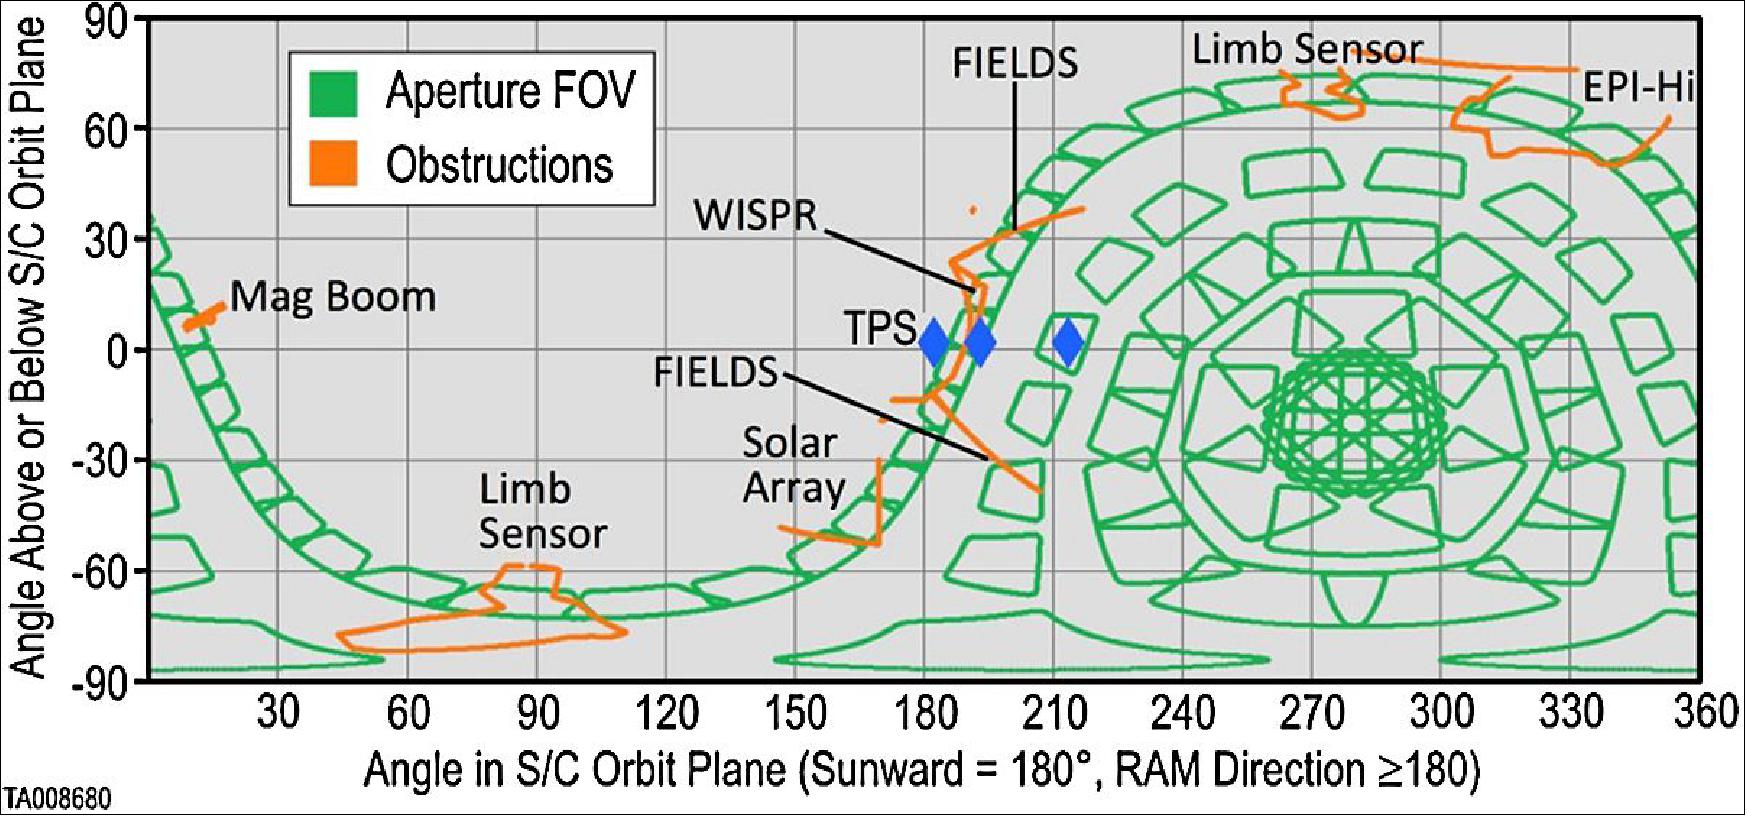
ISIS Bracket: The ISIS suite is integrated onto a single, combined ISIS bracket. The bracket is designed to allow flexibility and position the ISIS instruments as close to the allowable umbra-line as possible since the final position of the SPP TPS may be shifted slightly during spacecraft I&T (Integration and Testing). The nominal bracket design holds ISIS just within the allowed limit with ~2° safety margin to the actual umbra line, which keeps the ISIS FOVs as close as possible to the Sun-Probe line. However, the SPP spacecraft center-of-mass must be very close to the center-of-pressure on the TPS in order to minimize pointing perturbations. To do this, the TPS, which is initially oversized, will be trimmed to its final configuration during spacecraft I&T. By design, the TPS will not be trimmed below the limit we have designed to, but it could be trimmed less, which would move the actual umbra line farther away from ISIS and reduce viewing toward the Sun-Probe line. To prevent this reduction in our FOV in this key region of interest, the ISIS bracket is designed to accommodate a late TPS modification by extending the suite farther away from the spacecraft panel, thus restoring ISIS to the position as close as possible to the umbra.
Mass, Power, and Telemetry: ISIS has been optimized for the SPP mission. Mass is the most constrained resource for the SPP spacecraft, and power is second because of the mass penalty for cooling the solar arrays. The ISIS team has worked diligently to remain within limits set by the mission design. The resource estimates come from a detailed Master Equipment List in which the estimates for each item are carefully maintained and revised over the course of development. Given the heritage of the electronics, the power and telemetry estimates have remained steady during the course of the project development to date. To minimize overall SPP risk, the ISIS team was given a small mass increase to reduce development risks during the risk-reduction SPP activities in Phase B. The CBEs (Current-Best-Estimates) as of the time of the ISIS and mission PDRs, as well as uncertainty estimates are listed in Table 7.
Parameter | EPI-Hi | EPI-Lo | ISIS bracket | ISIS | ||||||
CBE | Uncertainty | Total | CBE | Uncertainty | Total | CBE | Uncertainty | Total | Total | |
Mass (kg) | 3.628 | 0.692 | 4.320 | 3.435 | 0.656 | 4.091 | 0.817 | 0.156 | 0.973 | 9.384 |
Power (W) | 5.810 | 0.960 | 6.770 | 4.170 | 0.830 | 5.000 | NA | NA | NA | 11.770 |
Operational heaters (W) | 0.480 | 0.070 | 0.550 | NA | NA | NA | NA | NA | NA | 0.550 |
Survival heaters (W) | 3.810 | 0.570 | 4.380 | 2.450 | 0.370 | 2.820 | NA | NA | NA | 7.200 |
| EPI-Hi | EPI-Lo | ISIS | |||||||
Raw | Burst | Total | Raw | Burst | Total | Total | ||||
Uncompressed data volume [Gbit/orbit] | 3.660 | 0.000 | 3.660 | 11.320 | 0.200 | 11.520 | 15.180 | |||
Compressed data volume (75%) [Gbit/orbit] | 2.745 | 0.000 | 2.745 | 8.490 | 0.200 | 8.690 | 11.435 | |||
Packetized data volume (105%) [Gbit/orbit] | 2.882 | 0.000 | 2.882 | 8.915 | 0.210 | 9.125 | 12.007 | |||
Thermal Design: On a spacecraft that is designed to fly much closer to the Sun than any other mission in history, one might reasonably expect that the thermal environment would be extreme and that the limiting hot-case for the thermal design would be at perihelion. However, the limiting hot-case for the thermal design of ISIS is actually near 1 AU, just after launch when the SPP spacecraft has to perform various maneuvers that allow direct solar illumination of ISIS. After those early operations, ISIS remains in the umbra of the TPS at all other times, which provides a stable environment that is “in-family” with past, heritage missions for this type of instrumentation.
The thermal design of the SPP mission requires that the instruments be thermally isolated from the SPP spacecraft. The ISIS bracket configuration provides thermal isolation from the spacecraft deck, from the instruments, between the instruments, and from the bracket, thermally isolating the instruments themselves. This is accomplished by including 1.27 cm ULTEM® spacers at all of the mounting bolt locations on both sides of the bracket. To provide electrical conductivity, while still maintaining thermal isolation, thin straps of copper bridge the gap. These provide a very small cross-section to minimize thermal conductivity, but have a large surface area for good, high-frequency electrical grounding. MLI (Multi-Layer Insulation) covers the majority of ISIS, except for the apertures and thermal radiators, to minimize radiant heat transfer. EPI-Hi and EPI-Lo have independent survival heaters controlled by the spacecraft, and EPI-Hi also has an operational heater controlled by the instrument itself.
Electrical Interfaces: EPI-Hi and EPI-Lo have completely independent electrical interfaces to the SPP spacecraft. Each has separate command and telemetry interfaces to the SPP C&DH (Command and Data Handling) unit as well as separate power interfaces for instrument power to the SPP PDU (Power Distribution Unit). The SPP spacecraft also provides independent temperature sensors and survival heaters that are used to control the EPI-Hi and EPI-Lo temperatures.
Each instrument has separate A-side/B-side command and telemetry interfaces. LVDS (Low Voltage Differential Signaling) is used to establish a high-speed serial communication protocol with ITFs (Interface Transfer Frames) as the packet format. Command ITFs are used to send spacecraft time and status as well as instrument-command packets to each instrument. ISIS uses the spacecraft time and status information to configure itself autonomously. The instruments return instrument-status and telemetry packets in Telemetry ITFs. The instrument-status can be interpreted on-board the spacecraft to make real-time autonomy decisions. The telemetry packets are stored on the SPP data recorder for downlink to ground stations at the appropriate time. To maintain time synchronization, a 1 PPS (Pulse-Per-Second ) signal is provided by the spacecraft. Instead of using a separate line, a “virtual PPS” is provided by carefully controlling the timing of the start-bit of the first byte of the Command ITFs.
EPI-Hi and EPI-Lo have independent power connections to the SPP PDU, each with their own switches. At the SPP mission level (including measurements from the other instruments), mission success can be achieved with either EPI-Hi or EPI-Lo, so additional power redundancy is not required. The spacecraft provides a standard +28 V power bus. ISIS uses a common LVPS (Low Voltage Power Supply) design, which meets the EMI/EMC (Electromagnetic Interference/Compatibility) requirements of the SPP mission. The LVPS design is customized for each instrument and provides reverse voltage protection, in-rush current limiting, EMI filtering, and isolation between the spacecraft power return and the ground returns of the secondary power supply rails that are developed within each instrument.
Integrated Science Team: The ISIS science team includes scientists from the ISIS Leadership, EPI-Hi, EPI-Lo, and SOC groups as well as Senior Science Mentors and theory and modeling team members who are leading experts in energetic particle science (Table 8). These scientists are integrated into the on-going instrument development process as well as the operations planning and data analysis efforts. The ISIS science team works in close coordination with the other SPP instrument investigation teams. It also coordinates data collection and analysis with other missions (e.g. Solar Orbiter) and ground-based observations. This close coordination inside the ISIS science team and cooperation with the broader science community provides a truly outstanding integrated science investigation of the Sun.
Title | Name | Organization |
PI (Principal Investigator) | Dave McComas | SwRI (Southwest Research Institute) |
DPI (Deputy Principal Investigator) | Eric Christian | NASA/GSFC |
Co-PI | Alan Cummings | Caltech |
Co-PI | Mihir Desai | SwRI |
Co-PI | Joe Giacalone | University of Arizona |
Co-PI | Matthew Hill | JHU/APL |
Co-PI | Stefano Livi | SwRI |
Co-PI | Bill Matthaeus | University of Delaware |
Co-PI | Ralph McNutt | JHU/APL |
Co-PI | Dick Mewaldt | Caltech |
Co-PI | Don Mitchell | JHU/APL |
Co-PI | Nathan Schwadron | UNH (University of New Hampshire) |
Co-PI | Tycho von Rosenvinge | NASA/GSFC |
Co-PI | Mark Wiedenbeck | NASA/JPL |
SSM (Senior Science Mentor) | Robert Gold | JHU/APL |
SSM | Stamatios Krimigis | JHU/APL |
SSM | Edmond Roelof | JHU/APL |
SSM | Ed Stone | Caltech |
EPI-Lo (Energetic Particle Instrument—Low Energy)
EPI-Lo measures energetic particles in the lower portion of the ISIS energy range. The two ISIS instruments complement one another in their energy ranges and their sky coverage in order to obtain the comprehensive set of observations needed to understand solar energetic particle sources, acceleration and transport close to the Sun.
EPI-Lo Overview: EPI-Lo is a novel, light-weight, high-heritage, TOF (Time-of-Flight) based, mass spectrometer that measures energetic electron (25–1000 keV) and ion (~0.04–7 MeV for protons and ~0.02–2 MeV/nuc for heavier ions) spectra and resolves all major heavy ion species and 3He and 4He over much of this energy range in multiple directions. ISIS thus covers the critical energy range from suprathermal energies (∼20 keV/nuc) up to the lower portion of the EPI-Hi energy range with a single instrument. The EPI-Lo characteristics and projected performance are summarized in Table 9.
Parameter | Required | Goal (expected) | Comment/Heritage |
Electron energies | 50–500 keV | 25–1000 keV | Electron capability from JEDI, RBSPICE |
Ion energies | 50 keV/nuc–15 MeV Total E | ~20 keV/nuc–15 MeV Total E | Capability based on that of RBSPICE |
Energy resolution | 45% for required energy range | 11% for required energy range | Telemetry limited |
Time sampling | 5 s | 1 s | Telemetry and/or statistics limited |
Angle resolution | <30º x <30º | Ions, ~15º x 12º to <30º x <30º e-, 45º | Varies with elevation |
Pitch Angle (PA) coverage | 0º–90º or 90º–180º, some samples in both hemispheres | 0º–90º or 90º–180º,some samples in both hemispheres |
|
Time for full PA | 1-5 s | 1-5 s | Telemetry limited |
Ion composition | H, 3He, 4He, C, O, Ne, Mg, Si, Fe | H, 3He, 4He, C, O, Ne, Mg, Si, Fe | 3He/4He ~50 to 1000 keV/nuc |
Electron sensitivity, geometric factor, counting rate, and background drivers | <106 cm-2 s-1 sr-1 (G ~ 0.05 cm2 sr; measure event rates to >50 kHz) | 102–107 cm-2 s-1 sr-1 (G>0.05 cm2 sr; measure event rates to > 700 kHz; background rate <1 Hz) | G = Geometric factor (cm2 sr) 8 pixels/sensor; background rate is spectral-slope dependent |
Ion sensitivity, geometric factor, counting rate, and background drivers | 101–106/cm-2 s-1 sr-1 (G ~ 0.05 cm2 sr; measure event rates to >50 kHz; at minimum intensity require accidental rate <~50 kHz) | 100–107/cm-2 s-1 sr-1 (G>0.07 cm2 sr; measure event rates to >700 kHz; at minimum intensity require accidental rate <~5 kHz) | 80 pixels/sensor |
EPI-Lo (Figures 98 and 99) consists of eight sensor wedges mounted above an electronics box. It has 80 separate entrances (10 on each of eight wedges) densely sampling over half of the sky. This configuration permits full angular distributions without articulation or duty cycle, and allows for measuring the first-arriving, field-aligned ions at the spacecraft for a broad range of vector magnetic (B) field directions.
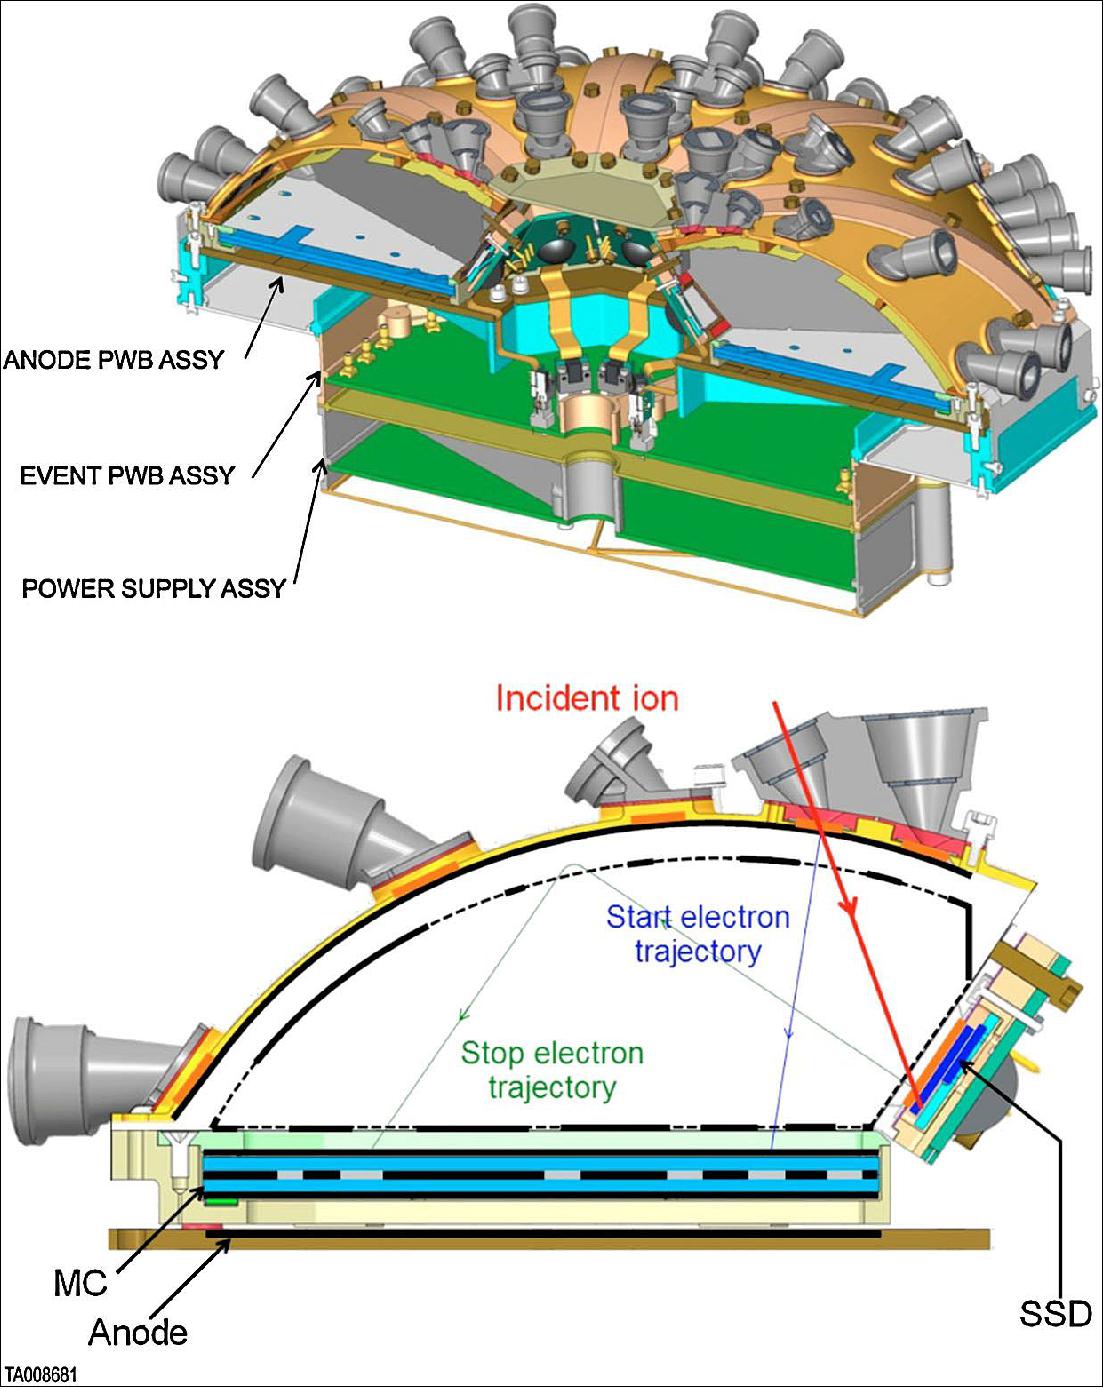
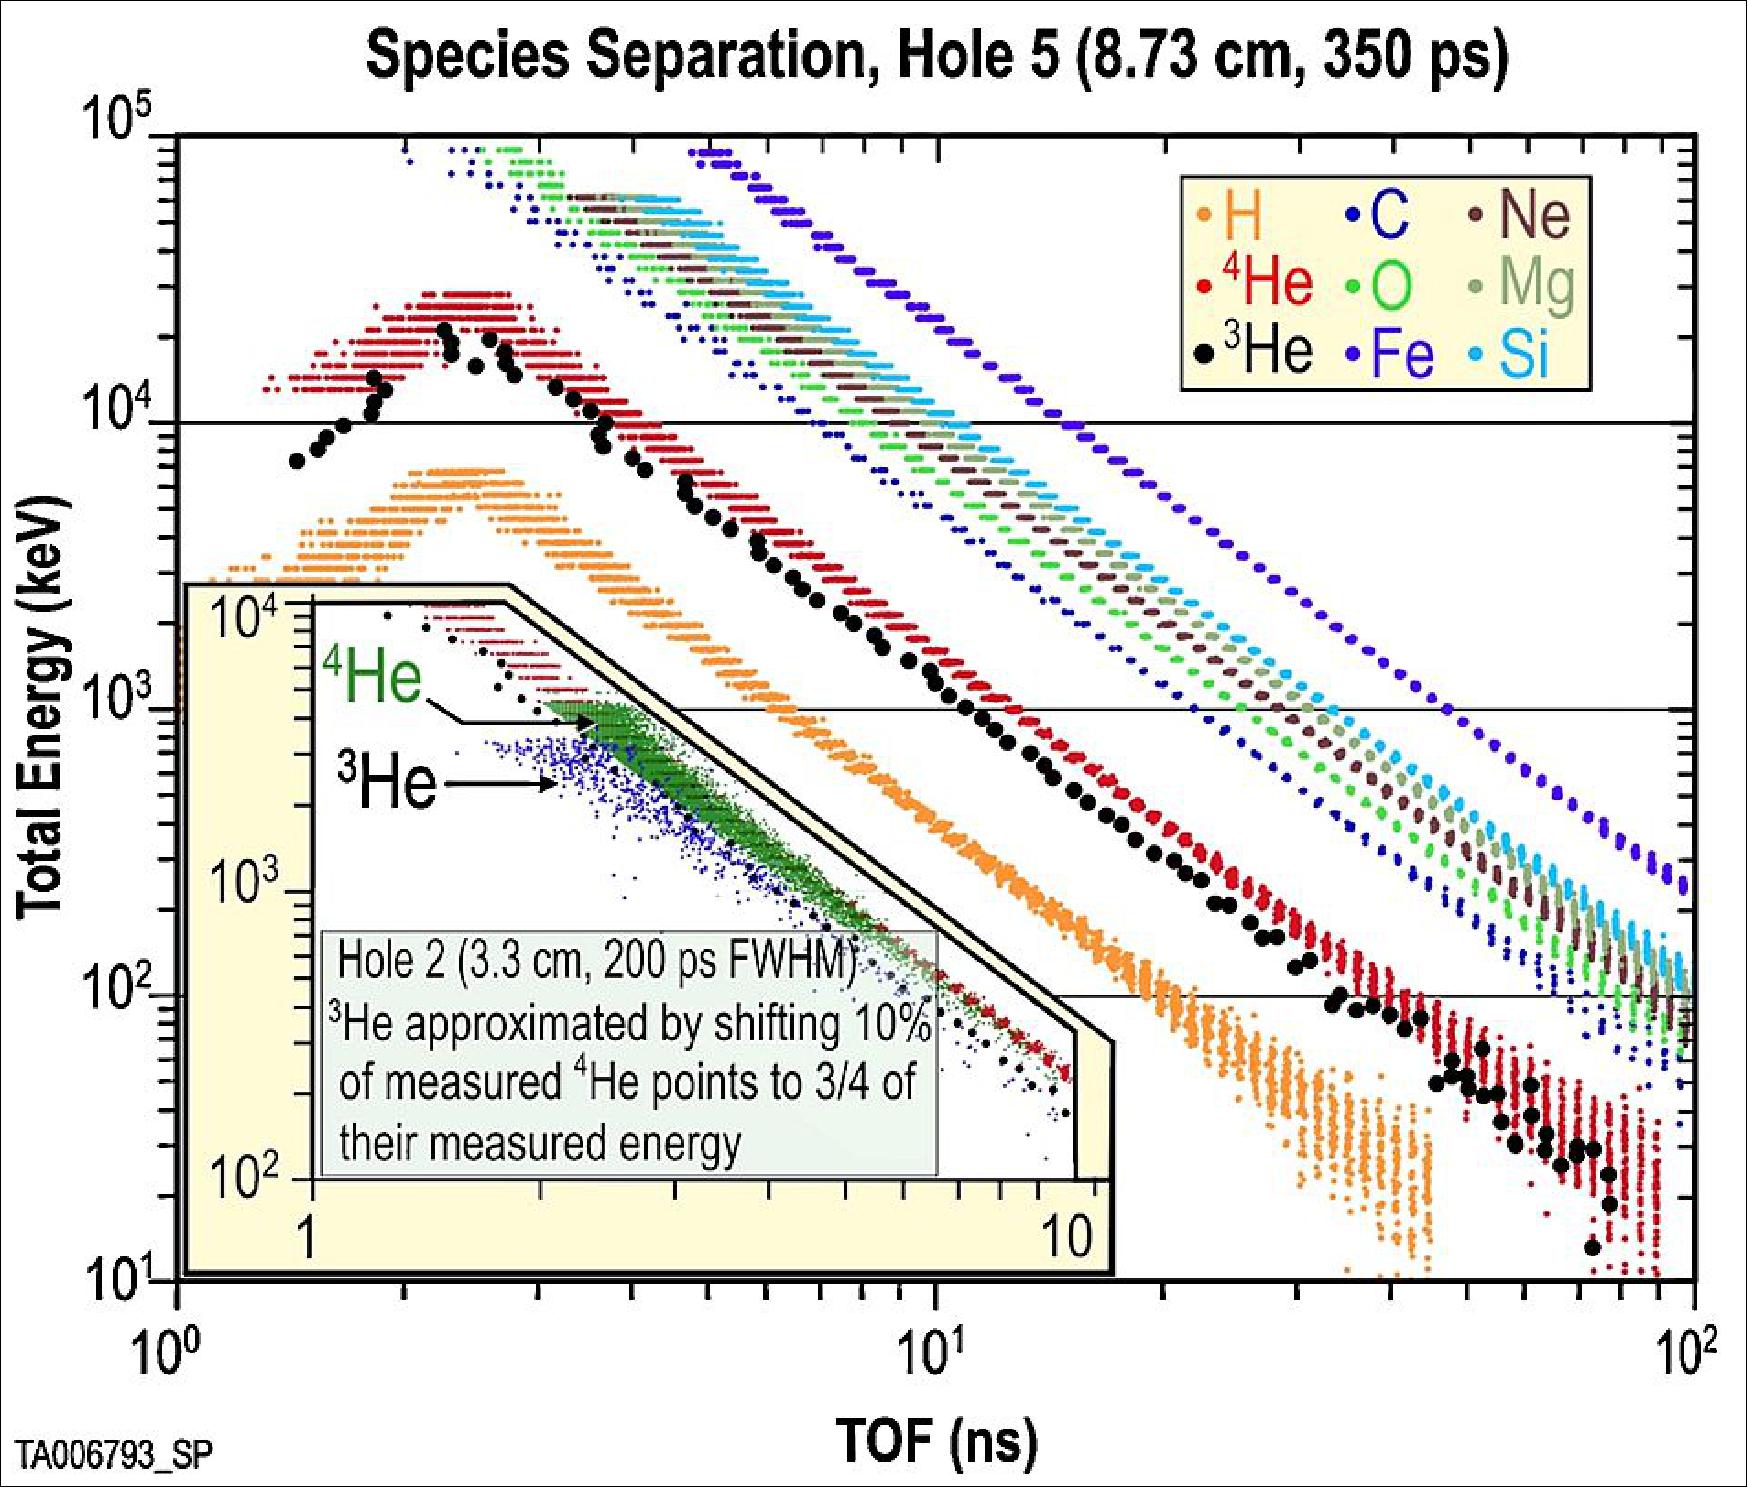
Understanding coronal acceleration processes requires ion-mass resolution sufficient to measure separately the intensities of the isotopes 3He and 4He (Figure 99), and the elements C, O, Ne, Mg, Si, and Fe, while simultaneously providing angular coverage with at least 45% energy resolution.
EPI-Lo achieves this resolution, including separation of 3He from 4He, over most of its angular coverage from 200 keV to 4 MeV total particle energy. EPI-Lo also returns high-resolution energy spectra (64 log-spaced energy bins) at reduced time resolution (necessitated by downlink limitations) and measures the required ion composition and pitch angle distributions from 30 keV/nuc to 0.3–1.0 MeV/nuc every 5 or 30 s. In this way ion acceleration histories are completely characterized with no uncertainty owing to an insufficient energy range or composition misidentification. EPI-Lo rejects background by requiring coincidence between the start and stop pulses for the TOF measurement, along with an energy measurement between appropriate TOF time gates. This rejection is non-linear, and is very effective (resulting in inconsequential rates of false valid events) for background counting rates in individual detectors (singles rates) below ~106 s-1; projected singles rates from combined background and foreground sources are ≤3 x 10⁵ s-1. Incoming ion velocities are determined by measuring the TOF between two thin (100 nm Start, 65 nm Stop) carbonpolyimide-aluminum (and palladium, Start only) foils. An ion passing through each of the foils produces secondary electrons, which are deflected toward a MCP (Microchannel Plate) producing “Start” and “Stop” pulses. The ion entrance angles are determined from the position where the Start electrons strike the MCP and are unique for each entrance foil location. The ion energy deposited in the SSD, together with velocity from the TOF, determines species through an onboard table lookup.
EPI-Lo also detects electrons from ~25 keV to 1000 keV. EPI-Lo uses SSDs (Solid State Detectors) shielded by aluminum flashing of ~2 µm thickness as also used in multiple current and upcoming missions, e.g., Cassini-MIMI, MESSENGER EPS, New Horizons PEPSS, Juno JEDI , Van Allen Probes RBSPICE, and MMS EIS. The relatively thick aluminum flashing naturally suppresses light, which is a very important feature for this intrinsically single parameter measurement. While the primary electron measurement does not identify which entrance aperture an electron enters through, each EPI-Lo wedge contains independent electron SSDs, so the sector of the sky is identified over an angular coverage similar to that for the ions. For the small subset of the electrons that produce secondary electrons as they transit the entrance foils, an additional mode that requires a Start pulse along with the SSD pulse identifies the specific entrance aperture that the electron entered through. This mode also provides better background rejection.
MCP detectors and SSD’s have been optimized for use on this mission. We also produced a prototype wedge (Figure 100), which has been used for extensive testing and development of the EPI-Lo concept and design. Finally, lead development engineers and instrument scientists on JEDI, RBSPICE, and EIS are all participating in the EPI-Lo effort, as well the corresponding leads that developed and continue to operate PEPSSI.
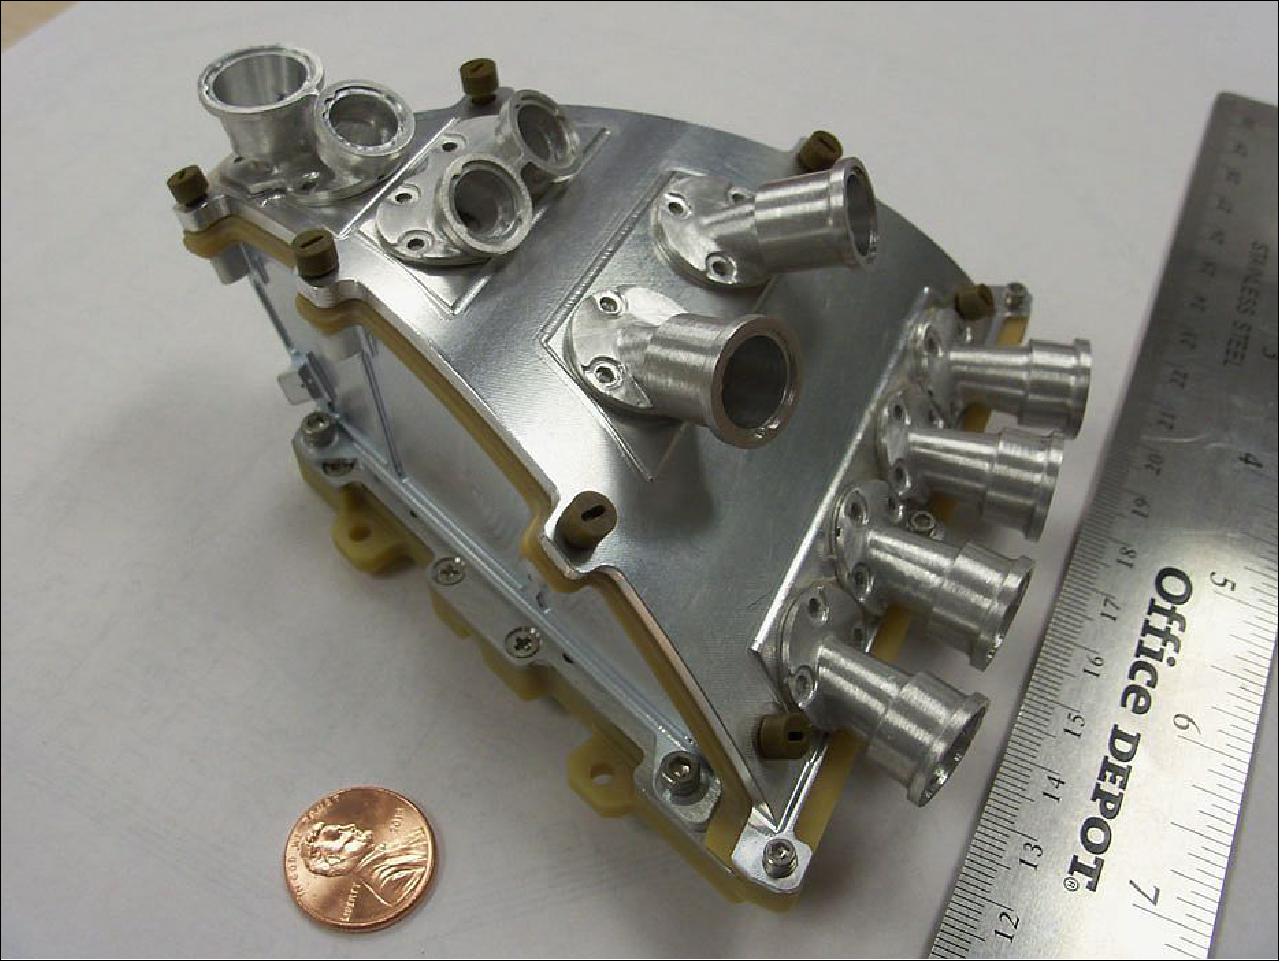
EPI-Lo Expected Performance: The detectors in EPI-Lo are sensitive to charged particles and to light. The MCPs are sensitive to ultraviolet (UV) light, including both EUV and shorter FUV (Far Ultraviolet) wavelengths whereas the SSDs are sensitive to everything from X-rays to visible wavelengths. However, the mechanisms are different. MCPs respond to charged particles impacting their surface, and UV produces secondary electrons (photoelectrons) on surfaces (either the surface of the MCP itself, or the Start and Stop foils designed to produce secondary electrons as ions penetrate them, or other surfaces inside the sensor volume), which can then enter channels and be amplified similarly to signals from any other particle.
SSDs respond to particles as they deposit energy in the bulk material of the detector. They free bound electrons to create electron-hole pairs and so increase conductivity. In SSDs, light can also energize bound electrons sufficiently that they become free and increase conductivity. Energetic X-rays may deposit enough energy to create free electrons that then raise the energy of sufficient numbers of bound electrons so that the resulting current spike is above threshold. Lower energy photons will not do so, but enough of them arriving within an SSD event time constant (~1 µs can free sufficient numbers of electrons to register as events, or to raise the electronic noise of the detector unacceptably.
In both cases, light (both UV and visible) must be reduced to a level where these effects cannot degrade the particle measurements. Controlling the amount of light entering the sensor volume involves a variety of techniques: (1) eliminating stray-light leak paths into the instrument; (2) collimating the entrance apertures to eliminate exposure to trajectories that are not useful for particle analysis; (3) coating surfaces from which light may be reflected into the detectors with low-reflectance coatings; (4) using high-work-function surfaces in locations where UV photons may strike surfaces from which photoemission is undesirable; (5) designing the Start and Stop foils using materials and thicknesses that reflect and/or filter the UV and visible light, reducing the light that can directly enter the sensor volume to acceptable levels; (6) taking precautions against failure of this filtering approach as a consequence of small numbers of pinholes in the foils (either from dust impact or launch vibration damage); and, (7) designing the sensor timing constraints such that controlled rates of photoelectron production from UV photons do not impact particle measurements.
Briefly, the instrument design carefully considers: (1) stray light paths and avoids them; (3) coating surfaces as a second-order consideration relative to direct paths for light and UV; and (7) timing constraints fundamental to the instrument design: an approach successfully used on numerous past flight programs (the “hockey pucks”1 on MESSENGER, New Horizons, Van Allen Probes, Juno, and MMS as well as the ENA imagers on Cassini and IMAGE).
All of these programs also rely on collimation and filtering by foils, and all were subject to pinhole degradation at various levels, so these considerations are not new; however, the SPP environment is sufficiently unique that careful consideration to these approaches is required for EPI-Lo.
The environment in which EPI-Lo will operate is one never before experienced. It has been extensively modeled, and there is considerable knowledge of the light environment. The SPP team has provided their best estimate of the worst-case photon environment as a function of solar elongation angle at perihelion. This, and the other expected SPP environments are specified in an internal Project-provided environmental design and test requirements document. Light at the ISIS location is dominated by Thomson-scattered photons, to first order a process that preserves the shape of the solar spectrum. The intensity of the scattered light is a fairly strong function of elongation angle, dominated primarily by the line-of-sight integrated electron density, which varies with elongation (Figure 101). While dust-scattered light dominates at large elongations it is much weaker than the Thomson-scattered light at smaller elongations, so the foil filtering design required by the Thomson-scattered light at smaller elongations is more than adequate for the dust-scattered light.
We know the elongation angles of the various apertures on EPI-Lo. In considering these, we treat the EPI-Lo apertures in two distinct groups: those that contain sky elements within ~12° elongation angle (the edge of the TPS is at about 8°), and those that do not. For those with elongation angles less than 12°, the rough order-of-magnitude (ROM) for the UV and light environment is approximately equivalent to having the disk of the Sun directly in the FOV of that aperture at 1 AU. This then means that the filtering requirements for those apertures are approximately the same as what would be required for EPI-Lo at 1 AU with the Sun directly in the aperture FOV.
Several approaches contribute to determining the required filtering properties of the foils. For visible light (which primarily concerns the SSDs), we have used flight experience from various instruments in Earth orbit. For example, the ISEE-1 EPD (Energetic Particle Detector) had 30 µg/cm2 of Al covering its SSD, and suffered from visible light contamination when the detector viewed the Sun directly. The IMP-8 EPD had 40 µg cm-2 of Al covering its SSD and did not respond to direct Sun in the visible, but it did respond to solar X-ray events. From this we conclude that 40 µg cm-2 of Al or the equivalent would be sufficient for EPI-Lo for elongations <12°. For these small elongation foils we are baselining a Start foil of 24 µg cm-2 of Al plus 18 µg cm-2 of palladium (Pd), which combined with the Stop foil containing 7.3 µg cm-2 of Al, yields a predicted noise level on the SSD of ~0.04 keV µs-1, well below the electronic noise level of ~7 keV µs-1.
For the larger elongation apertures we have baselined a total of 7.3 µg cm-2 of Al plus 18 µg cm-2 of Pd on the Start foil, and 7.3 µg cm-2 of Al on the Stop foil. The predicted noise level for this combination is 0.7 keV µs-1 in the SSD. We plan to test at this level, and increase the thickness of the aluminum layers if necessary. It should be noted that these are ROM estimates and not really directly comparable. The Thomson scattered light is diffuse, whereas sunlight at 1 AU is collimated. Appropriate descriptions in terms of photons at a particular wavelength are number of photons cm-2 s-1 for sunlight at 1 AU but number cm-2 s-1 sr-1 for the scattered light at 10 RS (~perihelion for SPP). The way we employ our model is by using the EPI-Lo geometric factor for the apertures, which lie within a given elongation angle range we are modeling, and calculating the number of photons s-1 that hit the aperture foils, so the calculation is correspondingly conservative. We then run the filter model with a fraction of the full Sun at 1 AU determined such that we match that number of photons/s on the same aperture foils.
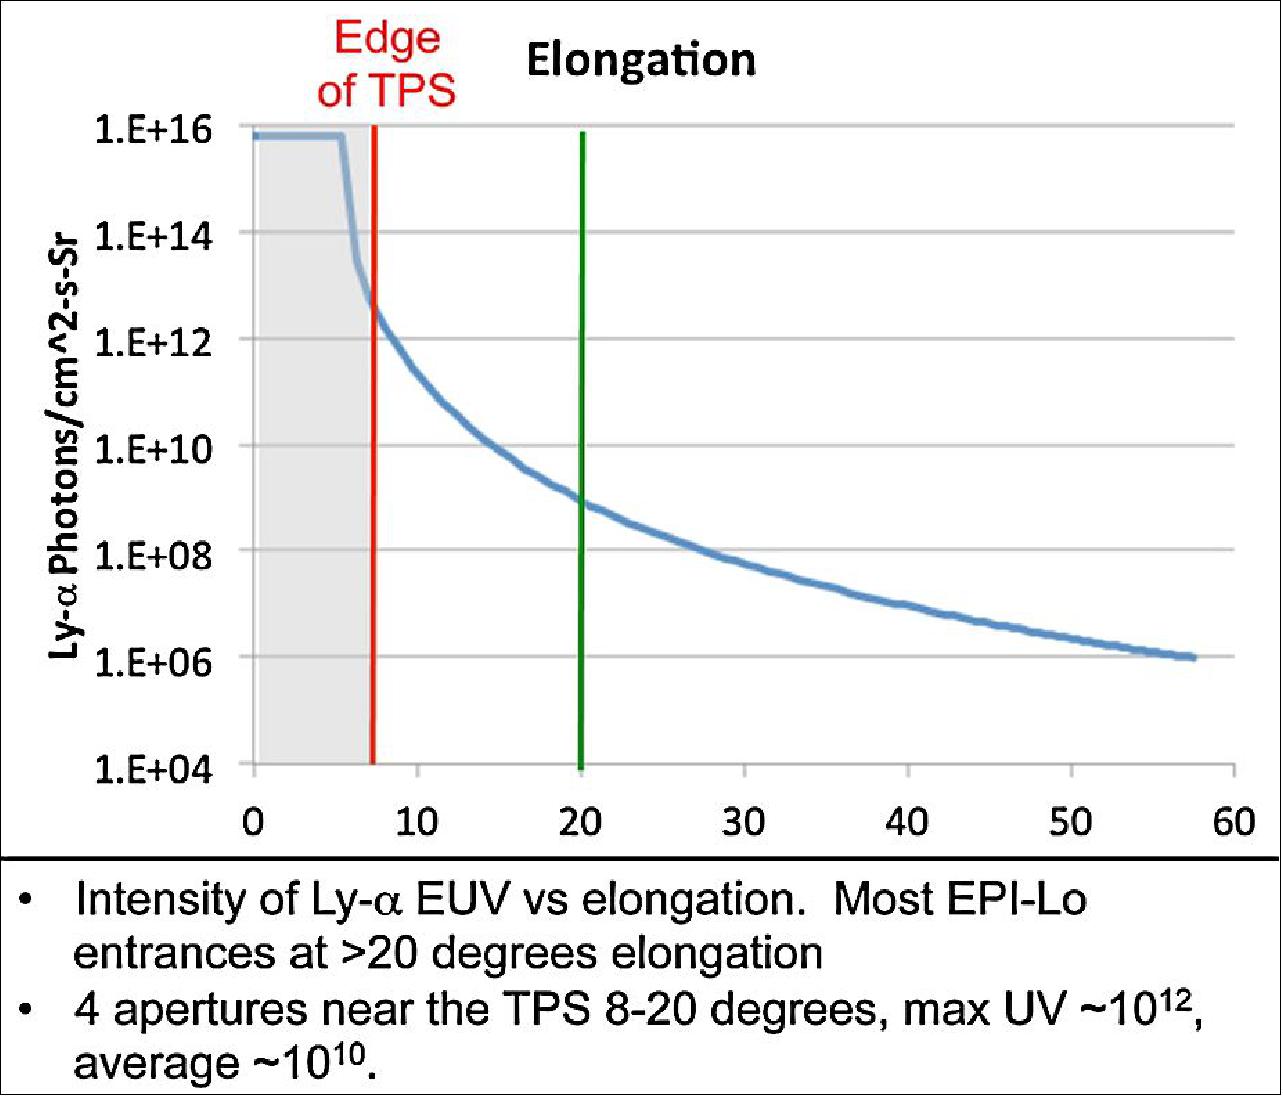
EPI-Lo Electrical: The EPI-Lo electronics box contains all the electronics to run the instrument other than the energy and timing preamps, which are located in the sensor wedges. The box contains two octagonal boards mounted into metal frames. The boards stack one on top of the other, with an internal connector providing electrical interconnects between the boards. The functional breakup between the two boards minimizes the number of interconnects needed. See Figure 102 for the block diagram.
The electronics are designed to handle solar energetic particle event intensities up to at least 106 particles cm-2 sr-1 s-1. This includes handling electron counts rates ≥70,000 counts per second and total ion count rates (SSD and MCP valid coincident event) of ≥70,000 counts per second. In both cases, these events can be either evenly distributed over the entire instrument or concentrated in one wedge. The term “handle” is used to mean that the incoming particles are processed in the instrument such that the particle types, directions, and rates can be determined. Note that ground software rate correction will be necessary when rates are sufficiently high (e.g. ≥106 starts per second or ≥40,000 total ion count rates per second). With the current mission and environment assumptions, we expect that rates will be sufficiently high only ~5 % of the time to require such corrections.
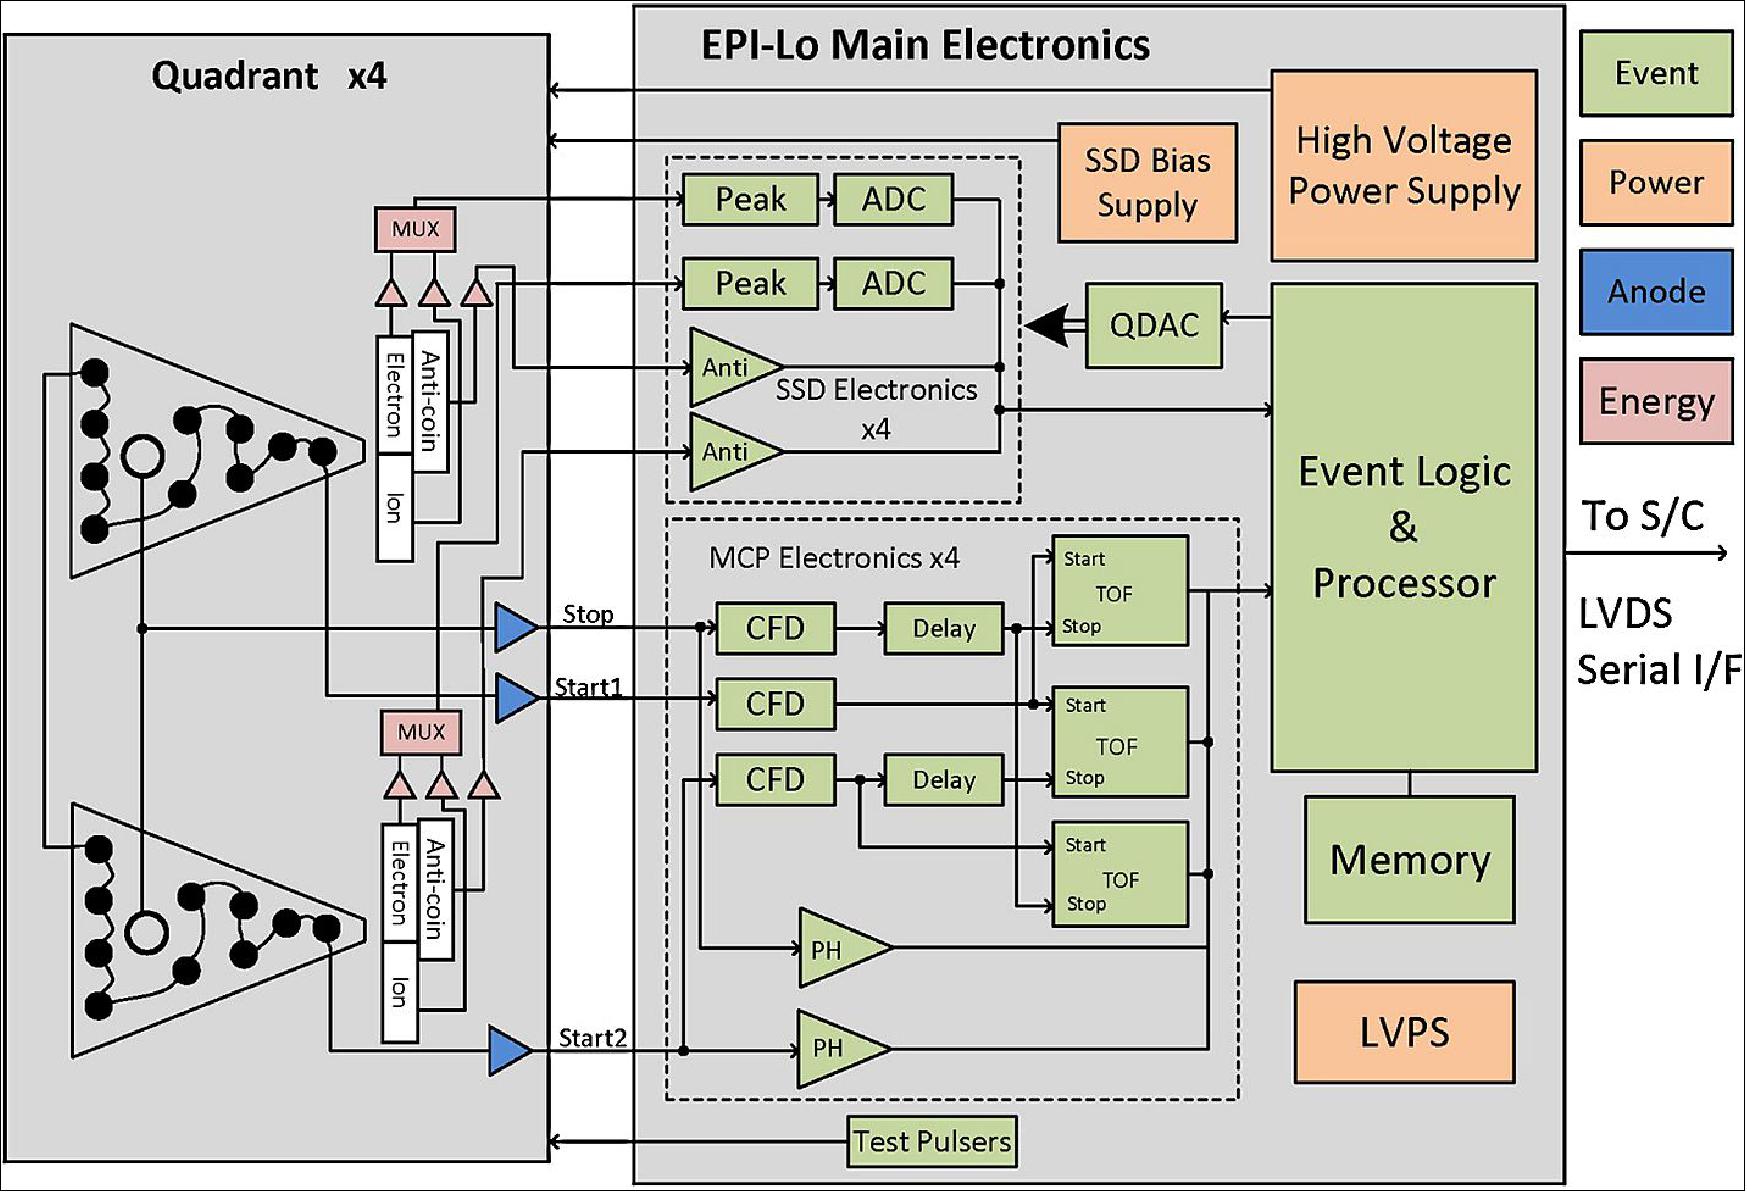
Event Board: An ion entering the sensor through one of the collimator apertures will deposit energy in the SSD and produce secondary electrons in the Start and Stop foils, which are amplified by the MCP and collected in distinct positions on the anode. This collection of time-correlated signals is called an event for the purpose of the description of the electronics that follows. The Event board directly processes the sensor SSD and anode preamp output signals, and contains all necessary analog and digital circuitry to process and store event information on an event-by-event basis. The energy signals from the eight SSD preamplifier sets are processed in parallel peak-detect/discriminator circuit/ADC chains. The MCP anode signals are processed via constant-fraction discriminators (CFDs) and time-to-digital conversion (TDC) circuitry; these measured time differences are converted into event look direction and particle velocity in the FPGA (Field-Programmable Gate Array). FPGA-based event logic also determines which signals comprise valid ion and electron events and coordinates all event hardware processing timing. A soft-core processor (i.e. a processor implemented in VHDL) is also embedded in the FPGA to provide all command, control, telemetry, and data processing functions of the instrument. SRAM, MRAM, and PROM memory storage is provided on the board to support the processor.
EPI-Lo uses a pulse-width technique to determine the energy deposited in each detector for energies above ~1 MeV. This method, used on the Juno JEDI, the RBSPICE, and MMS EIS, allows the energy dynamic range to be extended from ~1.5 MeV to a total energy ~15–20 MeV. In order to cover fully iron composition with no gaps between EPI-Lo and EPI-Hi, the maximum energy measured will be extended to ~85 MeV for iron (1.5 MeV/nuc for Fe nuclei). Three separate approaches to this extension of the iron energy range have been identified, and the preferred approach will be finalized and tested in the engineering model prior to instrument CDR. Each sensor uses an existing, flight-qualified, ASIC (Application-Specific Integrated Circuit) containing preamplifier/shaper circuits to amplify the SSD and APD (Analog Peak Detect) signals, shape the pulse, and generate timing triggers on the rise and fall of each pulse. These signals feed into the EPI-Lo FPGA where the coincidence logic and other digital processing begin. The EPI-Lo FPGA-based processor accumulates events into rates, and packetizes the telemetry products.
Power Board: The Power board contains both the low and high voltage power supplies. The low voltage portion takes spacecraft primary power on a single 9 pin connector and generates 1.5 V (for the FPGA core), 3.3 V (primarily for digital interface logic, memories, and TDCs), and 5 V (primarily for analog functions). A 15 V output powers the high voltage power supply (HVPS). The HVPS generates the necessary high voltage outputs for the sensor MCP and electron optics, with a maximum voltage output of 3300 V. It can independently control high voltage to each of the four quadrants. A bias supply provides up to 250 V for the SSDs.
EMI/EMC Design Considerations: Of principal concern for EMC design are the power supplies. These are controlled to a frequency window centered at n x 50 kHz with n ≥3 and 500 ppm wide overall operating conditions and time. The LVPS is synchronized to 200 kHz by a 400 kHz clock provided by the digital boards. EPI-Lo has a 40 MHz oscillator and EPI-Hi has a 58.8 MHz oscillator; both evenly divide to 400 kHz. To minimize interference, transformers and large inductors are placed as far from the box walls as possible, and stable currents are employed to minimize changes in magnetic emissions. EPI-Lo does have nickel grids, and concerns associated with those are mitigated with careful handling, use of non-magnetic tools, and testing.
All electronic parts are selected for proven radiation tolerance: TID (Total Ionizing Dose) >100 krad, no latch-up, and acceptable SEU (Single-Event Upset) performance. TMR (Triple Module Redundancy) and ECC (Error Correction Code) are used on vulnerable registers inside the FPGA. PROM-based boot code is used to ensure reliable memory loading and checking capabilities. Analog parts are selected with low dose effects in mind. Parts comply with GSFC's (Goddard Space Flight Center) “EEE-INST-002” Level II requirements.
EPI-Lo Mechanical: EPI-Lo uses a symmetric design to enable the wide field of view in a compact, low-mass package. Parts consist of the eight wedge assemblies and their closeouts, a top close out, the “spider” frame, which holds the wedges, and the event- and power-board slices, which comprise the components of the electronics box (Figure 103). The common wedge design is shown in Figure 26. Each contains an MCP assembly, an SSD assembly, and a collimator set. Alignment of all of the pieces enables the coverage and functionality of the detector overall. Preliminary design analysis has been done with a FEM (Finite Element Model) using 89,077 nodes and 70,645 elements.
The preliminary structural analysis of the baseline design was performed using MSC Nastran, MAYA SATK®, and Femap for analysis. The model was simplified wherever possible to reduce solution time. PWAs (Printed Wiring Assemblies) were modeled as plate elements with uniform stiffness, thickness, and density, and the instrument model was oriented to the ISIS bracket configuration in relation to the spacecraft panels.
The project performed a mechanical modal analysis to determine mechanical resonances. The analysis showed the first mode to be 304 Hz (for the Event PWA) and 553 Hz for the overall instrument. The analysis environmental input levels per spacecraft requirements were performed for all three orthogonal axes relative to the spacecraft panel. The 3σ acceleration random response enveloped the static load requirement as desired for EPI-Lo displacements, stresses, and forces. The random-vibration PWA displacement response may be relatively high for EEE (Electrical, Electronic, and Electromechanical) part solder/lead-wire fatigue resistance, and further analysis is planned after EEE parts placement is finalized. All margins of safety are positive for the current model configuration, and a detailed analysis will be carried out for the flight configuration to confirm that the flight design has positive margins and meets the minimum frequency requirement.
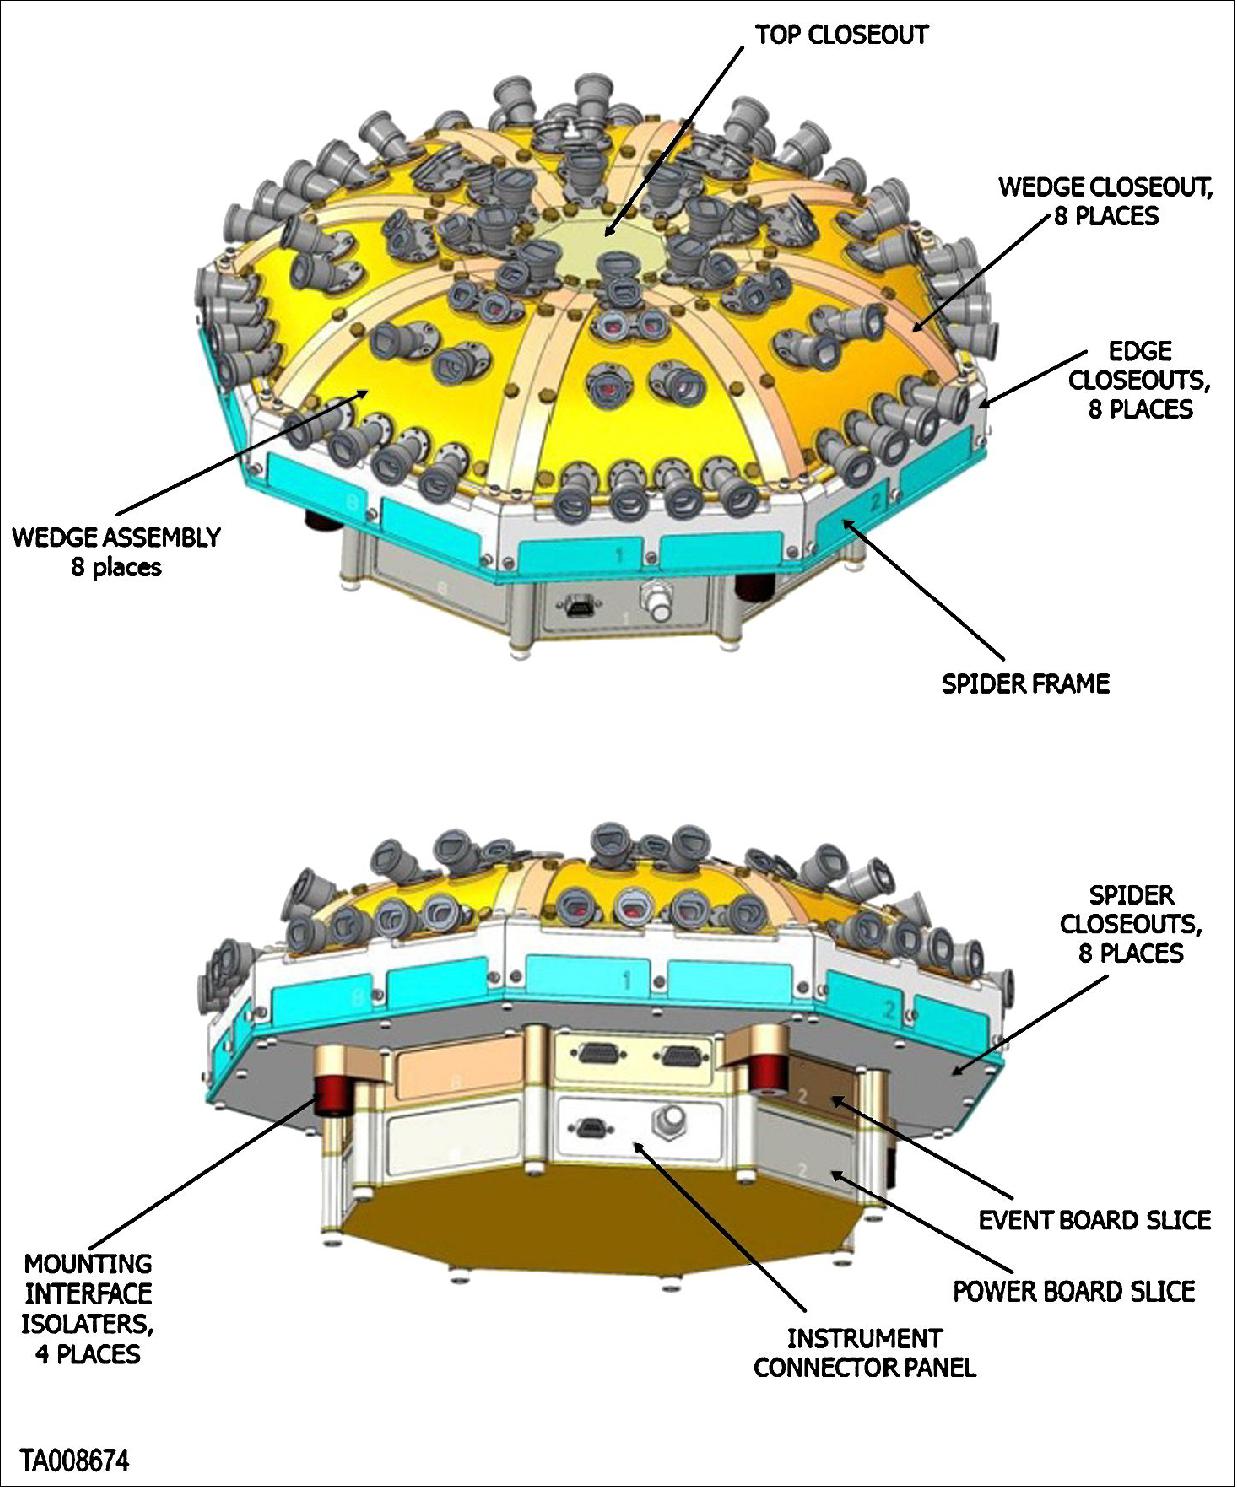
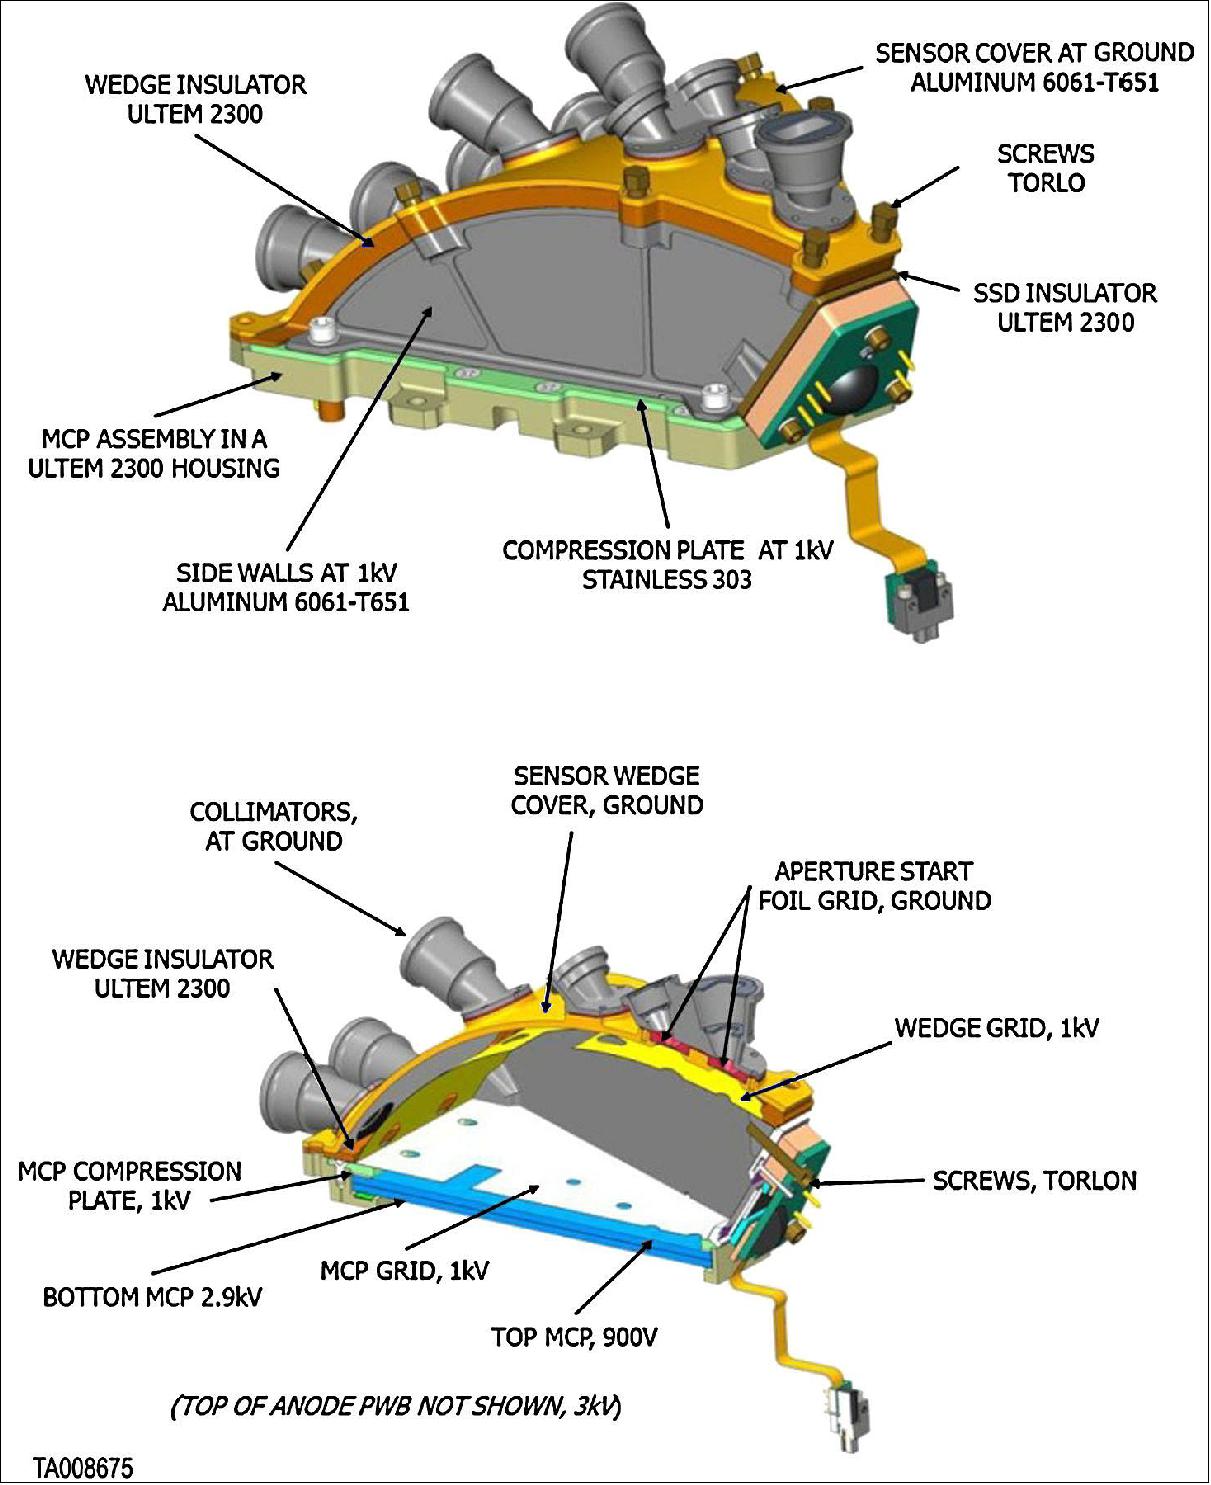
EPI-Hi (Energetic Particle Instrument—High Energy)
EPI-Hi measures energetic particles in the upper portion of the ISIS energy range. The two ISIS instruments are complementary in their energy range and sky coverage in order to obtain the comprehensive set of observations needed to fully understand solar energetic particle sources, acceleration, and transport close to the Sun.
EPI-Hi Overview: EPI-Hi measures energetic electrons, protons, and heavy ions in the MeV energy range using the dE/dx versus total energy technique in a sensor system based entirely on ion-implanted silicon SSDs. It builds on a heritage of more than 40 years of SSD-based energetic particle instruments, and most directly on the LET (Low Energy Telescope) and HET (High Energy Telescope) that are part of the IMPACT instrument suite on the twin STEREO spacecraft; these instruments have been providing multi-point measurements of energetic particles in the heliosphere since late 2006. The sophistication of SSD instruments has steadily advanced as capabilities have improved with high performance, low power, and miniaturized, front-end electronics in the form of ASICs. The EPI-Hi requirements and expected performance are summarized in Table 10.
Parameter | Required | Goal (expected) | Comment/Heritage |
Electron energies | 0.5–3 MeV | 0.5–6 MeV | STEREO/HET |
Ion energies | ~1 to ≥50 MeV/nuc | p, He: 1 to 100 MeV/nuc | STEREO/LET & HET |
Energy binning | ≥6 bins per decade | 12 bins/decade | Logarithmic bins |
Cadence | Fastest: e 1 s, p 5 s | Fastest: e 1 s, p 1 s | Large energy bins |
FOVs (Fields of View) | ≥π/2 steradians in sunward and | Five 45º half-angle view cones covering sunward and anti-sunward hemispheres | View cones overlap to provide full energy coverage near Parker spiral to within 10º of spacecraft-Sun line |
Angular sectoring | e: ≤45º; ions: ≤30º | 45º half-angle cones subdivided into 25 overlapping sectors | Overlapping sectors provide improved angular resolution for deriving pitch angle distributions |
Elemental composition | H, He, C, O, Ne, Mg, Si, Fe | H, He, C, N, O, Ne, Na, Mg, Al, Si, S, Ar, Ca, Cr, Fe, Ni | STEREO/LET |
Isotopic composition | 3He/4He | 3He/4He | In selected viewing directions STEREO/LET |
Intensity range | Up to 3 x 10⁶ protons cm-2 sr-1 s-1 | Normal mode: up to ~1x10⁶ protons cm-2 sr-1 s-1 Pixel mode: up to ~4 x 10⁷ protons cm-2 sr-1 s-1 | >10 MeV protons |
Geometrical factor | N/A | 5 view cones, each with AΩ~0.5 cm2 sr | Value at energy with maximum AΩ |
Figure 105 shows a block diagram of EPI-Hi. The sensor system consists of three detector stacks, commonly called “particle telescopes”, each controlled by a dedicated electronics board that provides front-end analog signal processing, PHA (Pulse Height Analysis), coincidence determination, data accumulation and analysis, and formatting for readout. We have tailored the telescope designs for measurements in two different but overlapping energy ranges. A pair of LET1 (Low Energy Telescopes) and LET2 measure protons and heavy ions from ~1 to >20 MeV/nuc and electrons from ~0.5 to ~2 MeV while a single HET (High Energy Telescope) extends the energy coverage for electrons up to ~6 MeV and for protons and heavy ions to at least 100 MeV/nuc. LET1 and HET analyze particles incident from both ends of their detector stacks while LET2 analyzes particles incident from only one end because the other end is blocked by the spacecraft. Each of the five active telescope ends has an angular acceptance cone with a half-angle of 45º centered on the symmetry axis of the telescope.
In addition to the three telescope boards, EPI-Hi includes a DPU (Data Processing Unit) board that is responsible for the overall control of the instrument, including managing the boot-up of processors on the telescope boards, collecting data from those boards and merging them into a single data stream that is passed to the spacecraft, and receiving commands from the spacecraft and passing them to the processor for which they are intended. The remaining two electronics boards contain the LVPS that produces the required regulated, filtered voltages needed by the instrument and the bias supply that produces programmable voltages for biasing SSDs.
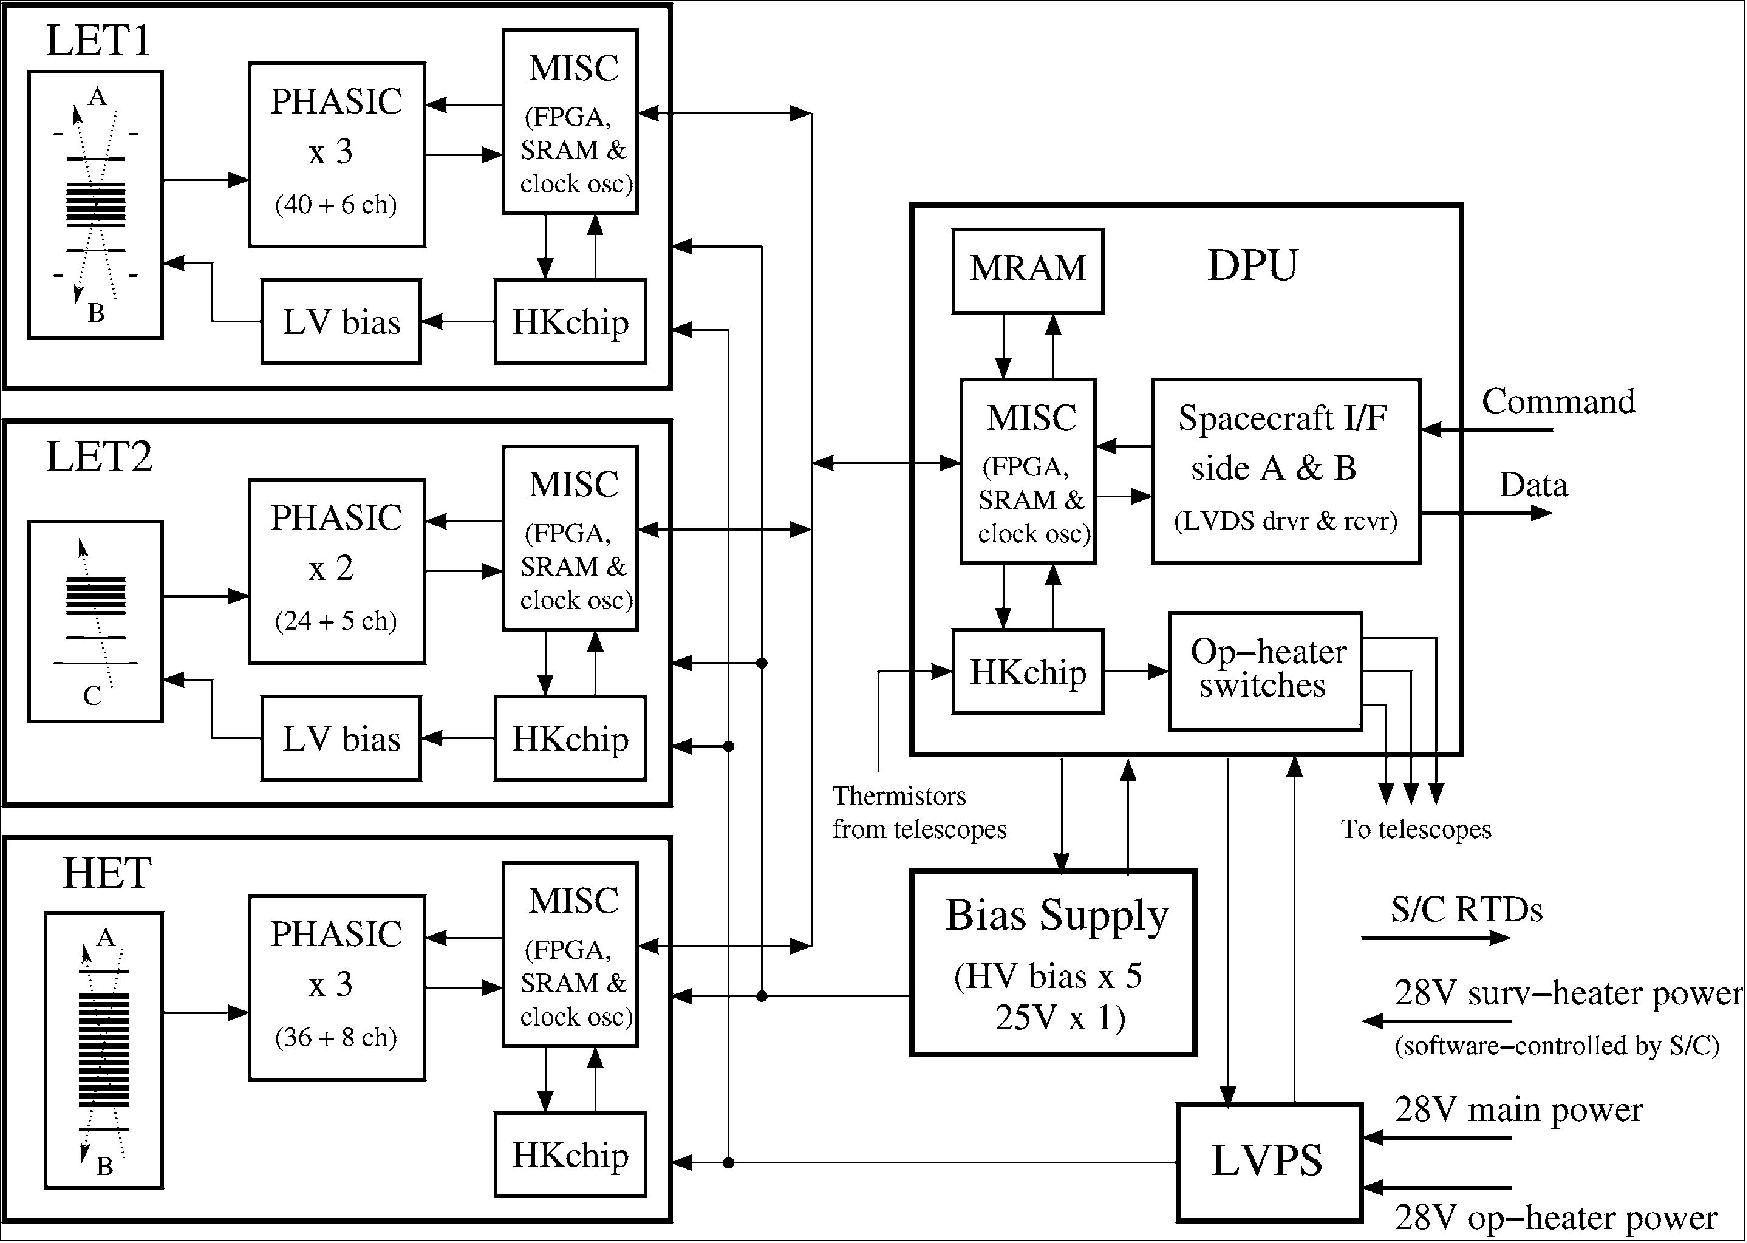
A metal enclosure, designated the “E-Box”, holds the electronics boards and provides a degree of shielding against radiation and high-speed dust impacts. We also use the E-Box, which is attached to the ISIS bracket, as a platform on which we mount the detector telescopes in the orientations needed to achieve the required viewing directions, as illustrated in Figure 106.
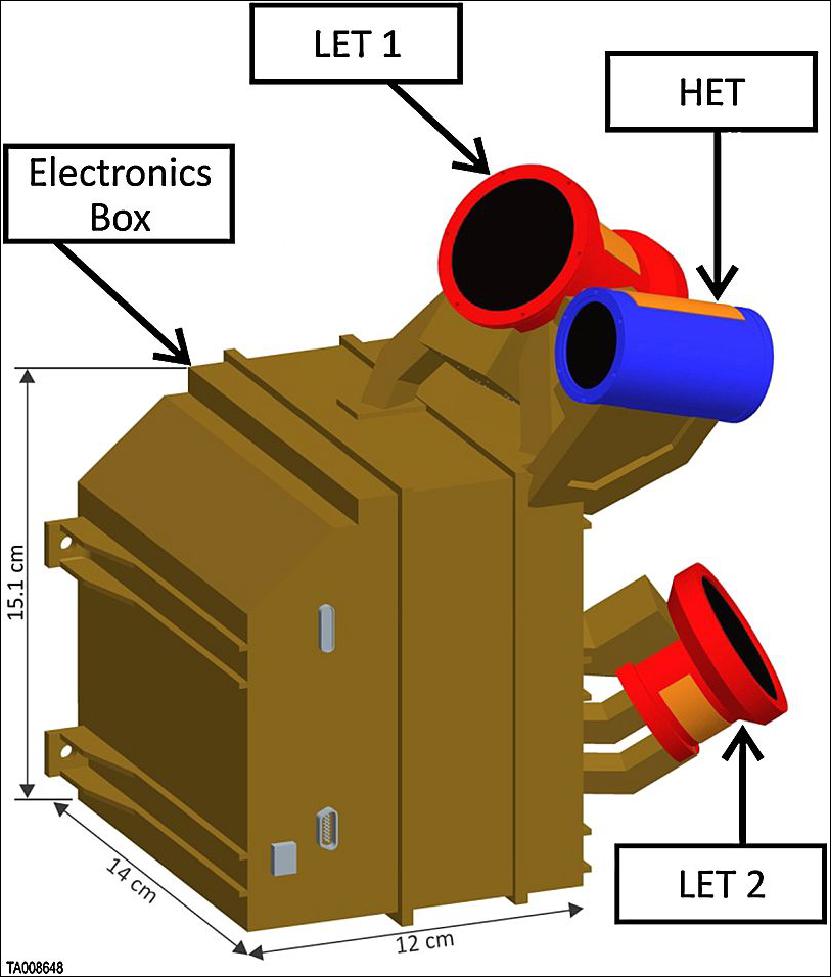
HET (High-Energy Telescope): Figure 107 shows cut-away views of the telescopes. HET has a thick central stack of detectors together with a single detector spaced farther away at each end. A coincidence between this front detector and the central stack defines the FOV of the telescope. The front detectors (H1) and the outermost detectors at each end of the central stack (H2) have five main active elements, consisting of a central bull’s-eye and four quadrants of a surrounding annular region, with all elements having equal areas, as illustrated in Figure 30a. Identifying which detector segment was hit by an incident particle in each of the two detectors allows us to subdivide the FOV into 25 overlapping sectors, thus enabling measurements of the distribution of particle incidence directions.
The detectors other than H2 in the central HET stack have a central segment with an active area equivalent to the combined areas of the five segments in H1 and H2. The combination of the thickness of the central stack and the active diameter of the detectors is such that some particles incident at large angles from the telescope axis will exit through the sides of the stack. To identify and reject these side-exiting particles, the detectors include an annular “guard” segment that is used as anti-coincidence in the analysis. The guard also allows identification of particle trajectories that clip the detector edge resulting in reduced energy-loss signals. This feature is important because the detector thickness is a non-negligible fraction of the detector diameter and thus edge-clipping trajectories are not improbable. The HET detectors (as well as the LET detectors other than L0 and L1) also include one additional segment in the form of a small pixel that is used to extend the dynamic range in particle intensities to values above which the larger detector segments will saturate.

The individual silicon detectors used in the HET telescopes have thicknesses of either 500 µm (H1) or 1000 µm. However, for H3, H4, and H5, we use two successive 1000 µm detectors connected to the same front-end electronics to produce what is effectively a 2000 µm detector without requiring the high bias voltage that an individual detector of this thickness would need.
LET (Low-Energy Telescope): The conceptual design of the LETs is similar to that of HET, using a central detector stack in conjunction with position-sensitive detectors that define the FOV and subdivide it into a number of sectors that we use for measuring particle angular distributions. Similar to HET, the LET detectors, other than L0 and L1, have thicknesses of either 500 µm (L2) or 1000 µm. In order to achieve a low threshold energy for EPI-Hi and to minimize the energy gap between EPI-Hi and EPI-Lo, we have developed a process for fabricating very thin silicon detectors. At the front of LET we have L0 and L1 detectors with thicknesses of 12 µm and 25 µm, respectively (Figure 107). A 1 MeV proton has energy just sufficient to penetrate the L0 detector and the thin windows in front of the telescope (~3 µm silicon equivalent) and provide the 2-parameter measurement required for particle identification. The thin detectors are sufficiently uniform in thickness to allow the required species separation, including distinguishing between the isotopes of He. Like the H1 and H2 detectors, L0, L1, and L2 are all position sensitive with a central bull’s-eye surrounded by an annulus subdivided into four quadrants. Figure 108b shows a photograph of a prototype L1 detector.
Protons with energy greater than ~8 MeV will have energy losses in the L0 detector that fall below the detection threshold of the front-end electronics. For this reason, in LET we identify events either by a coincidence between L0 and L1 or a coincidence between L1 and L2. It is possible for an event to satisfy the L1•L2 coincidence without triggering L0 either because the signal fell below threshold in L0 or because the particle trajectory did not pass through the active area of this device. We have designed the L0 detector to have its 1 cm2 active area located at the center of a large (~9 cm2) thin silicon membrane that covers the entire field of view defined by the L1•L2 coincidence. This ensures that the analyzed particles will have passed through a consistent amount of material, thereby enabling accurate calculations of their incident energies. The L2 detector has a large annular guard region so that we can determine whether an event defined by a coincidence between L0 and the center element of L1 but lacking a signal in the central five segments of L2 is due to a particle stopping in L1 or to a trajectory passing outside the central part of L2.
Unlike in HET, the central stack detectors in LET (L3 and L4) have an active diameter large enough to intercept even the widest-angle trajectories defined by the L1•L2 coincidence. Thus, the LET detectors do not require guard segments to identify side-exiting particles. We have also segmented these detectors into a central bull’s-eye surrounded by a wide annular region so that we can dynamically adjust the LET geometrical factor and thereby increase the dynamic range in particle intensities that EPI-Hi can measure.
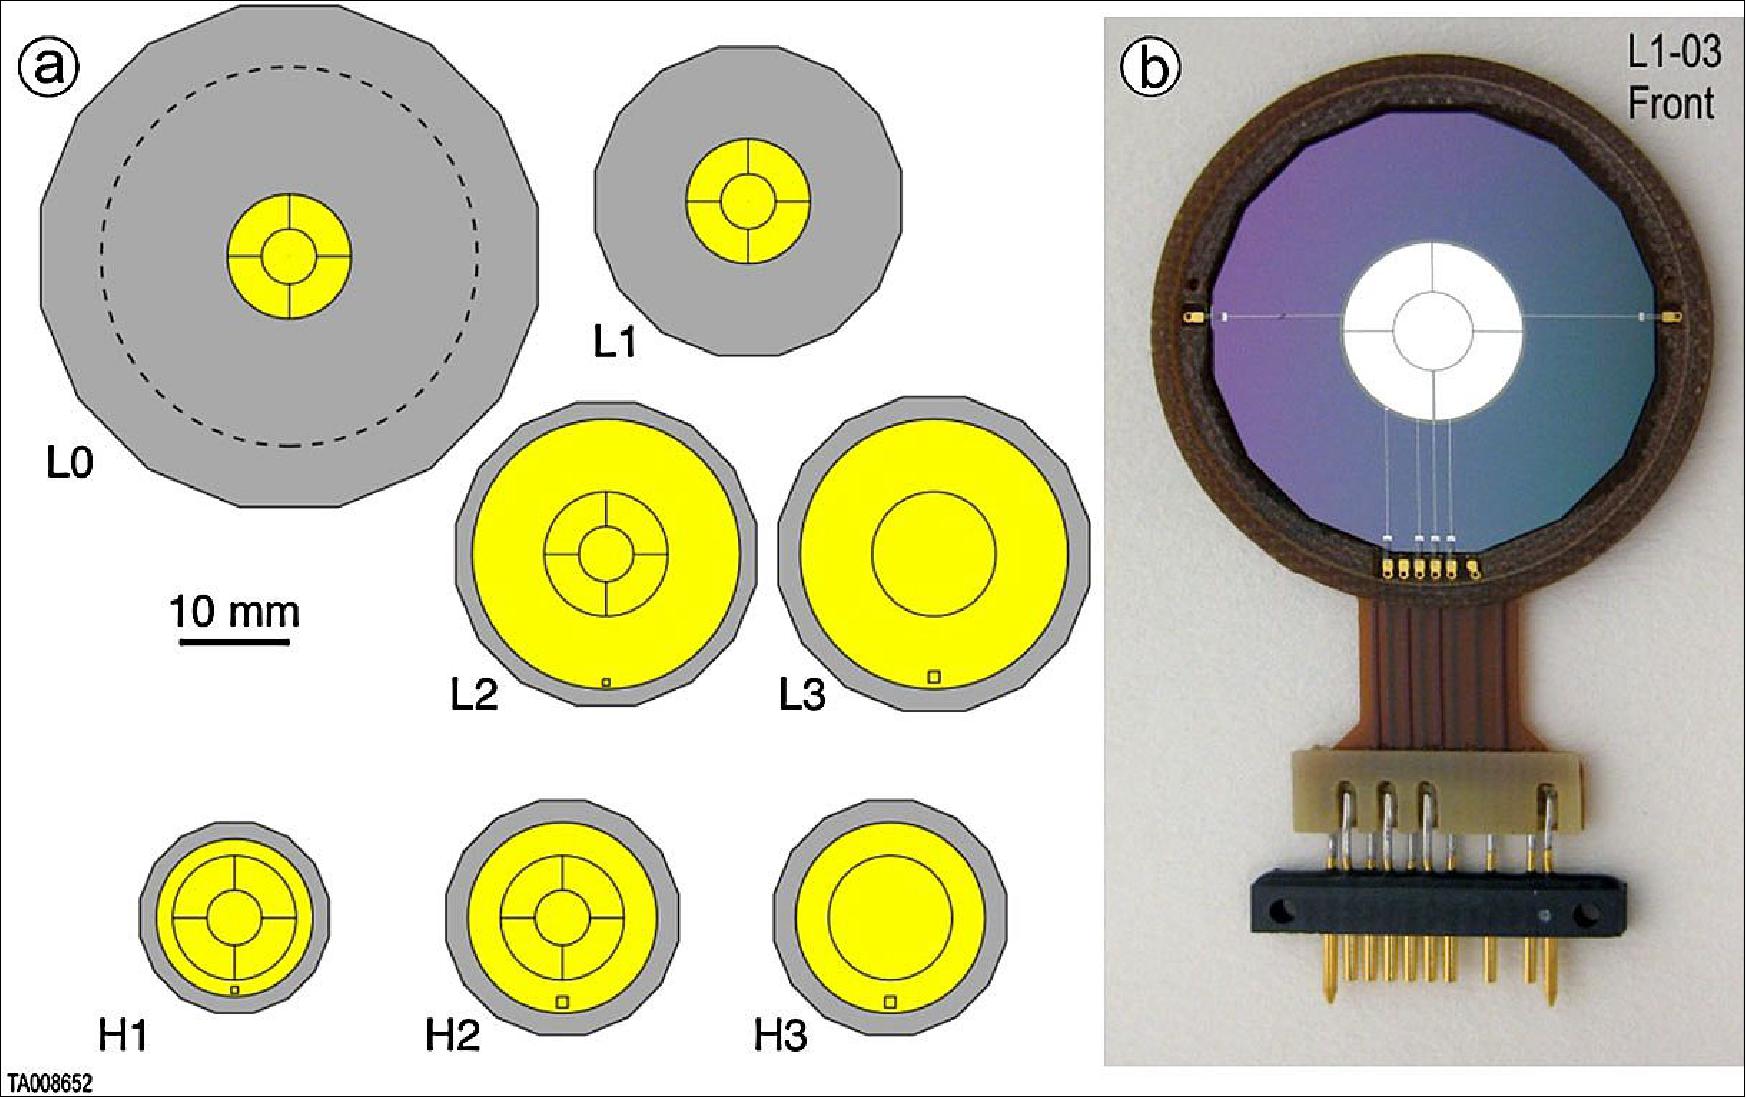
Species and Energy Coverage: Figure 109 shows the energy range covered by LET and HET for elements with atomic numbers in the range 1 ≤ Z ≤ 30. The primary measurements involve the analysis of particles that trigger two position-sensitive detectors and then stop in the central detector stack, as indicated by the absence of a signal in the detector at the opposite end of the stack. In the case of HET we extend the coverage to higher energies by also analyzing events due to particles that penetrate the entire thickness of the stack.
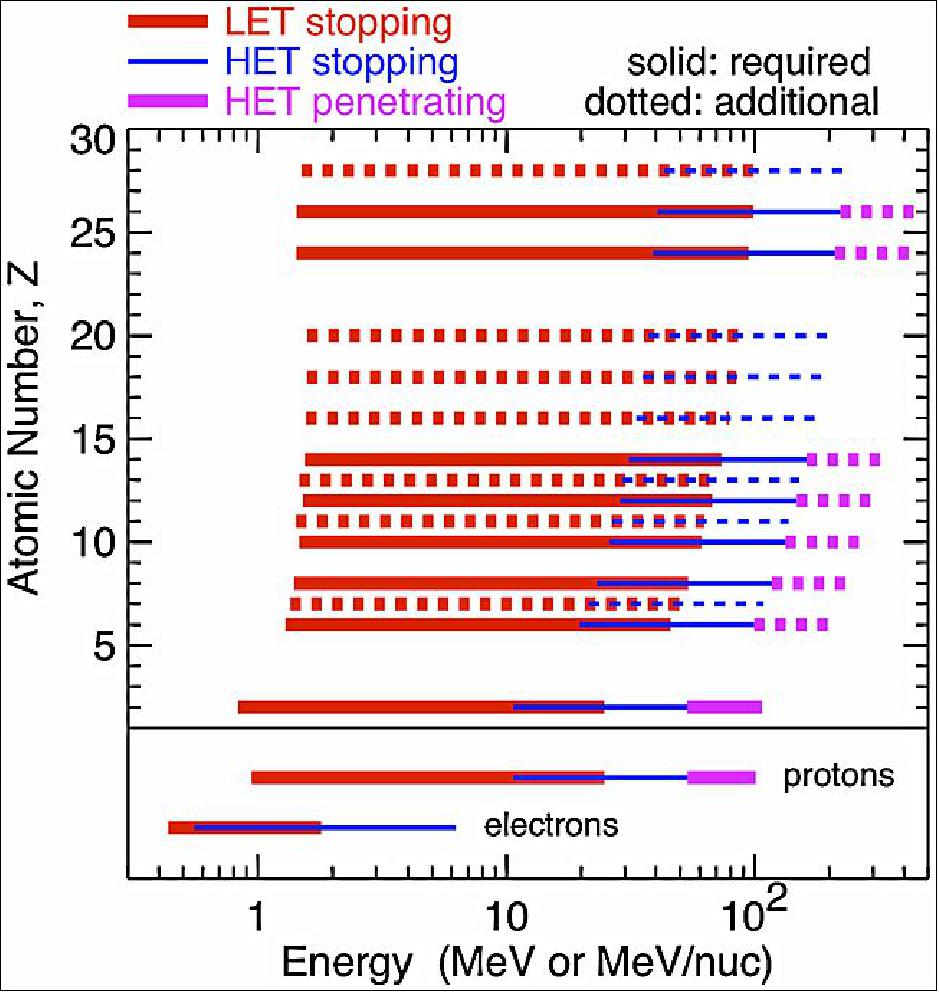
Viewing Directions and Angular Sectioning: Figure 96 shows the locations of the EPI-Hi 45º half-angle conical FOVs in the sky. Although these fields are largely unobstructed, there are several places where portions of the spacecraft or of other instruments block them. The most significant blockage is by the spacecraft’s TPS. The forward view cones of HET and LET1 are intentionally oriented so that the TPS cuts through them, thus allowing detection of particles arriving from as close as possible to the radial direction over the full EPI-Hi energy range. The combination of the EPI-Hi telescopes will allow measurement of nearly complete pitch angle distributions for nominal Parker spiral magnetic fields over the entire orbit except for blockage by the TPS, which affects less than 10º even near perihelion. A number of the EPI-Lo apertures (Figure 97) are also oriented for viewing within the overlap region between the HET and LET1 forward fields of view, thus allowing excellent spectral coverage in the region where the average Parker spiral magnetic field will often be located when the spacecraft is near the Sun.
We assign detected particles to one of 25 sectors based on which of the 5 main detector segments they hit in two position-sensitive detectors (Figure 108). By orienting one of the two detectors with its quadrant sectors rotated 45° relative to those on the other detector we are able to identify 25 unique mean viewing directions, as illustrated in Figure 110a. The angular width of the individual sectors is broad, extending as much as 25° from the mean direction in some cases. However,≥ 80 % of the geometrical acceptance of the sectors fall within 15º of the mean. We rely on the significant overlaps among the sectors to provide information about particle angular distributions, as illustrated in Fig. 110b, where we show the accuracy with which the arrival direction of a narrow beam of particles can be determined as a function of that direction and of the number of particles counted.
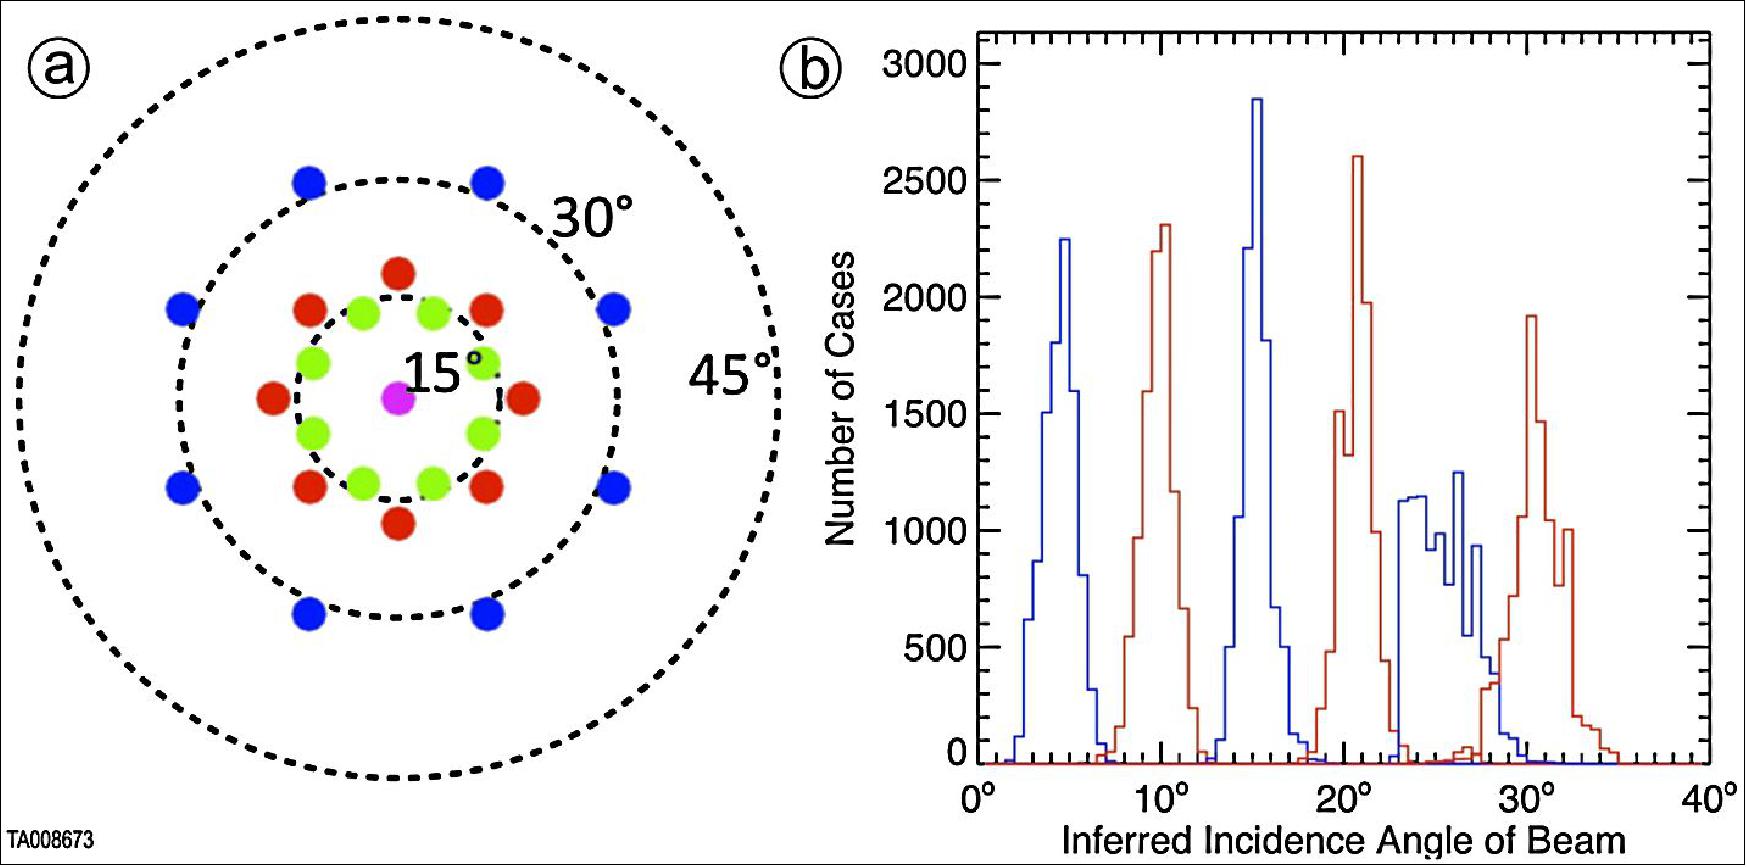
Front-End Electronics: The telescope boards process the signals from the silicon detectors using an ASIC called PHASIC (Pulse Height Analysis System Integrated Circuit). A first generation version of this part is flying in the STEREO/LET and HET instruments. Solar Probe Plus requires a higher radiation tolerance than STEREO, so we have made several modifications to the PHASIC design to facilitate the production of a version that can tolerate a dose of at least 100 krad and also to improve several key aspects of its performance.
The PHASIC contains 16 complete dual-gain PHA chains. Figure 111 shows a schematic diagram of one of these chains. It consists of a charge-sensitive preamplifier that drives two independent post-amplifiers that shape the pulse and provide additional gain. By having two parallel analysis chains we are able to make precise pulse height measurements over the preamplifier’s entire dynamic range. The shaped pulse, which is bipolar with a peaking time of 1.9 µs, drives a peak detector that contains a linear gate and discriminator. The discriminator controls the linear gate and prevents subsequent pulses from contaminating the detected peak level until it has been digitized. The PHASIC uses Wilkinson rundown ADCs, which determine the pulse height by measuring the time interval required for discharging a hold capacitor using a constant current. The PHASIC’s on-chip digital circuitry also counts the number of triggers of the high- and low-gain analysis chains and provides several programmable-input OR-gates that are used to perform the lowest level of event coincidence logic and thereby enable rapid rejection of some uninteresting triggers without requiring readout of the digitized pulse heights. The PHASIC developed for EPI-Hi also incorporates shift registers to record the time-history of the discriminator outputs and aid in identification of crosstalk. Each dual-gain PHA includes a precision test pulser for use in the functional testing and calibration of the circuit.
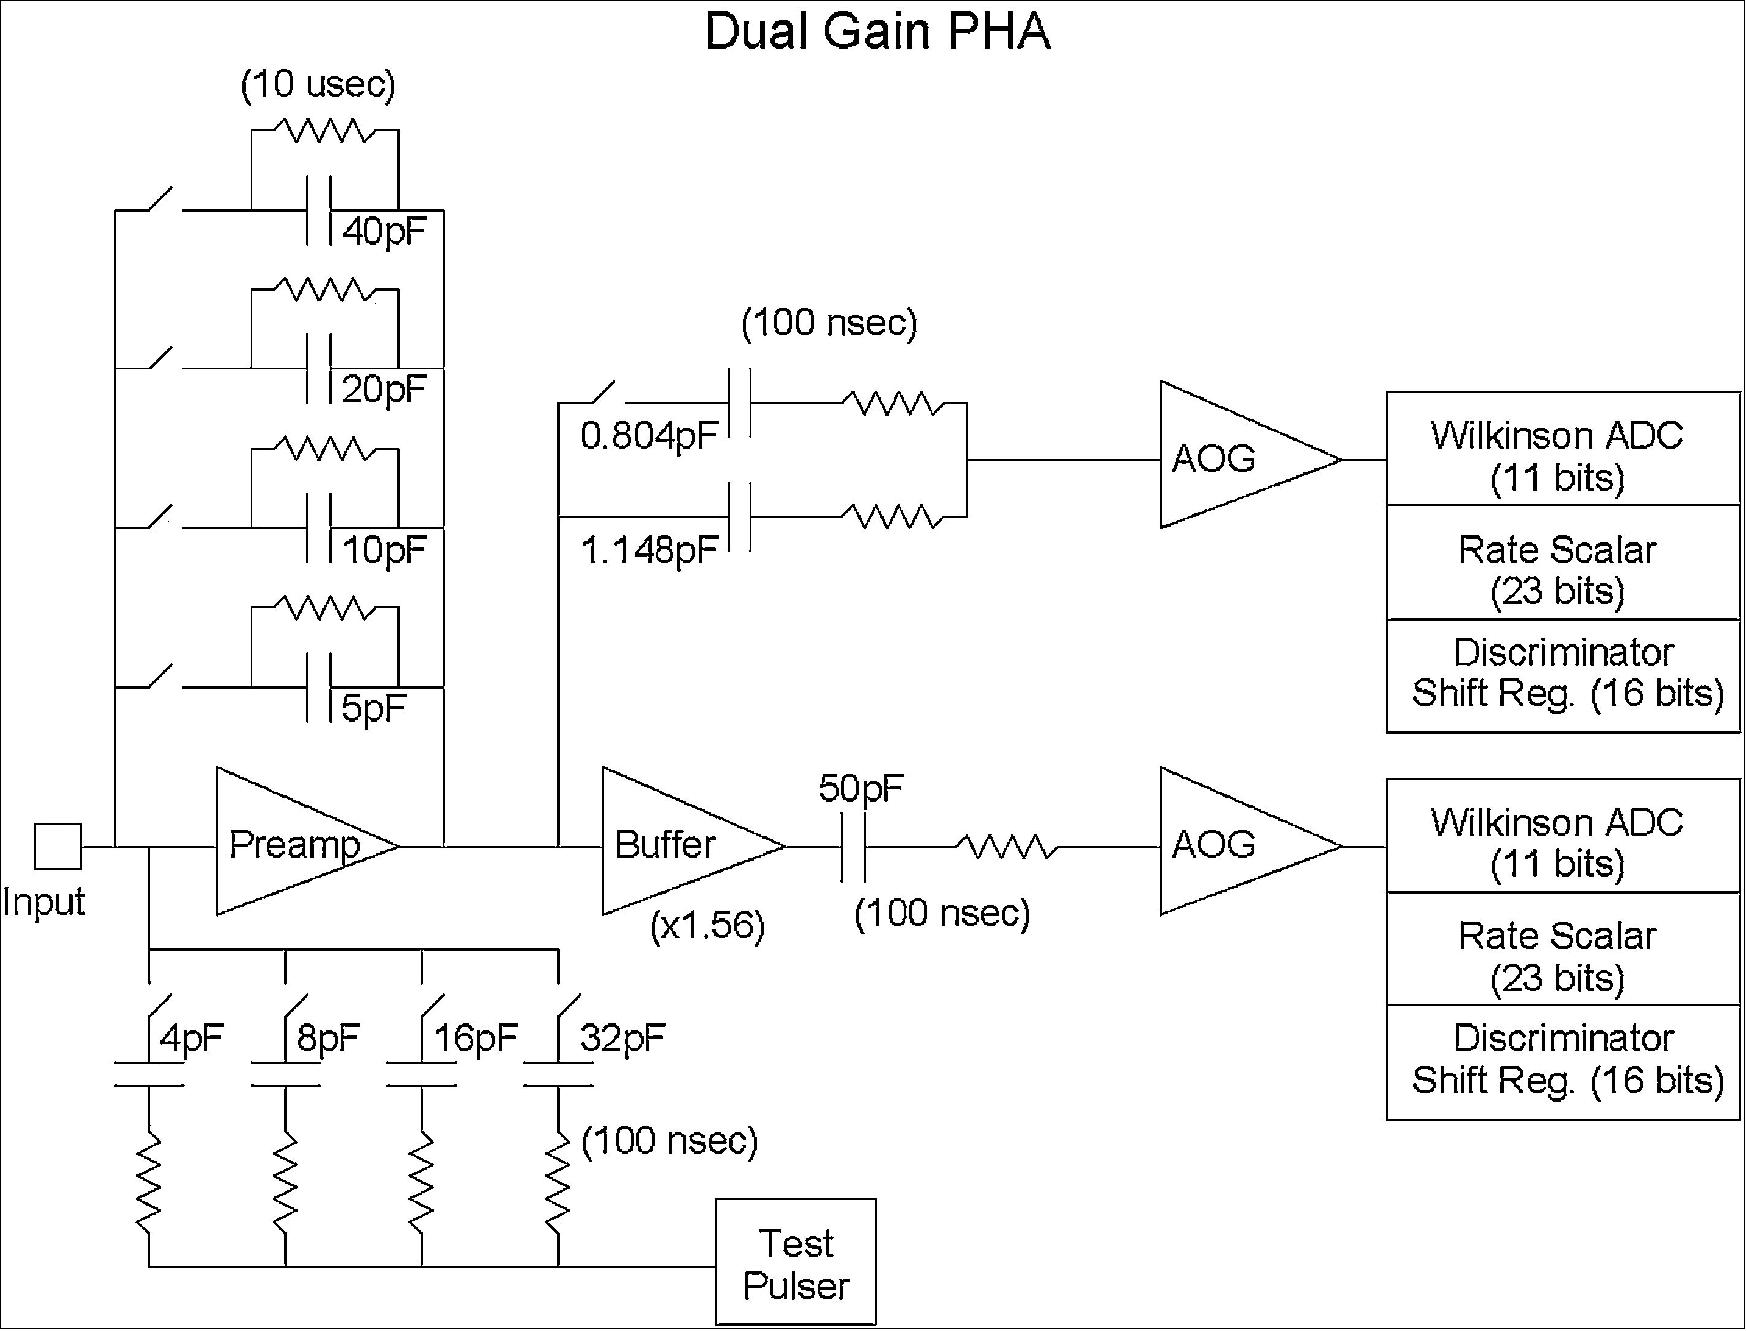
The PHASIC design includes several parameters that are programmable by setting bits in a digital control register. This programmability provides sufficient flexibility so that the PHASIC can meet the analysis requirements of all of the different detectors used in EPI-Hi. By programming the feedback capacitance in the preamplifier we select the gain appropriate to the range of signals for a given thickness of detector. We can also select between two options for the gain ratio between the high- and low-gain analysis chains. Other programmable parameters include the discriminator thresholds and the value of the capacitor used by the test pulser for injecting a calibrated charge into the preamplifier.
Table 11 summarizes the PHASIC specifications. As illustrated in Figure 112, the ASIC is installed in a hybrid circuit containing a number of passive components that support the operation of the chip. These include a precision resistor for each PHA (Pulse Height Analysis) chain that sets the ADC’s rundown current and provides excellent stability over temperature. The design of the ASIC itself relies on ratios of component values for setting key parameters, since such ratios are much more predictable and stable than absolute component values. We have fabricated and tested a prototype version of the EPI-Hi PHASIC using the commercial ON-Semi C5N CMOS process that will allow the addition of Aeroflex processing steps to improve the total tolerance to >100 krad.
Number of dual-gain PHAs | 16 |
Chip size | 7.4 mm x 7.4 mm |
Power | 11 mW per active PHA |
Dynamic range | Up to 23000 (full scale/trigger threshold) |
Integral non-linearity | <0.05% of full scale |
Differential non-linearity | <1% |
High/Low gain ratio | 68 or 40, configurable |
ADC type | Wilkinson |
ADC resolution (each gain) | 11 bits, 12th bit overflow |
Shaping | Bipolar, 1.9 µs to peak |
Preamp feedback capacitance | 5–75 pF, programmable in 5 pF steps |
Preamp full scale output swing | 4.0 V |
Cross-talk between PHAs | <0.2% |
Radiation tolerance | >100 krad, no latchup below 80 MeV/(mg/cm2) |
Gain temperature coefficient | <50 ppm/ºC |
Offset temperature coefficient | <0.1 channel/ºC |
Operating temperature range | -30 to +50ºC |
Leakage current balancing | Up to 32 µA with 10-bit resolution |
Threshold programmability | Up to 6% of full scale (each gain) with 10 bit resolution |
Deadtime per trigger | 4–67 µs (pulse height dependent) |
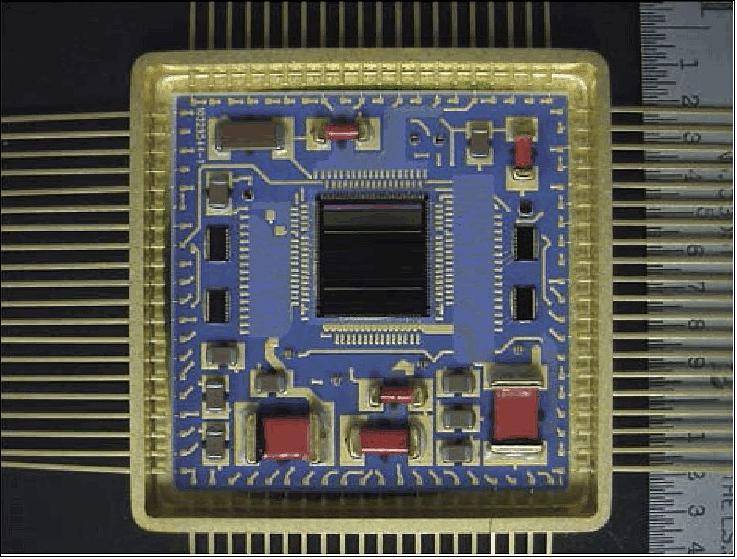
FIELDS (Electromagnetic Fields Investigation)
The FIELDS instrument is being developed at UCB/SSL (University of California, Berkeley/Space Sciences Laboratory), PI: Stuart Bale. The SPP/FIELDS instrument suite was developed under NASA contract NNN06AA01C. Development of the Search Coil Magnetometer sensor is funded by CNES (French Centre National d’Études Spatiales). FIELDS is utilizing four thin long whip antenna and three magnetometers placed on a common boom, the FIELDS instrument will measure: 72)
• Full DC and AC electric and magnetic fields Alfven waves and turbulence, Poynting flux, whistlers, electrostatic waves, solitary waves, shocks and upstream waves, reconnection jets, vperp and more
• Very accurate plasma density (< 1%) and electron temperature (< 5%), strahl diagnostics
• Fast (1 kHz) spacecraft potential and density fluctuation measurements - compressive waves, shocks, current sheets, probe-to-probe timing
• Radio emission (remote) from flares, (Parker) microflares, CME-driven shocks (shock speed/strength)
• Dust and nanodust diagnostics - occurrence rates and mass/speed diagnostics.
FIELDS has significant advantages over previous instruments:
• First-ever ‘double probe’ electric field instrument designed and flown for solar wind studies. The instrument suite will provide:
- Low frequency/DC plasma wave electric fields and phase speeds
- Poynting flux
- Rapid density fluctuations
- Spacecraft floating potential (for SWEAP electrons)
• Front-mounted design avoids enormous plasma wake signatures
- Design optimized to measure true solar wind LF/DC fields
- Design minimizes heat input to the SPP spacecraft
- Longer antenna baseline = better sensitivity for HF/radio/QTN
• FIELDS measures dust impact rate and mass/charge
- More sensitive than traditional dust detectors, larger collection area
- Sensitive to ‘nanodust’ picked up by solar wind
• Dual fluxgate magnetometers reduce spacecraft magnetics challenges.
Instrument Design
The FIELDS instrument combines magnetic and electric field measurements into a single, coordinated experiment. Magnetic fields are measured using both fluxgate and search-coil (induction) magnetometers mounted on a deployable boom in the spacecraft umbra. FIELDS will make electric field measurements both as a current-biased resistively-coupled double-probe instrument and as a capacitively-coupled radio and plasma wave instrument.
This places several constraints on the geometry and surfaces of the antenna system, and upon the design of the preamplifier and receiver electronics. In addition to the primary measurement objectives of electric and magnetic fields and waves, the FIELDS measurements will provide very accurate electron density and temperature measurements, density and velocity fluctuation measurements, and signatures of dust impacts on the SPP spacecraft.
Figure 113 shows the general layout of the FIELDS sensors on the spacecraft. The V1–V4 electric field probes are mounted at the base of the SPP Thermal Protection System (TPS) or heat shield and deploy out into full sunlight. At the SPP perihelion altitude of 9.8 RS these antennas will reach temperatures of more than 1300 °C. Another simple voltage sensor V5 is mounted on the magnetometer boom in the umbra of the spacecraft. Two fluxgate magnetometers (MAGi and MAGo) and a SCM (Search Coil Magnetometer) are also mounted on the boom.
In addition to izts sensor complement, FIELDS consists of three digital signal processing boards, a computer/processor unit, two boards to control antenna biasing, magnetometer formatting electronics, and two low noise power supply units. FIELDS was originally proposed with single string architecture for the processing computer and power supply. A failure mode analysis of measurement requirements performed in Phase B, showed that a single failure in FIELDS could lead to the loss of an unacceptable number of mission-level science requirements. As a result, the FIELDS instrument architecture was split into two halves such that no single failure results in a loss of all measurements.
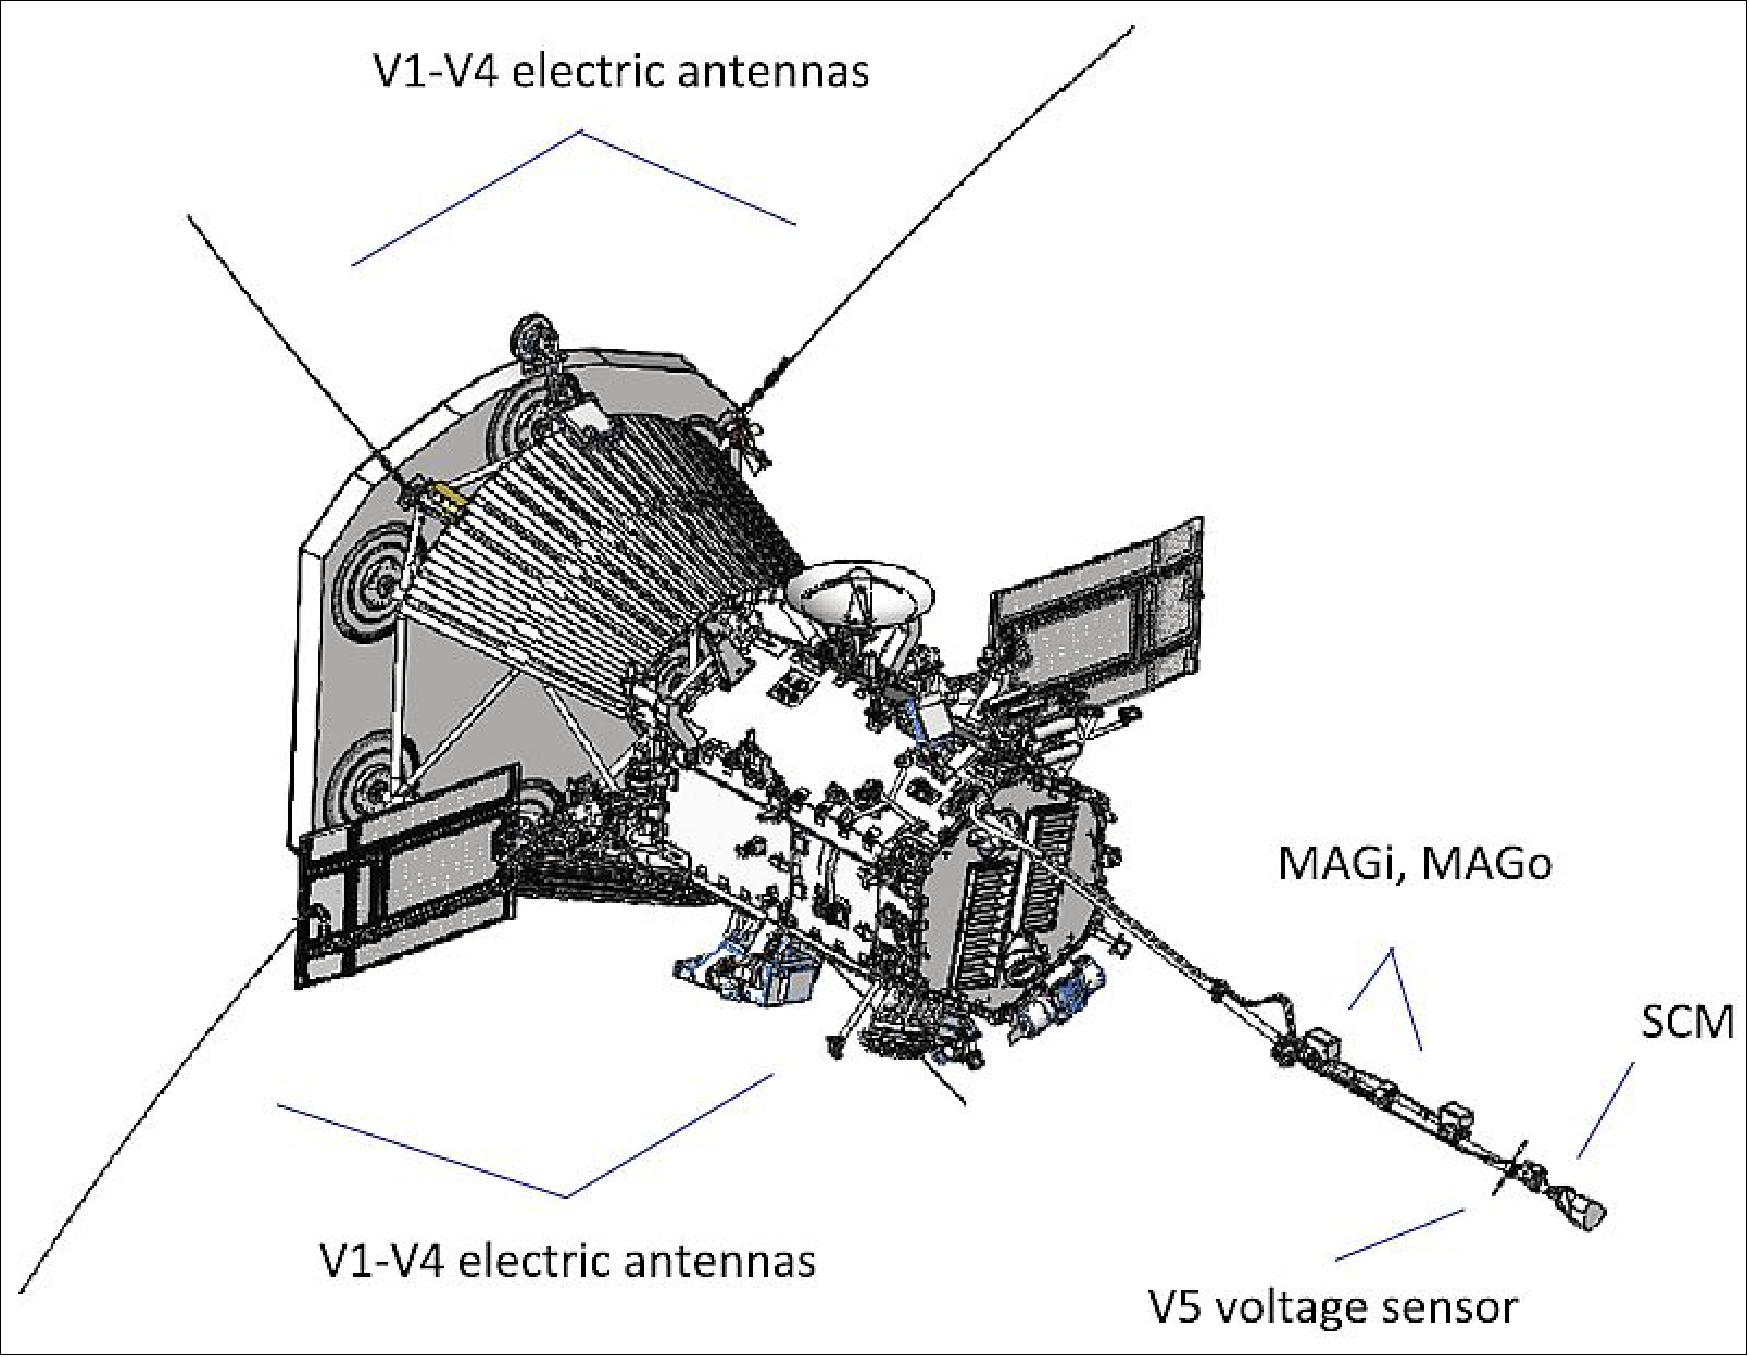
The FIELDS instrument is very sensitive to conducted and radiated noise sources from other instruments and spacecraft subsystems; at high frequencies (~MHz) the instrument is sensitive at the level of nV/√Hz. To accommodate this, a spacecraft level electromagnetic cleanliness (EMC) program has been established. A fundamental requirement of the SPP EMC (Electromagnetic Compatibility) program is that all DC–DC power converters be operated at fixed frequencies in 50 kHz intervals, beginning at 150 kHz (i.e. 150 kHz, 200 kHz, 250 kHz, etc.) and that these chopping frequencies be crystal-controlled. This picket-fence approach concentrates power-supply noise and harmonics into well known and narrow frequency bands providing ‘clean’ regions of spectral density in which to make sensitive measurements.
Further, the FIELDS instrument team made the decision to synchronize its internal sampling clocks to multiples of 150,000 Hz with its master clock operating at 150,000 Hz x 256 = 38.4 MHz. To accommodate digital signal processing algorithms, which prefer power-of-two data blocks, FIELDS uses a rescaled timebase that is called a ‘New York second’ (NY sec) and define 1 NYsec as a convenient power-of-two number of clock cycles (217) of the standard 150 kHz power supply chopping frequency. Thus 1 NYsec is defined as being 217/150,000 ~ 0.873813 . . . sec.
While the FIELDS DFB ‘burst mode’ operates in sync at 150,000 Sa/s (samples/second), which is 217 samples/NYsec, the lower cadence data is sampled at rates that are 150,000 Sa/s divided by further powers-of-two. For example, the fluxgate magnetometers operate in synchronization at 150,000/29 ~292.969 Sa/s, which is exactly 256 Sa/NYsec. This allows FIELDS to sample in synchronization with the EMC prescribed frequency of 150 kHz avoiding large noise signals from power converters and to maintain the power-of-two data format desired by FFT (Fast Fourier Transform) algorithms. Note that the FIELDS and SWEAP instruments use a master/slave clock configuration over a dedicated interface: SWEAP uses the FIELDS clock signal when available. This will maintain phase coherence between the FIELDS and SWEAP measurements, enabling both accurate high cadence data processing and the removal of deterministic noise signals.
Sensor and Preamp Design: The FIELDS suite uses five voltage probes and three magnetometers to make measurements over 20 MHz of bandwidth and 140 dB of dynamic range. The ‘V1–V4’ voltage probes function both as current-biased double probe electric fields sensors (as on the THEMIS or Van Allen Probes satellites) and as capacitively-coupled radio and plasma wave sensors (as on Wind, Cassini, STEREO). The V5 sensor makes a simple voltage measurement near the magnetometer boom and may be used to infer the sunward electric field for plasma waves. The fluxgate and search coil magnetometers are standard devices for measuring low frequency and wave magnetic fields.
The V1–V4 Electric Antennas: Four voltage sensors (V1–V4) are deployed in nearly orthogonal, co-linear pairs slightly behind the plane of the spacecraft heat shield (the Thermal Protection System or ‘TPS’), as shown in Figure 113. To function properly as a double-probe electric field measurement, these sensors must be coupled to the plasma through a photoelectron current; i.e. they must be in sunlight. This orientation also keeps the V1–V4 antennas out of the spacecraft wake and ensures a minimal perturbation to the spacecraft interaction with the solar wind.
Figure 114 shows a CAD drawing of one of the units; each unit is identical, with some small differences in the mounting hardware. The primary sensor consists of a 2 m long, 1/8” diameter Niobium C-103 thin-walled tube (called the ‘whip’). All but the last 8 cm of the whip are exposed to full sunlight and will reach high temperatures (>1300ºC) at SPP perihelion. The whip is clamped to a 30 cm Molybdenum ‘stub’ element which acts as an electrical and thermal isolator and the signal from the whip is fed through with a molybdenum wire to the hinge and preamp below. A chevron shaped C-103 heat shield covers the final 8 cm of the whip and the entire stub. This creates a substantial shadowed area that radiates excess heat into space. Additionally, the shield, whip, and stub are all isolated from each other with sapphire, a good thermal insulator. Both of these features greatly reduce the thermal input into the base, where conductors and other materials must be below 230ºC. This design has been modeled and verified in the laboratory. The preamp sits near the bottom of the antenna mechanism, to minimize stray capacitance from the cables. The antenna system is stowed back against the spacecraft for launch and deploys by spring force and is rate-limited by a flyweight brake system. After release, it will take a few seconds to deploy to the final configuration. Each sensor will be deployed individually, with the FIELDS electronics operating, to aide in calibration and characterization of the measurement.
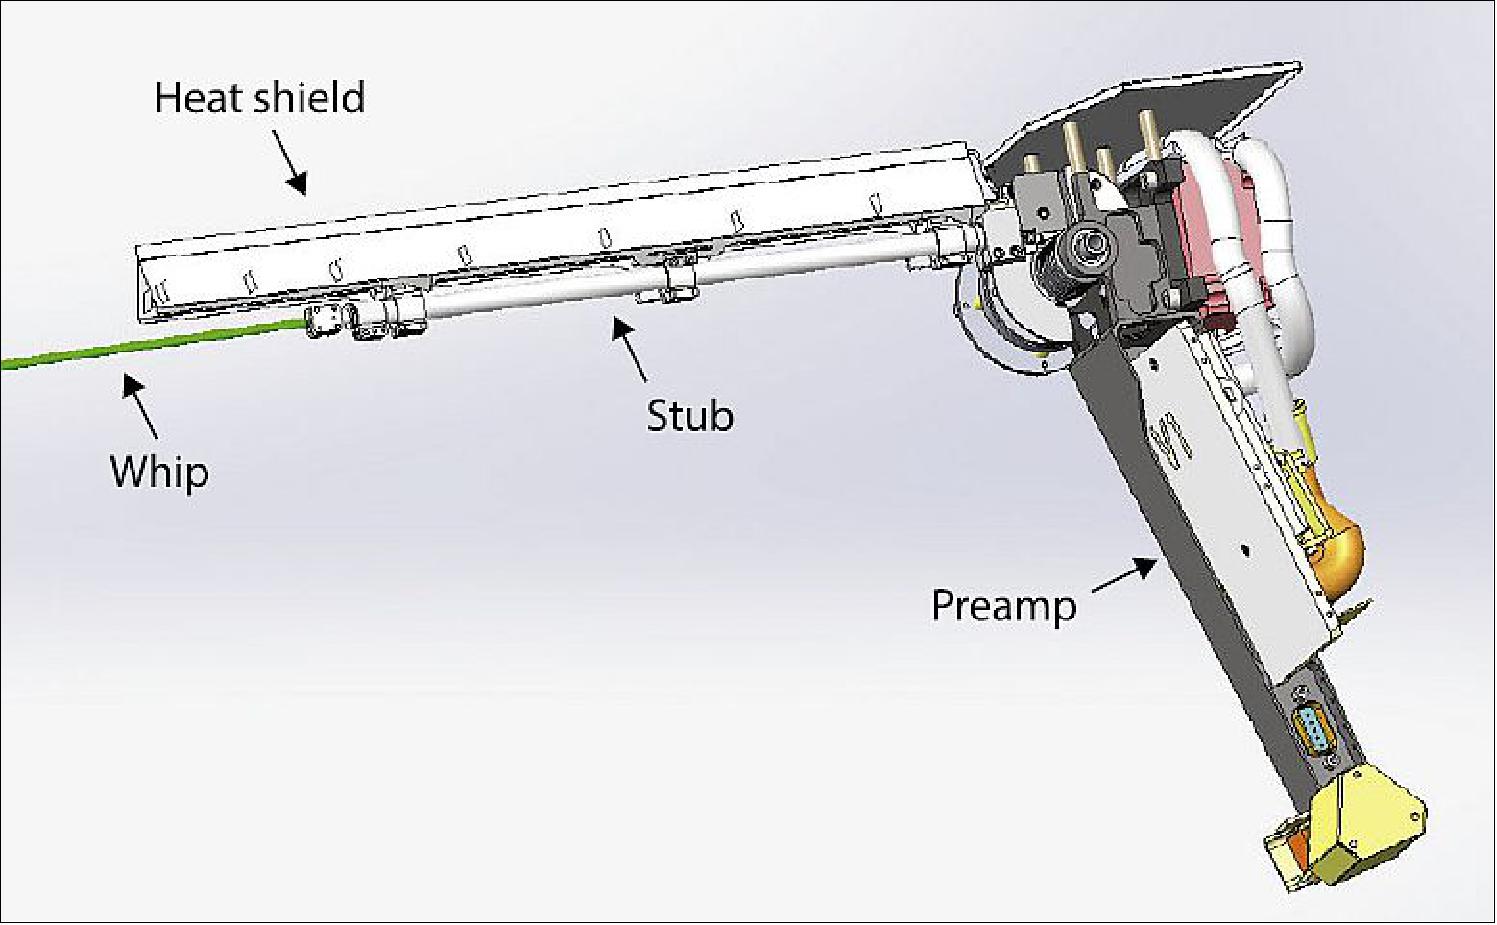
The V5 Voltage Sensor: A simple voltage probe (V5) will be mounted on the SPP magnetometer boom, deployed in the umbra behind the spacecraft (and is therefore coupled to the plasma through thermal electrons rather than photoelectrons). While this sensor sits in the spacecraft plasma wake and will see the low frequency signatures of that interaction, it will provide good capacitively-coupled voltage measurements of the radial electric field E|| present in plasma waves and will help constrain the knowledge of the electrostatic center of the spacecraft.
The V5 design is shown in Figure 115. Two short sensor elements extend from a preamplifier box and are electrically isolated from the box by PEEK fittings. The two tube elements are tied together at the preamp (i.e. it is not a differential measurement).
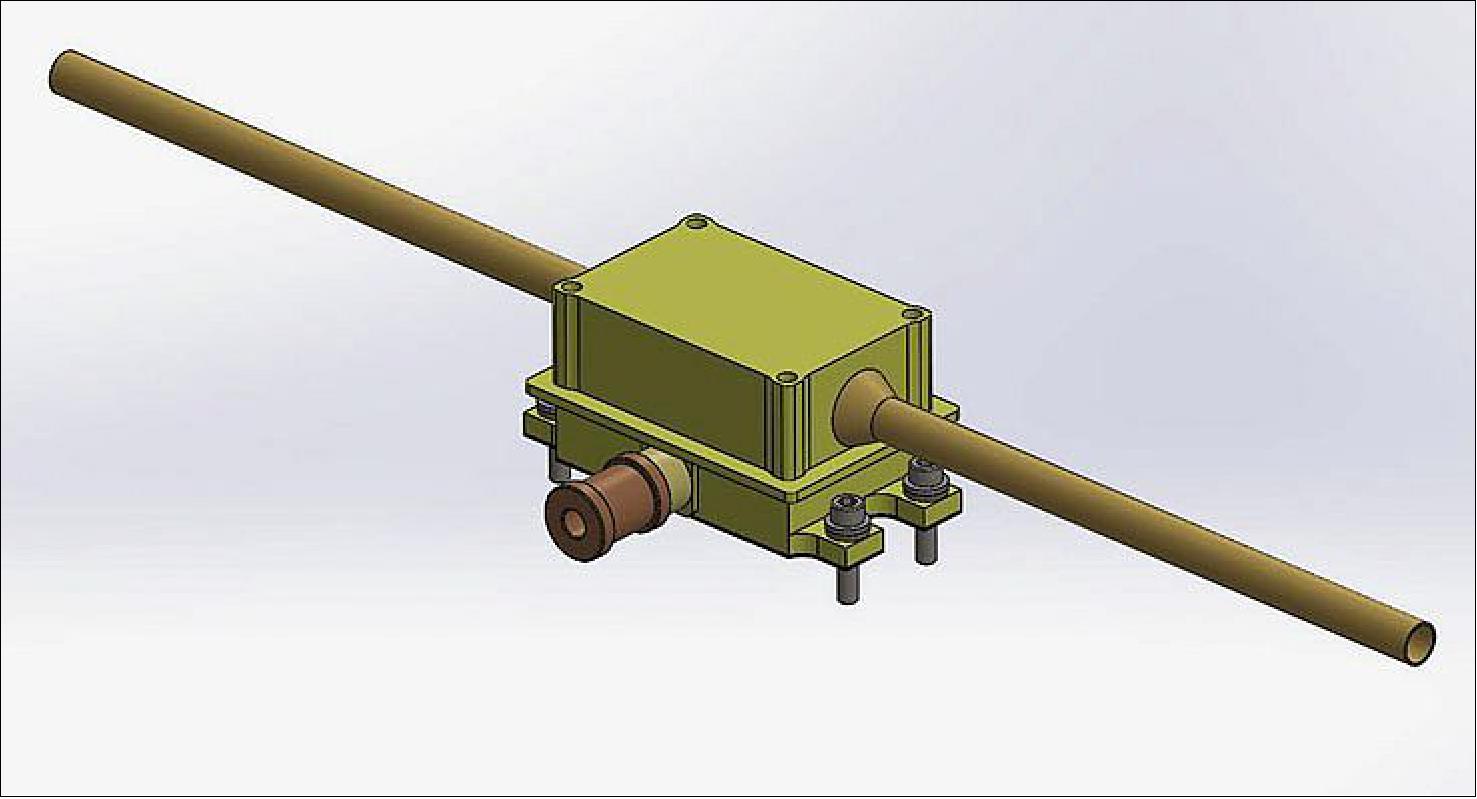
Electric Preamplifiers: The four main antennas are connected individually to the V1–4 preamps and the fifth antenna on the mag boom is connected to the V5 preamp. The preamps provide low-noise highimpedance inputs, voltage gain, and low impedance outputs. As shown in Figure 116, the V1–4 preamps provide three outputs: the HF 20 MHz bandwidth output to the RFS (Radio Frequency Spectrometer), the MF 1 MHZ output to the TDS (Time Domain Sampler), and the LF 64 kHz output to the AEB (Antenna Electronics Board) and DFB (Digital Fields Board). The HF amplifier chain is a new design consisting of a FET input buffer followed by a wide bandwidth op amp providing gain and driving a 50 ohm terminated coax output. The LF and MF signals are provided by a second unity gain op amp, as used in legacy designs (e.g. THEMIS, RBSP). This op amp is powered by a supply referenced to a “floating ground driver” on the AEB and provides a signal range of ±70 V from DC to 300 Hz and ±10 V from 300 Hz to 1 MHz. The V5 preamp does not include the HF chain and consists of the single legacy op amp design providing LF and MF outputs.
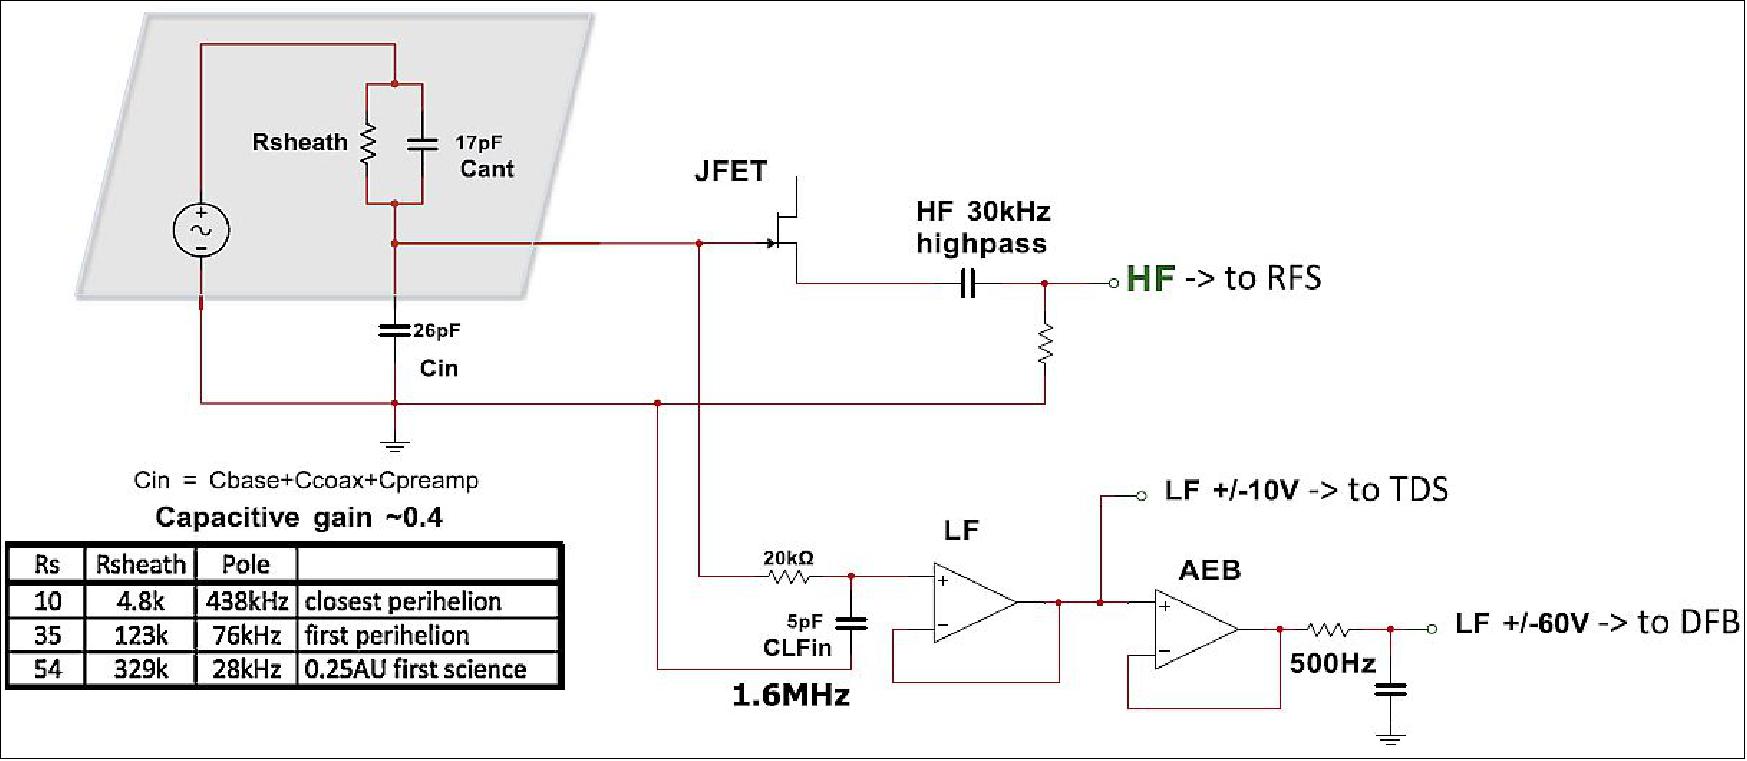
Fluxgate Magnetometers: The two fluxgate magnetometers (MAGs) for SPP are similar to the triaxial, wide-range, low-power, and low-noise magnetometers built by GSFC (Goddard Space Flight Center) for MAVEN, Van Allen Probes, STEREO, etc. This line of flight magnetometers totals 79 instruments to date starting with IMP-4, launched in 1966. For SPP, the MAGs will provide data with bandwidth of ~140 Hz, sampling at 292.97 Sa/s, as part of the FIELDS instrument suite. The measurement dynamic range is ±65,536 nT with a resolution of 16 bits. The primary science objectives addressed by the magnetometers are determining the structure and dynamics of the magnetic fields at the sources of the fast and slow solar wind, contributing to the study of the coronal processes that lead to heating of the solar corona, and exploring the roles of shocks, reconnection, and turbulence in accelerating energetic particles.
The sensor design for the SPP MAGs (Figure 117) will provide maximum thermal isolation from the boom, which will undergo considerable temperature variation, depending on its location in the umbra or in sunlight. Kinematic mounts limit the heat transfer across the feet of the sensor. The heritage of the kinematic mounts derives from the Juno magnetometers, where they were used to ensure that the sensor temperature variation was limited. Heater power is provided by a proportional AC heater to reduce the temperature variations of the sensors and to provide survival heating. The heater is synchronized to a frequency provided by theMEP. The sensor mass requirements have lead to use of a lightweight composite base.
Each MAG sensor has a corresponding electronics board in the SPP FIELDS MEP. For enhanced reliability, the outer MAG board is controlled by the DCB, and the inner MAG board by the TDS. The control component on each board is the rad-hard Aeroflex FPGA that contains all of the MAG logic functions and on-board SRAM. These functions include command handling, telemetry packet formatting, ADC readout, auto-ranging algorithm, DRIVE clock generation, and housekeeping readout. MAG produces a data product at the required cadence of 1 message per 0.874 seconds. The ranging algorithm selects one of the four ranges (±1024, ±4096, ±16,384, ±65,536 nT) based on the ambient magnetic field. The sensor connection to the electronics boards is accomplished by a tuned circuit, including the harness, which is calibrated at the GSFC Acuña Magnetometer Test Site. Because the sensor temperatures will be substantially lower than standard GSFC magnetometer sensors and will vary significantly due to changes in the spacecraft Mag boom orientation relative to the Sun, calibration will be performed over a wide range of temperatures.
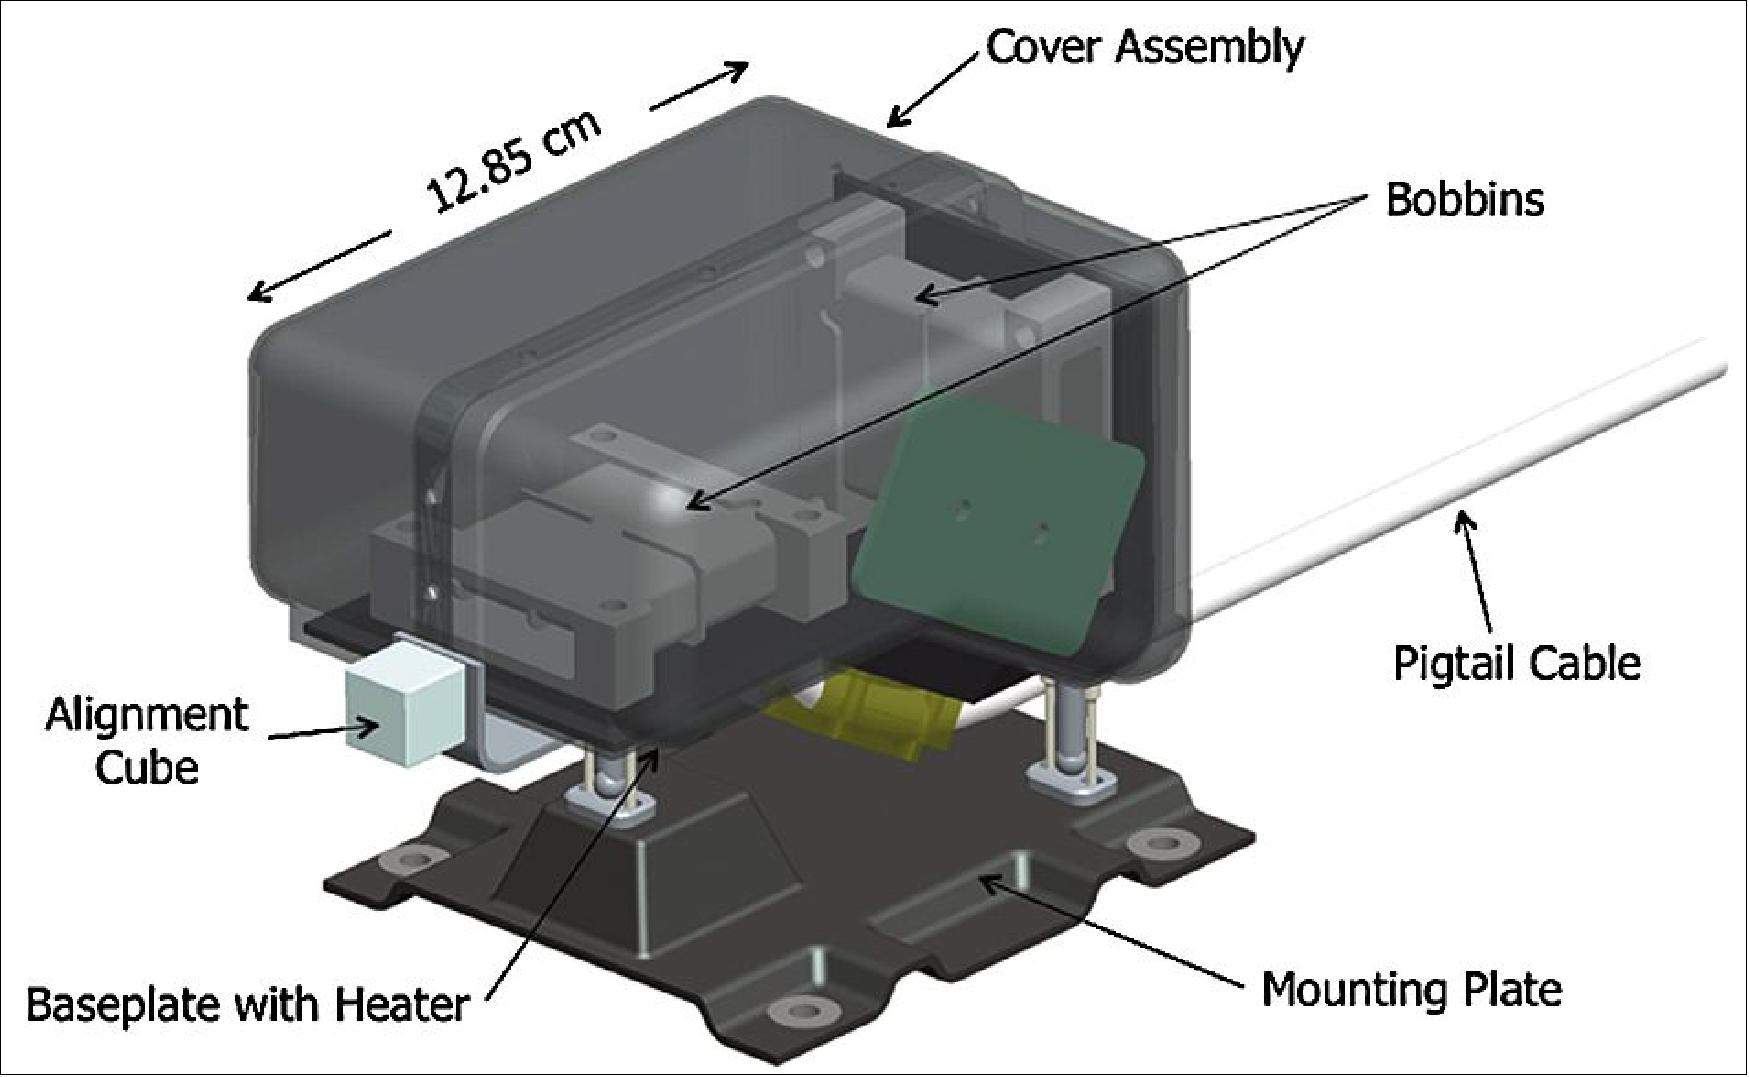
TheMAG sensors are mounted on the SPP magnetometer boom (Figure 118), where their relative separation and close proximity to the spacecraft compromise their gradiometric functionality, and thus the ability for an accurate removal of any spacecraft field contamination at the outer MAG. This enhances the importance of the magnetic cleanliness testing being implemented for the spacecraft and payload.
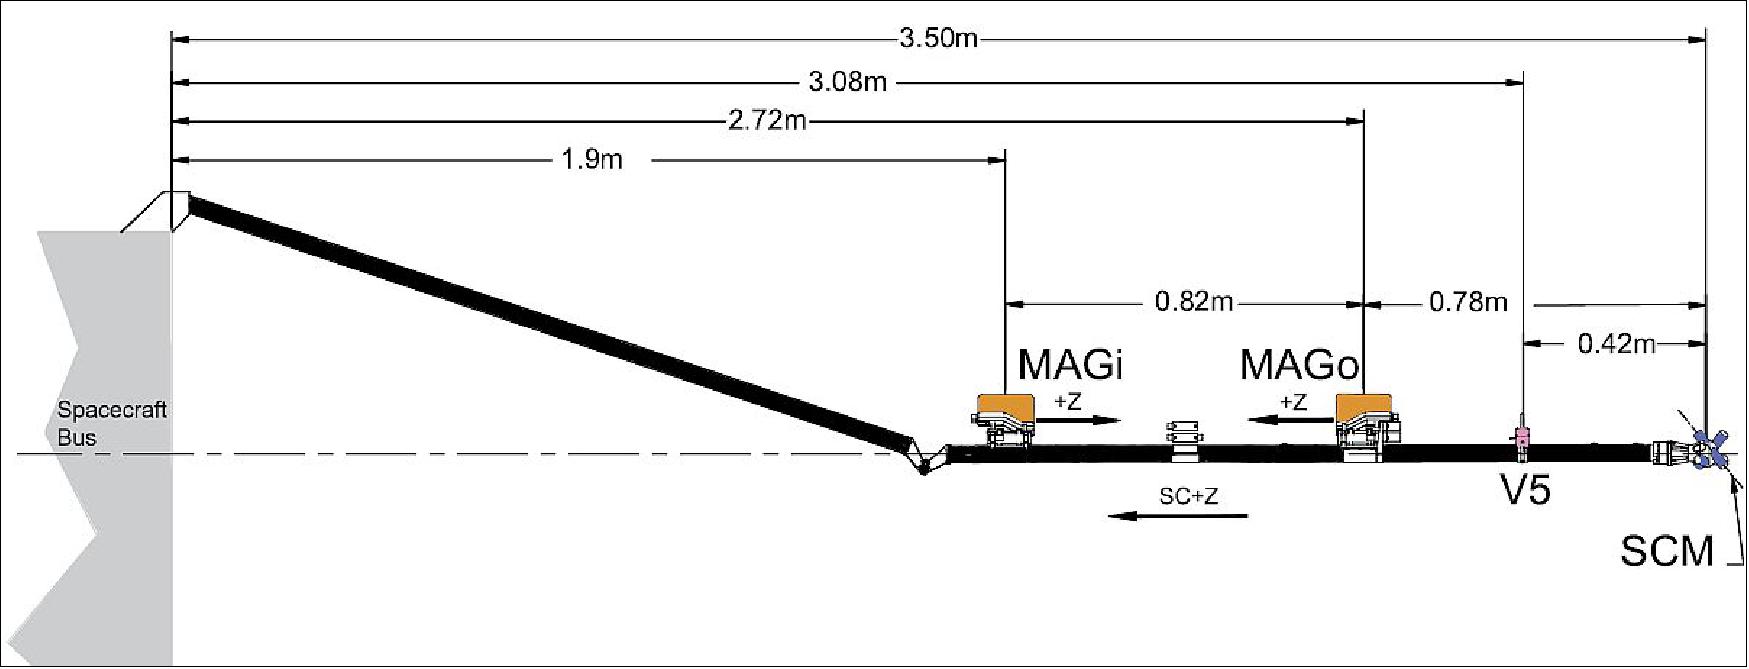
SCM (Search Coil Magnetometer): The SCM will measure all three components of the AC magnetic signature of solar wind fluctuations, from 10 Hz up to 50 kHz and a single component from 1 kHz to 1 MHz. The wide bandwidth and dynamic range allows FIELDS to investigate transients caused by interplanetary shocks and reconnection, the turbulent cascade beyond the electron kinetic scale, but also numerous plasma wave modes.
The SCM instrument consists of a triaxial search-coil that has a solid technical heritage in several past missions. Nearly identical instruments are being built for the Taranis and Solar Orbiter missions. Each sensor consists of a magnetic core with a winding whose voltage is proportional to the time-derivative of the magnetic field. Two sensors of SCM cover the ELF/VLF frequency range from 10 Hz–50 kHz. The third one is a dual-band sensor that covers both the ELF/VLF and the LF/MF (1 kHz–1 MHz) ranges. The three sensors, each of which is 104 mm long, are mounted orthogonally on a non-magnetic support (Figure 119).
Two challenges raised by Solar Probe Plus are the low temperature environment on the magnetometer boom, and the unusually large dynamic range of the instrument. The latter is needed to accommodate both small-amplitude fluctuations of solar wind turbulence, and large transients near the Sun. Peak values, as scaled from observations made by Helios at distances from the Sun down to 0.29 AU, may reach 3000 nT in the ELF/VLF range. Thanks to a careful design, the dynamic range of the instrument has been increased from past models by several tens of dB, now reaching 160 dB in the ELF/VLF range, and 130 dB in the LF/MF range. SCM will be located in the shade of the spacecraft, at the end of the magnetometer boom, and thus needs a heater to keep it above deep space temperatures. To mitigate thermal losses, the instrument will be wrapped in an insulatingMLI layer, with very compact design. The SCM design is very compact; in particular, the preamplifier has been miniaturized by 3D Plus, and will be located inside the foot of the instrument.
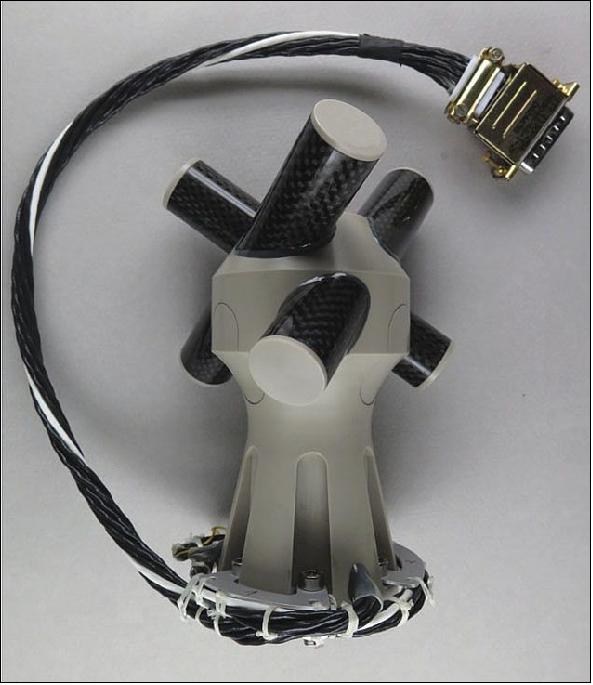
The sensitivity and instrument response of the SCM are illustrated in Figure 120. The sensitivity is sufficient to observe small-amplitude solar wind turbulence in the inner heliosphere, and properly distinguish Elsässer variables, while also capturing large transients (hence the low gain -50 dBV/nT in the ELF/VLF range). The analog signals in the ELF/VLF range will be processed by the Digital Fields Board (DFB), which will deliver either spectra or continuous waveforms up to 150,000 Sa/s. The LF/MF signal will be processed by any of the RFS, DFB, or TDS receivers. The survey data products will be spectral matrices, which give access to the polarization, and waveforms of up to 293 Sa/s for all three components. The latter will be merged with the DC magnetic field, as measured by MAG, into one single composite magnetic field product.
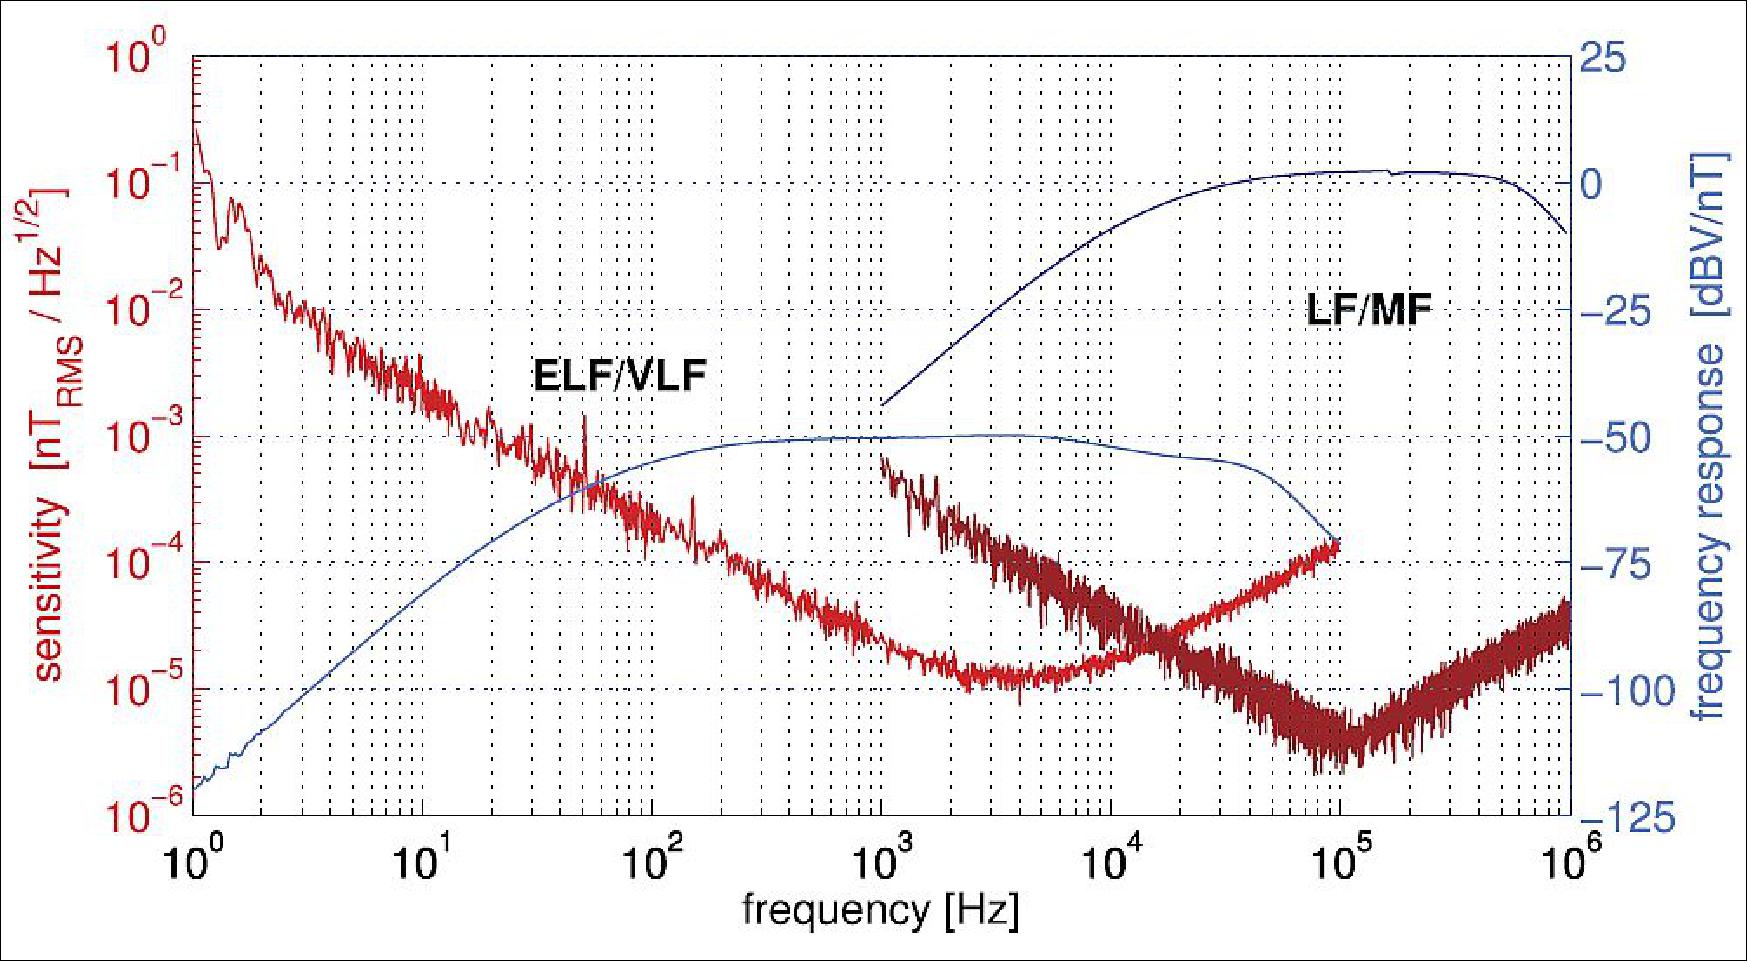
MEP (Main Electronics Package): The MEP is the stack of FIELDS receivers, computers, and power supplies and is mounted within the SPP spacecraft structure. Figure 121 shows the engineering model (EM) MEP on the bench in Berkeley.
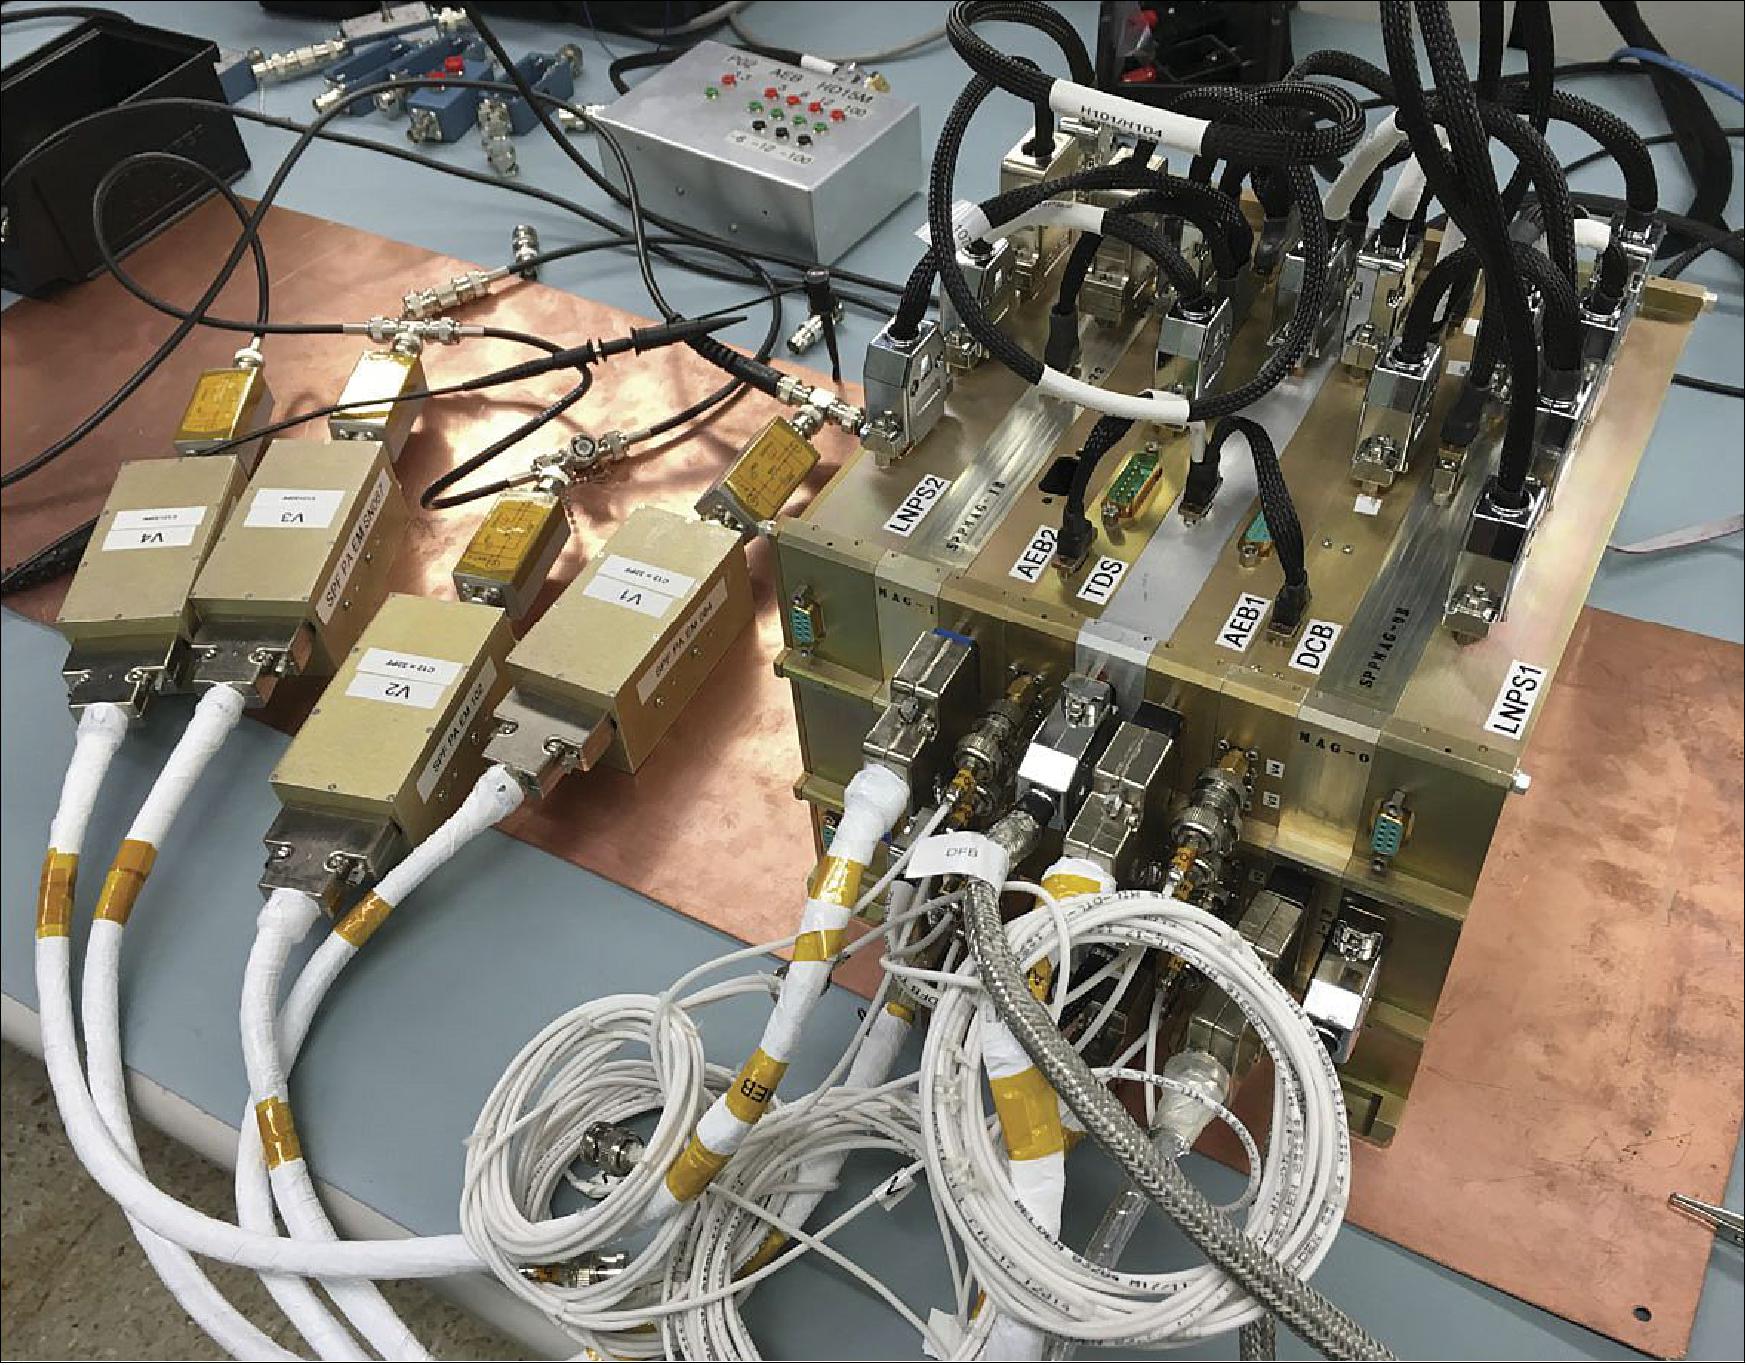
HeliOSSP (Heliospheric Origins with Solar Probe Plus)
Marco Velli of JPL (Jet Propulsion Laboratory) will serve as the Observatory Scientist (OS) in support of the NASA Science Mission Directorate. The OS investigation addresses SPP science objectives using the SPP system of measurements and provides theoretical input and independent advice to maximize the scientific return from the mission. 73)
Development Status
• July 5, 2018: The launch of Parker Solar Probe, the mission that will get closer to the Sun than any human-made object has ever gone, is quickly approaching, and on June 27, 2018, Parker Solar Probe’s heat shield — called the TPS (Thermal Protection System) — was installed on the spacecraft. 74)
- A mission 60 years in the making, Parker Solar Probe will make a historic journey to the Sun’s corona, a region of the solar atmosphere. With the help of its revolutionary heat shield, now permanently attached to the spacecraft in preparation for its August 2018 launch, the spacecraft’s orbit will carry it to within 4 million miles of the Sun's fiercely hot surface, where it will collect unprecedented data about the inner workings of the corona.
- The eight-foot-diameter (2.44 m) heat shield will safeguard everything within its umbra, the shadow it casts on the spacecraft. At Parker Solar Probe’s closest approach to the Sun, temperatures on the heat shield will reach nearly 2,500 degrees Fahrenheit (1370 ºC), but the spacecraft and its instruments will be kept at a relatively comfortable temperature of about 85 degrees Fahrenheit (29ºC).
- The heat shield is made of two panels of superheated carbon-carbon composite sandwiching a lightweight 4.5-inch-thick (11.4 cm) carbon foam core. The Sun-facing side of the heat shield is also sprayed with a specially formulated white coating to reflect as much of the Sun’s energy away from the spacecraft as possible.
- The heat shield itself weighs only about 72 kg — here on Earth, the foam core is 97 percent air. Because Parker Solar Probe travels so fast — 430,000 miles per hour at its closest approach to the Sun, fast enough to travel from Philadelphia to Washington, D.C., in about one second — the shield and spacecraft have to be light to achieve the needed orbit.
- The reinstallation of the Thermal Protection System — which was briefly attached to the spacecraft during testing at the Johns Hopkins Applied Physics Lab in Laurel, Maryland, in fall 2017 — marks the first time in months that Parker Solar Probe has been fully integrated. The heat shield and spacecraft underwent testing and evaluation separately at NASA’s Goddard Space Flight Center in Greenbelt, Maryland, before shipping out to Astrotech Space Operations in Titusville, Florida, in April 2018. With the recent reunification, Parker Solar Probe inches closer to launch and toward the Sun.
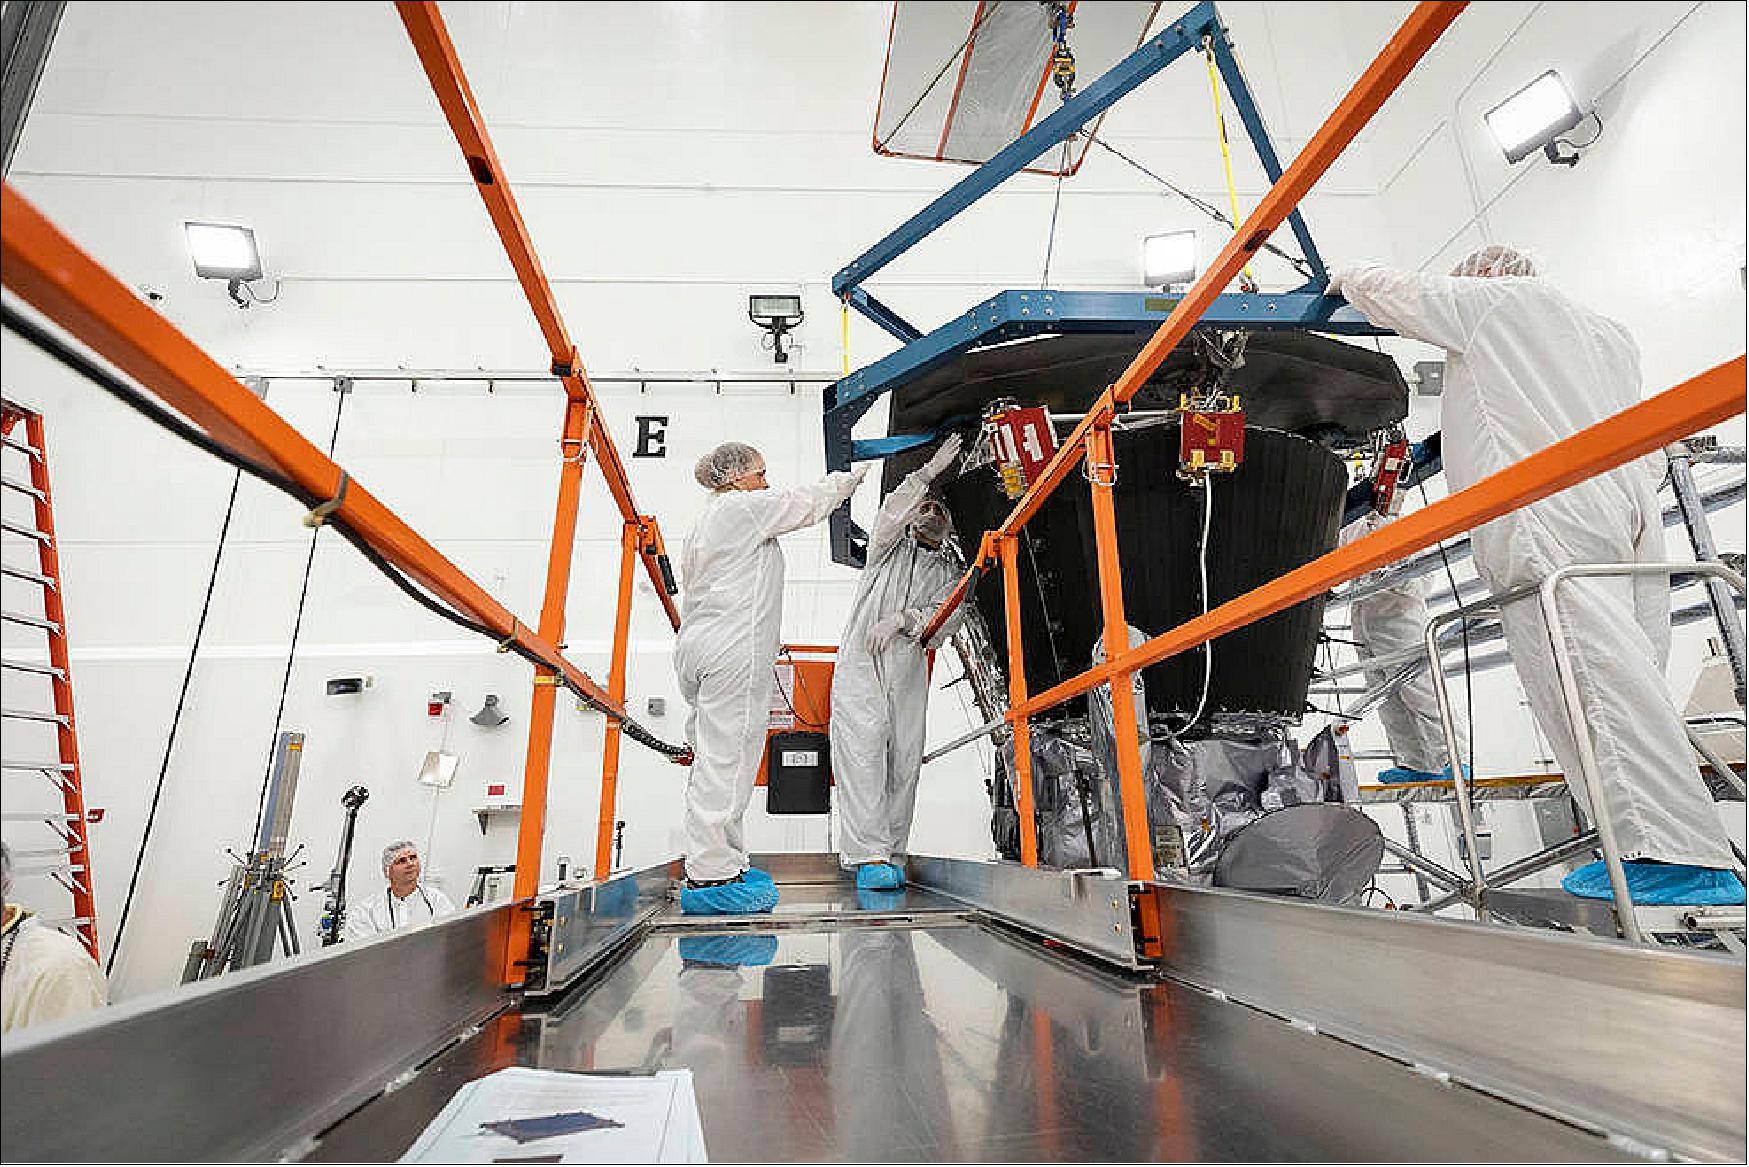
• May 16, 2018: As we develop more and more powerful tools to peer beyond our solar system, we learn more about the seemingly endless sea of faraway stars and their curious casts of orbiting planets. But there’s only one star we can travel to directly and observe up close — and that’s our own: the Sun. 75)
- Two upcoming missions will soon take us closer to the Sun than we’ve ever been before, providing our best chance yet at uncovering the complexities of solar activity in our own solar system and shedding light on the very nature of space and stars throughout the universe.
- Together, NASA’s Parker Solar Probe and ESA’s (the European Space Agency) Solar Orbiter may resolve decades-old questions about the inner workings of our nearest star. Their comprehensive, up-close study of the Sun has important implications for how we live and explore: Energy from the Sun powers life on Earth, but it also triggers space weather events that can pose hazard to technology we increasingly depend upon. Such space weather can disrupt radio communications, affect satellites and human spaceflight, and — at its worst — interfere with power grids. A better understanding of the fundamental processes at the Sun driving these events could improve predictions of when they’ll occur and how their effects may be felt on Earth.
- “Our goal is to understand how the Sun works and how it affects the space environment to the point of predictability,” said Chris St. Cyr, Solar Orbiter project scientist at NASA’s Goddard Space Flight Center in Greenbelt, Maryland. “This is really a curiosity-driven science.”
• April 30, 2018: The Parker Solar Probe's Faraday cup, a key sensor aboard the $1.5 billion NASA mission launching this summer, earned its stripes last week by enduring testing in a homemade contraption designed to simulate the sun. 76)
- The cup will scoop up and examine the solar wind as the probe passes closer to the sun than any previous manmade object. Justin Kasper, University of Michigan associate professor of climate and space sciences and engineering, is principal investigator for Parker's SWEAP (Solar Wind Electrons Alphas and Protons) investigation.
- In order to confirm the cup will survive the extreme heat and light of the sun's surface, researchers previously tortured a model of the Faraday cup at temperatures exceeding 1650 ºC, courtesy of the Oak Ridge National Laboratory's Plasma Arc Lamp. The cup, built from refractory metals and sapphire crystal insulators, exceeded expectations.
- But the final test took place last week, in a homemade contraption Kasper and his research team call the Solar Environment Simulator. While being blasted with roughly 10 kilowatts of light on its surface—enough to heat a sheet of metal to 980ºC in seconds—the Faraday cup model ran through its paces, successfully scanning a simulated stream of solar wind.
- "Watching the instrument track the signal from the ion beam as if it was plasma flowing from the sun was a thrilling preview of what we will see with Parker Solar Probe," Kasper said.
- Roilings in the sun's atmosphere can violently fling clouds of plasma into space, known as coronal mass ejections, sometimes directly at Earth. Without precautionary measures, such clouds can set up geomagnetic oscillations around Earth that can trip up satellite electronics, interfere with GPS and radio communications and—at their worst—can create surges of current through power grids that can overload and disrupt the system for extended periods of time, up to months.
- By understanding what makes up the solar corona and what drives the constant outpouring of solar material from the sun, scientists on Earth will be better equipped to interpret the solar activity we see from afar and create a better early-warning system.
- To test the cup model, researchers had to create something new. Their simulator sits in a first-floor lab at the Smithsonian Astrophysical Observatory in Cambridge, MA, and embodies the adage that necessity is the mother of invention.
- It has the look of a makeshift operating room, with a metal frame holding up thick blue tarps around three sides creating a 16 x 8 workspace.
- Inside the area, recreating the sun's heat and light fell to a quartet of modified older model IMAX projectors that Kasper's team purchased on eBay for a few thousand dollars apiece. These are not the digital machines you find in today's Cineplexes, but an earlier generation that utilized bulbs.
- "It turns out a movie theater bulb on an IMAX projector runs at about the same 5,700 degrees Kelvin—the same effective temperature as the surface of the sun," Kasper said. "And it gives off nearly the same spectrum of light as the surface."
- Space offers essentially no atmosphere, meaning a proper testing environment for the Faraday cup would have as little air as possible. So researchers placed the cup in a metal vacuum chamber for testing.
- All four of the IMAX projectors sit atop wheeled tables, and to set up for the test, researchers rolled them into place, with their beams pointed through the vacuum tube window directly at the Faraday cup.
- The final element of the simulator is its ability to generate the kinds of particles the Faraday cup will need to sense and evaluate. To do that, the team attached an ion gun to the vacuum tube hatch, with the "barrel" of the device reaching inside and pointed at the cup.
- In this final test, the Faraday cup took the heat and delivered—putting Parker Solar Probe on track for its summer launch.
- Kelly Korreck, a U-M alumna and astrophysicist at the institute, serves as head of science operations on Parker's SWEAP investigation as well as SWEAP activities for the Smithsonian. "As for the test today, it confirmed what I had suspected—when you take an amazing team of scientists and engineers, give them a complex, difficult, interesting project and the motivation of exploring a region of the universe humankind has never been to, before remarkable things happen," she said.
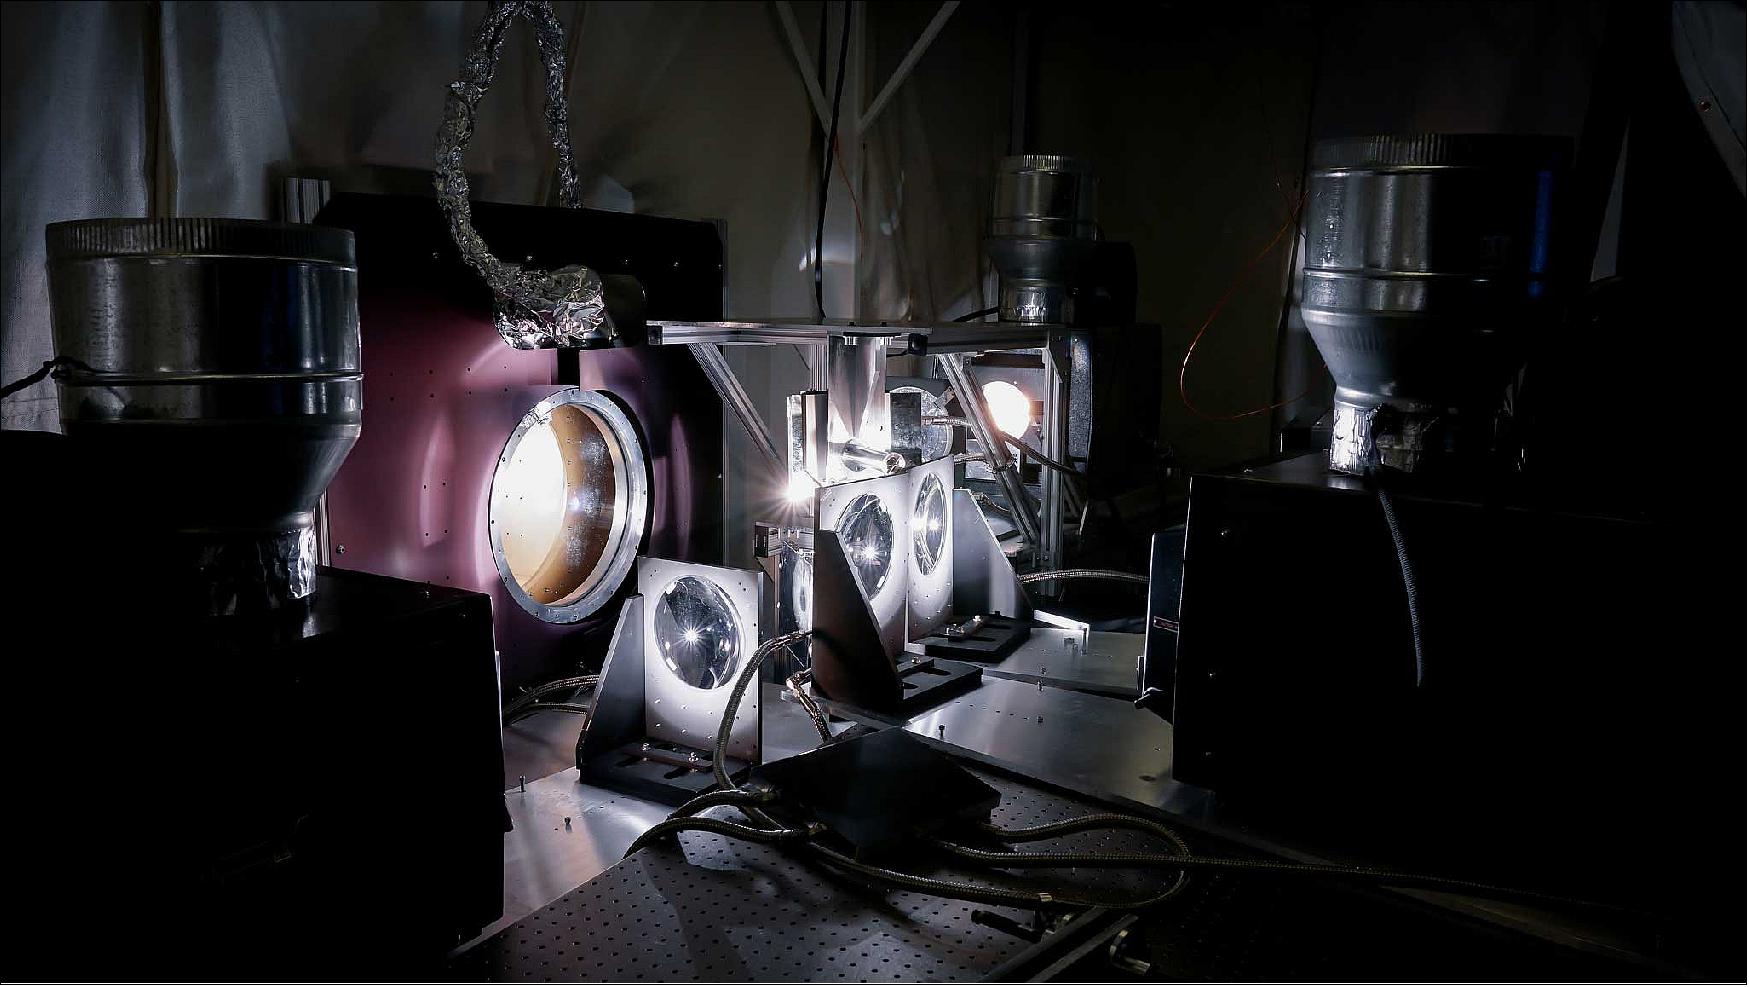
• April 6, 2018: NASA’s Parker Solar Probe has arrived in Florida to begin final preparations for its launch to the Sun, scheduled for July 31, 2018. 77)
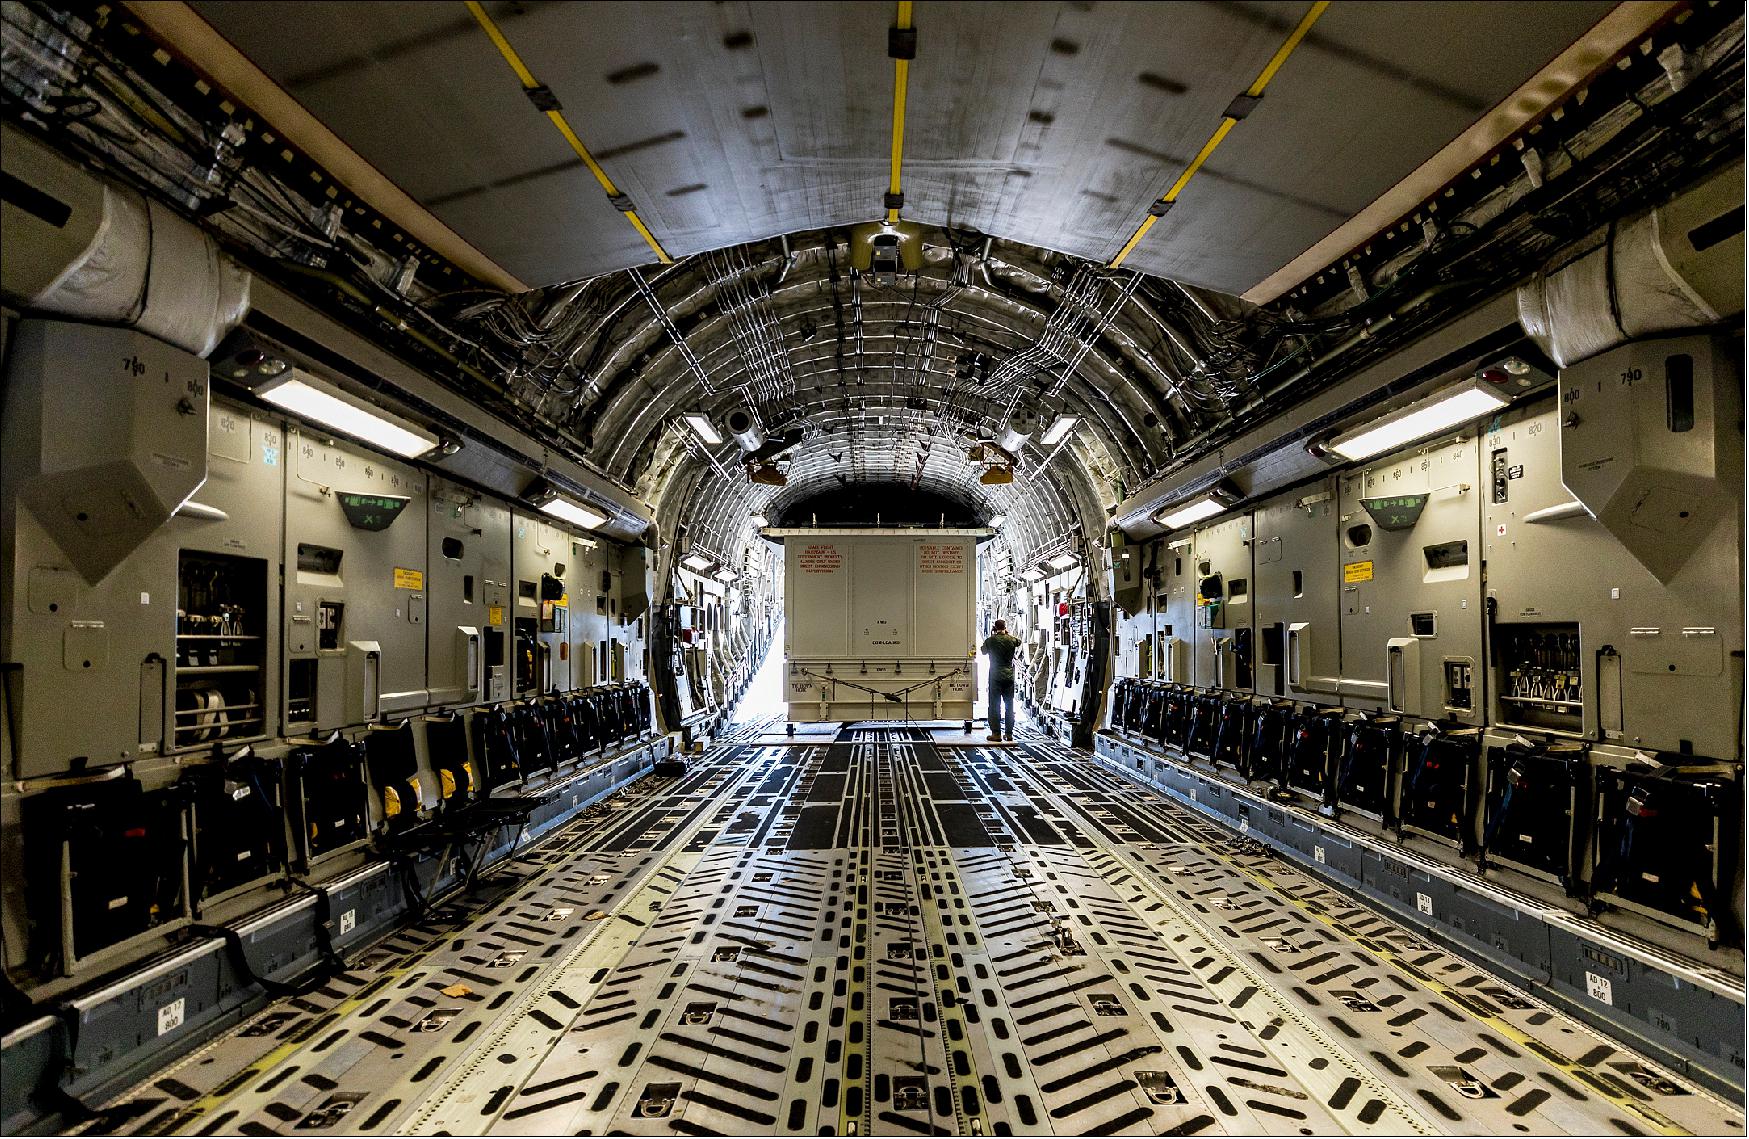
- In the middle of the night on April 2, the spacecraft was driven from NASA’s Goddard Space Flight Center in Greenbelt, Maryland, to nearby Joint Base Andrews in Maryland. From there, it was flown by the United States Air Force’s 436th Airlift Wing to Space Coast Regional Airport in Titusville, Florida, where it arrived at 10:40 a.m. EDT. It was then transported a short distance to Astrotech Space Operations, also in Titusville, where it will continue testing, and eventually undergo final assembly and mating to the third stage of the Delta IV Heavy launch vehicle.
- Parker Solar Probe is humanity’s first mission to the Sun. After launch, it will orbit directly through the solar atmosphere – the corona – closer to the surface than any human-made object has ever gone. While facing brutal heat and radiation, the mission will reveal fundamental science behind what drives the solar wind, the constant outpouring of material from the Sun that shapes planetary atmospheres and affects space weather near Earth.
- “Parker Solar Probe and the team received a smooth ride from the Air Force C-17 crew from the 436th,” said Andy Driesman, Parker Solar Probe project manager from the Johns Hopkins Applied Physics Laboratory in Laurel, Maryland. “This is the second most important flight Parker Solar Probe will make, and we’re excited to be safely in Florida and continuing pre-launch work on the spacecraft.”
- At Astrotech, Parker Solar Probe was taken to a clean room and removed from its protective shipping container on Wednesday, April 4. The spacecraft then began a series of tests to verify that it had safely made the journey to Florida. For the next several months, the spacecraft will undergo comprehensive testing; just prior to being fueled, one of the most critical elements of the spacecraft, the TPS (Thermal Protection System), or heat shield, will be installed. The TPS is the breakthrough technology that will allow Parker Solar Probe to survive the temperatures in the Sun’s corona, just 3.8 million miles from the surface of our star.
- “There are many milestones to come for Parker Solar Probe and the amazing team of men and women who have worked so diligently to make this mission a reality,” said Driesman. “The installation of the TPS will be our final major step before encapsulation and integration onto the launch vehicle.”
- Parker Solar Probe will be launched from Launch Complex-37 at NASA’s Kennedy Space Center, Florida. The two-hour launch window opens at approximately 4 a.m. EDT on July 31, 2018, and is repeated each day (at slightly earlier times) through Aug. 19.
- Throughout its seven-year mission, Parker Solar Probe will explore the Sun's outer atmosphere and make critical observations to answer decades-old questions about the physics of stars. Its data will also be useful in improving forecasts of major eruptions on the Sun and the subsequent space weather events that impact technology on Earth, as well as satellites and astronauts in space. The mission is named for University of Chicago Professor Emeritus Eugene N. Parker, whose profound insights into solar physics and processes have guided the discipline. It is the first NASA mission named for a living individual.
- Parker Solar Probe is part of NASA’s Living With a Star Program to explore aspects of the connected Sun-Earth system that directly affect life and society. Living With a Star is managed by the agency’s Goddard Space Flight Center in Greenbelt, Maryland, for NASA’s Science Mission Directorate in Washington. Johns Hopkins APL designed, built and manages the mission for NASA. Instrument teams are led by researchers from the University of California, Berkeley; the University of Michigan in Ann Arbor; Naval Research Laboratory in Washington, D.C.; Princeton University in New Jersey; and the Smithsonian Astrophysics Observatory in Cambridge, Massachusetts.
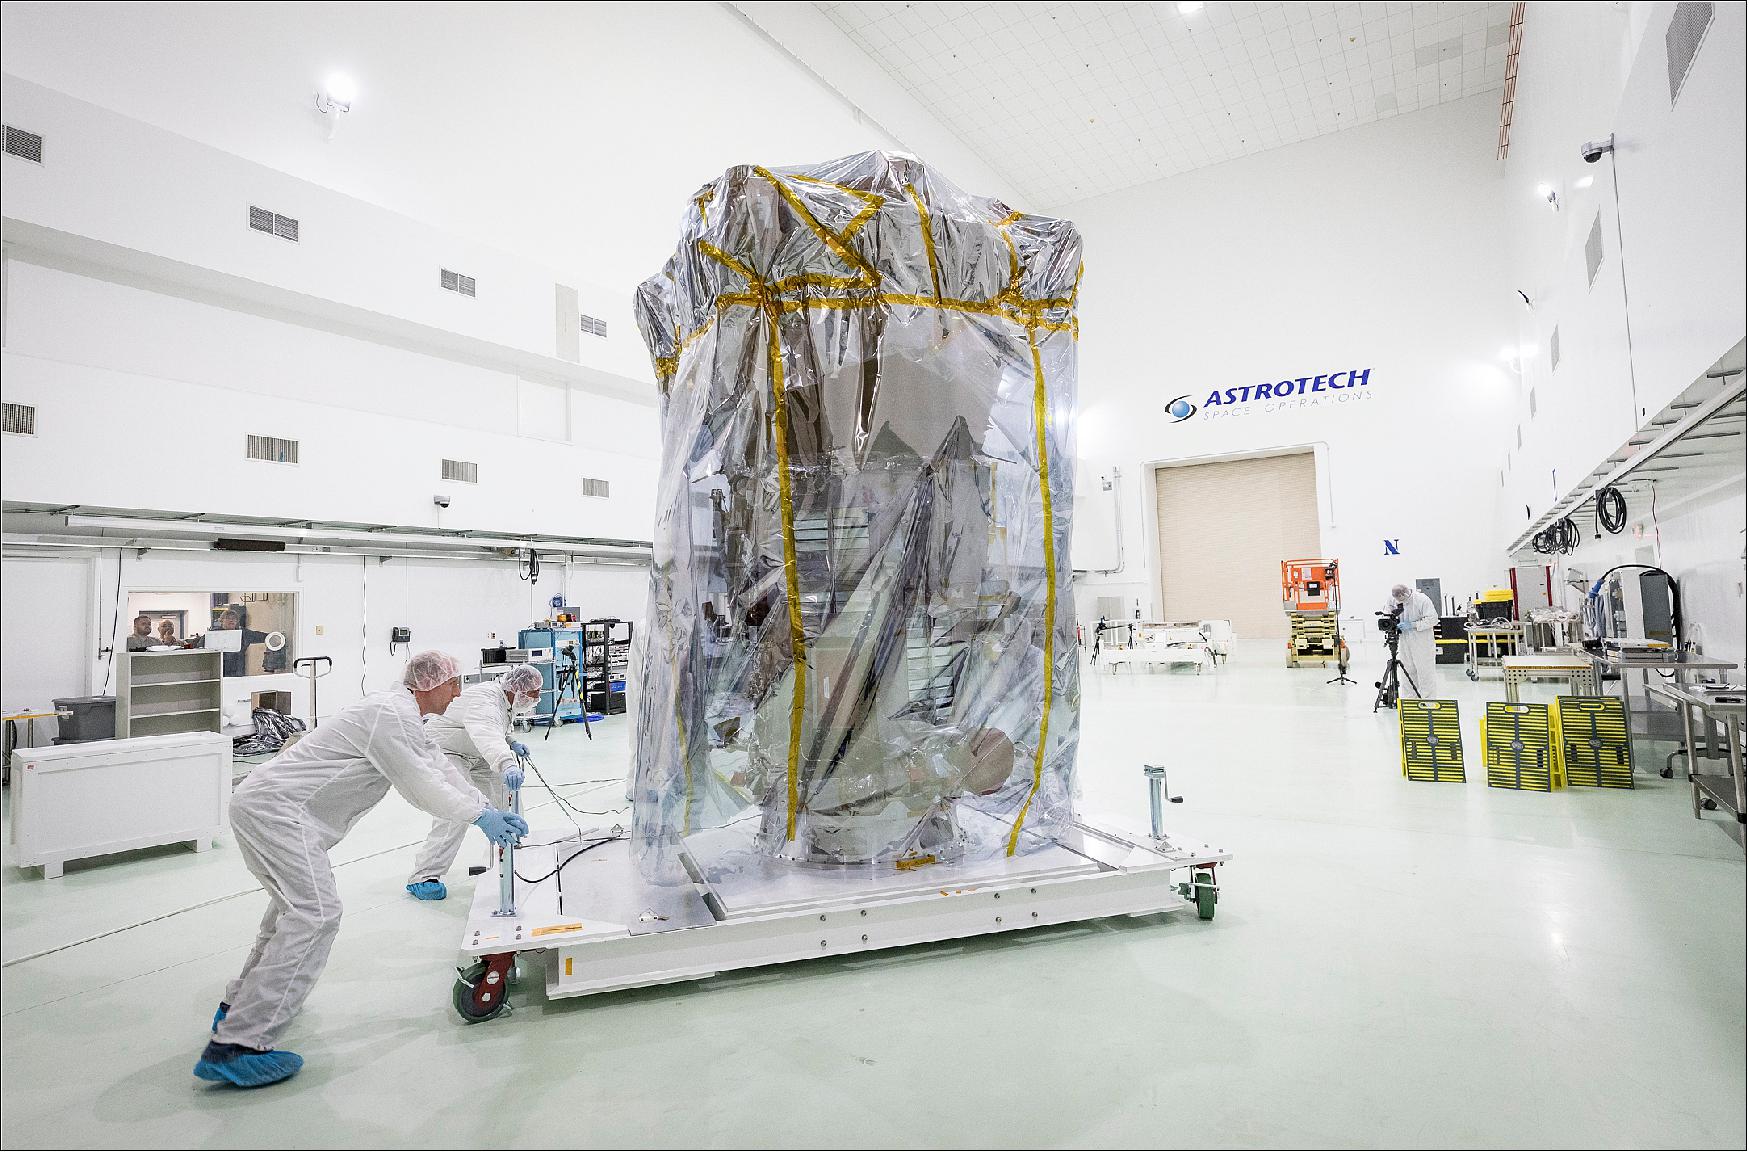
• March 6, 2018: NASA is inviting people around the world to submit their names online to be placed on a microchip aboard NASA’s historic Parker Solar Probe mission launching in summer 2018. The mission will travel through the Sun’s atmosphere, facing brutal heat and radiation conditions — and your name will go along for the ride. 78)
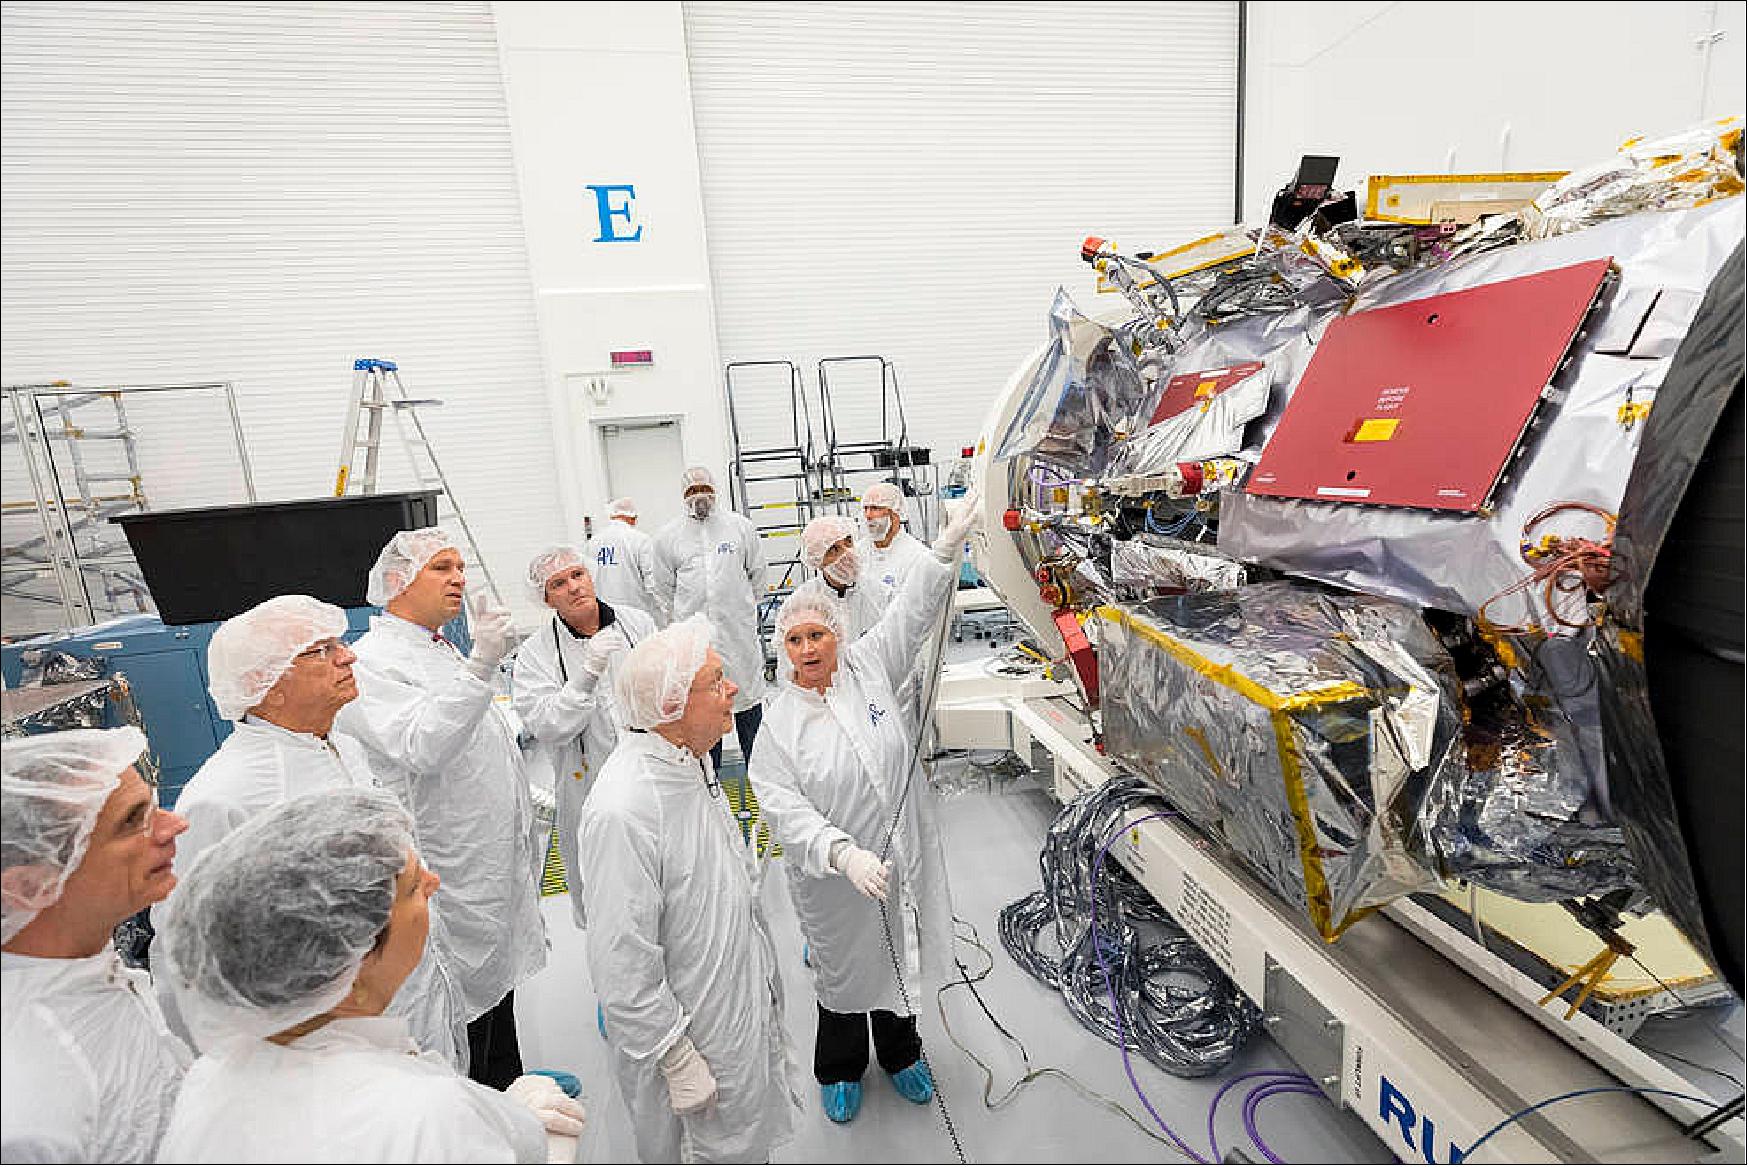
• On 17 January 2018, NASA’s Parker Solar Probe was lowered into the 12 m tall thermal vacuum chamber at NASA/GSFC (Goddard Space Flight Center) in Greenbelt, Maryland. The spacecraft will remain in the chamber for about seven weeks, coming out in mid-March for final tests and packing before heading to Florida. Parker Solar Probe is scheduled to launch from NASA’s Kennedy Space Center on July 31, 2018, on a Delta IV Heavy launch vehicle. 79)
- “This is the final major environmental test for the spacecraft, and we’re looking forward to this milestone,” said Annette Dolbow, Parker Solar Probe’s integration and test lead from the Johns Hopkins Applied Physics Lab. “The results we’ll get from subjecting the probe to the extreme temperatures and conditions in the chamber, while operating our systems, will let us know that we’re ready for the next phase of our mission – and for launch.”
- During thermal balance testing, the spacecraft will be cooled to -292 degrees Fahrenheit (-180ºC). Engineers will then gradually raise the spacecraft’s temperature to test the thermal control of the probe at various set points and with various power configurations.
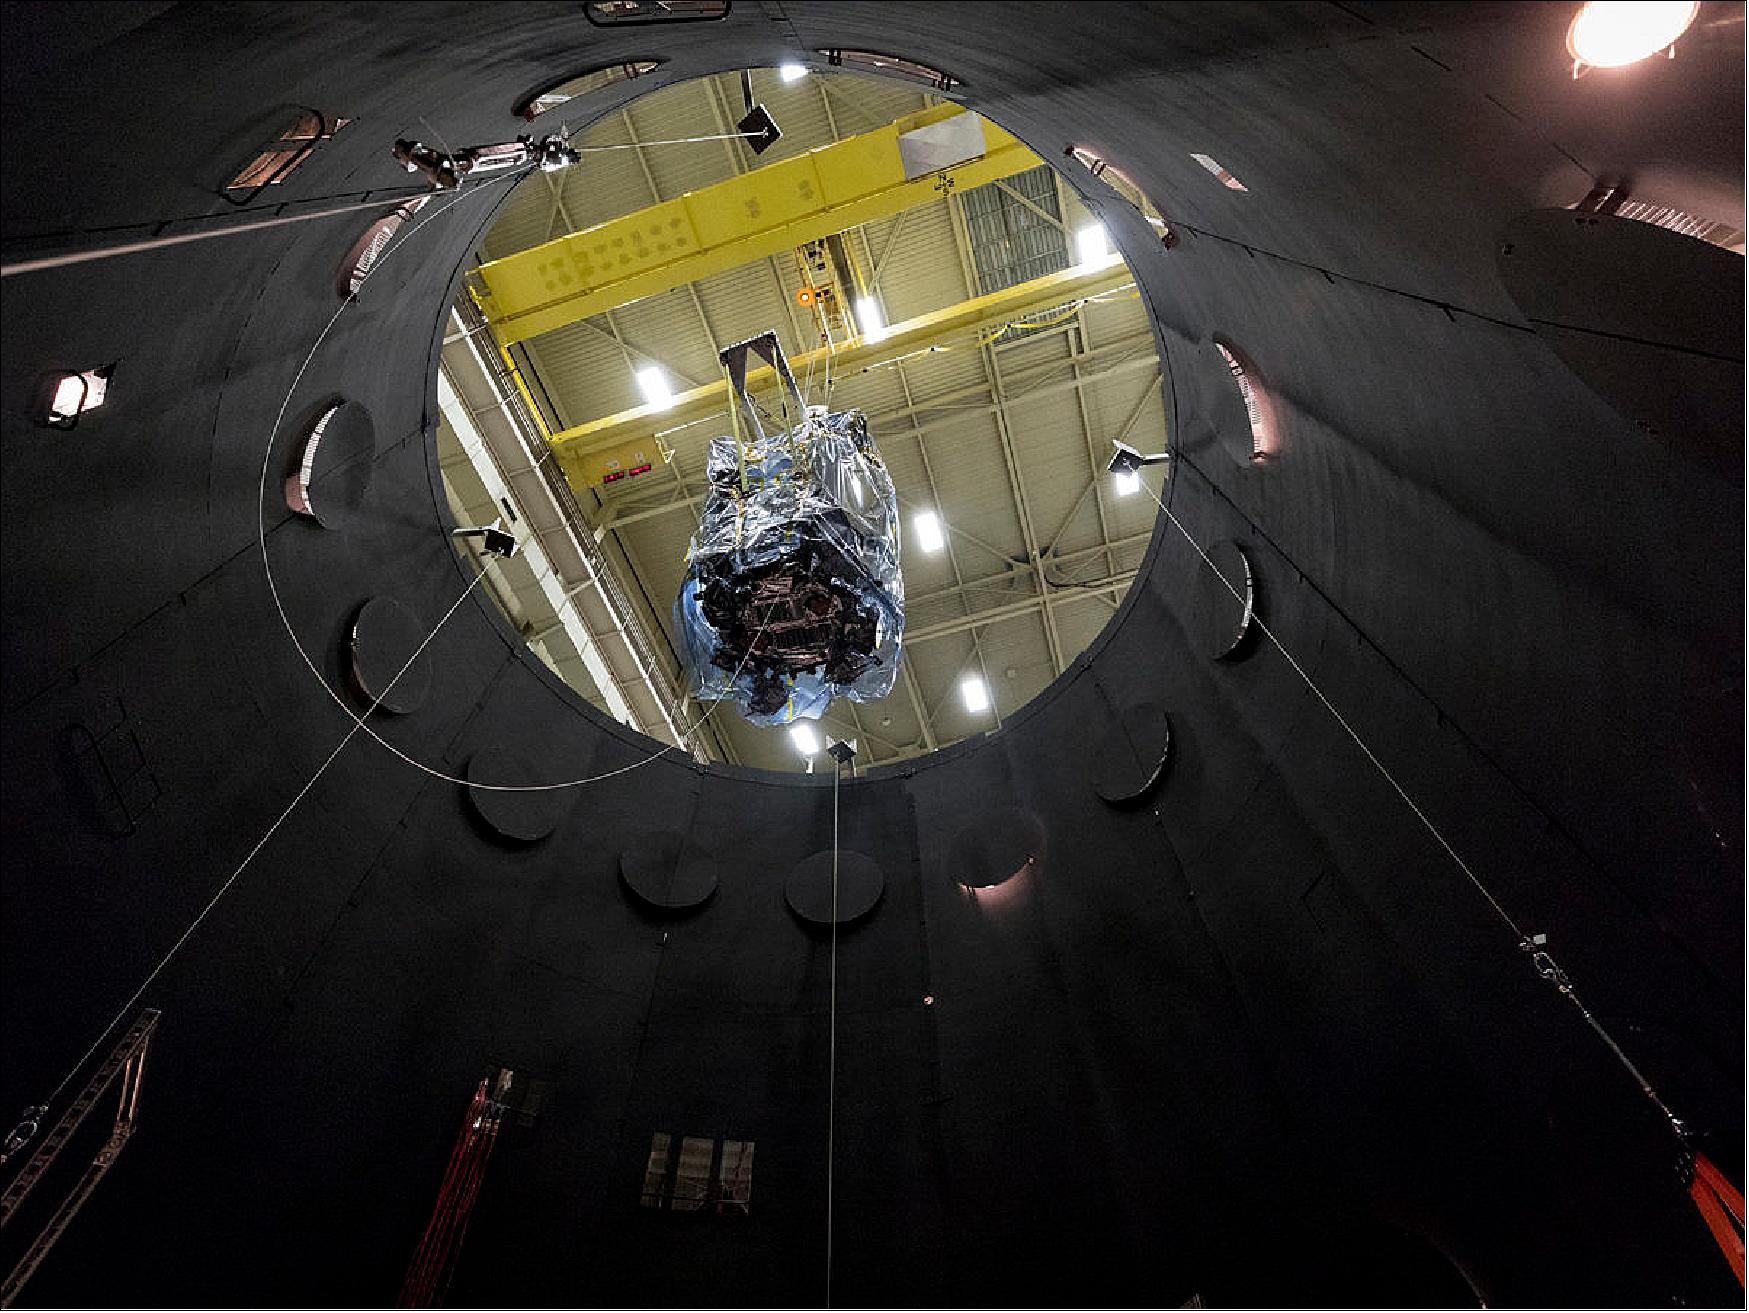
• On 6 November 2017, NASA's Parker Solar Probe spacecraft arrived at NASA/GSFC (Goddard Space Flight Center) in Greenbelt, Maryland, for environmental tests. During the spacecraft’s stay at Goddard, engineers and technicians will simulate extreme temperatures and other physical stresses that the spacecraft will be subjected to during its historic mission to the Sun. 80)
- Before arriving at Goddard, Parker Solar Probe was at the JHU/APL (Johns Hopkins University /Applied Physics Laboratory) in Laurel, Maryland, where it was designed and built.
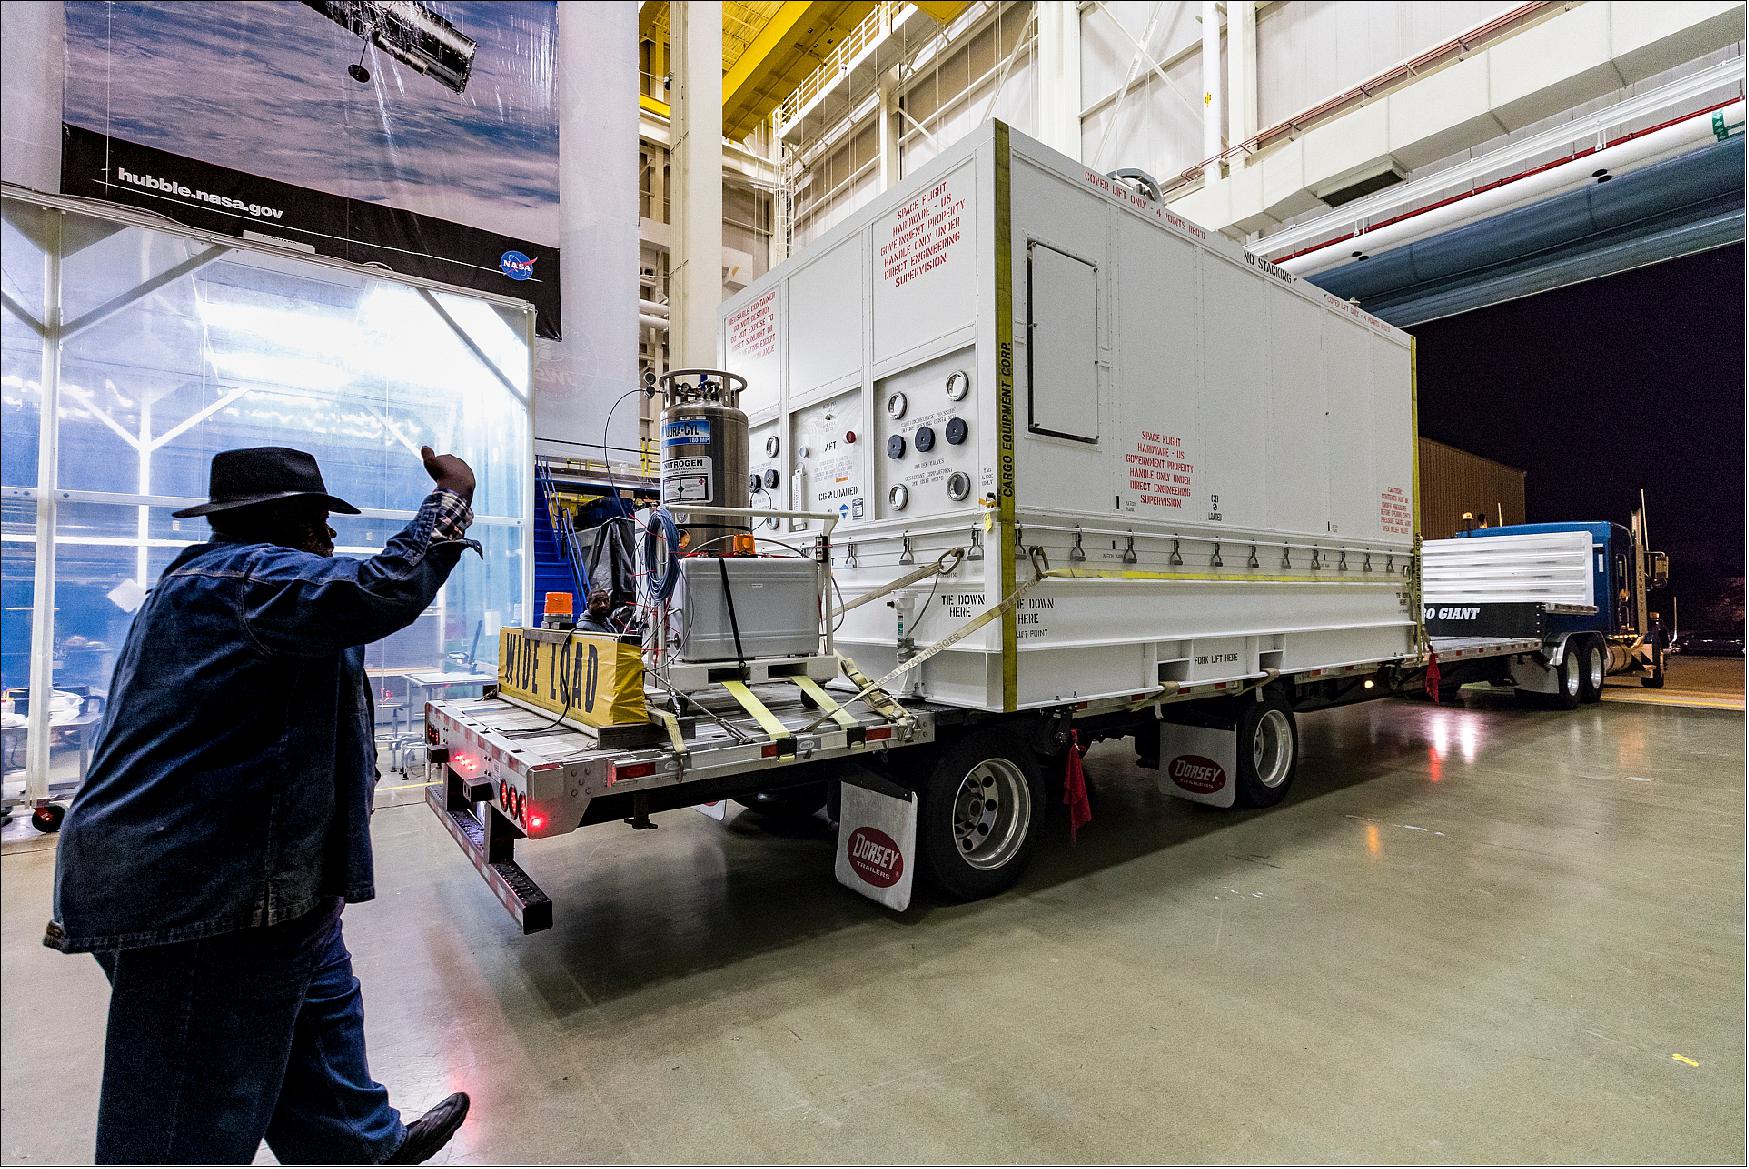
• September 27, 2017: Now less than one year away from launch, the Parker Solar Probe began as an idea in the Outer Planet/Solar Probe program of NASA in the 1990s. 81)
- The original mission concept, the Solar Orbiter, was canceled in 2003 as part of the George W. Bush Administration’s restructuring of NASA to focus more on research and development and address management shortcomings in the wake of the 1 February 2003 breakup of the Space Shuttle Columbia that claimed the lives of all seven astronauts aboard. — Six years later, the mission concept was resurrected as a “new mission start” in 2009 with an aim to launch a new solar probe in 2015.
- By 2012, as the mission moved into its design phase, the launch was pushed to 2018.
- Originally called the Solar Probe Plus (SPP), the mission was renamed earlier this year on 31 May 2017, and in so doing NASA radically departed from of its previous mission naming practices.
• On Sept. 21, 2017, the revolutionary heat shield that will protect the first spacecraft to fly directly into the Sun's atmosphere was installed for final integrated vehicle testing ahead of launch. This is the only time the spacecraft will have its thermal protection system—which will reach temperatures of 2,500 degrees F (1370ºC) while at the Sun—attached until just before launch. 82)
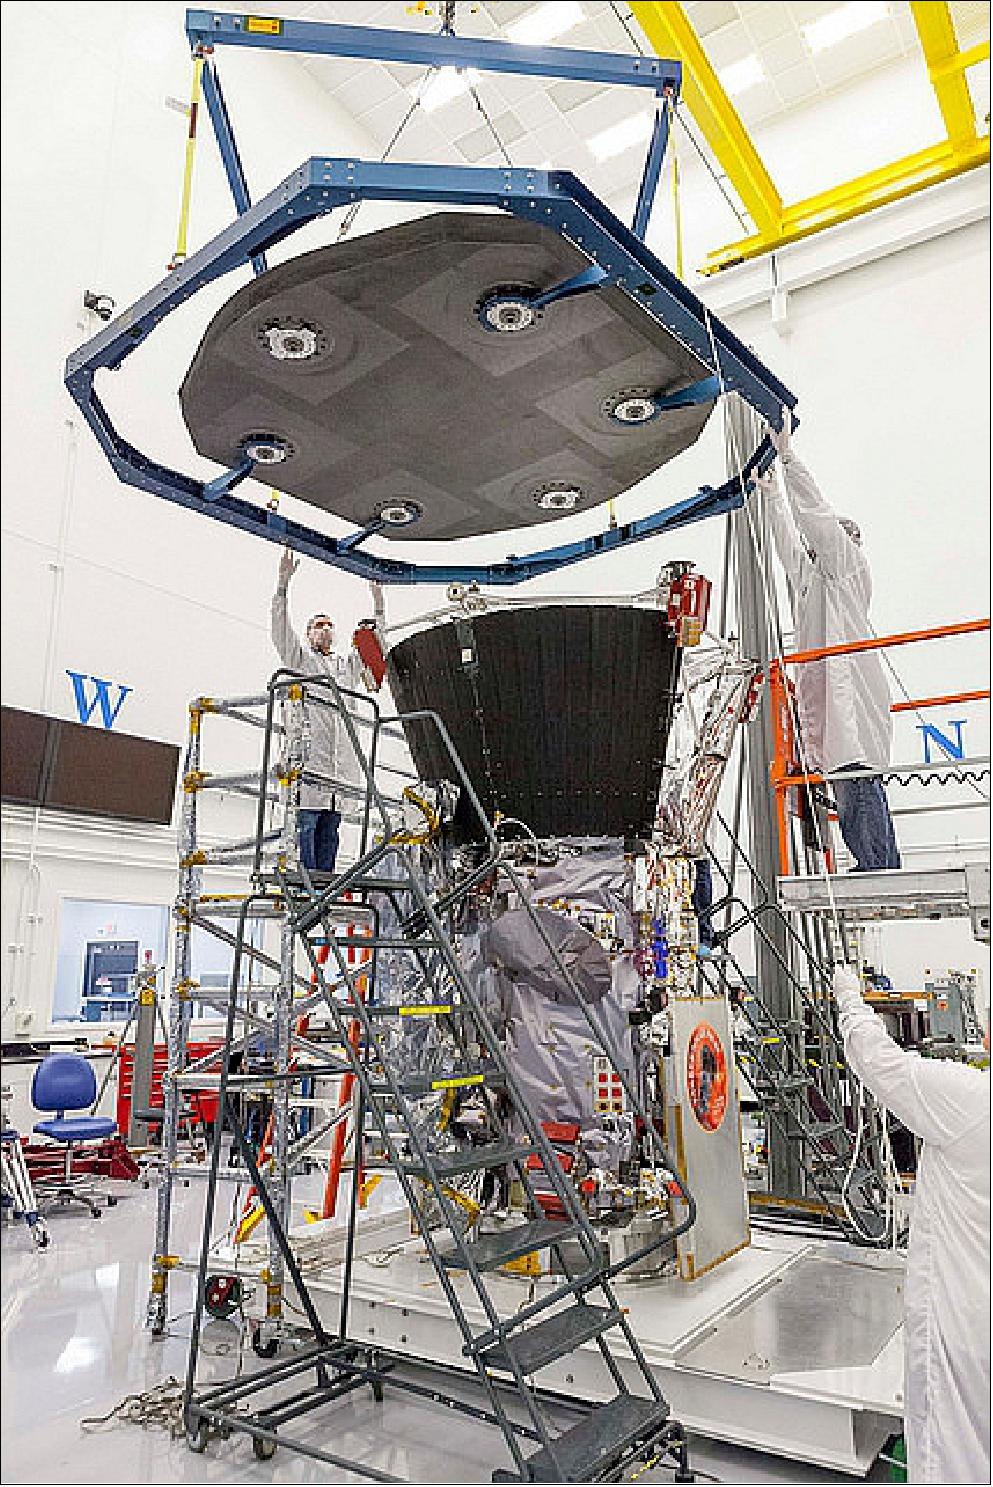
• July 14, 2016: Following a successful NASA management review on July 7, the Solar Probe Plus mission — which will send a spacecraft on several daring data-collecting runs through the sun’s atmosphere — is moving into the system assembly, integration, test and launch stage of the project. NASA terms this period as Phase D, during which the mission team will finish building the spacecraft, install its science instruments, test it under simulated launch and space conditions, and launch it. 83)
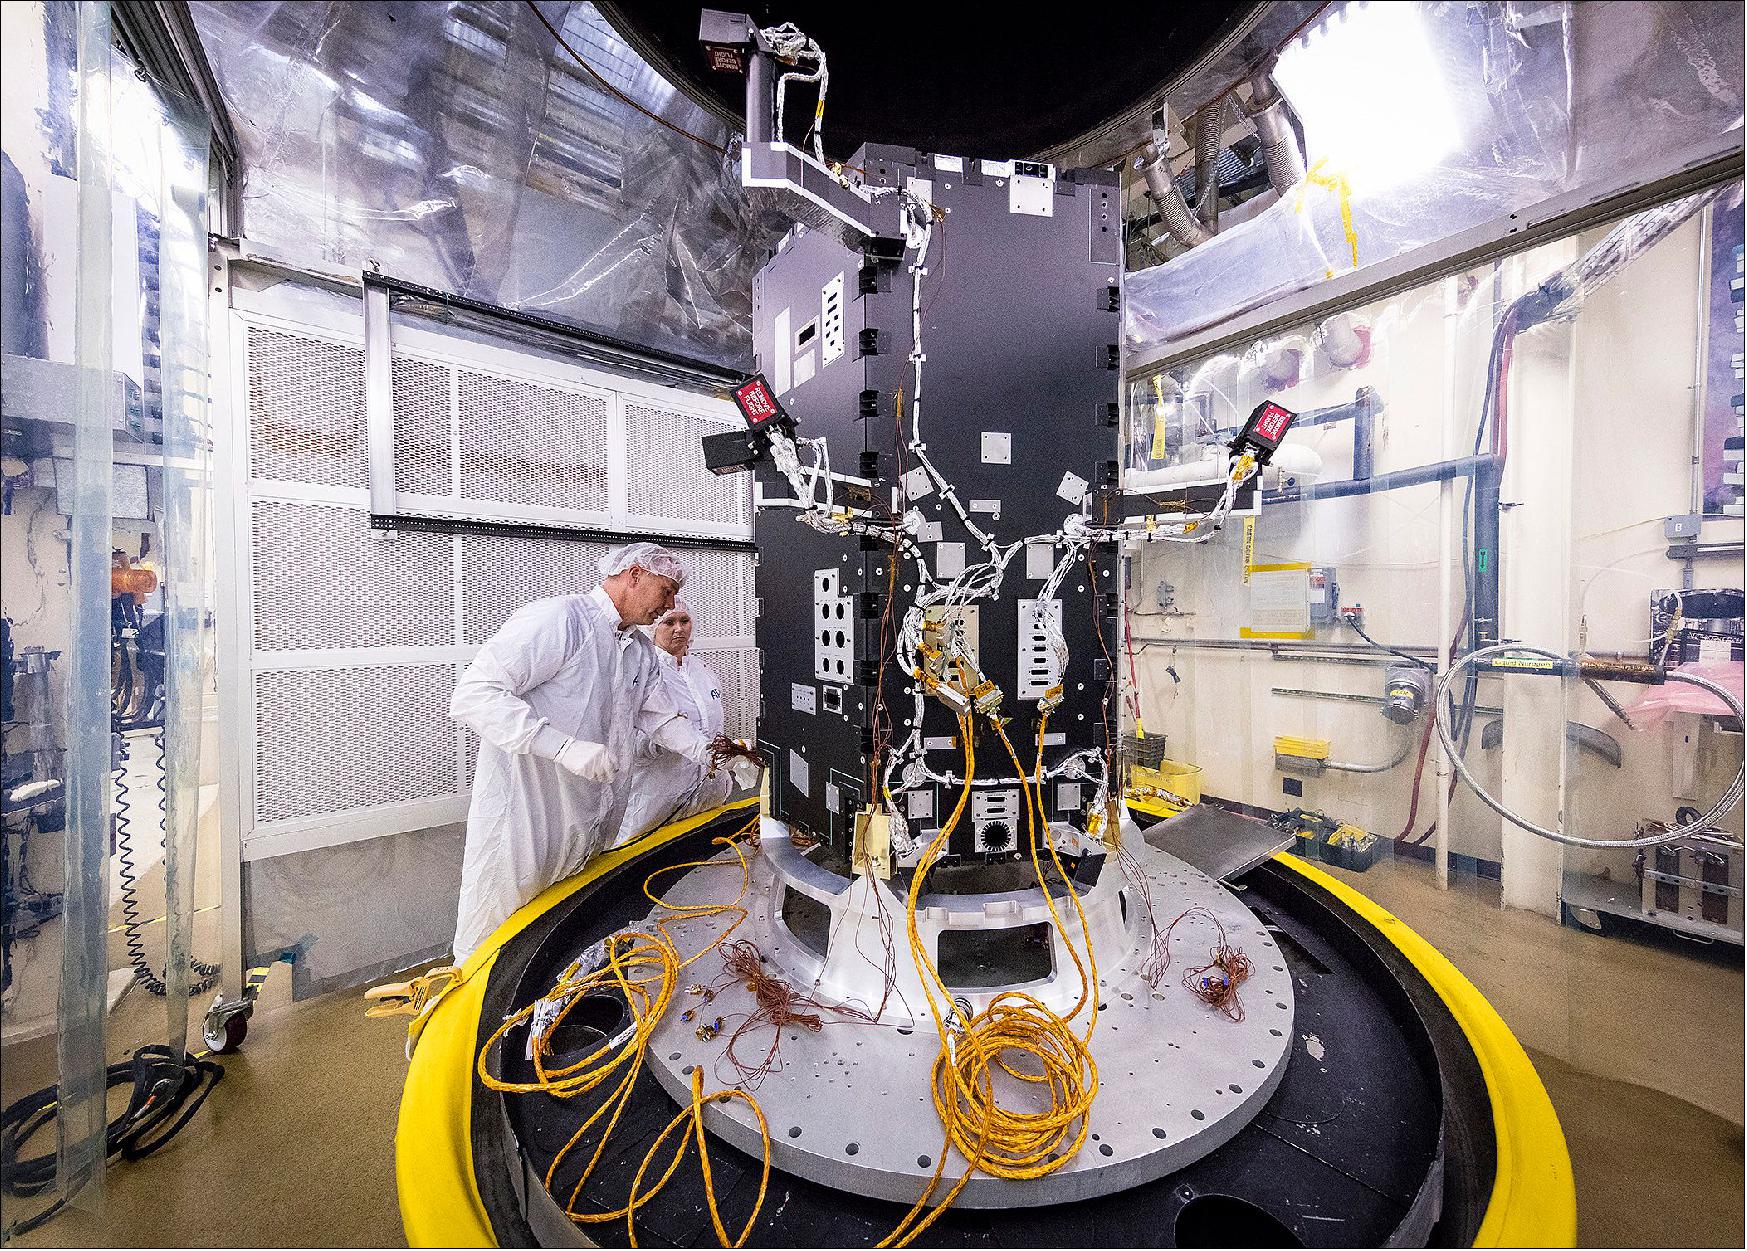
• April 8, 2015: NASA’s SPP (Solar Probe Plus) mission reached a major milestone in March when it successfully completed its CDR (Critical Design Review). An independent NASA review board met at the Johns Hopkins University Applied Physics Laboratory (APL) in Laurel, Maryland, from March 16 to 20 to review all aspects of the mission plan; APL has designed and will build and operate the spacecraft for NASA. The CDR certifies that the Solar Probe Plus mission design is at an advanced stage and that fabrication, assembly, integration and testing of the many elements of the mission may proceed. 84)
• In March 2014, Solar Probe Plus will begin advanced design, development and testing — a step NASA designates as Phase C — following a successful design review in which an independent assessment board deemed that the mission team, led by JHU/APL ( Johns Hopkins University/Applied Physics Laboratory) in Laurel, MD, was ready to move ahead with full-scale spacecraft fabrication, assembly, integration and testing. 85)
References
1) http://science.nasa.gov/science-news/science-at-nasa/2010/02sep_spp/
2) Geoff Brown, ”NASA Renames Solar Probe Mission to Honor Pioneering Physicist Eugene Parker,” NASA, May 31, 2017, URL: https://www.nasa.gov/feature/goddard/2017/
nasa-renames-solar-probe-mission-to-honor-pioneering-physicist-eugene-parker
3) James Kinnison, Brian Morse, Mary Kae Lockwood, Edward Reynolds, Robert Decker, “Solar Probe Plus, A Historic Mission to the Sun,” Proceedings of the 61st IAC (International Astronautical Congress), Prague, Czech Republic, Sept. 27-Oct. 1, 2010, IAC-10.A3.6.1
4) Mary Kae Lockwood, James Kinnison, Nicola Fox, Richard Conde, Andrew Driesman, “Solar Probe Plus Mission Definition,” Proceedings of the 63rd IAC (International Astronautical Congress), Naples, Italy, Oct. 1-5, 2012, paper: IAC-12.A3.5.2
5) http://solarprobe.gsfc.nasa.gov/index.htm
6) James D. Kinnison, Andrew A. Dantzler, Yanping Guo, Steve Vernon, Chris DeBoy, Michelle M. Donegan, David Drewry, Peter Eisenreich, Martin Fraeman, Ray Harvey, John W. Hunt, Jr., Douglas Mehoke, Christopher A. Monaco, Steve Parr, David Persons, Lew Roufberg, Hongxing Shapiro, Michael D. Trela, David Weir, Melissa Wirzburger, “The Solar Probe+ Mission: A New Concept for Close Solar Encounters,” Proceedings of the 59th IAC (International Astronautical Congress), Glasgow, Scotland, UK, Sept. 29 to Oct. 3, 2008, IAC-08-A3.6.6
7) Karen W. Kirby, Yanping Guo, Sanae Kubota, Matt Reinhart, Steve Vernon, “An overview of Solar Sentinels mission architecture selection,” Proceedings of the 59th IAC (International Astronautical Congress), Glasgow, Scotland, UK, Sept. 29 to Oct. 3, 2008, IAC-08.A3.6.4
8) http://solarprobe.gsfc.nasa.gov/solarprobe_mission.htm
9) “Solar Probe+Mission Engineering Study Report,” prepared for NASA by JHU/APL, March 10, 2008, URL: http://solarprobe.jhuapl.edu/mission/docs/SolarProbeME.pdf
10) Nicola J. Fox, Marco Velli, “SPP and SolO: The Near Future of Solar Physics Part 1: Solar Probe Plus: Humanity’s First Visit to Our Star,” Aug. 5, 2014, URL: http://www.cifs-isss.org
/presentazioni/2014-september/Fox-Velli.pdf
11) M. Buckley, “NASA Calls on APL to Send a Probe to the Sun,” May 1, 2008, URL: http://www.jhuapl.edu/newscenter/pressreleases/2008/080501.asp
12) http://solarprobe.jhuapl.edu/
13) “Solar Probe Plus- A NASA Mission to touch the Sun,” Factsheet, JHU/APL, Oct. 2014, URL: http://solarprobe.jhuapl.edu/common/content/SolarProbePlusFactSheet.pdf
14) “NASA Solar Study Mission Moves to Next Design Stage,” March 5, 2012, URL: http://jhuapl.edu/newscenter/pressreleases/2012/120305.asp
15) Yanping Guo, “Solar Probe Plus: Mission Design Challenges and Trades,” Proceedings of the 60th IAC (International Astronautical Congress), Daejeon, Korea, Oct. 12-16, 2009, IAC-09.A3.6.1
16) N. J. Fox, M. C. Velli, S.D. Bale, R. Decker,, A. Driesman, R. A. Howard4 ,J. C. Kasper, J. Kinnison, M. Kusterer, D. Lario, M.K. Lockwood,D. J. McComas, N. E. Raouafi, A. Szabo, ”The Solar Probe Plus Mission: Humanity’s First Visit to Our Star,” SpaceScience Reviews, Springerlink Online, Nov. 11, 2015, URL: http://tinyurl.com/jmgkxqc
17) M.K. Lockwood, J. Kinnison, N. Fox, R. Conde, A. Driesman, ”Solar probe plus mission definition,” Proceedings of the 63rd International Astronautical Congress (IAF, Naples, 2012)
18) D. J. McComas, N. Angold, H. A. Elliott, G. Livadiotis, N. A. Schwadron, R. M. Skoug, C. W. Smith, ”Weakest solar wind of the space age and the current ”mini” solar maximum,” The Astrophysical Journal, Volume 779, Number 1, Nov. 14, 2013, doi:10.1007/s11214-014-0059-1, URL: http://iopscience.iop.org/article/10.1088/0004-637X/779/1/2/pdf
19) Micheala Sosby, Rob Garner, ”New Views of Sun: 2 Missions Will Go Closer to Our Star Than Ever Before,” NASA, 16 May 2018, URL: https://www.nasa.gov/feature/goddard/
2018/new-views-of-sun-2-missions-will-go-closer-to-our-star-than-ever-before
20) Timothy J. Jole, ”The Challenges of Integrating the Parker Solar Probe Observatory,” Proceedings of the 69th IAC (International Astronautical Congress) Bremen, Germany, 1-5 October 2018, paper: IAC-18-A3.5.12, URL: https://iafastro.directory/iac/proceedings/
IAC-18/IAC-18/A3/5/manuscripts/IAC-18,A3,5,12,x43803.pdf
21) Yanping Guo, James McAdams, Martin Ozimek, Wen-Jong Shyong, ”Solar Probe Plus Mission design Overview and Mission Profile,” Proceedings of 24th International Symposium on Space Flight Dynamics, Laurel, Maryland, USA, 5 - 9 May, 2014, URL: http://issfd.org/ISSFD_2014/ISSFD24_Paper_S6-2_Guo.pdf
22) Alan A. Mick, Joseph R. Hennawy, Christopher J. Krupiarz, Horace Malcom, Dan Rodriguez, “Design and Prototype of SpaceWire Spacecraft Bus for Solar Probe Plus,” Proceedings of the International SpaceWire Conference 2011, San Antonio, TX, USA, Nov. 8-10, 2011, URL: http://2011.spacewire-conference.org/proceedings/Presentations/Missions/Mick.pdf
23) Eric D. Melin, Christopher J. Krupiarz, Christopher A. Monaco, ”Reliable Commanding and Telemetry Operations Using CFDP,” Proceedings of the 14th International Conference on Space Operations (SpaceOps 2016), Daejeon, Korea, May 16-20, 2016, paper: AIAA 2016 2525, URL: http://arc.aiaa.org/doi/pdf/10.2514/6.2016-2525
24) Dipak K. Srinivasan, Christopher B. Haskins, ”From Prototype Technology to Flight: Infusing the Frontier Radio into Space Missions,” Proceedings of the 67th IAC (International Astronautical Congress), Guadalajara, Mexico, Sept. 26-30, 2016, paper: IAC-16-B2.7.5
25) Christopher B. Haskins, Matthwe P. Angert, E. Joseph Sheehi, Wesley P. Millard, “The Frontier Software Defined Radio for the Solar Probe Plus Mission,” IEEE Aerospace Conference, Big Sky, MT, USA, March 2016
26) Dwayne Brown, Karen Fox, Geoffrey Brown, Tori McLendon, ”NASA, ULA Launch Parker Solar Probe on Historic Journey to Touch Sun,” NASA, Release 18-072, 12 August 2018, URL: https://www.nasa.gov/press-release/nasa-ula-launch-parker-solar-probe-on-historic-journey-to-touch-sun
27) ”Parker Solar Probe Launch,” JHU/APL, URL: http://parkersolarprobe.jhuapl.edu
/The-Mission/index.php#Launch
28) George Diller, Dwayne Brown, Susan Hendrix, “NASA Awards Launch Services Contract for Solar Probe Plus Mission,” NASA Contract Release C-15-006, March 18, 2015, URL: http://www.nasa.gov/centers/kennedy/news/release-20150318.html
29) Sarah Frazer, Rob Garner, ”It's Surprisingly Hard to Go to the Sun,” NASA, 08 August 2018, URL: https://www.nasa.gov/feature/goddard/2018/its-surprisingly-hard-to-go-to-the-sun
30) Miles Hatfield, ”Telescopes Trained on Parker Solar Probe’s Latest Pass Around the Sun,” NASA ParkerSP, 3 March 2022, URL: https://blogs.nasa.gov/parkersolarprobe/2022/03/03/telescopes-trained-on-parker-solar-probes-latest-pass-around-the-sun/
31) Mara Johnson-Groh, ”Parker Solar Probe Captures its First Images of Venus' Surface in Visible Light, Confirmed,” NASA Feature, 9 February 2022, URL: https://www.nasa.gov/feature/goddard/2022/sun/parker-solar-probe-captures-its-first-images-of-venus-surface-in-visible-light-confirmed
32) Brian E. Wood, Phillip Hess, Jacob Lustig-Yaeger, Brendan Gallagher, Daniel Korwan, Nathan Rich, Guillermo Stenborg, Arnaud Thernisien, Syed N. Qadri, Freddie Santiago, Javier Peralta, Giada N. Arney, Noam R. Iceberg, Angelos Vourlidas, Mark G. Linton, Russell A. Howard, Nour E. Raouafi, ”Parker Solar Probe Imaging of the Night Side of Venus,” Geophysical Research Letters, First published: 09 February 2022, https://doi.org/10.1029/2021GL096302, URL: https://agupubs.onlinelibrary.wiley.com/doi/epdf/10.1029/2021GL096302
33) ”New research may help scientists unravel the physics of the solar wind,” University of Minnesota News, 14 January 2022, URL: https://cse.umn.edu/college/news/new-research-may-help-scientists-unravel-physics-solar-wind
34) C. Cattell, A. Breneman, J. Dombeck, E. Hanson, M. Johnson, J. Halekas, S. D. Bale, T. Dudok de Wit, K. Goetz, K. Goodrich, D. Malaspina, M. Pulupa, T. Case, J. C. Kasper, D. Larson, M. Stevens, and P. Whittlesey, ”Parker Solar Probe Evidence for the Absence of Whistlers Close to the Sun to Scatter Strahl and to Regulate Heat Flux,” The Astrophysical Journal Letters, Volume 924, Number 2, Published: 10 January 2022, https://doi.org/10.3847/2041-8213/ac4015, URL: https://iopscience.iop.org/article/10.3847/2041-8213/ac4015/pdf
35) Mara Johnson-Groh, ”NASA Enters the Solar Atmosphere for the First Time, Bringing New Discoveries,” NASA Feature, 14 December 2021, URL: https://www.nasa.gov/feature/goddard/2021/nasa-enters-the-solar-atmosphere-for-the-first-time-bringing-new-discoveries
36) Anna Blaustein, Lina Tran, ”NASA Scientist Kelly Korreck on the Journey to the Sun, and What It Takes to Get There,” NASA Feature, 14, December 2021, URL: https://www.nasa.gov/feature/goddard/2021/nasa-scientist-kelly-korreck-on-journey-to-sun-and-what-it-takes-to-get-there
37) ”Eugene Parker, Namesake of Solar Probe, Receives Crafoord Prize in Astronomy,” NASA Feature, 12 November 2021, URL: https://www.nasa.gov/image-feature/eugene-parker-namesake-of-solar-probe-receives-crafoord-prize-in-astronomy
38) ”Space Dust Presents Opportunities, Challenges as Parker Solar Probe Speeds Back toward the Sun,” NASA Parker Solar Probe, 10 November 2021, URL: https://blogs.nasa.gov/parkersolarprobe/2021/11/10/space-dust-presents-opportunities-challenges-as-parker-solar-probe-speeds-back-toward-the-sun/
39) ”Physicists led by University of Iowa more fully describe sun’s electric field,” University of Iowa, 14 July 2021, URL: https://now.uiowa.edu/2021/07/physicists-led-university-iowa-more-fully-describe-suns-electric-field
40) Justyna Surowiec, Sarah Frazier, ”Parker Solar Probe Team Earns Aerospace Award from the National Space Club and Foundation,” NASA Feature, 1 July 2021, URL: https://www.nasa.gov/feature/goddard/2021/parker-solar-probe-team-earns-aerospace-award-from-the-national-space-club-and-foundation
41) Lina Tran, ”NASA’s Parker Solar Probe Discovers Natural Radio Emission in Venus’ Atmosphere,” NASA Feature, 3 May 2021, URL: https://www.nasa.gov/feature/goddard/2021/Parker-Discovers-Natural-Radio-Emission-in-Venus-Atmosphere
42) Glyn A. Collinson, Robin Ramstad, Alex Glocer, Lynn Wilson III,Alexandra Brosius, ”Depleted Plasma Densities in the Ionosphere of Venus Near Solar Minimum From Parker Solar Probe Observations of Upper Hybrid Resonance Emission,” Geophysical Research Letters, Volume48, Issue9, 16 May 2021, e2020GL092243, https://doi.org/10.1029/2020GL092243
43) Sarah Frazier, ”Successful Eighth Solar Flyby for Parker Solar Probe,” NASA, 3 May 2021, URL: https://blogs.nasa.gov/parkersolarprobe/2021/05/03/successful-eighth-solar-flyby-for-parker-solar-probe/
44) Sarah Frazier, ”NASA’s Parker Solar Probe Sees Venus Orbital Dust Ring in 1st Complete View,” NASA Feature, 16 April 2021, URL: https://www.nasa.gov/feature/goddard/2021/nasa-s-parker-solar-probe-sees-venus-orbital-dust-ring-in-first-complete-view
45) Guillermo Stenborg, Brendan Gallagher, Russell A. Howard, Phillip Hess, and Nour Eddine Raouafi, ”Pristine PSP/WISPR Observations of the Circumsolar Dust Ring near Venus's Orbit,” The Astrophysical Journal, Volume 910, Number 2, Published: 7 April 2021, https://doi.org/10.3847/1538-4357/abe623
46) Miles Hatfield & Lina Tran, ”Switchbacks Science: Explaining Parker Solar Probe’s Magnetic Puzzle,” NASA Feature, 9 March 2021, URL: https://www.nasa.gov/feature/goddard/2021/switchbacks-science-explaining-parker-solar-probe-s-magnetic-puzzle
47) G. P. Zank, M. Nakanotani, L.-L. Zhao, L. Adhikari, and J. Kasper, ”The Origin of Switchbacks in the Solar Corona: Linear Theory,” The Astrophysical Journal, Volume 903, Number 1, Published: 26 October 2020, https://doi.org/10.3847/1538-4357/abb828
48) J. F. Drake, A. Agapitov, M. Swisdak, S. T. Badman, S. D. Bale, T. S. Horbury, Justin C. Kasper, R. J. MacDowall, F. S. Mozer, T. D. Phan, M. Pulupa, A. Szabo, M. Velli, ”Switchbacks as signatures of magnetic flux ropes generated by interchange reconnection in the corona,” Astronomy & Astrophysics, 8October, 2020, , https://doi.org/10.1051/0004-6361/202039432
49) J. Squire, B. D. G. Chandran, and R. Meyrand, ”In-situ Switchback Formation in the Expanding Solar Wind,” The Astrophysical Journal Letters, Volume 891, Number 1, Published: 26 February 2020, https://doi.org/10.3847/2041-8213/ab74e1, URL: https://iopscience.iop.org/article/10.3847/2041-8213/ab74e1/pdf
50) N. A. Schwadron and D. J. McComas, ”Switchbacks Explained: Super-Parker Fields—The Other Side of the Sub-Parker Spiral,” The Astronomical Journal, Volume 909, No 1, Published: 9 March 2021, https://doi.org/10.3847/1538-4357/abd4e6
51) Sarah Frazier, ”Observations Around Solar System With Parker Solar Probe’s 7th Solar Encounter,” NASA Feature, 5 March 2021, URL: https://www.nasa.gov/feature/goddard/2021/observations-around-the-solar-system-with-parker-solar-probe-s-seventh-solar-encounter
52) Michael Buckley, Karen Fox, Sarah Frazier, ”Parker Solar Probe Offers Stunning View of Venus,” NASA Parker Solar Probe, 24 February 2021, URL: https://web.archive.org/web/20230626110740/https://www.nasa.gov/feature/goddard/2021/parker-solar-probe-offers-a-stunning-view-of-venus/
53) ”Looking Around the Neighborhood,” NASA Earth Observatory, Image of the Day for 29 January 2021, URL: https://earthobservatory.nasa.gov/images/147847/looking-around-the-neighborhood
54) Sarah Frazier, ”Parker Solar Probe Marks Seventh Successful Swing around the Sun,” NASA, 21 January 2021, URL: https://blogs.nasa.gov/parkersolarprobe/2021/01/21/parker-solar-probe-marks-seventh-successful-swing-around-the-sun/
55) Sarah Frazier, ”Parker Solar Probe Speeds toward Record-Setting Close Approach to the Sun,” NASA, 25 September 2020, URL: https://blogs.nasa.gov/parkersolarprobe/2020/09/25/parker-solar-probe-speeds-toward-record-setting-close-approach-to-the-sun/
56) ”Researchers get a look at the sun's dusty environment,” CU Bolder, 9 December 2020, URL: https://www.colorado.edu/today/2020/12/09/researchers-get-look-suns-dusty-environment
57) Sarah Frazier, ”Parker Solar Probe Prepares for Third Venus Flyby,” NASA, 10 July 2020, URL: https://blogs.nasa.gov/parkersolarprobe/2020/07/10/parker-solar-probe-prepares-for-third-venus-flyby/
58) Sarah Frazier, ”NASA's Parker Solar Probe Teams Up With Observatories Around Solar System for 4th Solar Encounter,” NASA Feature, 12 June 2020, URL: https://www.nasa.gov/feature/goddard/2020/nasa-parker-solar-probe-teams-up-with-observatories-around-solar-system-for-4th-solar-encounter
59) Jeremy Rehm, ”Parker Solar Probe Team Hears 1st Whispers of Solar Wind's Birth,” JHU/APL Feature, 14 January, 2020, URL: https://www.jhuapl.edu/FeatureStory/200114
60) Brian Morse, James Kinnison, Mary Kae Lockwood, Edward Reynolds, Nicola Fox, “Solar Probe Plus Mission Update,” Proceedings of IAC 2011 (62nd International Astronautical Congress), Cape Town, South Africa, Oct. 3-7, 2011, paper: IAC-11-A3.5.3
61) Announcement of Opportunity - Solar Probe Plus Investigations,” NASA, Release: December 3, 2009, URL: http://nspires.nasaprs.com/external/viewrepositorydocument/cmdocumentid=214000/SPP%20AO%20V27%20FINAL%20RELEASE%20Amend%202.pdf
62) “The Solar Wind Electrons Alphas and Protons (SWEAP) Investigation for Solar Probe Plus,” Harvard-Smithsonian Center for Astrophysics, URL: https://www.cfa.harvard.edu/sweap/
63) Justin C. Kasper, Robert Abiad, Gerry Austin, Marianne Balat-Pichelin, Stuart D. Bale, John W. Belcher, Peter Berg, Henry Bergner, Matthieu Berthomier, Jay Bookbinder, Etienne Brodu, David Caldwell, Anthony W. Case, Benjamin D. G. Chandran, Peter Cheimets, Jonathan W. Cirtain, Steven R. Cranmer, David W. Curtis, Peter Daigneau, Greg Dalton, Brahmananda Dasgupta, David DeTomaso, Millan Diaz-Aguado, Blagoje Djordjevic, Bill Donaskowski, Michael Effinger, Vladimir Florinski, Nichola Fox, Mark Freeman, Dennis Gallagher, S. Peter Gary, Tom Gauron, Richard Gates, Melvin Goldstein, Leon Golub, Dorothy A. Gordon, Reid Gurnee, Giora Guth, Jasper Halekas, Ken Hatch, Jacob Heerikuisen, George Ho, Qiang Hu, Greg Johnson, Steven P. Jordan, Kelly E. Korreck, Davin Larson, Alan J. Lazarus, Gang Li, Roberto Livi, Michael Ludlam, Milan Maksimovic, James P. McFadden, William Marchant, Bennet A. Maruca, David J. McComas, Luciana Messina, Tony Mercer, Sang Park, Andrew M. Peddie, Nikolai Pogorelov, Matthew J. Reinhart, John D. Richardson, Miles Robinson, Irene Rosen, Ruth M. Skoug, Amanda Slagle, John T. Steinberg, Michael L. Stevens, Adam Szabo, Ellen R. Taylor, Chris Tiu, Paul Turin, Marco Velli, Gary Webb, Phyllis Whittlesey, Ken Wright, S. T. Wu, Gary Zank, ”Solar Wind Electrons Alphas and Protons (SWEAP) Investigation: Design of the Solar Wind and Coronal Plasma Instrument Suite for Solar Probe Plus,” Space Science Reviews, Springerlink Online, 29 October 2015, doi:10.1007/s11214-015-0206-3, URL: http://tinyurl.com/hgdhtup
64) “Wide-Field Imager for Solar Probe Plus (WISPR),” NRL, July 2016, URL: http://www.nrl.navy.mil/ssd/branches/7680/WISPR
65) Angelos Vourlidas, Russell A. Howard, Simon P. Plunkett, Clarence M. Korendyke, Michael T. Carter, Arnaud F. R. Thernisien, Damien H. Chua, Peter Van Duyne, Dennis G. Socker, Mark G. Linton, Paulett C. Liewer, Jeffrey R. Hall, Jeff S. Morrill, Eric M. DeJong, Zoran Mikic, Pierre L. P. M. Rochus, Volker Bothmer, Jens Rodman, Philippe Lamy, “Seeing the Corona with the Solar Probe Plus Mission: The Wide-Field Imager for Solar Probe+ (WISPR),” Proceedings of SPIE, Vol. 8862, Solar Physics and Space Weather Instrumentation V, 88620I, San Diego, Ca, USA, 26 September 2013; doi: 10.1117/12.2027508, URL: https://orbi.ulg.ac.be/bitstream/2268/170906/1/Seeing%20the%20Corona%20with%20the%20Solar%20Probe%20Plus%20Mission%20The%20Wide-Field.pdf
66) Angelos Vourlidas , Russell A. Howard, Simon P. Plunkett, Clarence M. Korendyke, Arnaud F. R. Thernisien, Dennis Wang, Nathan Rich, Michael T. Carter, Damien H. Chua, Dennis G. Socker, Mark G. Linton, Jeff S. Morrill, Sean Lynch, Adam Thurn, Peter Van Duyne, Robert Hagood, Greg Clifford, Phares J. Grey, Marco Velli, Paulett C. Liewer, Jeffrey R. Hall, Eric M DeJong, Zoran Mikic, Pierre Rochus, Emanuel Mazy, Volker Bothmer, Jens Rodmann, ”The Wide-Field Imager for Solar Probe Plus (WISPR),” Springer, Space Science Reviews, Feb. 11, 2015, doi: 10.1007/s11214-014-0114-y
67) Russell A. Howard, Angelos Vourlidas, Clarence M. Korendyke, Simon P. Plunkett, Michael T. Carter, Dennis Wang, Nathan Rich, Donald R. McMullin, Sean Lynch, Adam Thurn,; Greg Clifford, Dennis G. Socker, Arnaud F. Thernisien, Damien Chua, Mark G. Linton, David Keller, James R. Janesick, John Tower, Mark Grygon, Robert Hagood , William Bast, Paulett C. Liewer, Eric M. DeJong, Marco M. C. Velli, Zoran Mikic, Volker Bothmer, Pierre Rochus, Jean-Philippe Halain, Philippe L. Lamy, ”The solar and heliospheric imager (SoloHI) instrument for the solar orbiter mission,” Proceedings of . SPIE, Vol. 8862, 'Solar Physics and Space Weather Instrumentation V', 88620H; doi:10.1117/12.2027657, San Diego, CA, USA, September 26, 2013)
68) Clarence M. Korendyke, Angelos Vourlidas, Simon P. Plunkett, Russell A. Howard, Dennis Wang, Cheryl J. Marshall, Augustyn Waczynski , James J. Janesick, Thomas Elliott, Samuel Tun, John Tower, Mark Grygon, David Keller, Gregory E. Clifford, ”Development and test of an active pixel sensor detector for heliospheric imager on solar orbiter and solar probe plus,” Proceedings of SPIE, Vol. 8862, 'Solar Physics and Space Weather Instrumentation V, 88620J; doi:10.1117/12.2027655, San Diego, CA, USA, Aug. 25, 2013,
69) V. Bothmer, R. A. Howard (WISPR PI), A. Vourlidas, “WISPR (WideField Imager for Solar Probe Plus),” Proceedings of HELCATS (Heliospheric Cataloguing, Analysis & Techniques Service) First Annual Open Workshop, Göttingen, Germany, May 19-22, 2015, URL: http://www.affects-fp7.eu/helcats-meeting/data/workshop_presentations/20150522_1120_s5_The%20Wide_field%20Imager%20for%20Solar%20PRobe+_WISPR_vbothmer.pdf
70) “SwRI energetic particle instruments selected for Solar Probe Plus mission,” Sept. 2, 2010, URL: http://www.swri.org/9what/releases/2010/solarprobe.htm
71) D. J. McComas, N. Alexander, N. Angold, S. Bale, C. Beebe, B. Birdwell, M. Boyle, J. M. Burgum, J. A. Burnham, E. R. Christian, W. R. Cook, S. A. Cooper, A. C. Cummings, A. J. Davis, M. I. Desai, J. Dickinson, G. Dirks, D. H. Do, N. Fox, J. Giacalone, R. E. Gold, R. S. Gurnee, J. R. Hayes, M. E. Hill, J. C. Kasper, B. Kecman, J. Klemic, S. M. Krimigis, A. W. Labrador, R. S. Layman, R. A. Leske, S. Livi, W. H. Matthaeus, R. L. McNuttJr, R. A. Mewaldt, D. G. Mitchell, K. S. Nelson, C. Parker, J. S. Rankin, E. C. Roelof, N. A. Schwadron, H. Seifert, S. Shuman, M. R. Stokes, E. C. Stone, J. D. Vandegriff, M. Velli, T. T. von Rosenvinge, S. E. Weidner, M. E. Wiedenbeck, P. WilsonIV, ”Integrated Science Investigation of the Sun (ISIS): Design of the Energetic Particle Investigation,” Space Science Reviews, Springerlink Online, July 5, 2014, doi:10.1007/s11214-014-0059-1, URL: http://tinyurl.com/hqwgyrs
72) S. D. Bale, K. Goetz, P. R. Harvey, P. Turin, J. W. Bonnell, T. Dudok de Wit, R. E. Ergun, R. J. MacDowall, M. Pulupa, M. Andre, M. Bolton, J.-L. Bougeret, T. A. Bowen, D. Burgess, C. A. Cattell, B. D. G. Chandran, C. C. Chaston, C. H. K. Chen, M. K. Choi, J. E. Connerney, S. Cranmer, M. Diaz-Aguado, W. Donakowski, J. F. Drake, W. M. Farrell, P. Fergeau, J. Fermin, J. Fischer, N. Fox, D. Glaser, M. Goldstein, D. Gordon, E. Hanson, S. E. Harris, L. M. Hayes, J. J. Hinze, J. V. Hollweg, T. S. Horbury, R. A. Howard, V. Hoxie, G. Jannet, M. Karlsson, J. C. Kasper, P. J. Kellogg, M. Kien, J. A. Klimchuk, V. V. Krasnoselskikh, S. Krucker, J. J. Lynch, M. Maksimovic, D. M. Malaspina, S. Marker, P. Martin, J. Martinez-Oliveros, J. McCauley, D. J. McComas, T. McDonald, N. Meyer-Vernet, M. Moncuquet, S. J. Monson, F. S. Mozer, S. D. Murphy, J. Odom, R. Oliverson, J. Olson, E. N. Parker, D. Pankow, T. Phan, E. Quataert, T. Quinn, S. W. Ruplin, C. Salem, D. Seitz, D. A. Sheppard, A. Siy, K. Stevens, D. Summers, A. Szabo, M. Timofeeva, A. Vaivads, M. Velli, A. Yehle, D. Werthimer, J. R. Wygant, ”The FIELDS Instrument Suite for Solar Probe Plus,” Space Science Reviews, Springerlink Online, 31 March 2016, doi:10.1007/s11214-016-0244-5, URL: http://tinyurl.com/zyp3nqj
73) http://solarprobe.jhuapl.edu/spacecraft/instruments.php
74) Justyna Surowiec, Karen C. Fox, ”Cutting-Edge Heat Shield Installed on NASA’s Parker Solar Probe,” NASA, 5 July 2018, URL: https://www.nasa.gov/feature/goddard/2018/cutting-edge-heat-shield-installed-on-nasa-s-parker-solar-probe
75) ”New Views of Sun: 2 Missions Will Go Closer to Our Star Than Ever Before,” NASA, 16 May 2018, URL: https://www.nasa.gov/feature/goddard/2018/new-views-of-sun-2-missions-will-go-closer-to-our-star-than-ever-before
76) ”Key Parker Solar Probe sensor bests sun simulator—last launch hurdle,” University of Michigan, 30 April 2018, URL: http://www.ns.umich.edu/new/multimedia/videos/25608-key-parker-solar-probe-sensor-bests-sun-simulator-last-launch-hurdle
77) ”NASA’s Mission to Touch the Sun Arrives in the Sunshine State,” NASA, 6 April, 2018, URL: https://www.nasa.gov/feature/goddard/2018/nasa-s-mission-to-touch-the-sun-arrives-in-the-sunshine-state
78) Dwayne Brown, Karen Fox, Geoff Brown, ”Public Invited to Come Aboard NASA’s First Mission to Touch the Sun,” NASA 6 March 2018, URL: https://www.nasa.gov/feature/goddard/2018/public-invited-to-come-aboard-nasa-s-first-mission-to-touch-the-sun
79) Sarah Frazier, ”Parker Solar Probe Enters Thermal Vacuum Chamber,” NASA, 17 Jan. 2018, URL: https://blogs.nasa.gov/parkersolarprobe/2018/01/17/parker-solar-probe-enters-thermal-vacuum-chamber/
80) Sarah Frazier, ”Parker Solar Probe Comes to NASA Goddard for Testing,” NASA, 8 Nov. 2017, URL: https://www.nasa.gov/feature/goddard/2017/parker-solar-probe-comes-to-nasa-goddard-for-testing
81) Chris Gebhardt, ”Parker Solar Probe in integrated testing, launch on track for July 2018,” NASA Spaceflight, 27 Sept. 2017, URL: https://www.nasaspaceflight.com/2017/09/parker-solar-probe-on-track-july-2018/
82) ”Parker Solar Probe gets its revolutionary heat shield,” Phy.org, 27 Sept. 2017, URL: https://phys.org/news/2017-09-parker-solar-probe-revolutionary-shield.html
83) ”Solar Probe Plus Mission Moves into Advanced Development,” JHU/APL, Press Release, July 14, 2016, URL: http://www.jhuapl.edu/newscenter/pressreleases/2016/160714.asp
84) ”NASA Gives Green Light for Johns Hopkins APL to Begin Building Solar Probe Plus Spacecraft,” JHU/APL, April 8, 2015, URL: http://www.jhuapl.edu/newscenter/pressreleases/2015/150408.asp
85) “Solar Probe Plus Moves into Advanced Development,” JHU/APL, March 18, 2014, URL: http://www.jhuapl.edu/newscenter/pressreleases/2014/140318.asp
The information compiled and edited in this article was provided by Herbert J. Kramer from his documentation of: ”Observation of the Earth and Its Environment: Survey of Missions and Sensors” (Springer Verlag) as well as many other sources after the publication of the 4th edition in 2002. - Comments and corrections to this article are always welcome for further updates (eoportal@symbios.space).
Spacecraft Launch Mission Status Sensor Complement References Back to top