Terra 2021 (mission status and imagery for the period 2021-2020)
Terra mission status and imagery for the period 2021-2020
References
• December 23, 2021: On the Yamal Peninsula in West Siberia, the nomadic Nenets people have a long tradition of herding reindeer on the Arctic tundra. In recent decades, however, the tundra has been changing, and so are the ways that reindeer interact with it. 1)
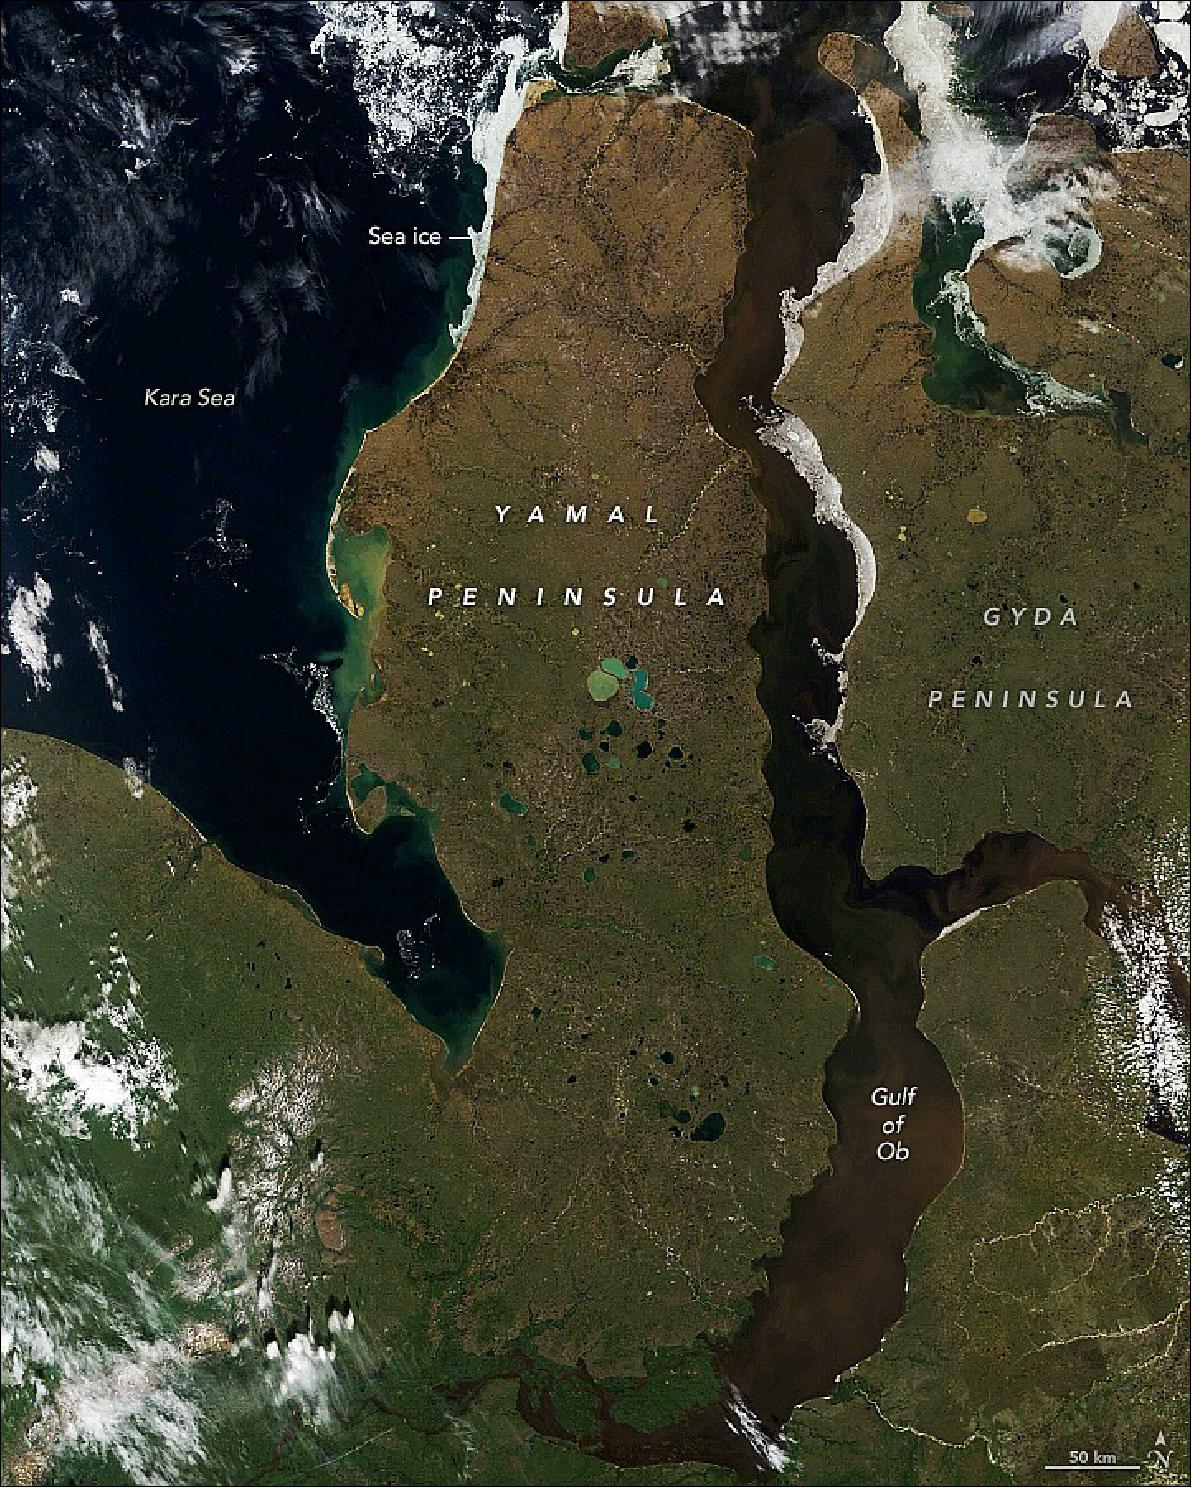
- In the Arctic, temperatures have been rising faster than anywhere else in the world. Climate change has been altering the plant communities in tundra and taiga (boreal) ecosystems. As growing seasons become longer and warmer, plant growth has increased—an effect called Arctic greening. Additionally, the tundra grasses and small plants that normally grow here are being replaced by taller, woodier shrubs and trees—a change called shrubification. These changes in vegetation affect the tundra ecosystem, including its carbon cycle, human and wildlife habitat, and susceptibility to wildfire.
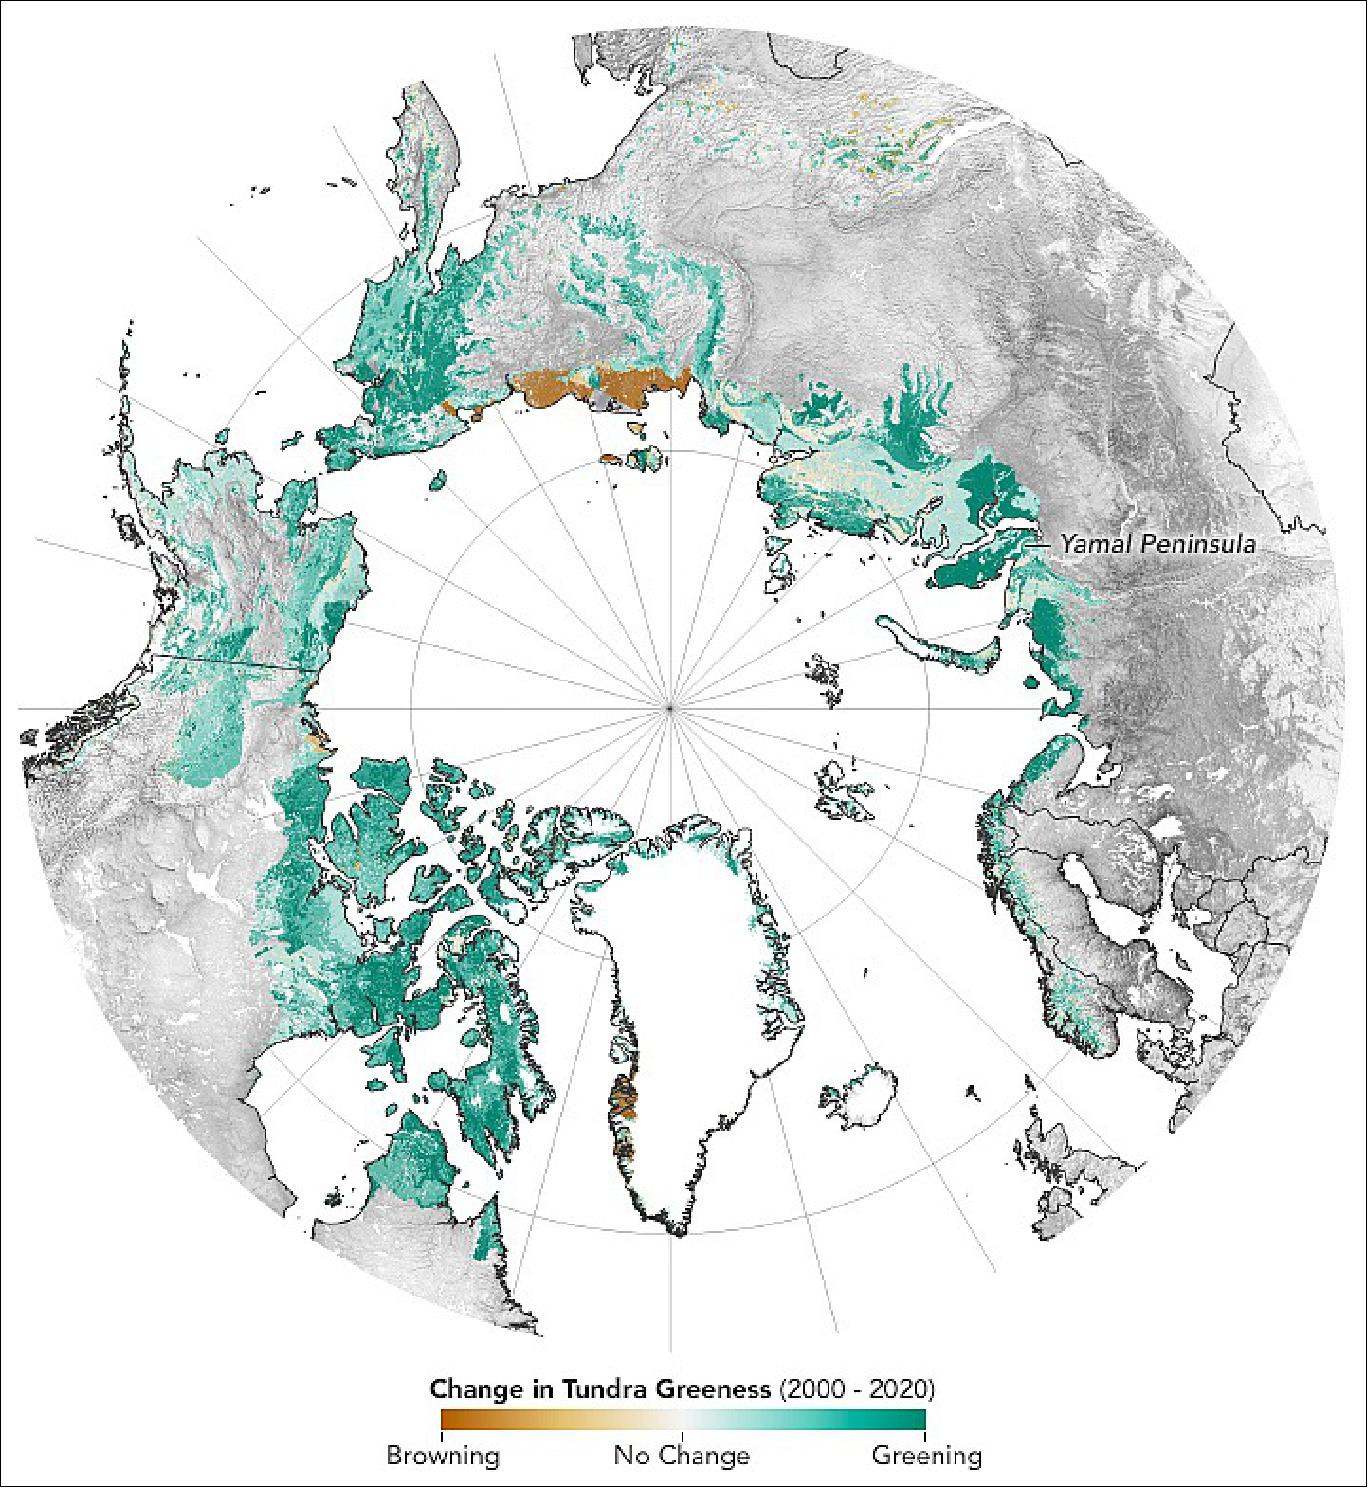
- But the changes have not been uniform across the Arctic. For example, research supported by NASA's Arctic-Boreal Vulnerability Experiment (ABoVE) found that instead of greening, some colder, drier areas have experienced browning. The map below is based on Landsat satellite observations between 2000 and 2016 that show about 22 percent of the Arctic became greener while 5 percent became browner.
- For decades, satellite instruments have monitored vegetation from space. Ground-based studies have shown how reindeer—the only large herbivore in many areas of the Arctic—can affect vegetation, including reducing greenness and lichen abundances, slowing the encroachment of shrubs, and increasing soil nitrogen. Now, satellites are being used to investigate the interactions between the vegetation and reindeer.
- In a 2020 study, researchers used 30 years of Landsat imagery data to map changes in shrub cover across the Yamal Peninsula. They found it was stable between 1986 and 2016, despite the warming climate and a 75 percent increase in the reindeer population over that time.
- "Our results thus point towards increases in large herbivore pressures having compensated for the warming of the Peninsula, halting the shrubification of the area," the authors wrote in the Journal of Environmental Management. "This suggests that strategic semi-domesticated reindeer husbandry, which is a common practice across the Eurasian Arctic, could represent an efficient environmental management strategy for maintaining open tundra landscapes in the face of rapid climate change."
- However, another 2020 study of the Yamal reindeer found that this strategy may have its limits. Using Landsat imagery, along with ground surveys based on fecal pellets, scientists tried to quantify land-use by reindeer. They found that while foraging and trampling do hold back the growth of low-growing shrubs, they do not appear to prevent the further growth or expansion of taller, already established shrubs because these are areas where reindeer are unlikely to forage.
- "Our results suggest that reindeer use of the landscape, and hence their effects on the landscape, correlates with the landscape structure," the authors wrote in Environmental Research Letters, adding that further research will be needed to evaluate the role of "reindeer as ecosystem engineers capable of mediating the effects of climate change."
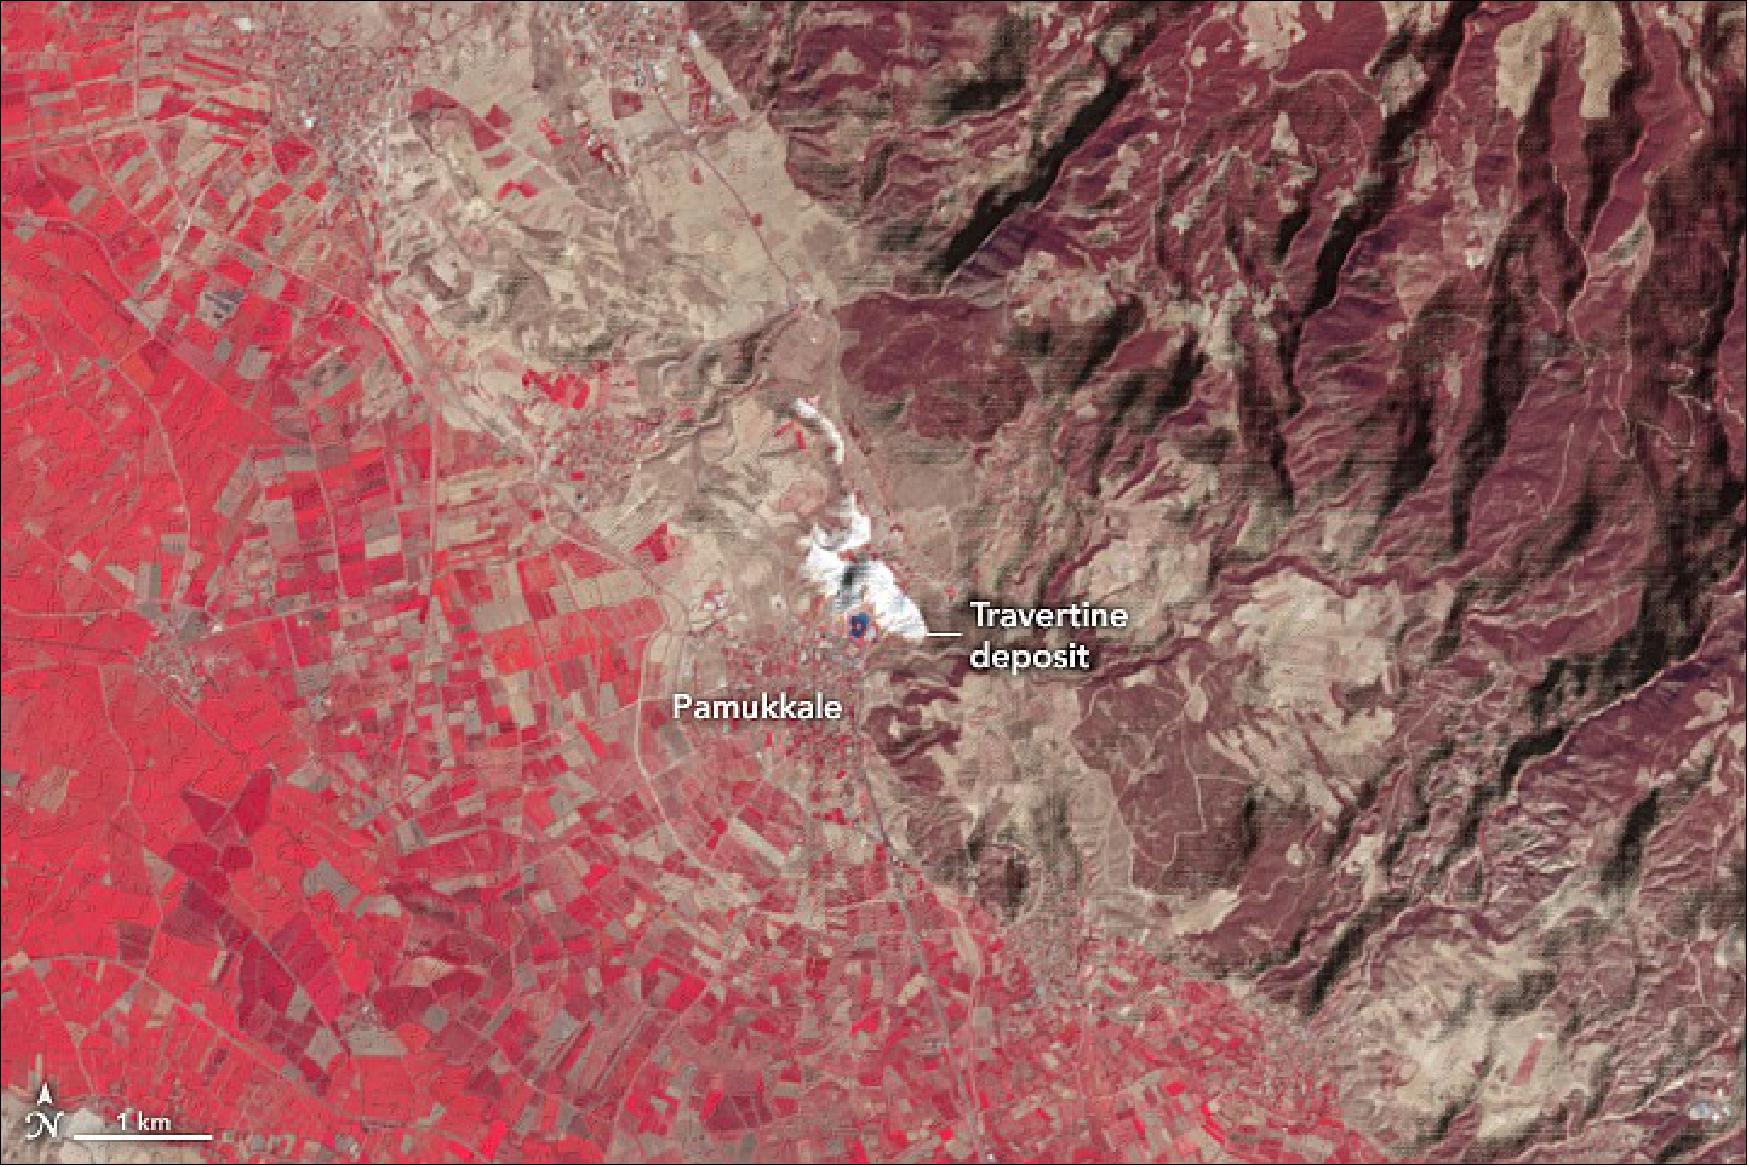
• November 24, 2021: The hot springs and thermal pools at Pamukkale, Turkey, have been a spiritual, cultural, and recreational destination for thousands of years. In the second century B.C., the ancient Greco-Roman city of Hierapolis was built atop the terraces of travertine, a type of rock that forms when calcium carbonate precipitates from hot water. At the nearby Cleopatra's Pools, visitors can swim among broken columns that collapsed during the Laodikeia earthquake in early seventh century C.E. Hierapolis-Pamukkale was designated a UNESCO World Heritage site in 1988. 2)
- The world's largest deposit of such rocks lies in western Anatolia, Turkey, where Earth's crust is pulling apart. This extension of the crust creates many faults and fissures, along with volcanic, seismic, and geothermal activity.
- One of the largest sections is the 6-kilometer-long Pamukkale plateau, on the northern margin of the Denizli Basin, where the rock averages 50 meters thick. The site features a spectacular array of white calcite terraces and rimstone pools cascading over 200-meter-high cliffs on the uplifted side of the Pamukkale fault. Named for the bright white rocks, Pamukkale translates as "cotton castle" or "cotton palace."
- Water temperatures in these pools and springs range from 19 to 57 º Celsius (65 to 135º Fahrenheit), although some can reach temperatures of 100º Celsius or higher. The travertine forms when rainwater seeps down into the network of faults and fissures and is heated by magma deep underground. The hot water leaches calcium, magnesium and other minerals from the limestone bedrock. The saturated solution then percolates back to the surface, reemerging from springs at the surface where the minerals precipitate.
- Travertine deposition has been occurring in the area for at least 600,000 years, since the Pleistocene epoch. However, much of the deposition at Pamukkale has occurred in the past 50,000 years. Research suggests the current hydrothermal and depositional system was established after the seventh-century Laodikeia earthquake.
- The temperature regime has changed over time as well. Calcite travertine precipitates from higher temperature springs, while more porous tufa deposits form at lower temperatures. Age dating and geochemical analyses of deposits indicate water temperatures have declined since the Pleistocene epoch.
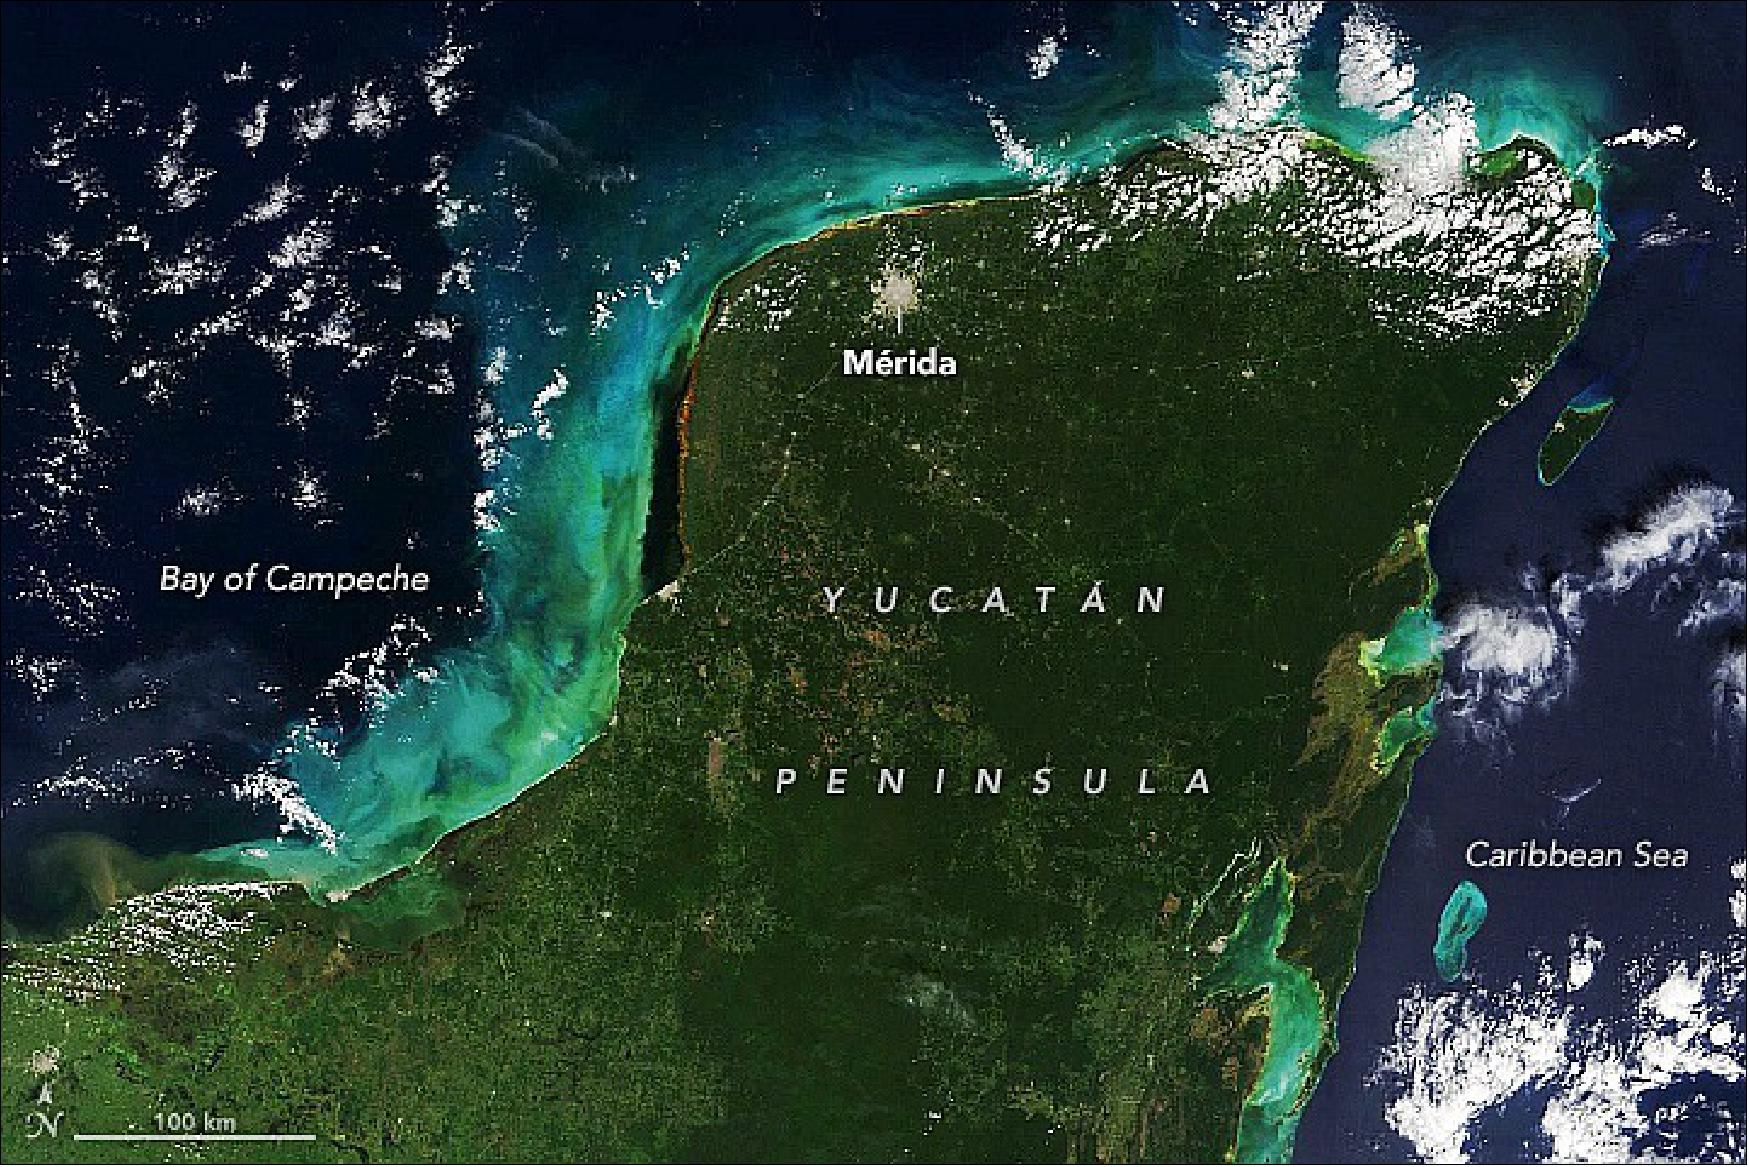
• November 22, 2021: Sixty-six million years ago, an asteroid or comet about 10 miles (14 km) wide smashed into Earth. It struck what is now Mexico's Yucatán Peninsula, which was then lying at the bottom of a shallow sea. The impact was catastrophic. It triggered tsunamis, started wildfires, and ejected a cloud of ash and dust that circled the globe, blocked the Sun, and chilled the climate. The collision and its aftermath ultimately killed off 75 percent of all life on Earth, including the dinosaurs. 3)
- The Chicxulub crater, which now lies partially on land, is the best-preserved large impact crater on Earth. In the millions of years since the impact, the crater has been buried in thick layers of limestone. However, remnants of the crater are still visible at the surface.
- A 250-kilometer-long arc of sinkholes marks the crater rim. These sinkholes, called cenotes, provided freshwater to the ancient Mayan inhabitants of the peninsula. The area otherwise lacks surface water due to the karst (soluble limestone) landscape. Because rainwater is slightly acidic, surface water dissolves and seeps down through the limestone bedrock, creating solution pits, cenotes, and caves, as well as the world's longest underground river.
- When those thick layers of limestone erode, the chalky sediments wash out onto the broad, shallow Yucatán Shelf. In this natural-color image, the swirls of sediment are visible off the north and west coast in the Bay of Campeche.
- Sediment scatters light, and this reflectivity gives water characteristic color when viewed from space. When floating near the surface, sediment appears muddy-tan, but as it sinks and disperses the color changes to shades of green and light blue. When the shallow coastal waters are churned by winds, tides, storms, or currents, seafloor sediments can be resuspended, causing the seawater to look white or pale blue. Some of the color may also come from phytoplankton—microscopic plant-like organisms—that sometimes float on the surface in blooms large enough to be seen from space.
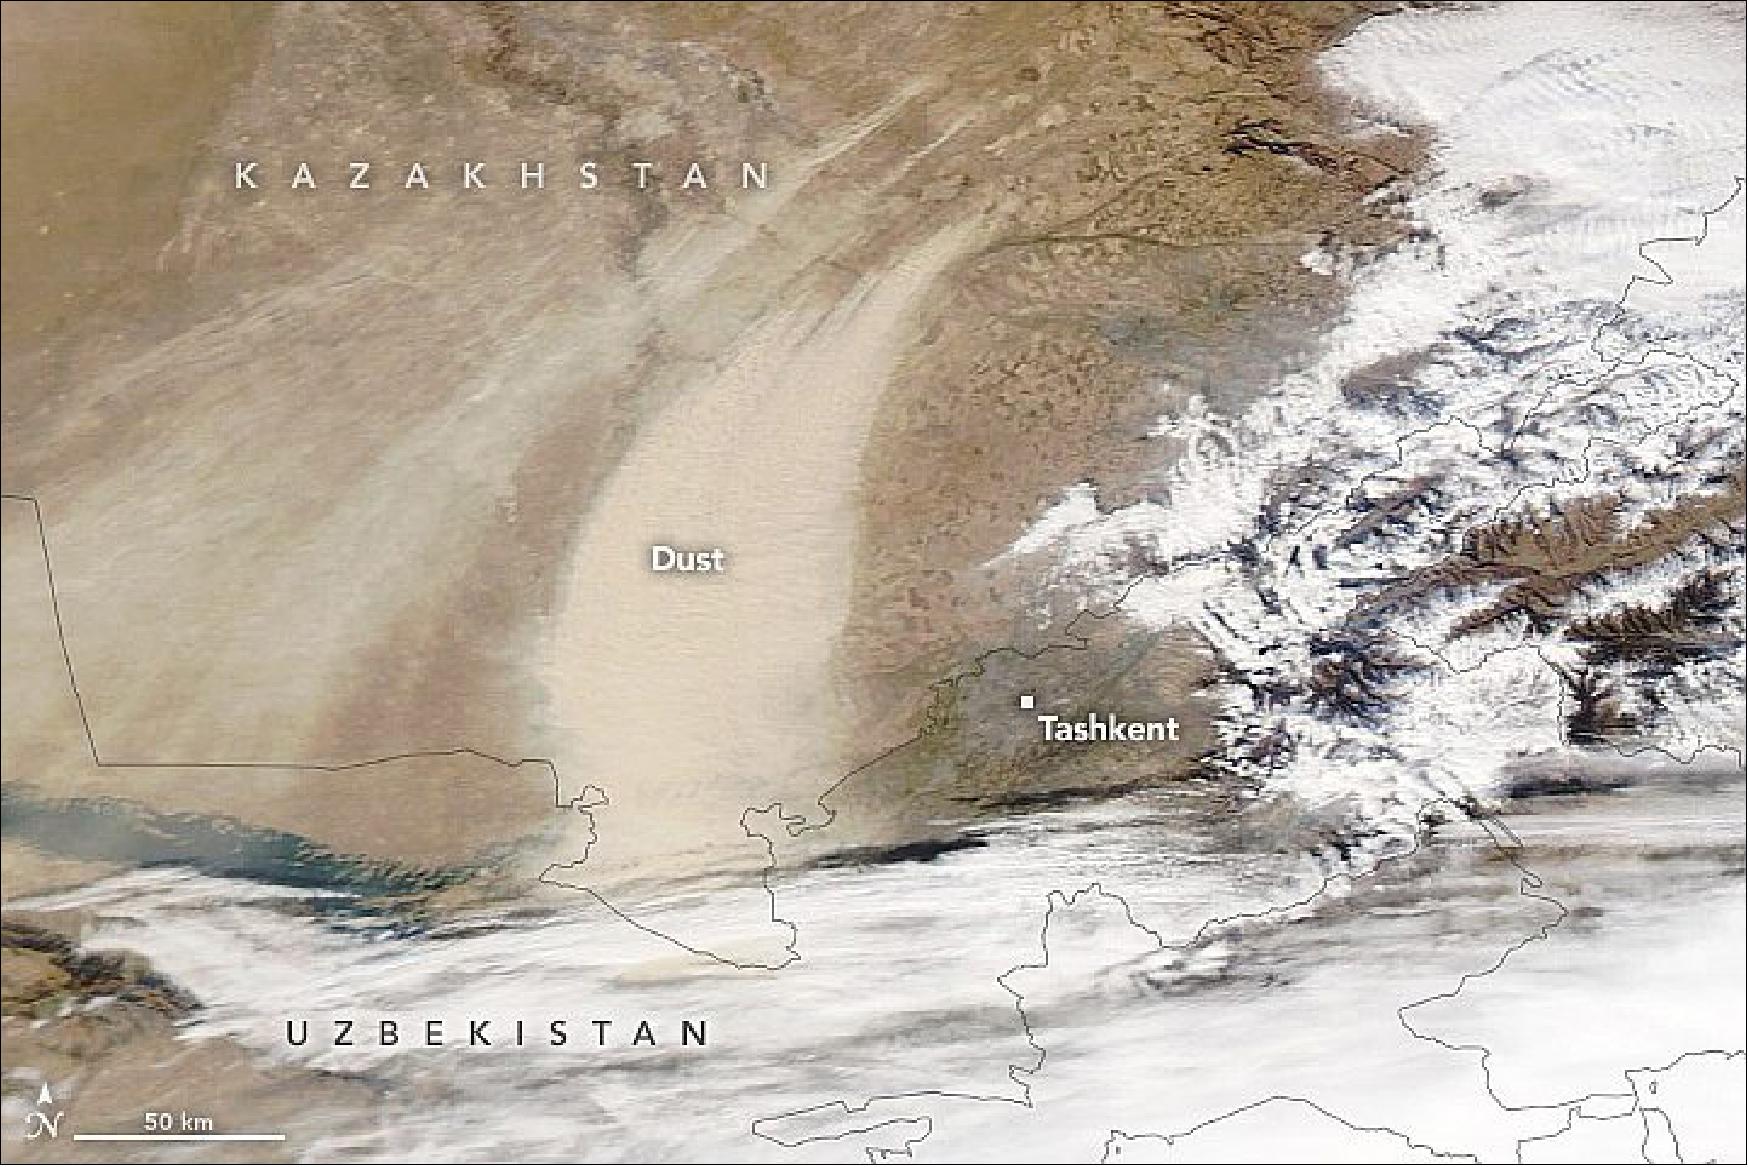
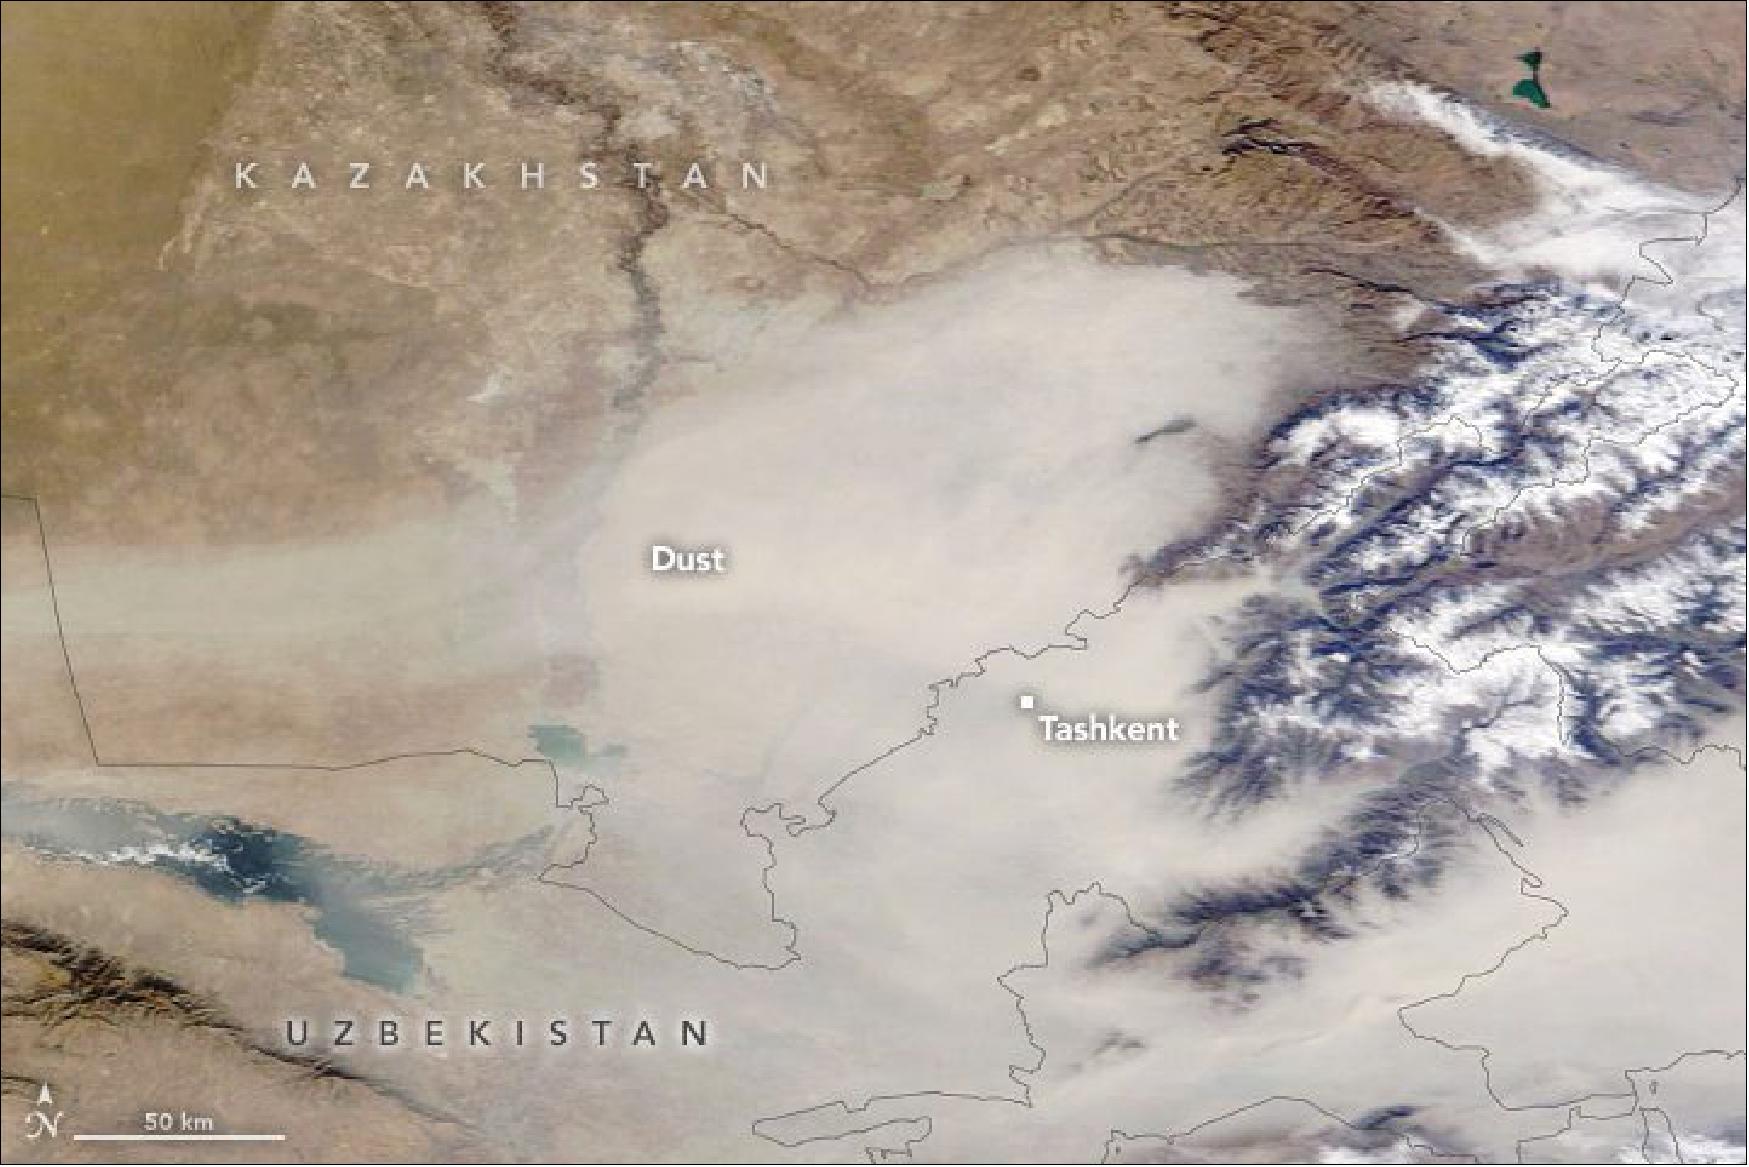
• November 12, 2021: Dust storms are quite common across the dry, windy landscapes of Central Asia. Still, it is unusual for dust to darken the skies of a major city, as one recent storm did in Tashkent, Uzbekistan. 4)
- The vast dust pall was triggered by an anticyclonic storm that brought winds as strong as 70-90 kilometers (45-55 miles) per hour to Uzbekistan's capital. At times, the air in Tashkent grew so thick with dust that visibility dropped to 200 meters. According to Uzbekistan's weather agency (Uzhydromet), levels of coarse particulate matter (PM10) rose to 18,000 micrograms per cubic meter. At times, the concentration of dust in the air was 30 times what Uzbekistan considers acceptable. Across 150 years of monitoring, such extreme dust conditions have never been observed in Tashkent before, according to Uzhydromet.
- If the measurements are correct, those are truly extreme and extremely hazardous levels of particulate matter for an urban area," said Thomas Gill, an atmospheric scientist at the University of Texas at El Paso. "The U.S. EPA's 24-hour average limit is, for example, 150 micrograms per cubic meter for PM10. The highest hourly concentrations I have ever seen recorded in El Paso, Texas—arguably the dustiest city in the U.S.—are about 5000 micrograms per cubic meter for PM10. So these levels in Uzbekistan are about four times worse than I've ever seen in El Paso. These may be amongst the largest PM10 values ever measured for ambient air in an urban area."
- Several months of drought primed the region for the extreme dust event. News media have reported record-breaking temperatures and stressed and dying livestock since the beginning of summer. NASA's Gravity Recovery and Climate Experiment Follow-on GRACE-FO mission observed unusually dry soil moisture conditions in southern Kazakhstan as recently as early November.
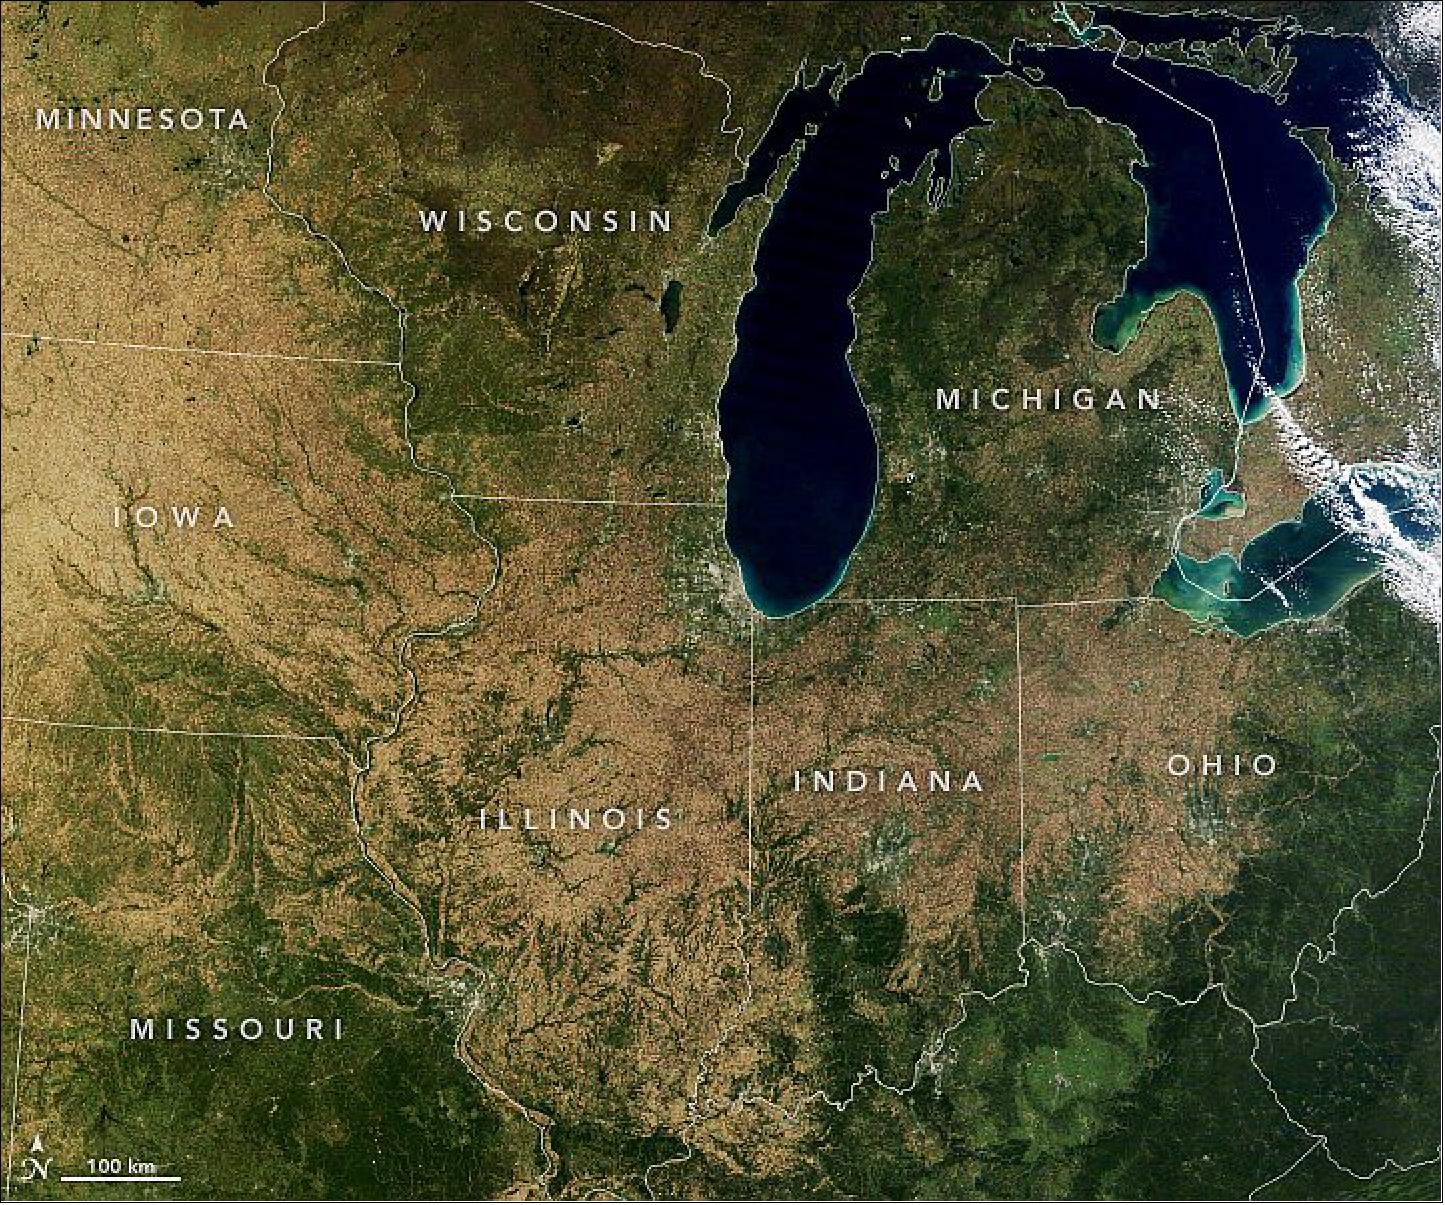
• November 4, 2021: More than one-third of the world's corn is grown in the United States, and the largest share of it comes from a swath of land across the Midwest. On October 18, 2021, NASA's Terra satellite acquired this unusually cloud-free view of that region just as the corn harvest was nearing its end, the stalks from most crops had turned yellow and brown, and some bare soil was visible again. 5)
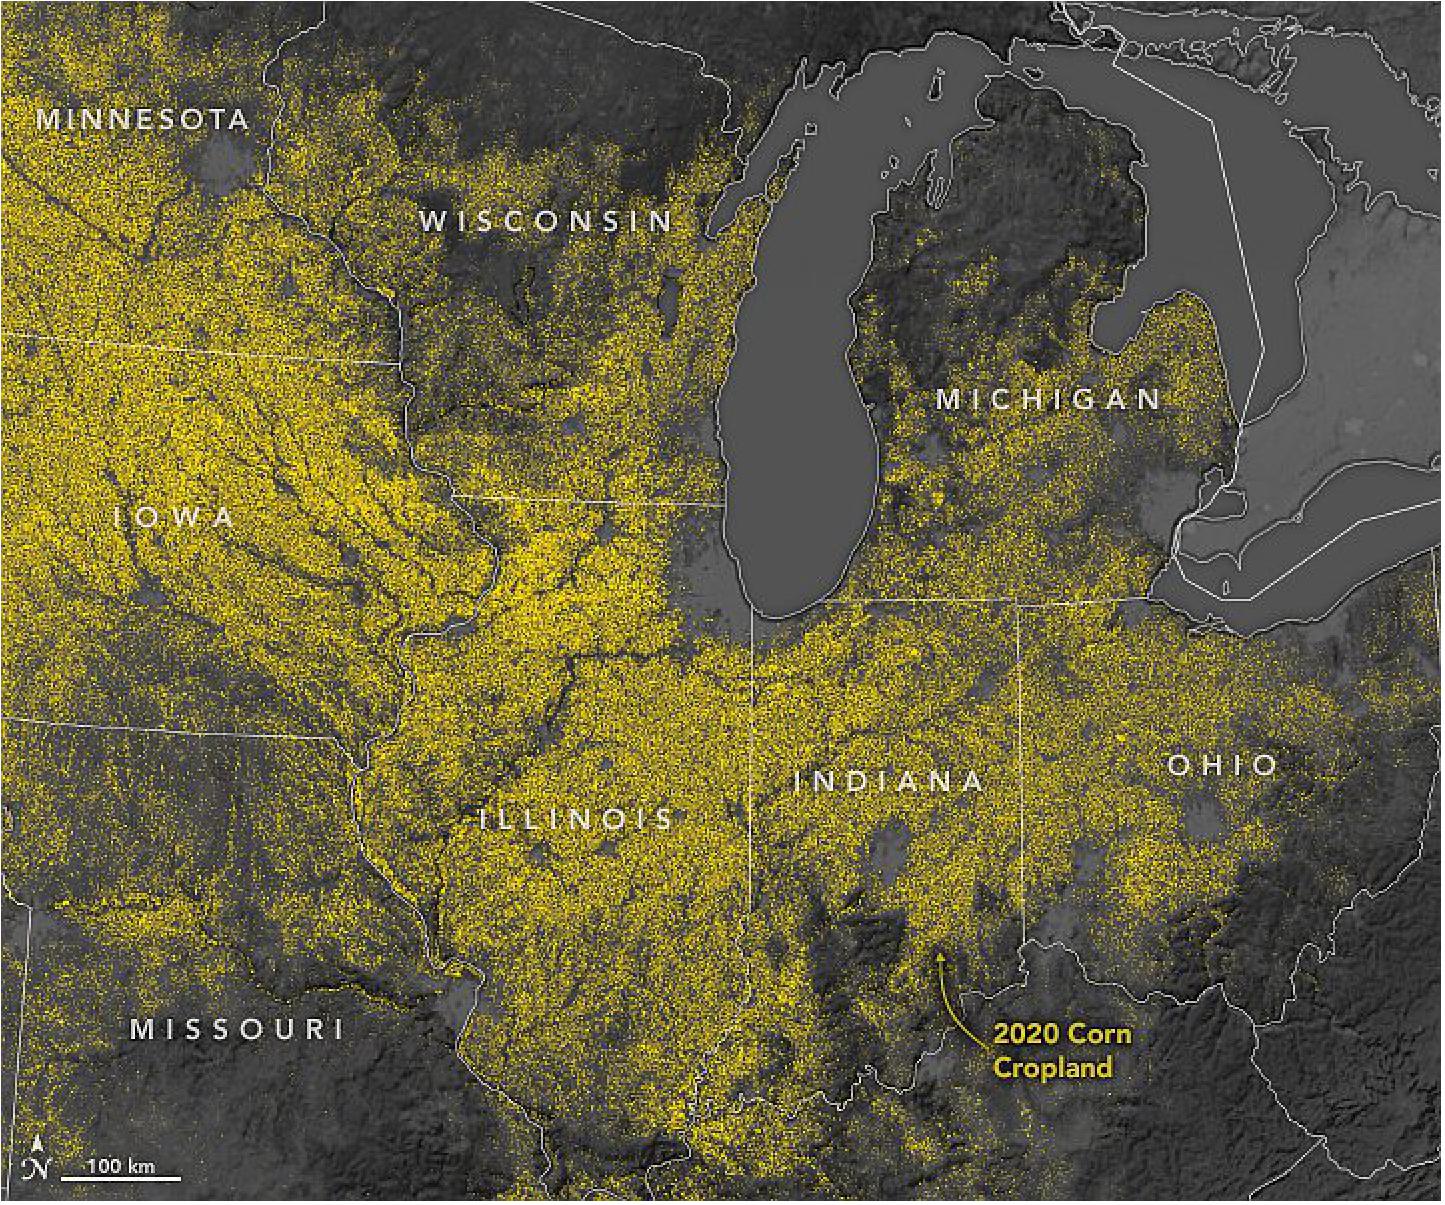
- According to the U.S. Department of Agriculture (USDA), corn is grown in most states, but the highest concentration of cropland devoted to this coarse grain is found across the "Midwest Corn Belt." Together Iowa and Illinois grow and harvest about one-third of the entire U.S. crop, and each state alone produces more corn than many countries.
- In its October 2021 report, USDA noted that corn production was up 3 percent this year, with an estimated 15 billion bushels of corn harvested from 93.3 million planted acres. Record-high yields were reported in ten states, including Illinois, Indiana, Kentucky, Michigan, and Ohio (Figure 7).
- That vast corn supply has three primary uses. About one-third is used to feed livestock either directly or through animal feed products. (Corn provides the carbohydrates while soy provides the protein.) Another third ends up as ethanol, a fuel additive to gasoline. The rest of the corn crop is consumed in food and drinks by people in the U.S. and abroad. The largest importers of U.S. corn include Mexico, South Korea, Japan, and Colombia.
- In a new NASA-led study released on November 1, 2021, scientists estimated that global yields of corn (maize) and wheat could be affected by climate change as soon as 2030. Over the next century, maize yields could decline as much as 24 percent in some regions due to rising temperatures, changing growing seasons, increasing atmospheric carbon dioxide levels, and more erratic rainfall.
• November 3, 2021: NASA's Scientific Visualization Studio illustrates how the Terra Orbit Drift will impact Terra ASTER and Terra MODIS land data products as the satellite moves closer to Earth. 6)
- Terra has orbited Earth for over twenty years collecting data important to Earth's systems research and applications. Crossing the equator at 10:30 am mean local time allowed Terra's ASTER and MODIS instruments to collect a consistent historical record that has provided the science community with a valuable archive of land data products.
- In February 2020, Terra used some of its limited fuel supply to complete an inclination maneuver to maintain the 10:30 am crossing time. Terra continues to drift to an earlier equatorial crossing time and will be lowered to a new orbit corresponding to an Earth Sciences Constellation exit in October 2022.
Terra Orbit Drift 7)
- Since that final inclination maneuver, Terra has continuously drifted to an earlier equatorial crossing time. By the Fall of 2022, Terra's crossing time will be earlier than 10:15 am. To ensure Terra, with limited fuel supplies, is a safe distance from other missions in the Earth Observing Satellite constellation orbit, Terra will be lowered to a new orbit, where it will be able to collect valuable data at an even earlier crossing time.
- As Terra's crossing time creeps earlier, small changes will be noticeable in the data and imagery collected by the instruments aboard Terra. Evidence in imagery of the earlier crossing time will be visible as longer shadows, especially in mountain landscapes. Meanwhile as Terra moves closer to Earth, the sensors' views will become narrower leading to slightly smaller swath widths (less than 1% smaller). The effect will be most noticeable in ASTER imagery, but each of Terra's sensors will be affected. However, the impact on science is expected to be minimal. In fact, some impacts could prove beneficial to some areas of research, like land morphology, surface temperature, and climate research.
- Terra's lengthy legacy of more than two decades of data will continue to contribute to meaningful research of Earth's Systems science for years to come.
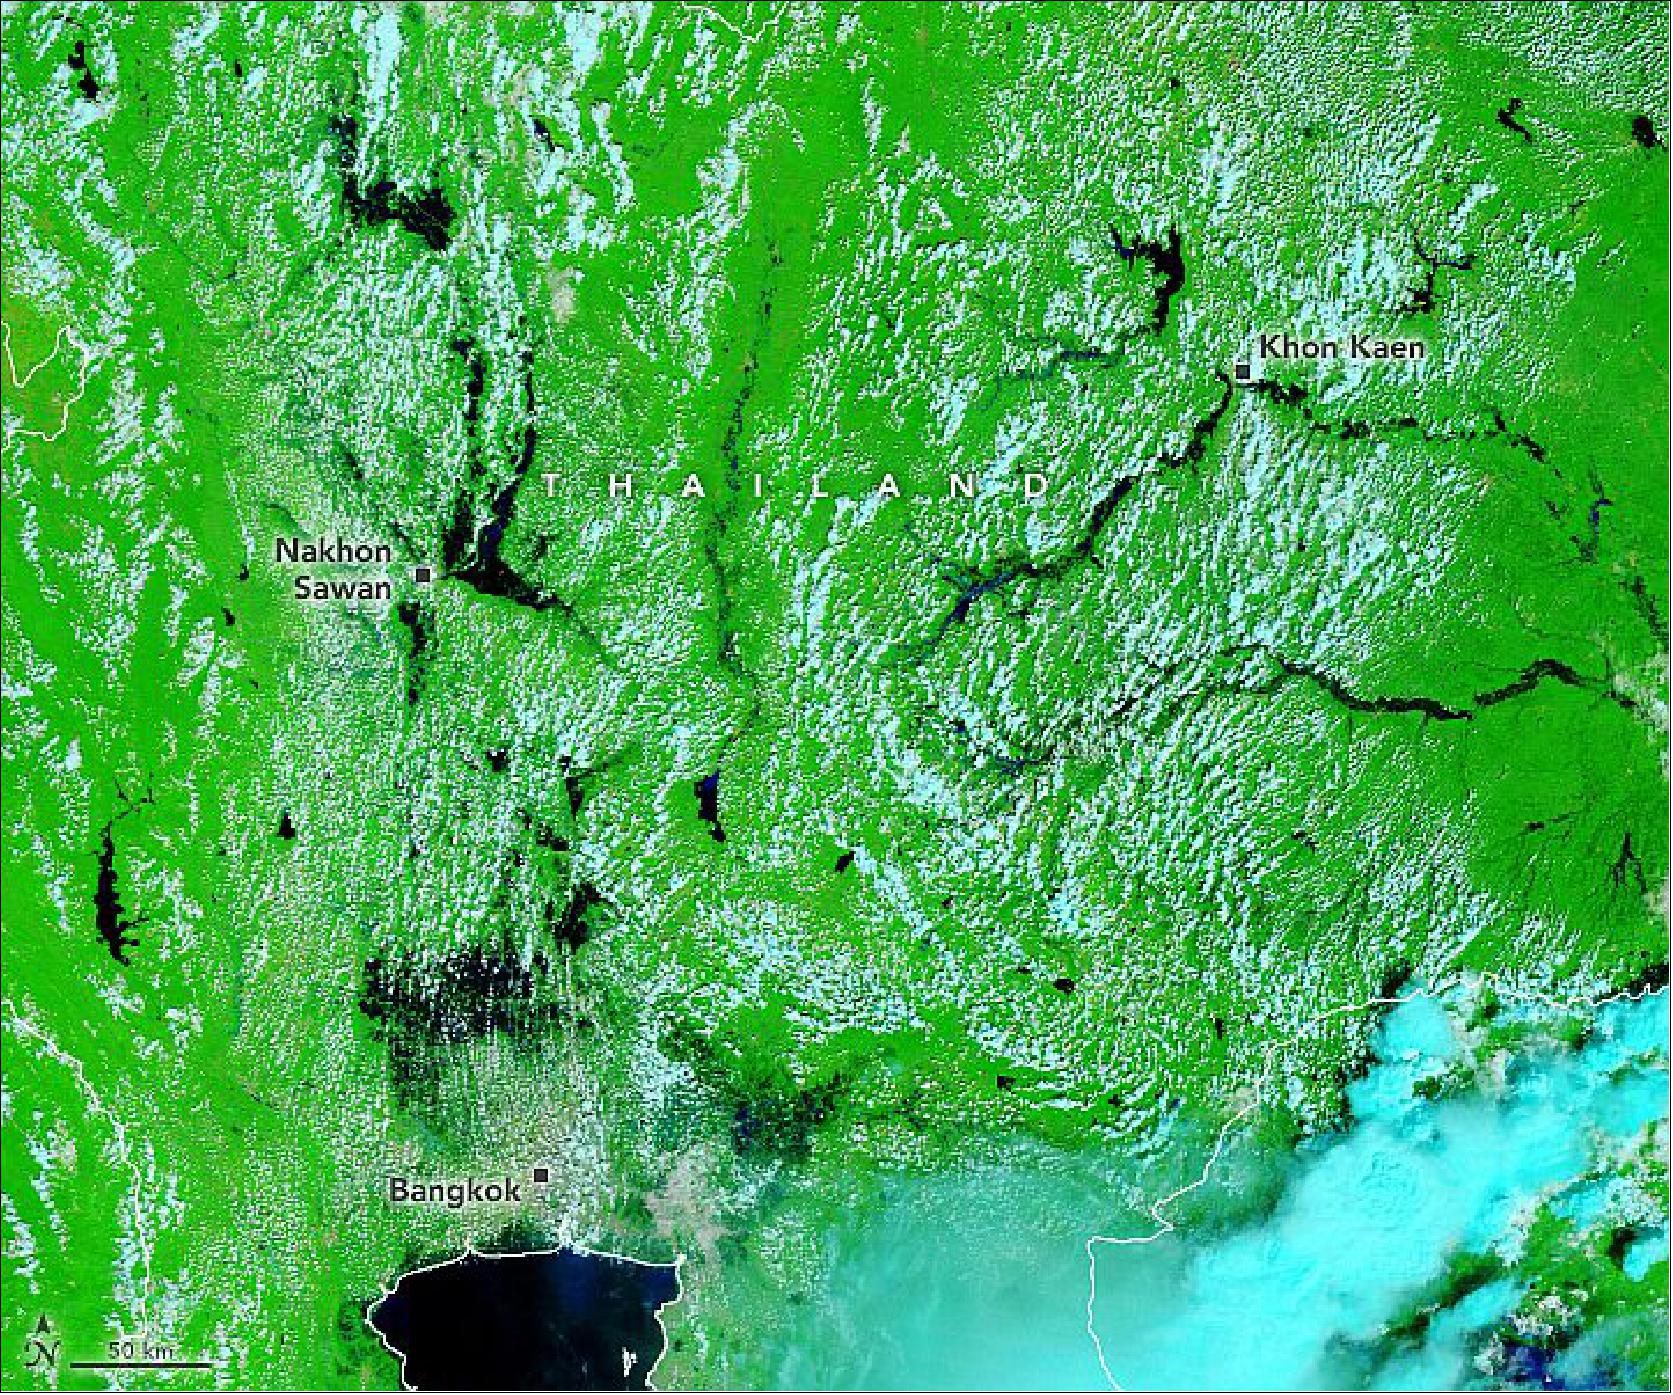
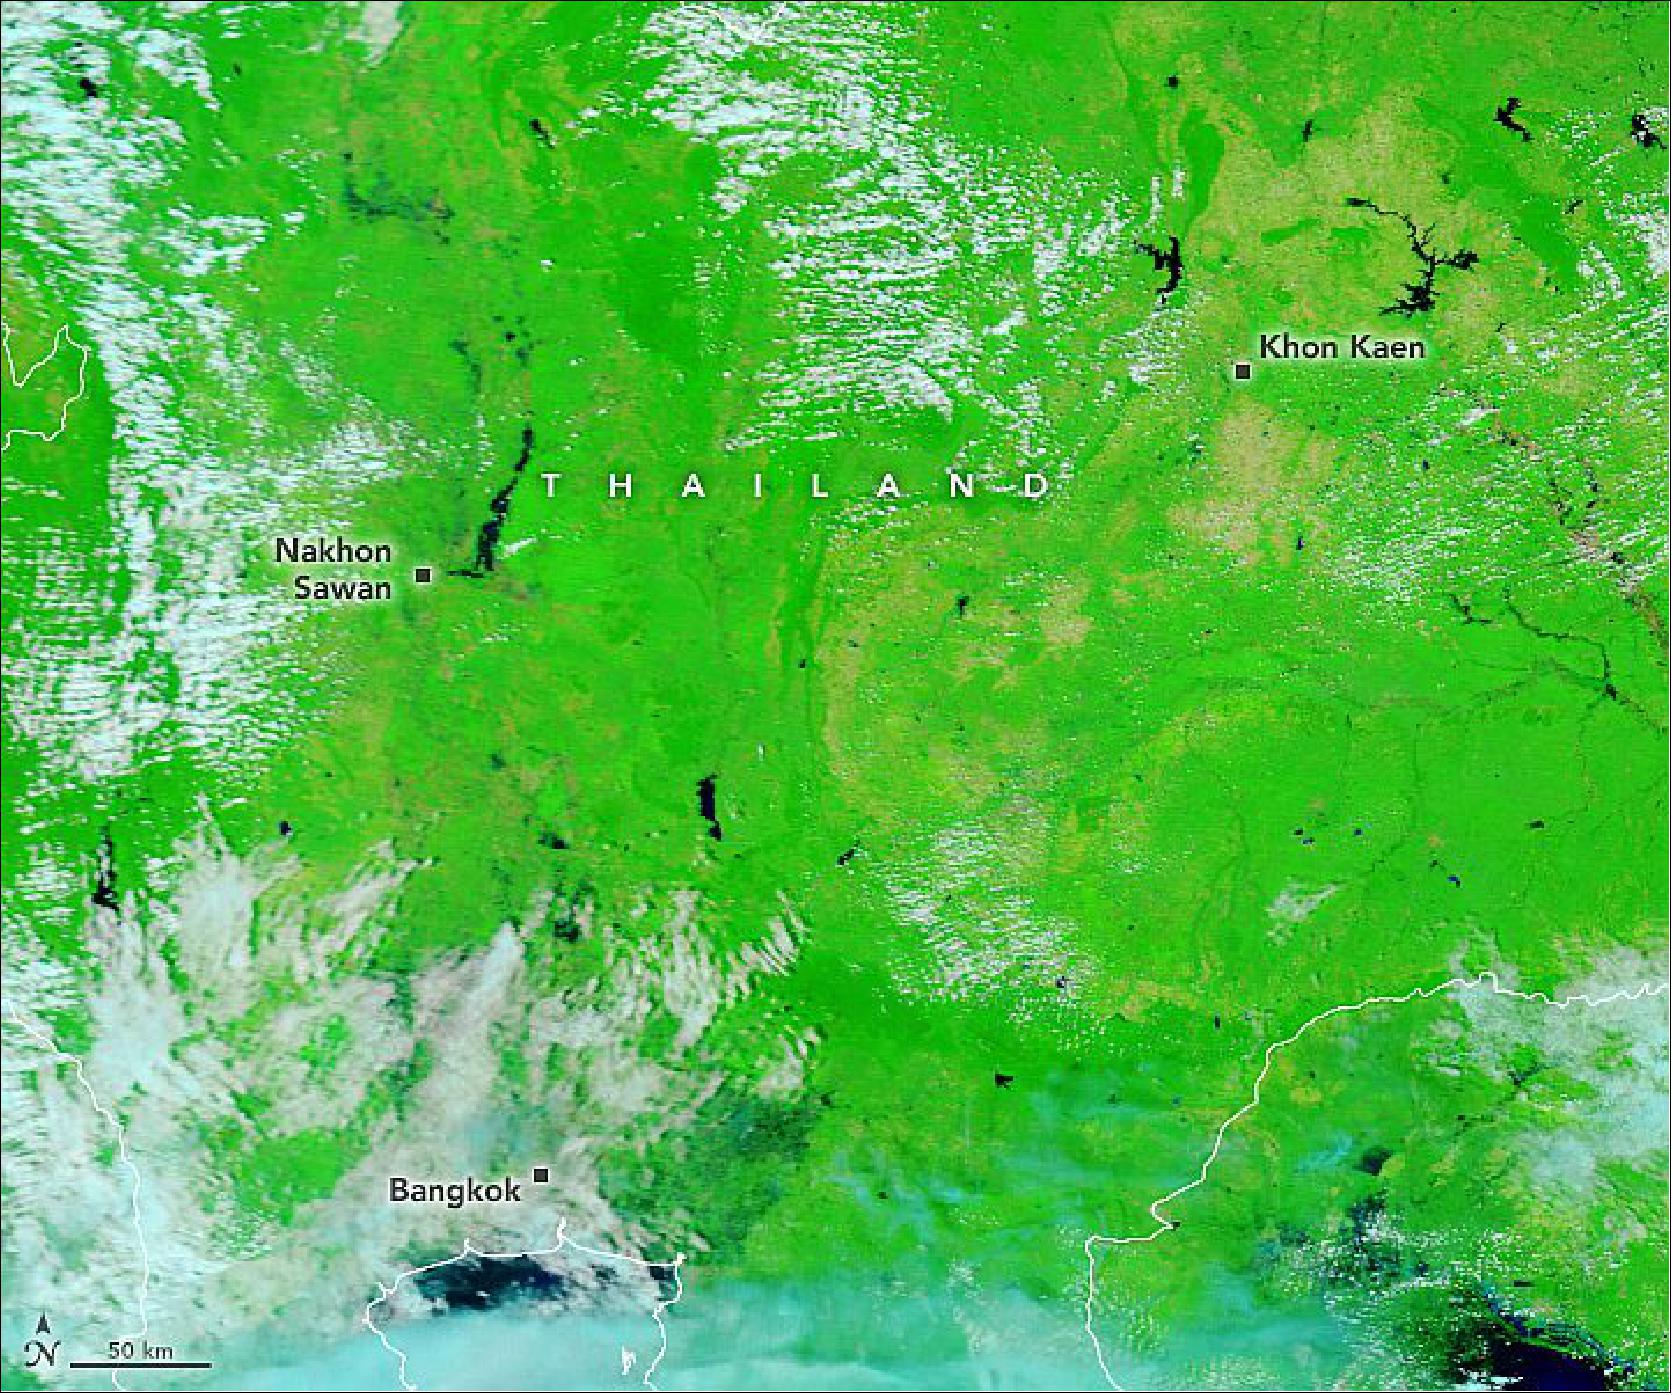
• October 23, 2021: Persistent rain in mid-October 2021 brought more flooding to central and northeastern Thailand, where rivers and reservoirs were already running high. According to the Thailand Department of Disaster Prevention and Mitigation, 32 of the country's 76 provinces have been affected by flooding during a monsoon season that has brought heavy rains for nearly a month. 8)
- In late September and early October, Tropical Storm Dianmu inundated the region, leading to flash flooding and the activation of the International Disaster Charter. Tropical Storm Kompasu followed, bringing more heavy rain to Vietnam, Laos, Cambodia, and Thailand.
- In early October, historical sites in Phra Nakhon Si Ayutthaya Province, home to many temples and ruins, were flooded by the Chao Phraya River. The State Railway of Thailand also temporarily suspended some northern train routes.
- Heavy monsoon rains in mid-October triggered landslides and kept rivers and lakes overflowing their banks. The flooding was exacerbated on October 18 when officials had to release water from the Krasiao Reservoir, about 150 km (100 miles) northwest of Bangkok. That same day, the 1,300-year-old reclining Buddha at Wat Dhammachakra Sema Ram—the country's oldest and longest such statue—was also inundated.
• October 6, 2021: Since the Cumbre Vieja volcano began erupting on September 19, 2021, most of the compelling activity has happened on the ground. For nearly two weeks, thick sheets of lava burned through farmland, roads, and homes on the southwestern part of La Palma, one of the Canary Islands. 9)
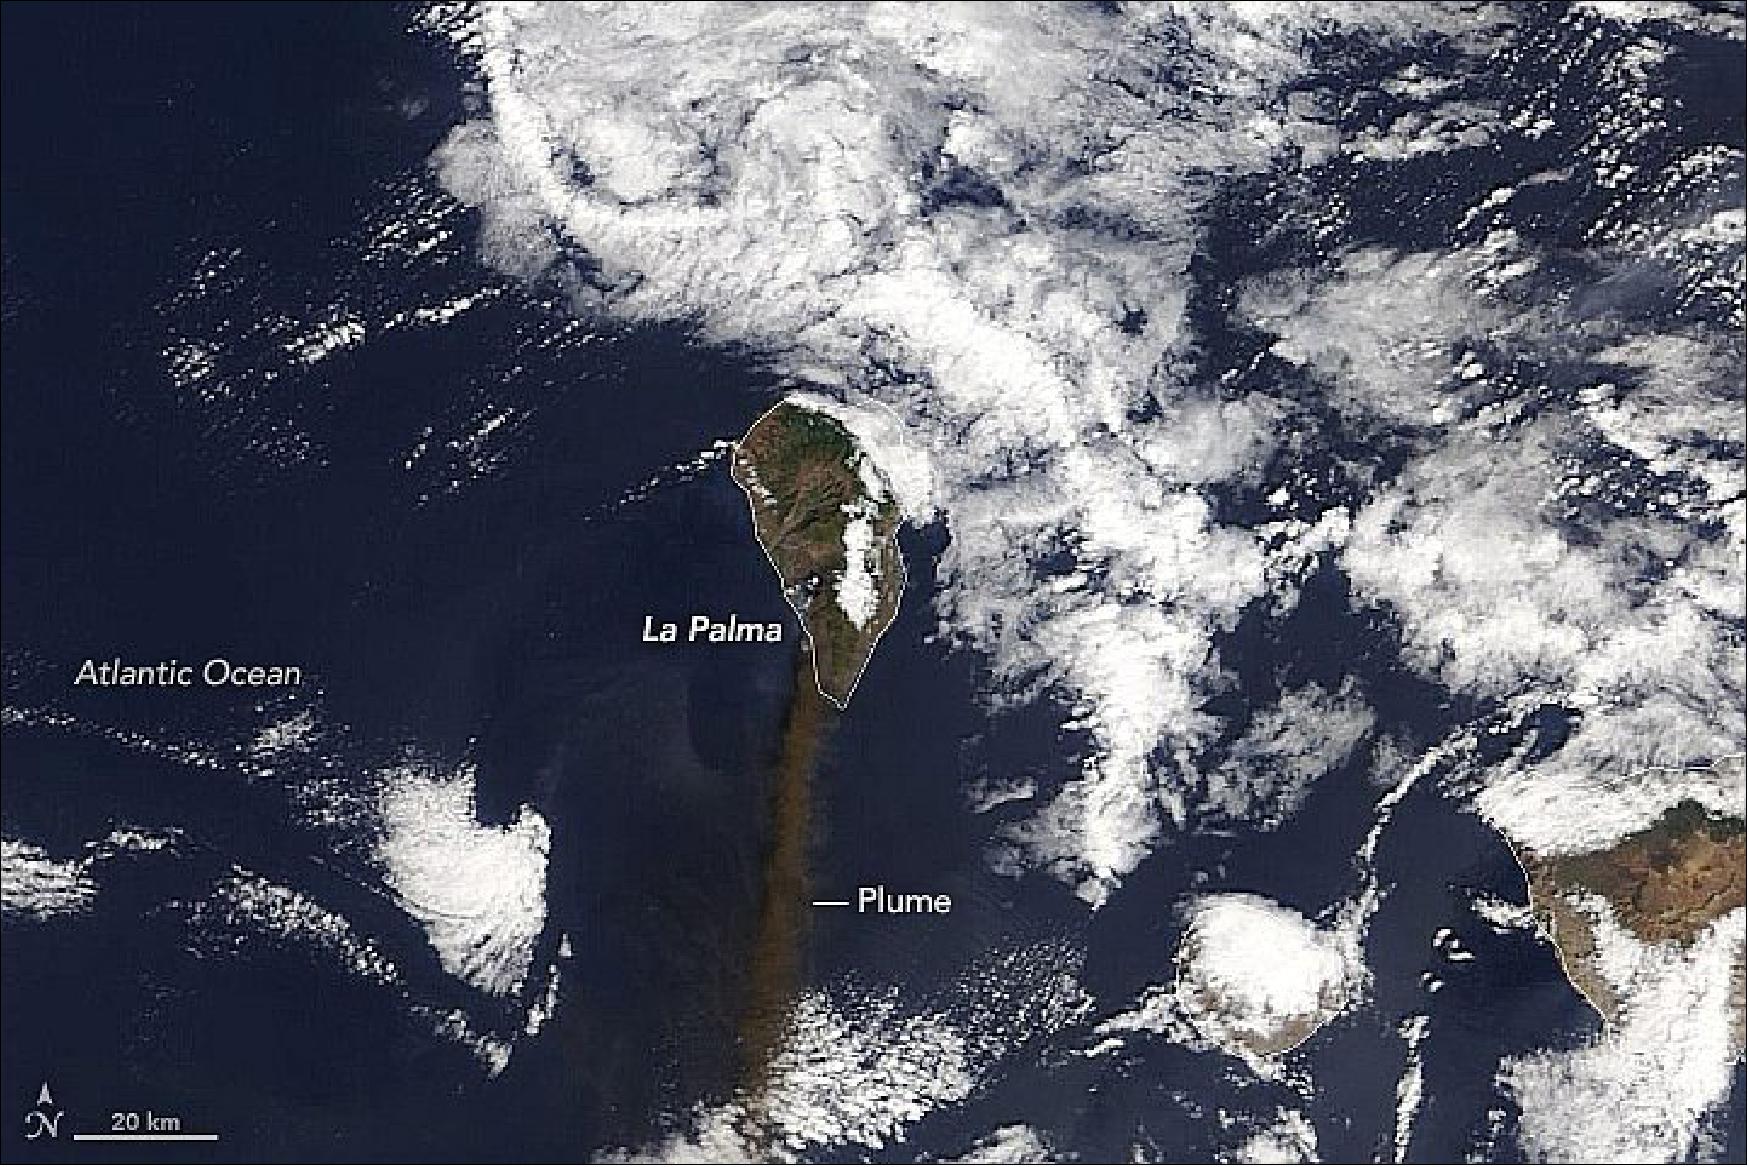
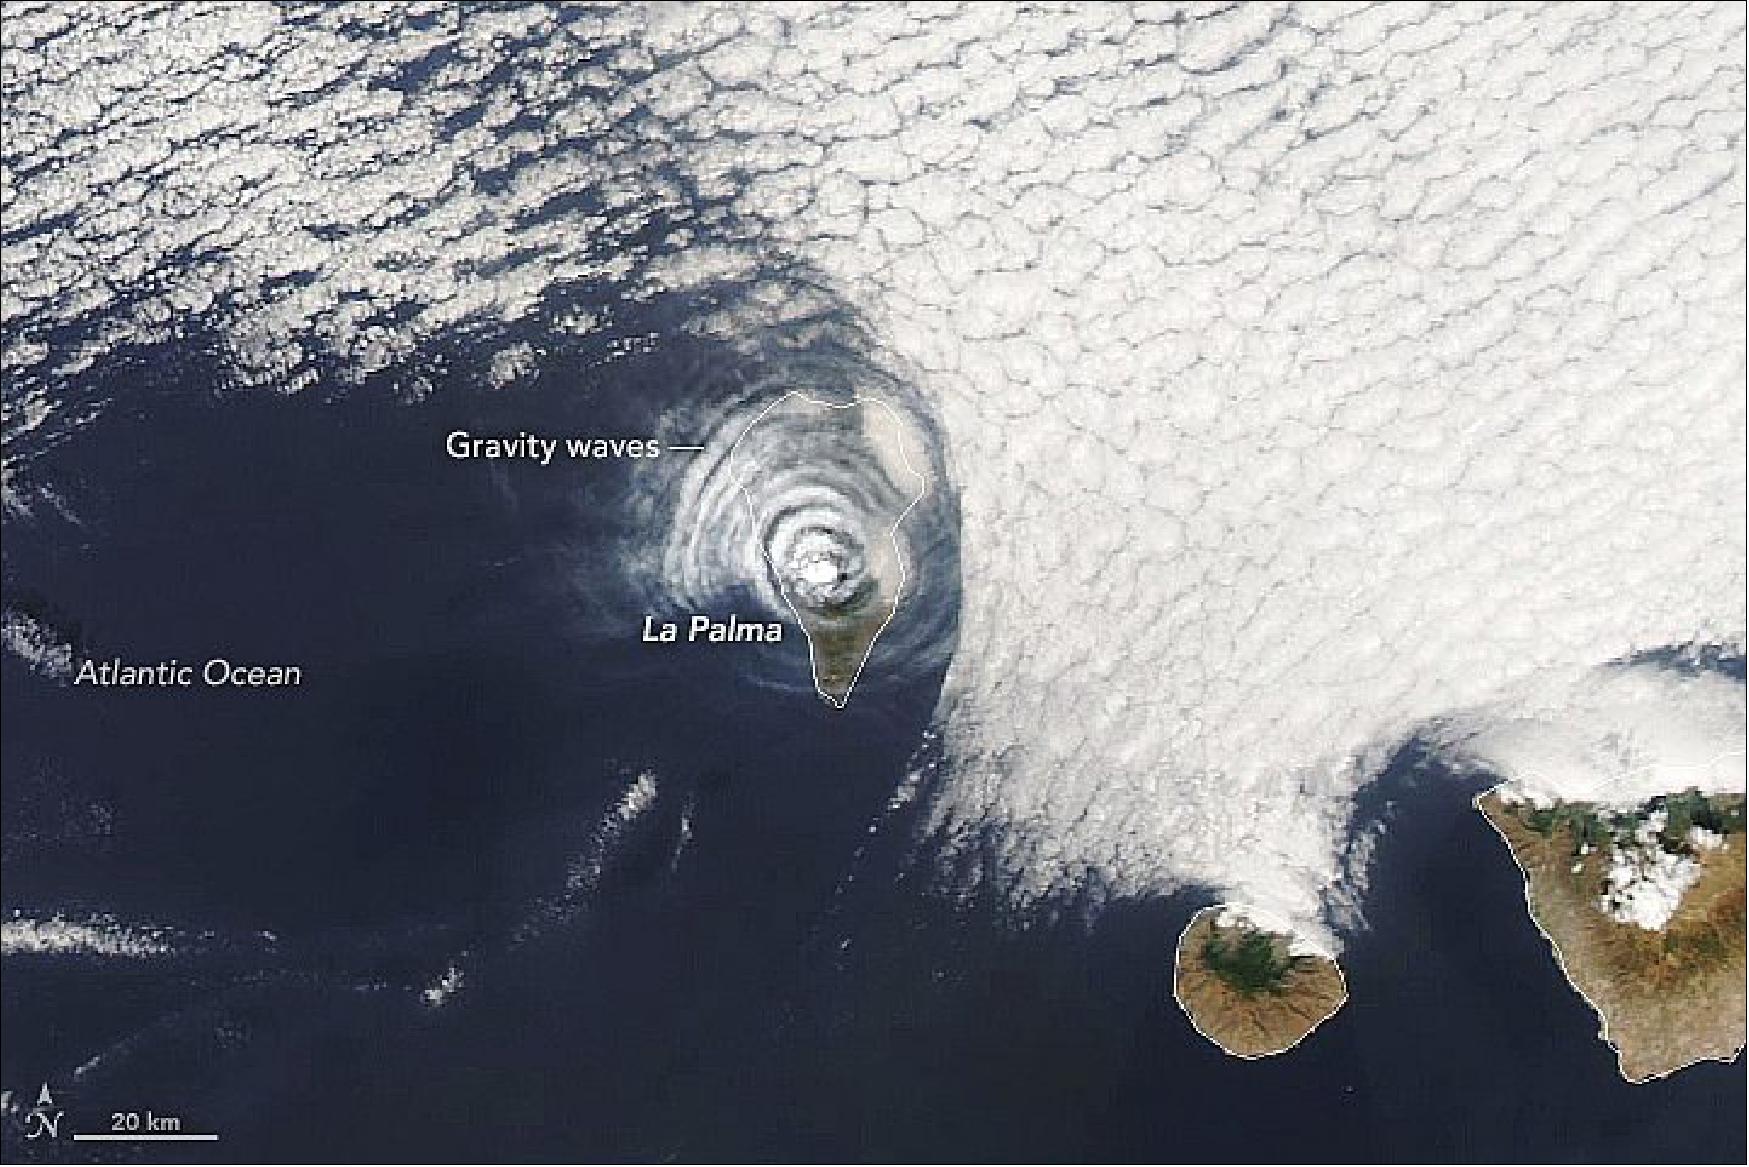
- The bullseye-shaped cloud was the product of a rising column of superheated ash and gases known as the eruption column. The buoyant column of water vapor and other gases rose rapidly upward until colliding with a drier, warmer layer of air at roughly 5.3 km (3.3 miles) altitude, according to INVOLCAN. The unusually warm air above—a temperature inversion—functioned like a lid, preventing the volcanic plume from rising any higher. Instead, it flattened out and spread horizontally.
- Since volcanic eruptions typically have natural ebbs and flows in their intensity, pulses in the upward flow of the volcanic column created concentric gravity waves as they hit the temperature inversion and spread outward. The process is similar to the way a stone dropped in a pond creates ripples that spread outward.
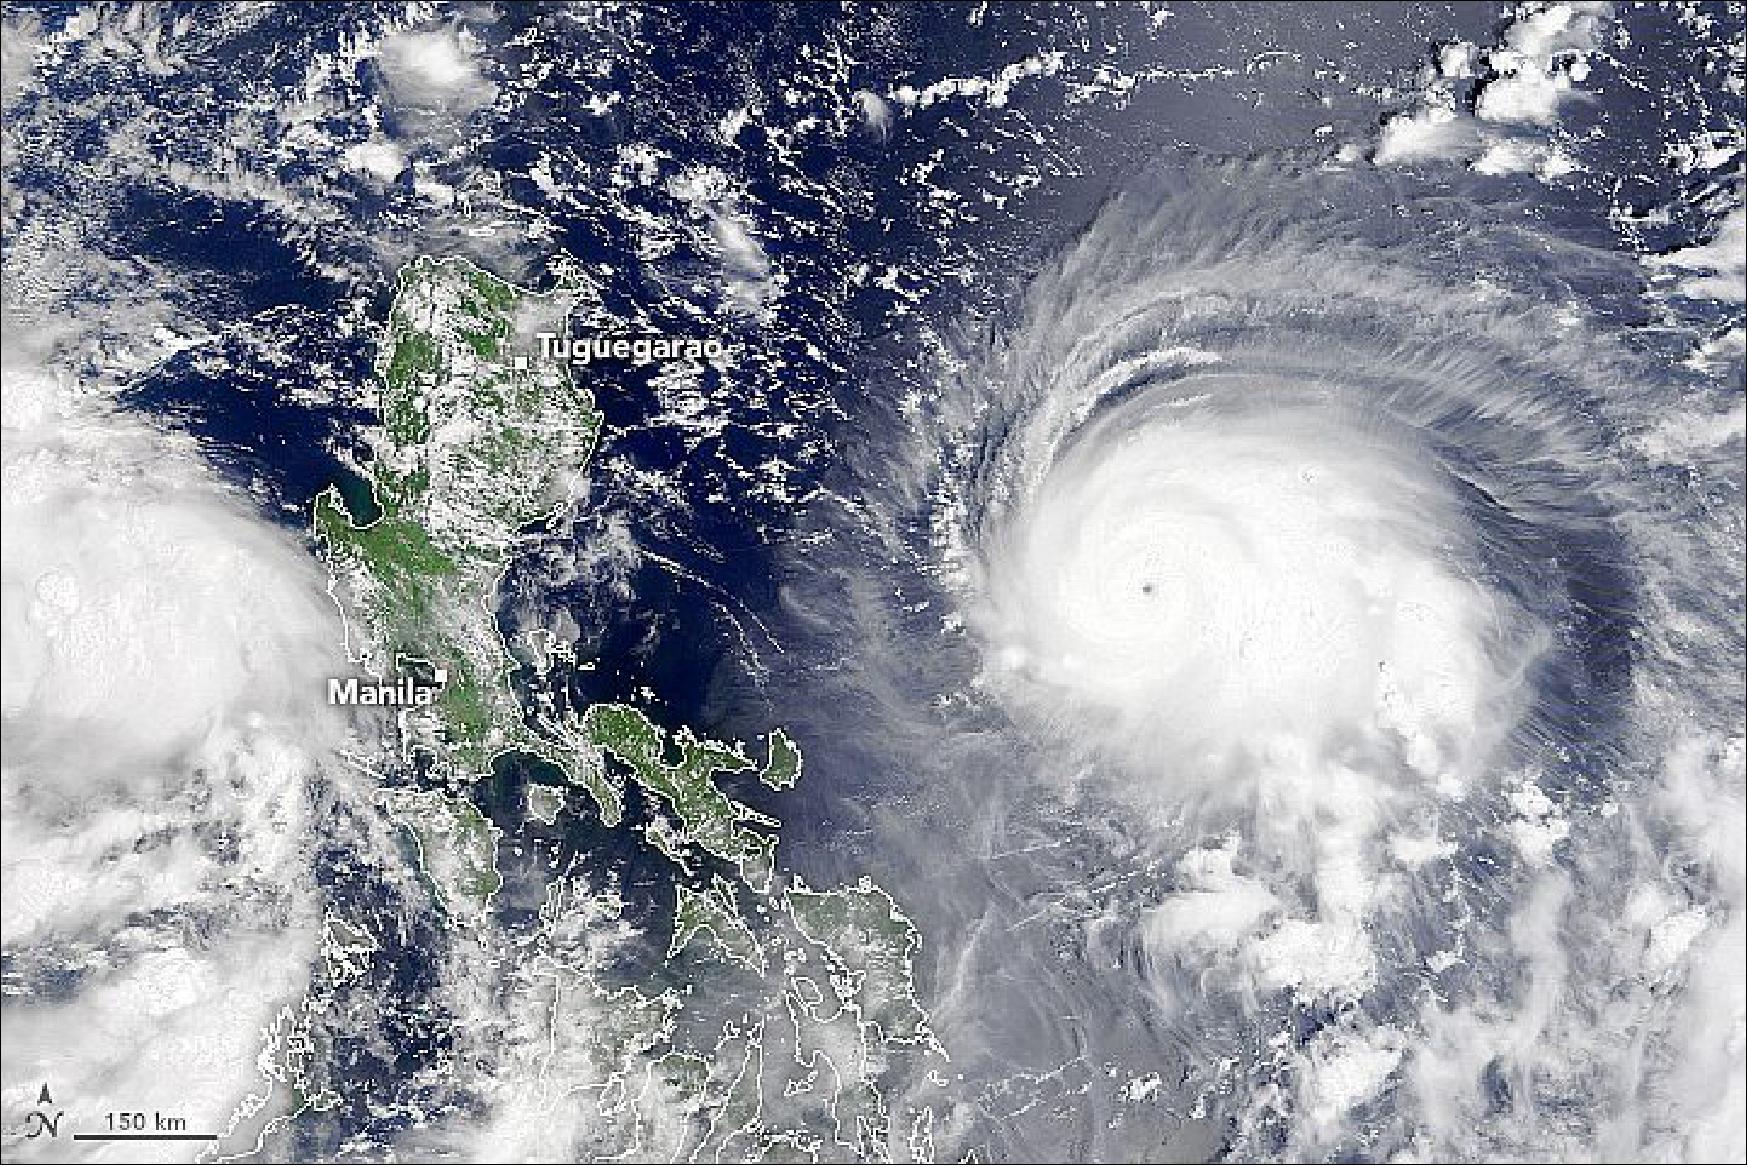
• September 10, 2021: In recent years, meteorologists and climate scientists have been awed by the rapid intensification of several tropical cyclones around the world—a phenomenon that is believed to become more likely in a warming world. This week, Super Typhoon Chanthu provided another stark example of how quickly a storm can strengthen. 10)
- Chanthu first became a tropical depression in the early afternoon on September 6, 2021. Within 48 hours, it had increased to super typhoon strength. Wind speeds accelerated from 50 kilometers (30 miles) per hour to 260 kilometers (160 miles) per hour. According to NOAA scientist Sam Lillo, only five storms on record have intensified at such a rate.
- In the late morning on September 9, 2021, the MODIS instrument on NASA's Terra satellite acquired this natural-color image of Chanthu as it churned the Philippine Sea. By 11 p.m. Philippine Standard Time (15:00 Universal Time) on September 9, the typhoon was about 550 km east-northeast of Manila, with sustained winds of 220 km/hr. Significant wave heights in the open ocean were approaching 14 meters.
- Chanthu is a relatively compact storm by the standards of most hurricanes and typhoons. Meteorologist Jeff Masters noted: "Chanthu is a very small storm, and small tropical cyclones are capable of very rapid intensity changes, both strengthening and weakening." According to NOAA scientists, Chanthu had a tiny "pinhole" eye for much of September 8.
- The typhoon, named Kiko in the Philippines, is predicted to pass just north of the island of Luzon as a category 4 storm. It is likely to arrive at Taiwan on September 11 or 12. The Philippines is still drying out from Typhoon Conson (Jolina), which moved through earlier this week.
- The U.S. National Hurricane Center defines "rapid intensification" as an increase of maximum sustained winds by at least 35 miles per hour within 24 hours. Some key ingredients for rapid intensification of tropical cyclones include high sea surface temperatures, excess ocean heat content (a measure of the water temperature below the surface), and low vertical wind shear. Warm waters go hand-in-hand with warm, humid air, and both provide vital energy and moisture for hurricanes. Vertical wind shear is the difference in the speed and direction of lower level and upper level winds. High shear rips the tops off of developing hurricanes and weakens them, while low shear allows storms to build.
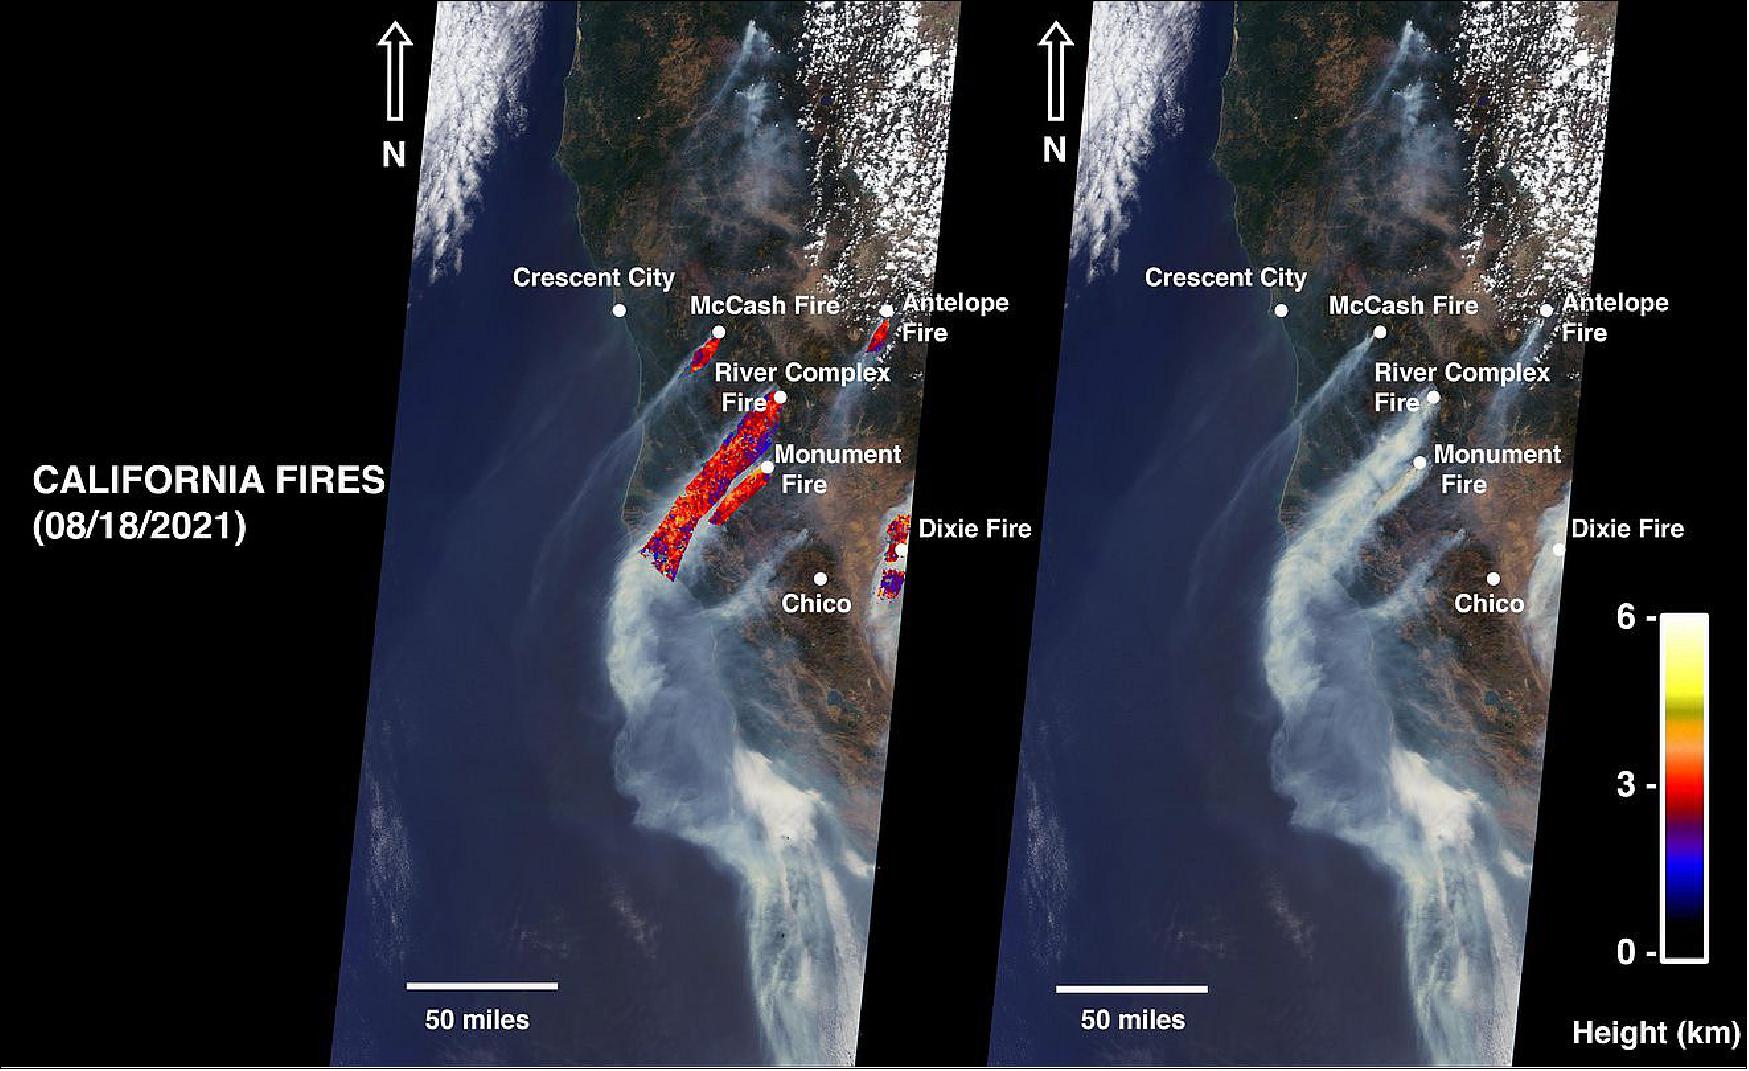
• As of August 24, 2021, wildfires in Northern California – including the McCash, Antelope, River Complex, Monument, and Dixie fires – have scorched more than 1 million acres of land. The Dixie Fire, the state's second largest in history, accounts for 731,310 acres. On Aug. 18, NASA's Multi-angle Imaging SpectroRadiometer (MISR) instrument, aboard the Terra satellite, acquired new data showing smoke from these fires. 11)
- The MISR instrument has nine cameras that view Earth at different angles. The right side of the image shows smoke from the five fires as observed by MISR's nadir (downward-pointing) camera. The multi-angular information from MISR's images is used to calculate the height of the smoke plumes. The results of those calculations are shown in the left side of the image. Smoke from areas in red reached an altitude of around 3,000 meters. The highest plume near the active fires reached approximately 6,000 meters. In general, higher-altitude plumes transport smoke greater distances from the source, impacting communities downwind. In recent weeks, smoke from fires in the Western U.S. and Canada has impacted much of the East Coast.
- The smoke plume height calculation was performed using the publicly available MISR INteractive eXplorer (MINX) software tool. The MISR Plume Height Project maintains a database of global smoke plume heights.
- MISR was built and is managed by NASA's Jet Propulsion Laboratory, Southern California, for NASA's Science Mission Directorate in Washington. The Terra spacecraft is managed by NASA's Goddard Space Flight Center in Greenbelt, Maryland. The MISR data were obtained from the NASA Langley Research Center Atmospheric Science Data Center in Hampton, Virginia. JPL is a division of Caltech in Pasadena.
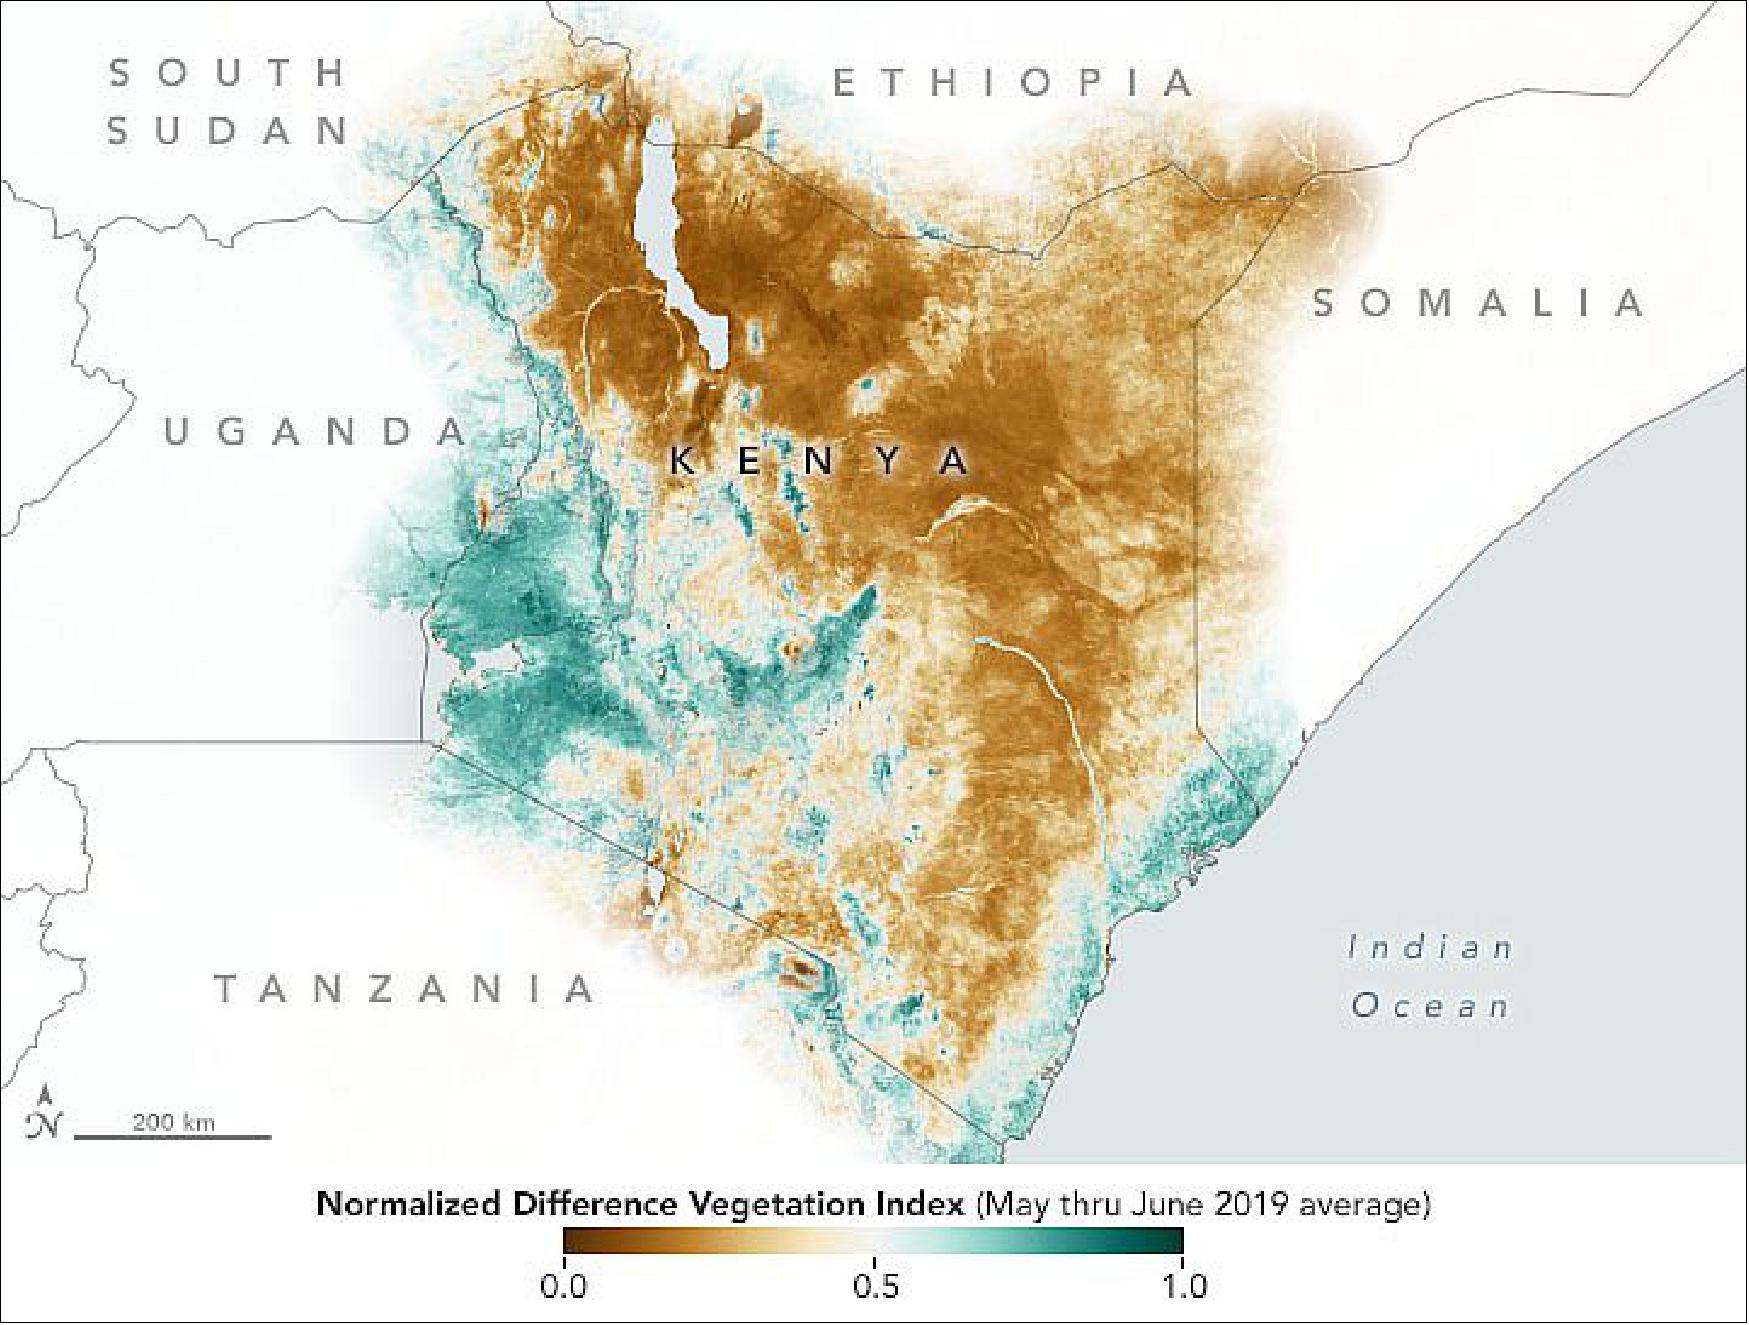
• August 2, 2021: The southern part of Madagascar, the island nation off the southeast coast of Africa, is facing its worst drought in 40 years. The lack of rainfall and other environmental factors have taken a toll on the region's vegetation and agricultural production, leaving many in the region facing severe hunger. 12)
- One way to detect healthy or stressed vegetation is with the Normalized Difference Vegetation Index (NDVI). The index, which uses data collected by the Moderate Resolution Imaging Spectroradiometer (MODIS) on NASA's Terra satellite, provides a measure of the health of vegetation based on how much red and near-infrared light it reflects. Healthy vegetation with lots of chlorophyll reflects more near-infrared light and less visible light.
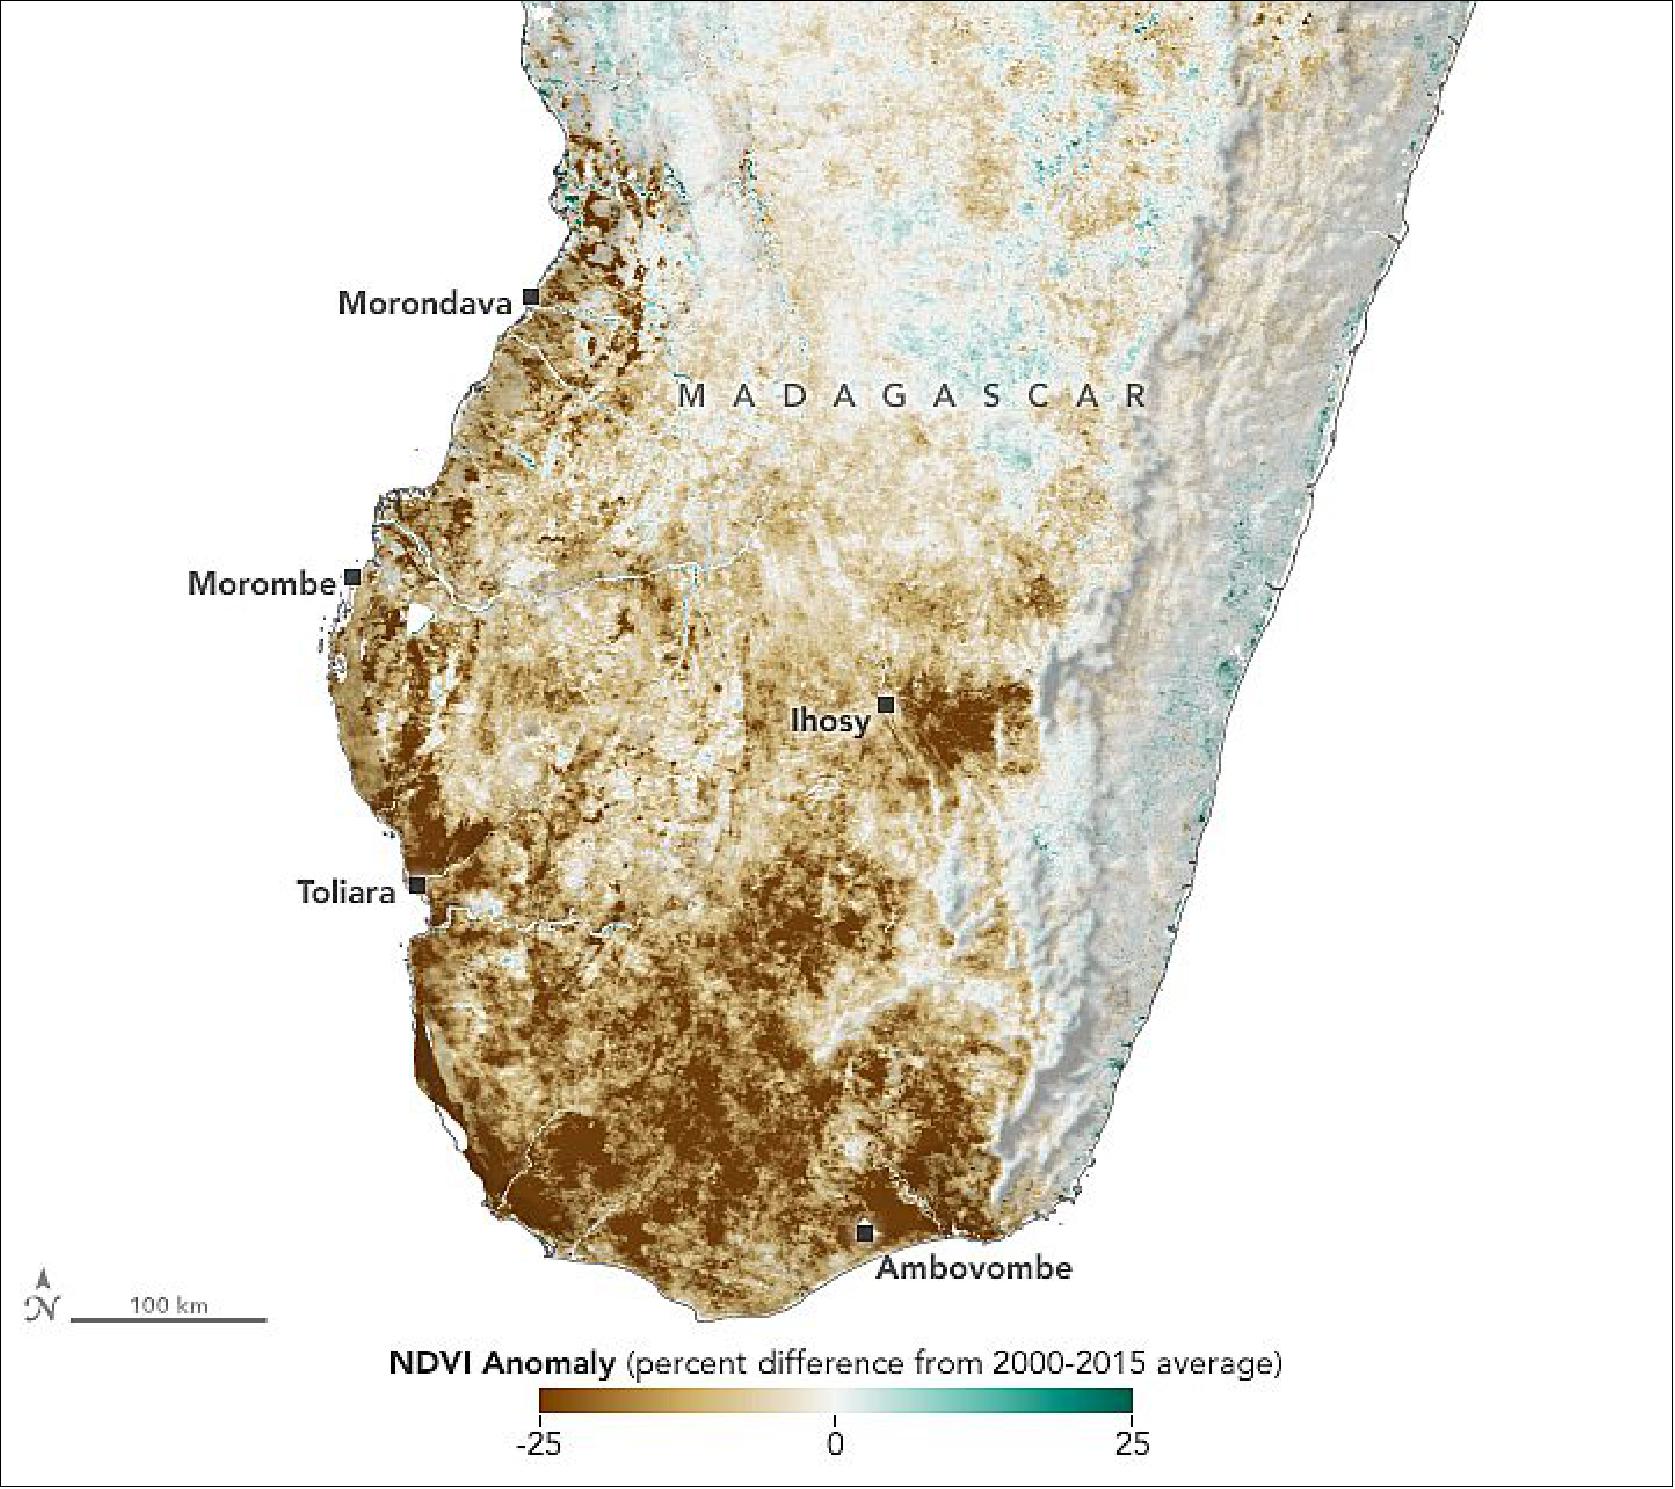
- Southern Madagascar is now in its fourth consecutive year of drought, which has "wiped out harvests and cut off access to food," according to a United Nations news article. In a typical year, the rainy season lasts from November through March. But recent years have brought below-average rainfall during this period, drying up water used for the irrigation of agriculture. Over the past five years, southern Madagascar has had only one good harvest.
- The persistent drought and devastation to farms has left more than a million people in southern Madagascar lacking reliable access to food. The Famine Early Warning Systems Network (FEWS NET) reported that much of the region is currently at crisis level for food insecurity (the third level on a five-level scale). Forecasters expect below-average rainfall from October through the end of 2021, which could elevate some areas, particularly around Ambovombe and Ampanihy, to emergency-level food insecurity (just below famine).
- A phenomenon known locally as "tiomena" (red wind) is exacerbating the situation. Migrating sand dunes and windblown sand can blanket farmland, crops, forests, and infrastructure. According to the United Nations, a series of strong dust storms this year left some crops buried under sand.
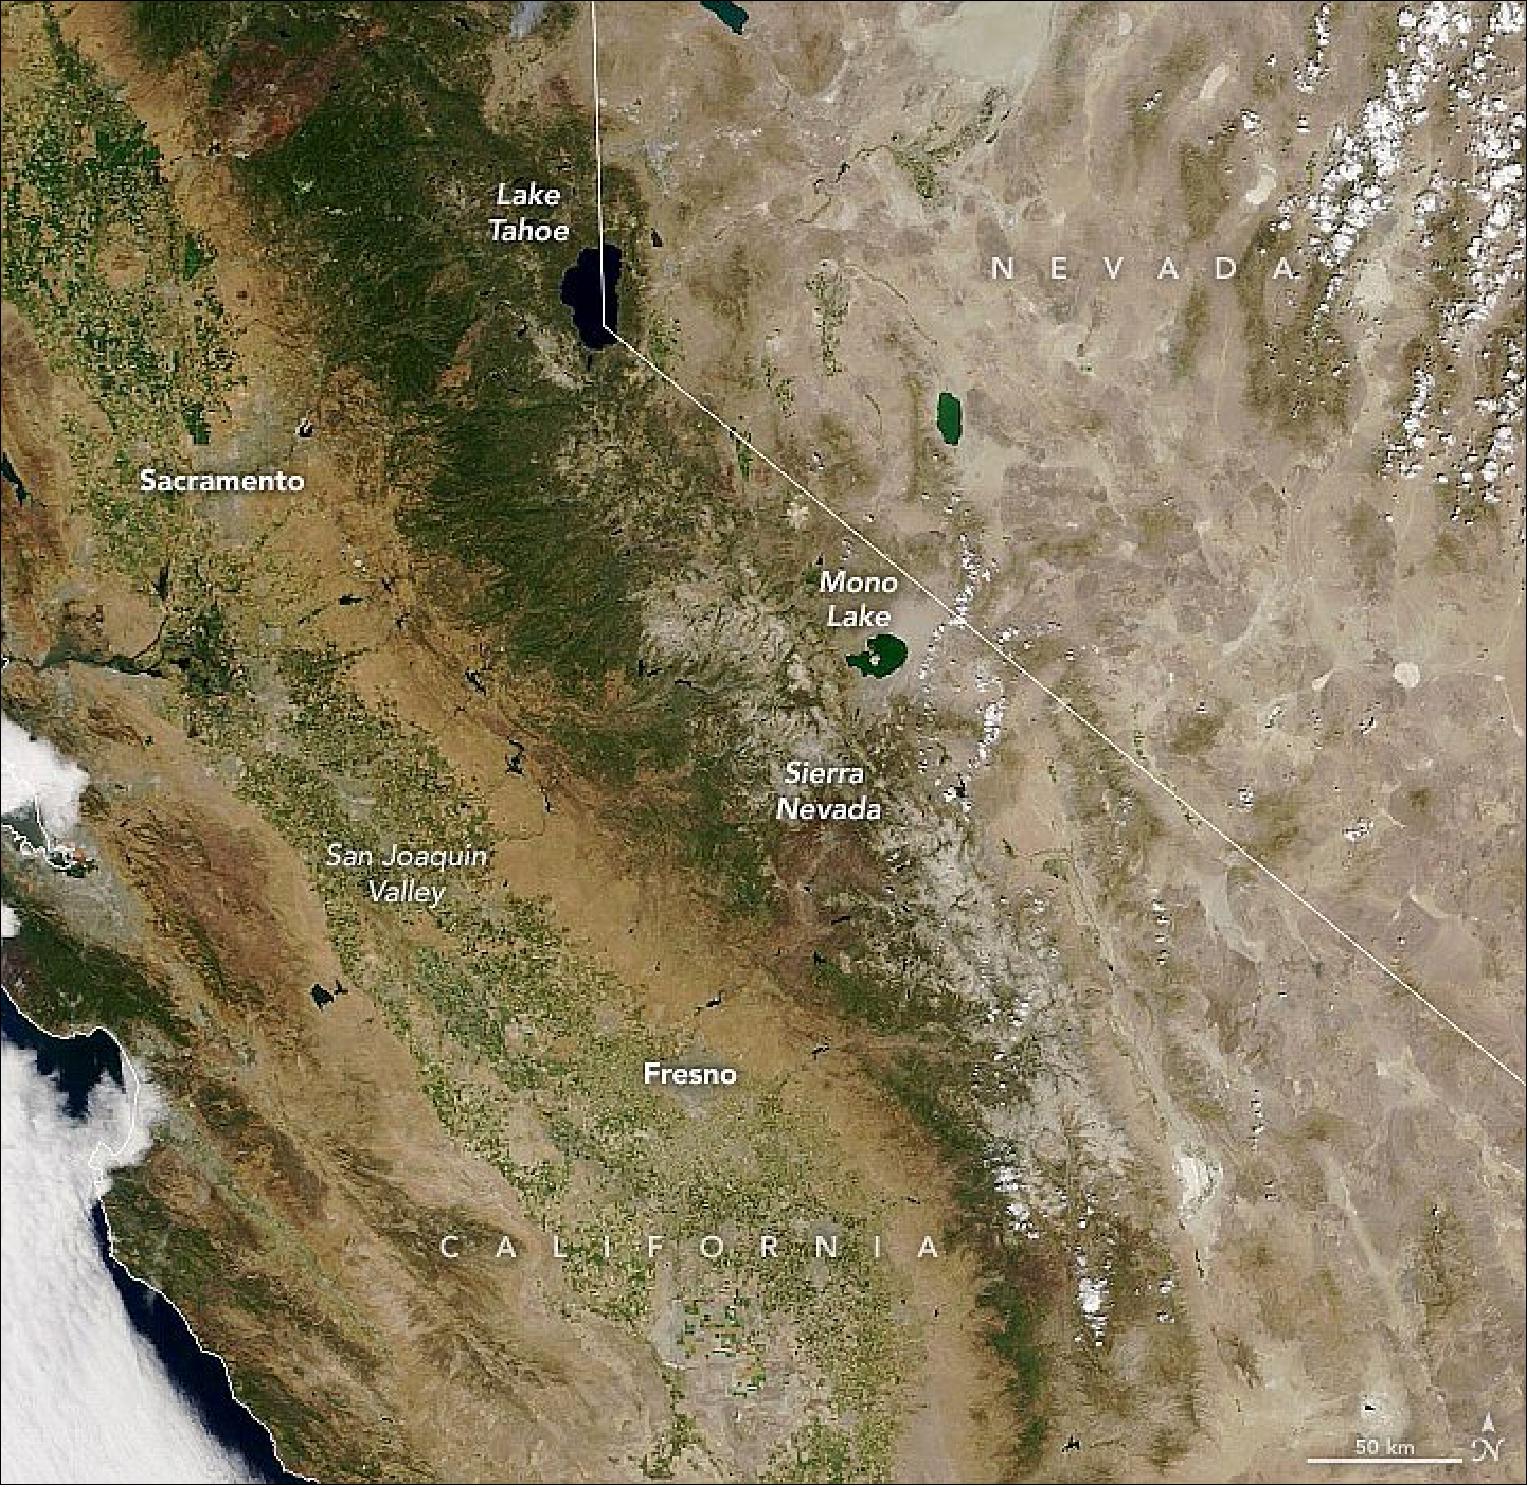
• July 15, 2021: Mountain snow is like a bank account for water across the western United States. Snow that falls on the Sierra Nevada, the Rocky Mountains, and other ranges becomes a natural reservoir that slowly melts each spring and summer and flows down into the river valleys. The resource managers of western states count on this allowance from nature to fill reservoirs with sufficient water for the typically dry months of summer and autumn. In 2021, those meltwater accounts have been turning up "insufficient funds." 13)
- According to the California Department of Water Resources (CalWater), about three-quarters of the state's precipitation in a year falls as snow and rain in Northern and Central California. In a typical year, Sierra Nevada snowpack accounts for about 30 percent of California's water supply. Yet for the second year in a row, winter snowfall in the Sierra Nevada was below average. In fact, CalWater reported on April 1, 2021, that the mountains had received just 59% of their average yearly snow water; rainfall at lower elevations was also below 50% of normal.
- The rough start to the snowmelt season quickly grew worse. Persistent sunshine and very warm spring air temperatures caused much of the snow to melt away quickly. By May 11, 2021, snow cover in the northern Sierra region was 7 percent of normal; the central region was at 8 percent; and the southern region had just 5 percent. By the beginning of June, snow cover in the northern region was essentially zero.
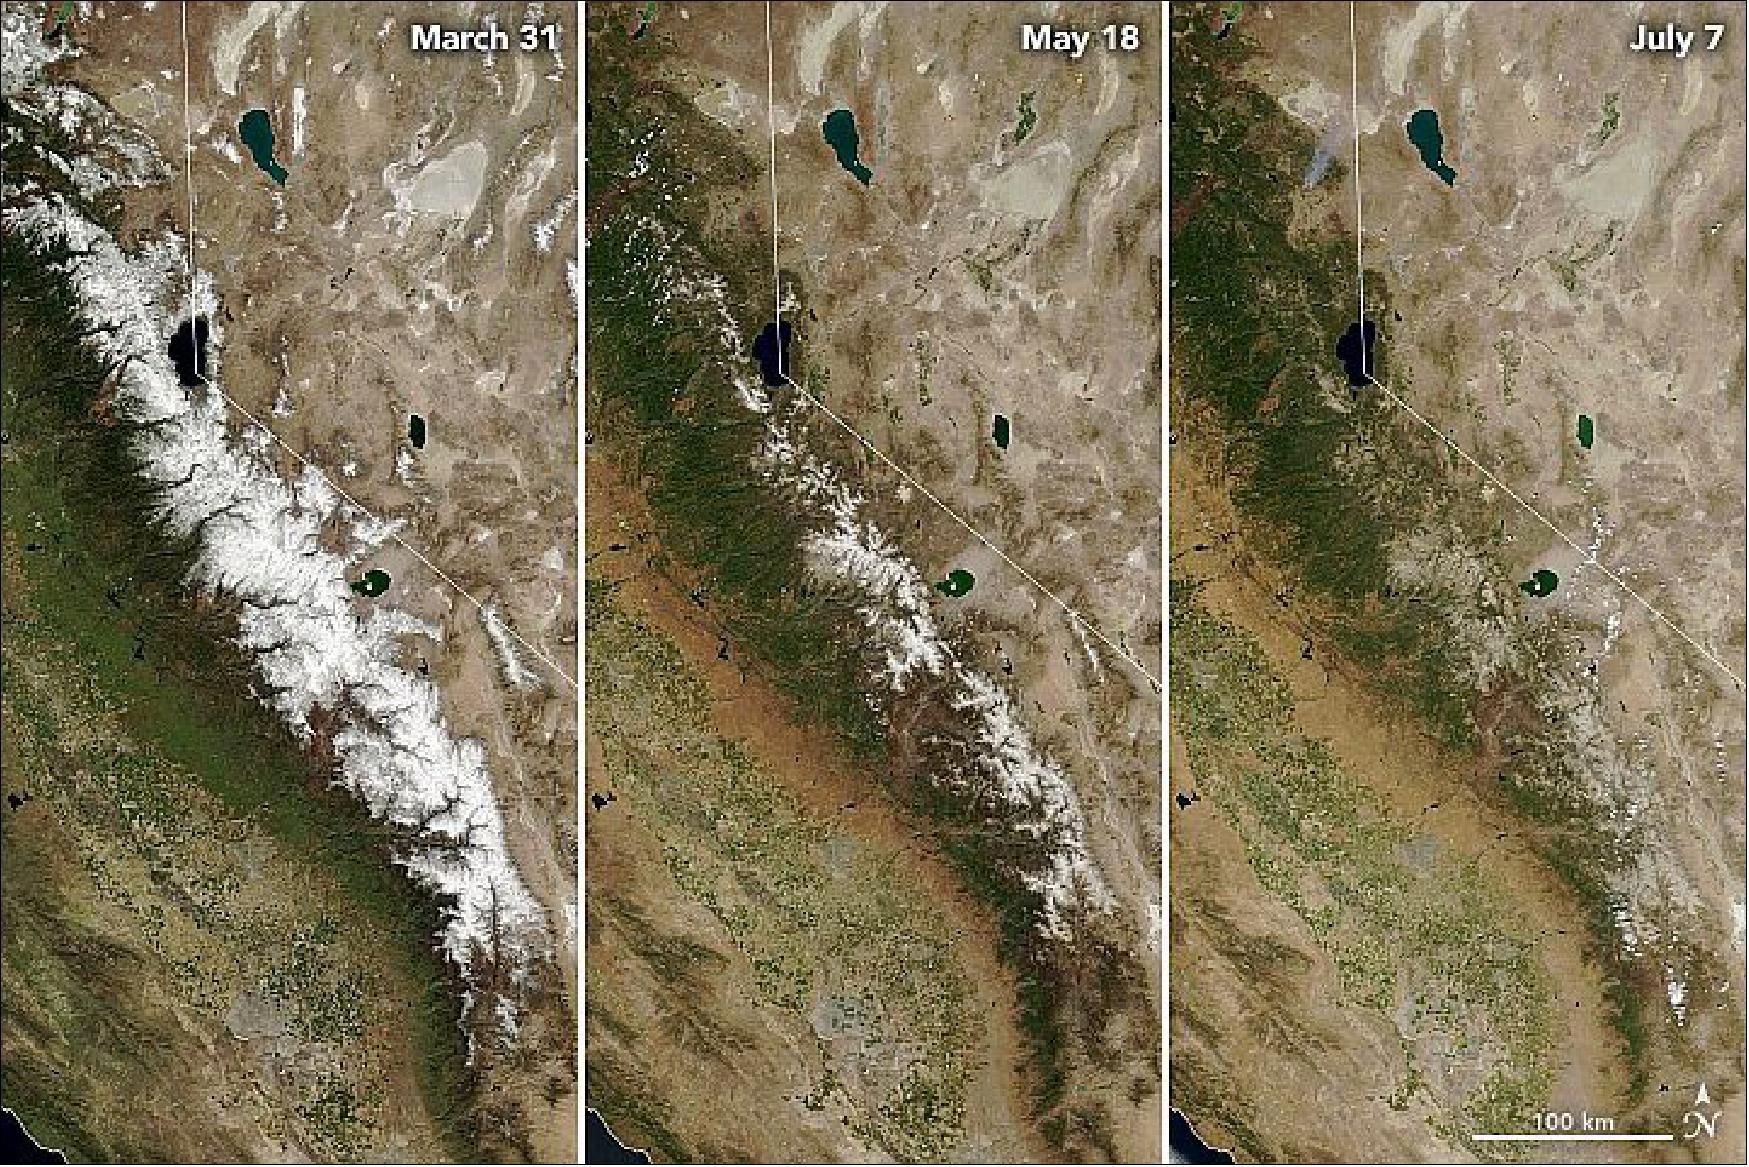
- According to state and federal scientists, melting in 2021 in the Sierra Nevada occurred three to four weeks earlier than usual. And that snowmelt did not go far. Parched by two years of drought, the soils between the mountains and the valleys soaked up vast quantities of water. According to hydrologists' estimates, 685,000 acre-feet of expected water runoff never reached reservoirs in the Northern Sierra watershed. That loss is about 40 percent more water than the city of Los Angeles uses in a year.
- In a July 8 report, climatologists with the U.S. National Integrated Drought Information System noted that much of California and Nevada are missing 0.5 to 1 years' worth of precipitation since October 2019, and California is missing more than 1.5 years' worth of streamflow. Many reservoirs in California are the lowest they have been since the 2012–15 drought. State and federal managers have banked and conserved enough water from recent years that there is no immediate concern about water shortages in California, but another snow drought this winter could pose problems.
• July 13, 2021: Canaima National Park has inspired many books and movies. After he created the Sherlock Holmes character, Sir Arthur Conan Doyle wrote The Lost World, describing an adventurous ascent of a plateau in the Amazon Basin similar to those found in Canaima. In the movie Up, the main character travels by balloon to fulfill a longtime dream to live in a park that bears a striking resemblance to Canaima. Although fictional, both stories captured the authentic allure of this region. 14)
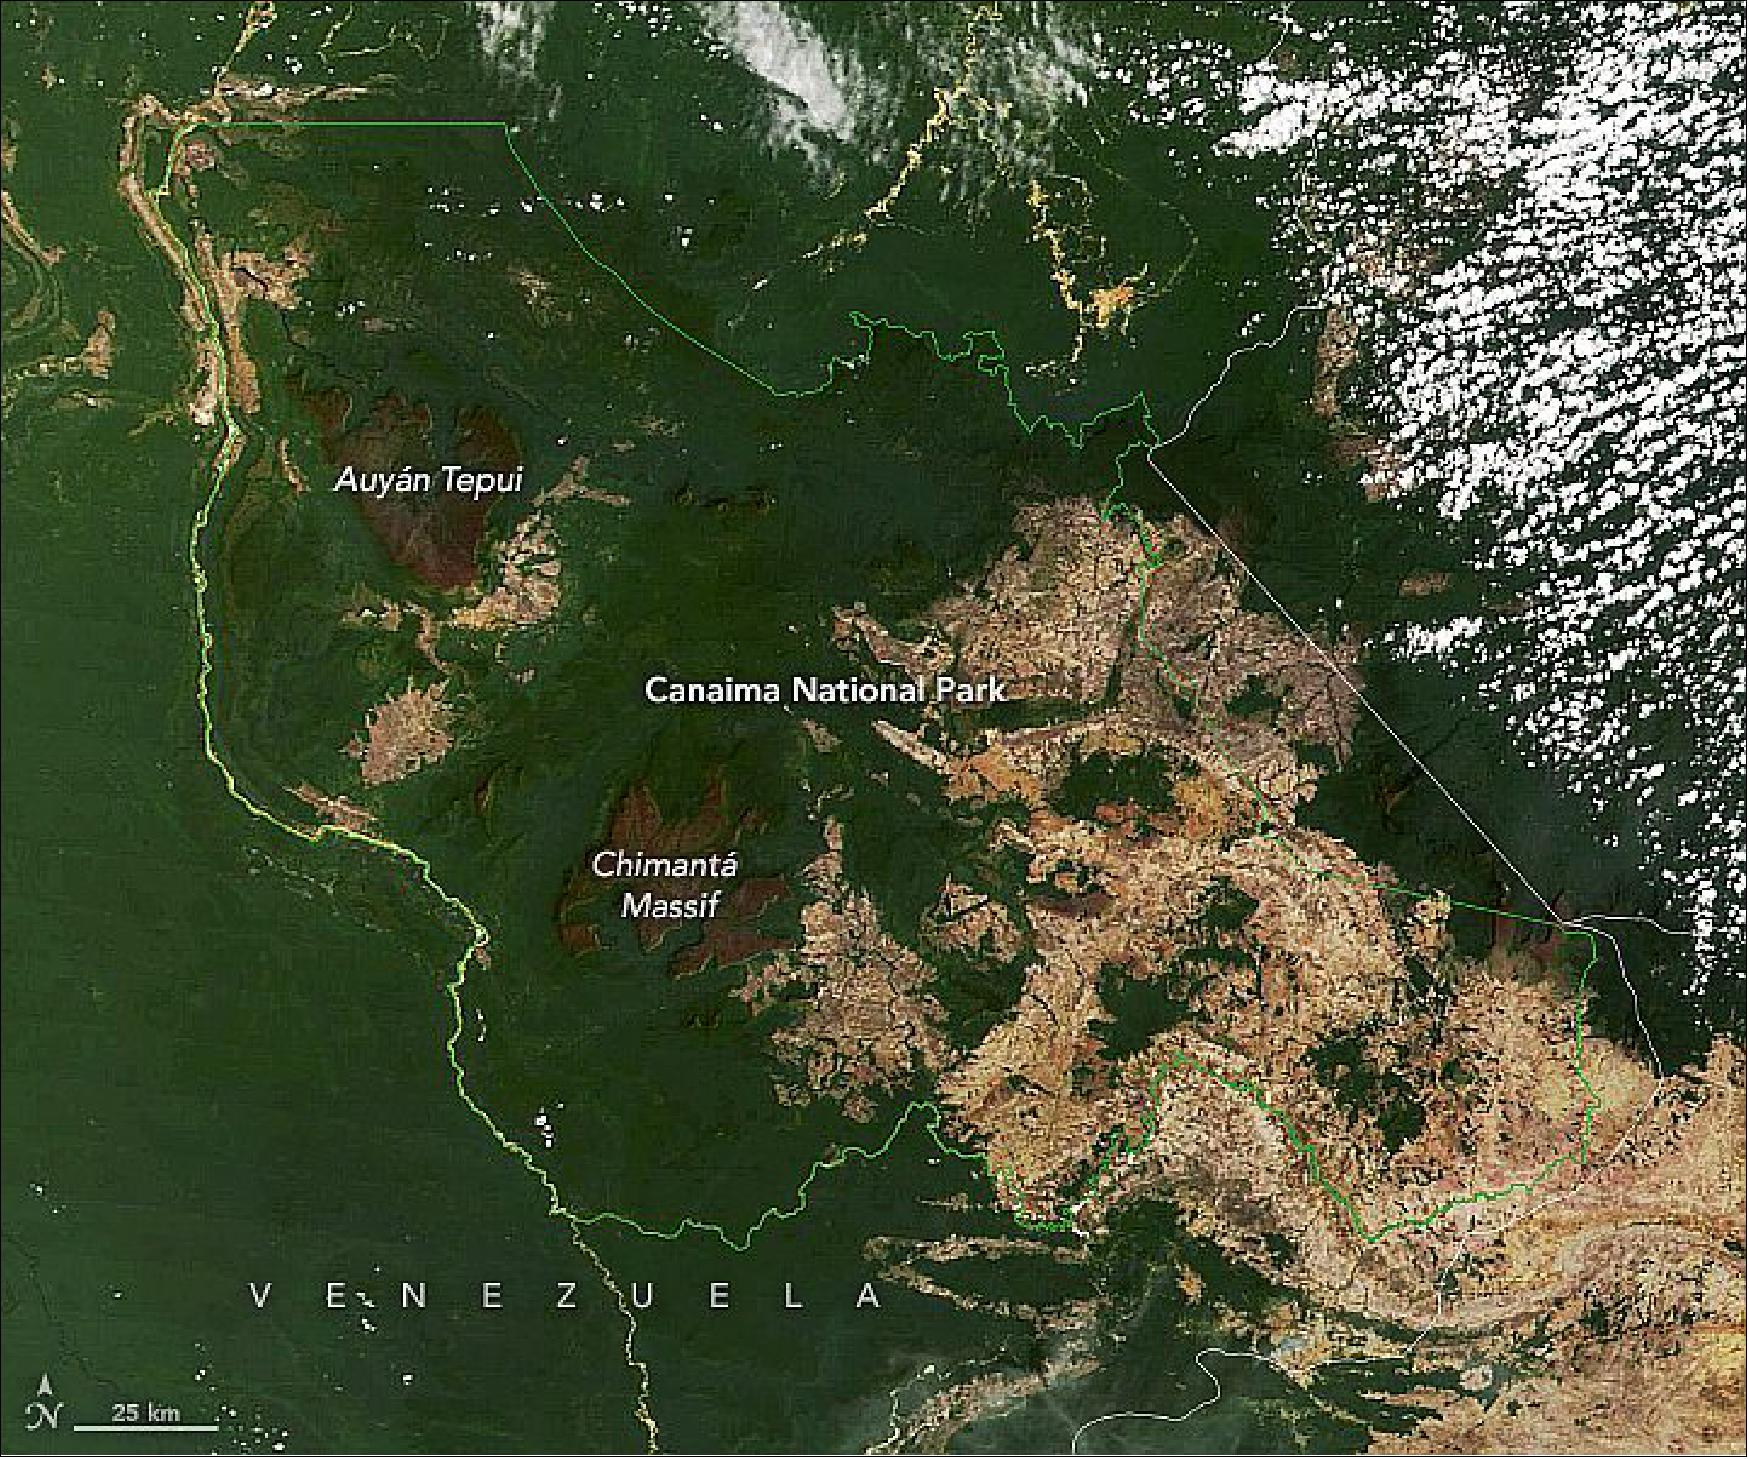
- The majority of the park is covered by steep, flat-topped mountains known as tepuis—meaning "house of the gods" in the language of the native Pemón. More than 100 tepuis, which can range 1,000 to 3,000 meters (3,000 to 10,000 feet) in height, are located in the park.
- Tepuis are some of the oldest geologic formations in South America. The table-top mountains are remnants of a once-continuous sandstone plateau that covered a 1.7-billion-year-old granite basement rock. Layers of sand were compressed and cemented together to form sandstone and quarzitic rocks thousands of meters thick. Following tectonic uplift about 180 million years ago, the sandstone plateau was broken apart by erosion into isolated mountaintops.
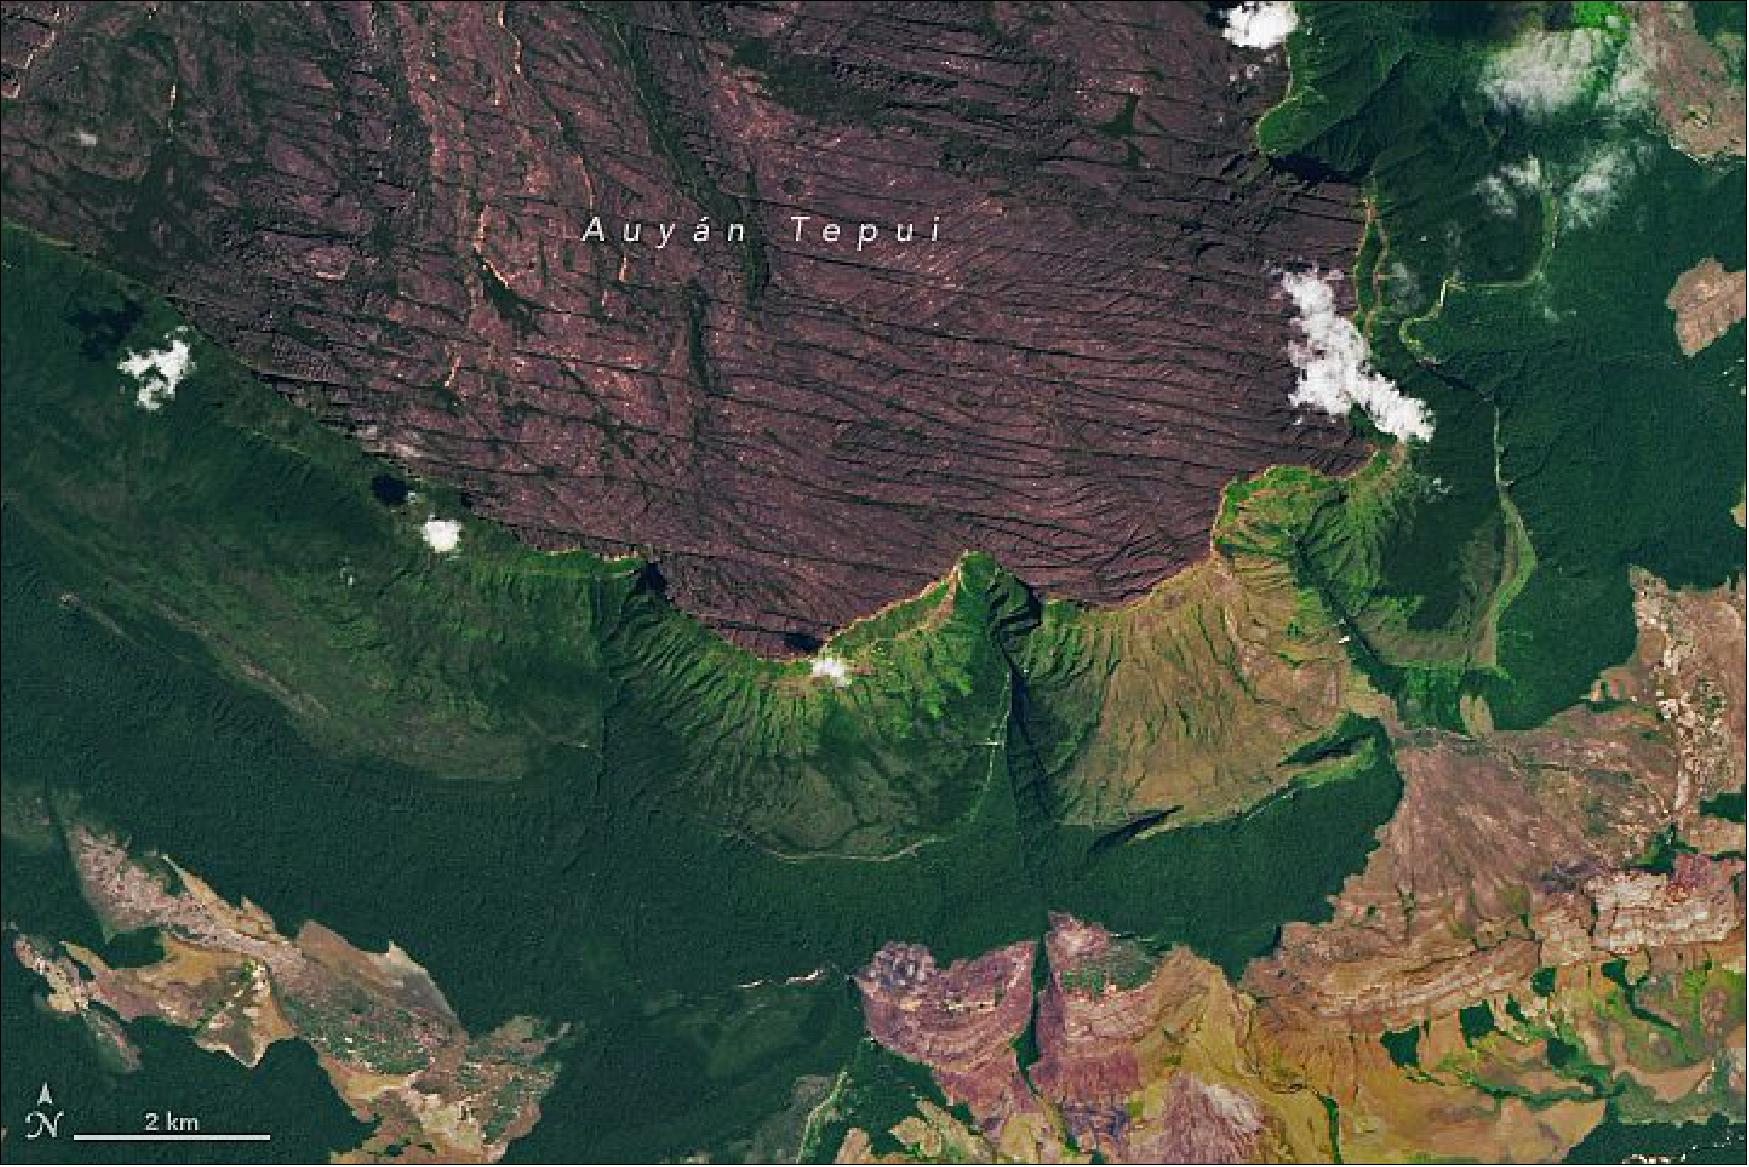
- Because tepuis stand high above the forest, they are home to some animal and plant species found nowhere else on Earth. About one-third of the vegetation found on the mountains is endemic. The tepuis host mammals on their lower slopes, including monkeys, jaguars, pumas, and sloths, and several bat species. Reptiles, such as snakes, iguanas, and lizards, are found on the summits and slopes.
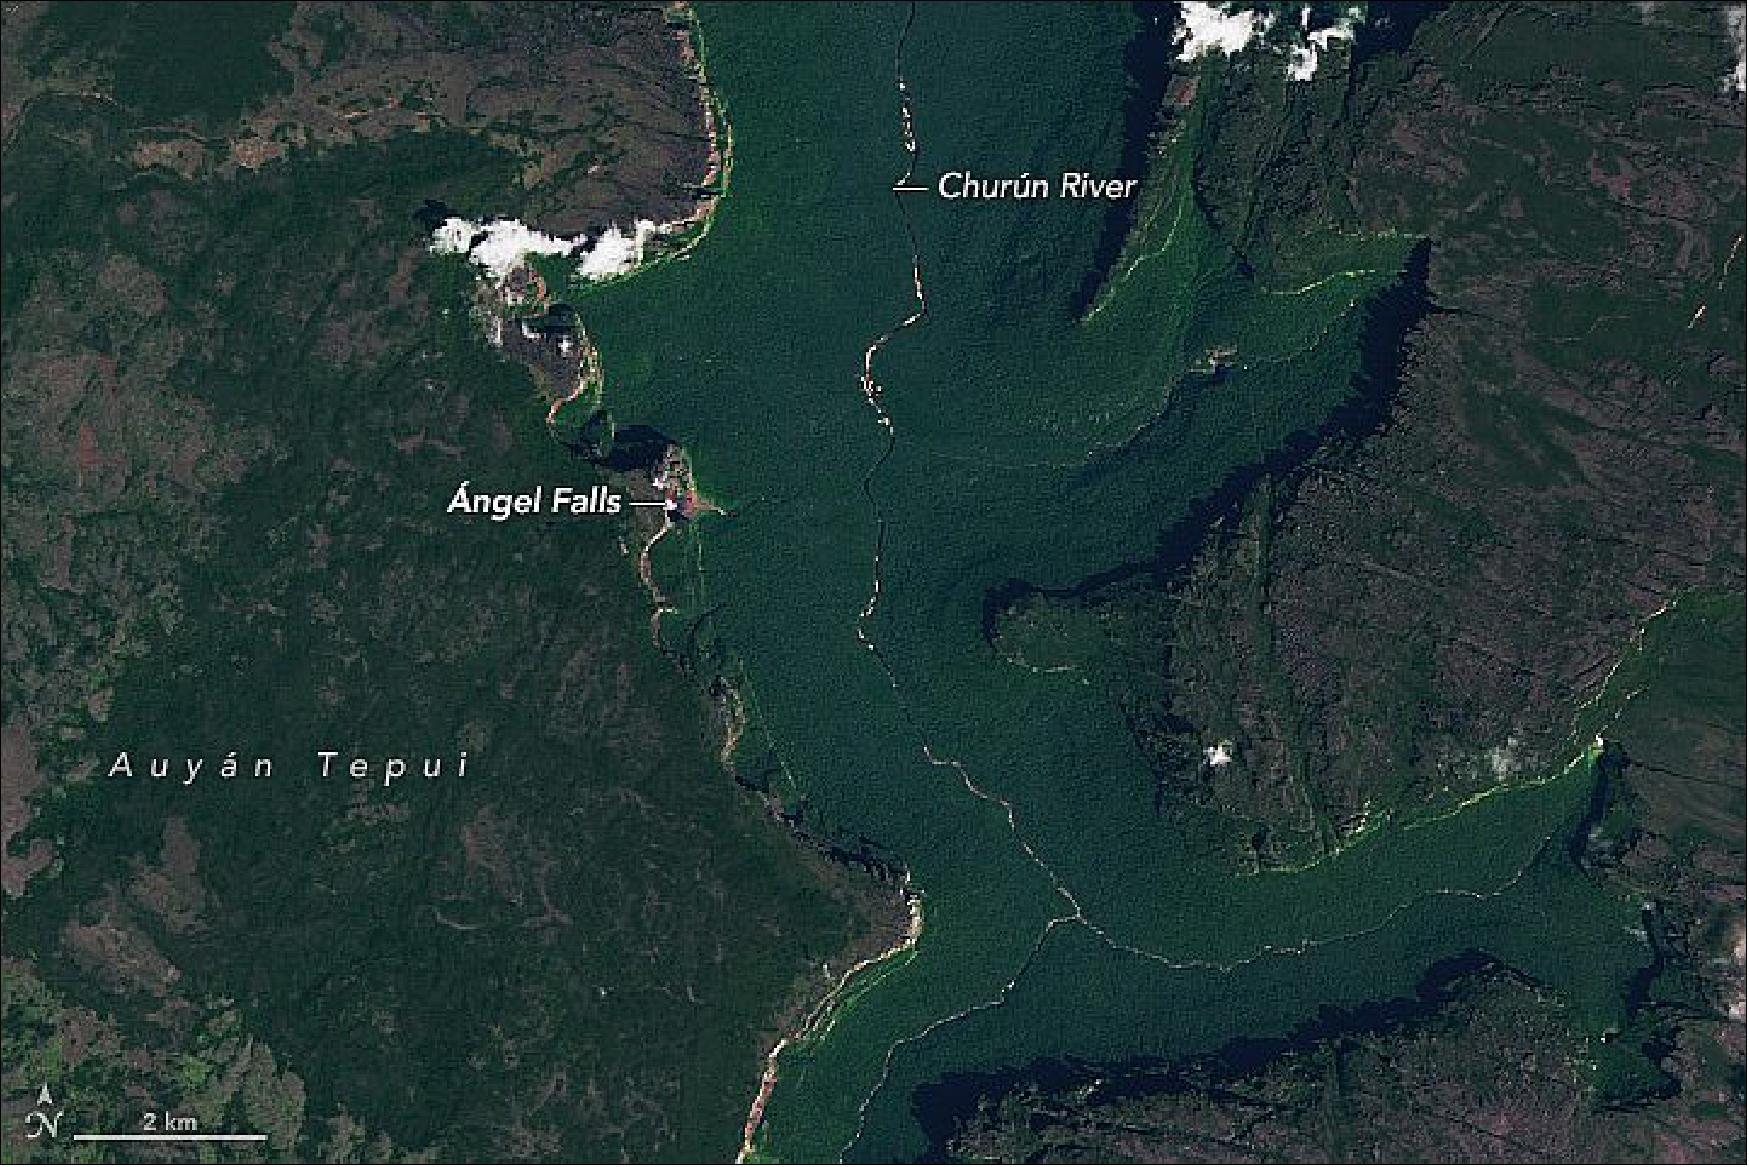
- Like many tepuis, Auyán contains extensive cave systems. In 2013, researchers discovered one of the longest quartzite cave systems in the world here. The Imawarì Yeuta caves contain three entrances, three rivers, and at least 22 kilometers (14 miles) of tunnels. Because they run through quartz sandstone, tepui caves are less susceptible to water erosion. They also form slowly—perhaps over tens of millions of years. Researchers have discovered new minerals and new species of bacteria and blind fish in other tepui caves across the region.
• July 10, 2021: The extraordinary heatwave that scorched the Pacific Northwest in June 2021 has diminished, but substantial fires continued to burn across the region in July. 15)
- Exacerbated by extreme heat and wind, more than 40 fires started burning across British Columbia in late June. By July 8, that number climbed to more than 200 active fires across the Canadian province, of which 15 were considered "wildfires of note" (especially large fires, or fires that threaten public safety). In the United States, nearly 20 large fires were burning in Washington, Idaho, and Oregon.
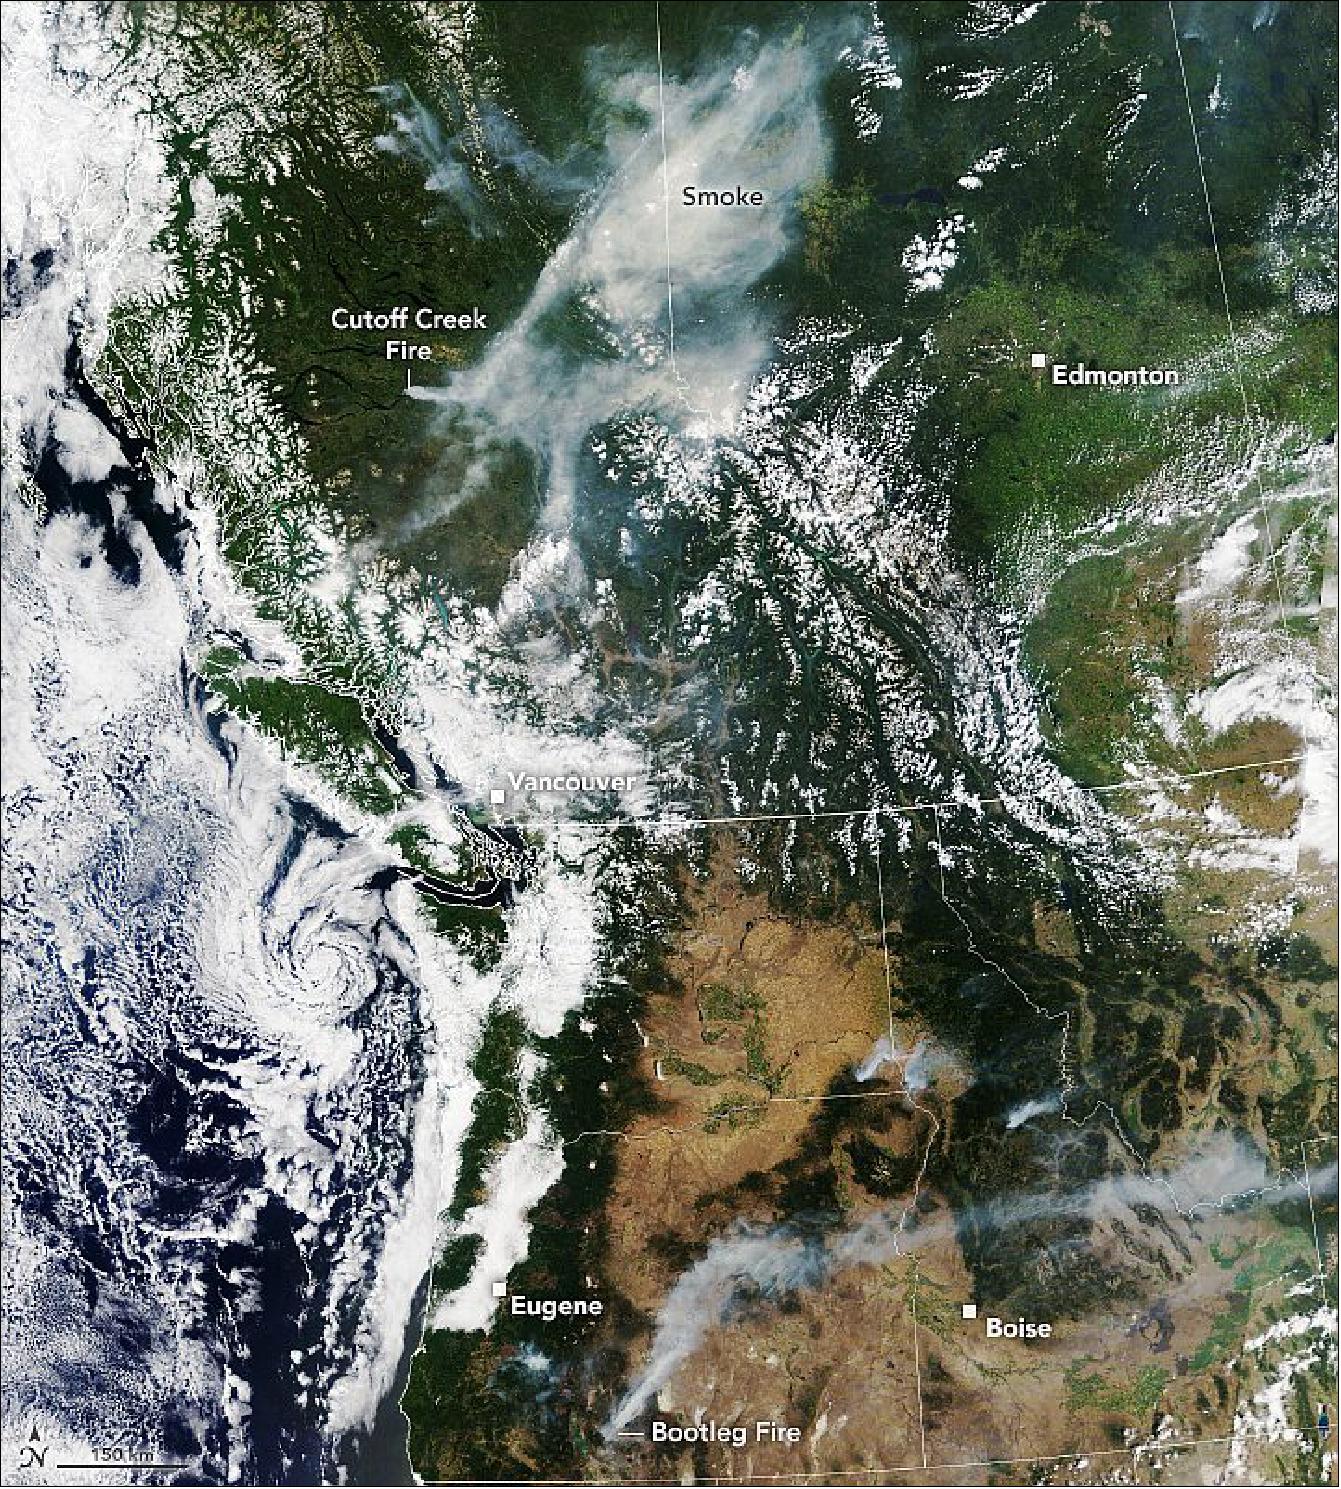
- In British Columbia, the Cutoff Creek fire has burned more than 60 km2 (20 square miles) since its discovery on July 2. Much of the smoke is aloft, but it is also affecting ground-level air quality in the communities of central British Columbia. In Prince George, the air quality health risk was "high," meaning the general population should reduce or reschedule strenuous activities outdoors.
- In Oregon, the Bootleg fire has burned almost 160 km2 (60 square miles) since July 6. Again, much of the smoke is aloft and dispersing toward the northeast and east. But at night the smoke is settling into basins and valleys in south-central Oregon. On July 8, the Oregon Department of Environmental Quality issued an air quality advisory for Klamath and Lake counties.
- Looking ahead, fire potential remains high in many parts of the northwest, as higher-than-normal temperatures and lower-than-usual rainfall are forecasted for July. The grim outlook, however, is not limited to the northwest. A heatwave building in Southern California, as well as very dry conditions, have elevated the fire danger in a state that already has six large active fires.
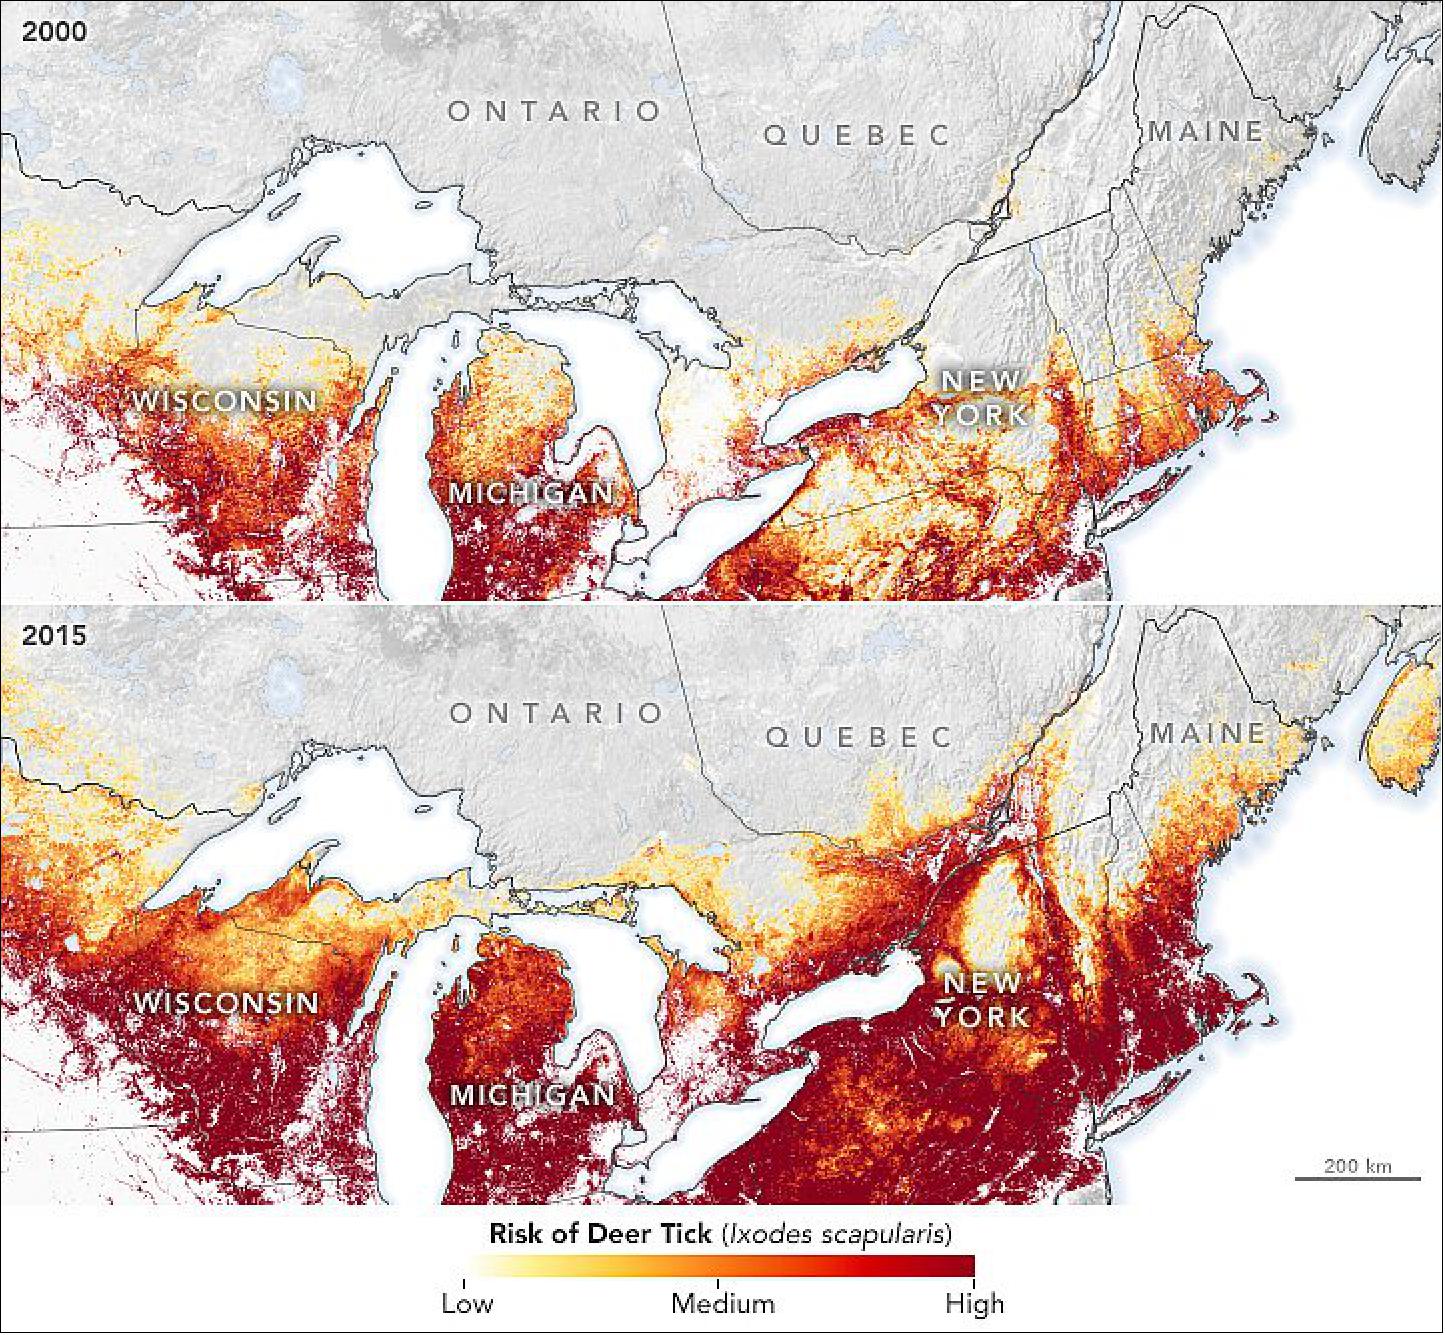
• June 25, 2021: Lyme disease is one of the most common vector-borne diseases in North America, affecting thousands of people per year. The species of deer ticks (Ixodes scapularis) that carry Lyme-causing bacteria are found in warm, forested areas in the Northern Hemisphere. As global climate warms, deer ticks are migrating north, which means more people are at risk of contracting the disease. 16)
- Serge Olivier Kotchi of the Public Health Agency of Canada has been studying how climate change affects the incidence of vector-borne diseases in Canada, including Lyme and West Nile Virus. The medical geographer and his colleagues recently published a study in Remote Sensing which showed that the risk of Lyme disease is expanding north in Canada as temperatures change. In particular, they found that between 2000 and 2015, Lyme risk doubled in the province of Quebec and tripled in Manitoba. 17)
- Previous field research in Canada used a technique called "drag sampling" to determine the presence of deer ticks. Researchers drag a square-meter sized cloth through the woods and count the number of ticks that fall on it. The sampling technique also involves capturing rodents in live traps and examining them for ticks and Lyme exposure.
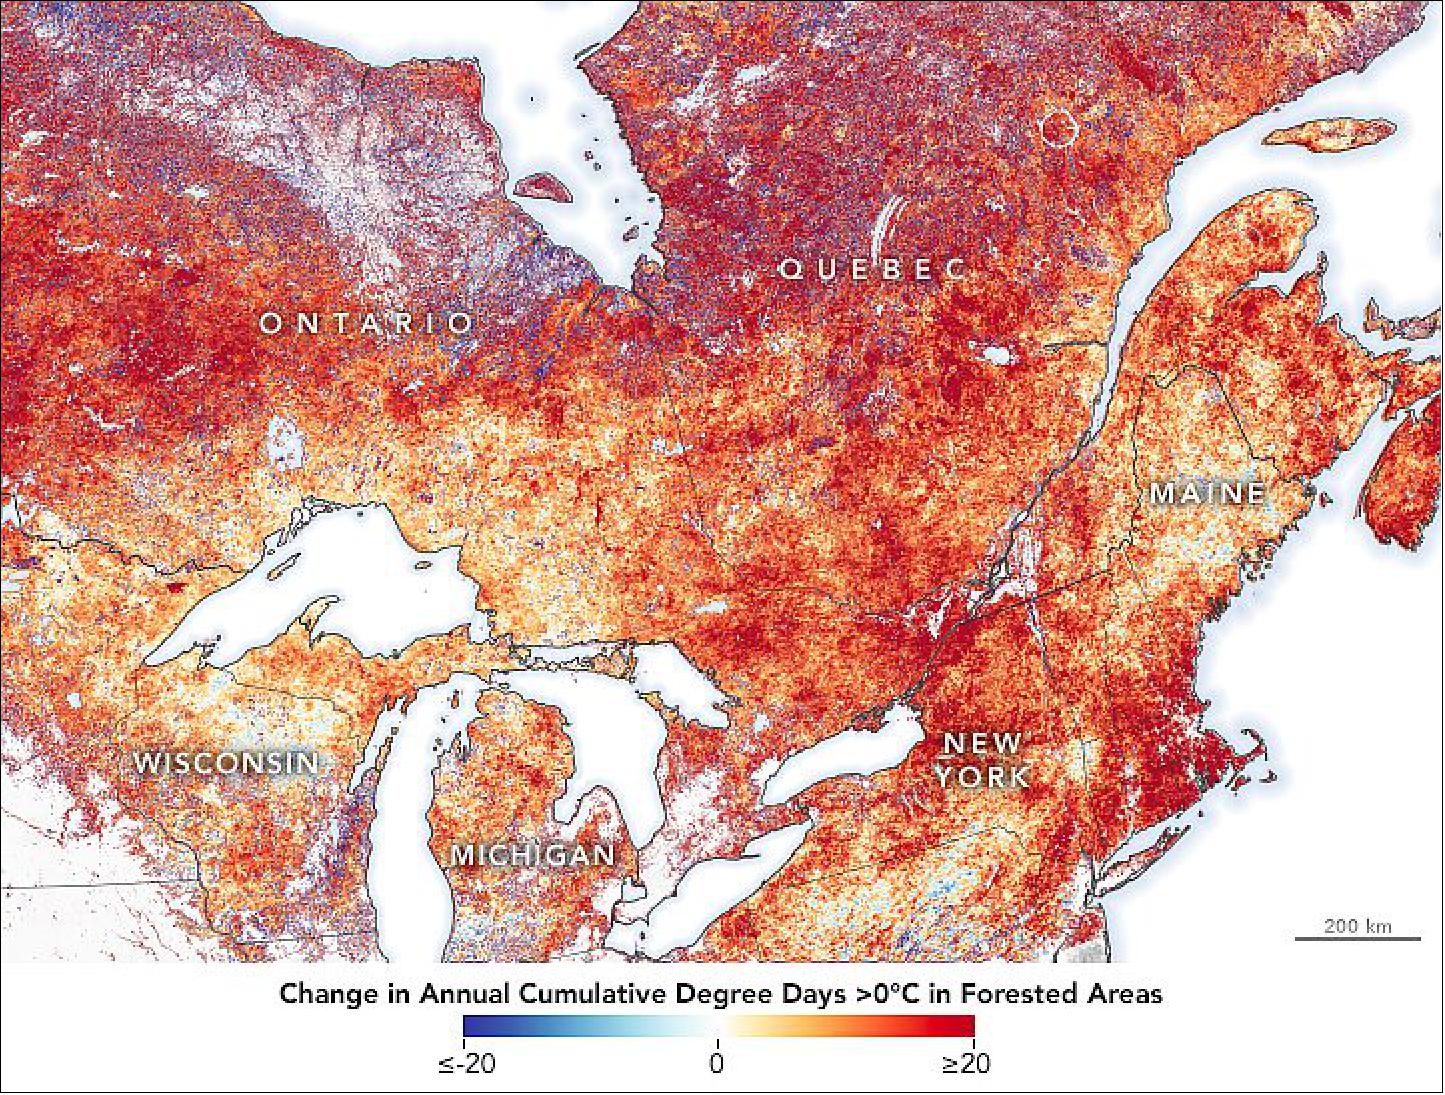
- Deer ticks die off in freezing temperatures, but warmer winters in Canada and New England are now allowing ticks to establish habitat farther north. The authors used MODIS data to predict suitable deer tick habitat, looking at average temperatures for each day and summing the degrees above 0° Celsius over the whole year (a measurement known as degree days). The map shows the change in degree days above 0°C from 2000 to 2015.
- The authors found that much of central and eastern Canada warmed by 15 to 35 degree days per year, making these areas more habitable to deer ticks. Some places in southern Manitoba, Ontario, and Quebec warmed more than 35 degree days per year. Using these calculations, the research team developed an algorithm to predict the risk of tick occurrence. They estimate that the average number of adult deer ticks per square kilometer in Quebec province rose from 56 in 2000 to 103 in 2015. In Manitoba province, the number increased from 36 per square kilometer to 110.
- As global climate continues to warm, Lyme disease risk in Canada is expected to increase even more. "The first cases of Lyme disease in Quebec were in the late 1990s," said Kotchi. "Lyme has been expanding in Canada ever since." According to the Public Health Agency of Canada, Lyme disease cases in Canada increased from 144 people infected in 2009 to 992 in 2016.

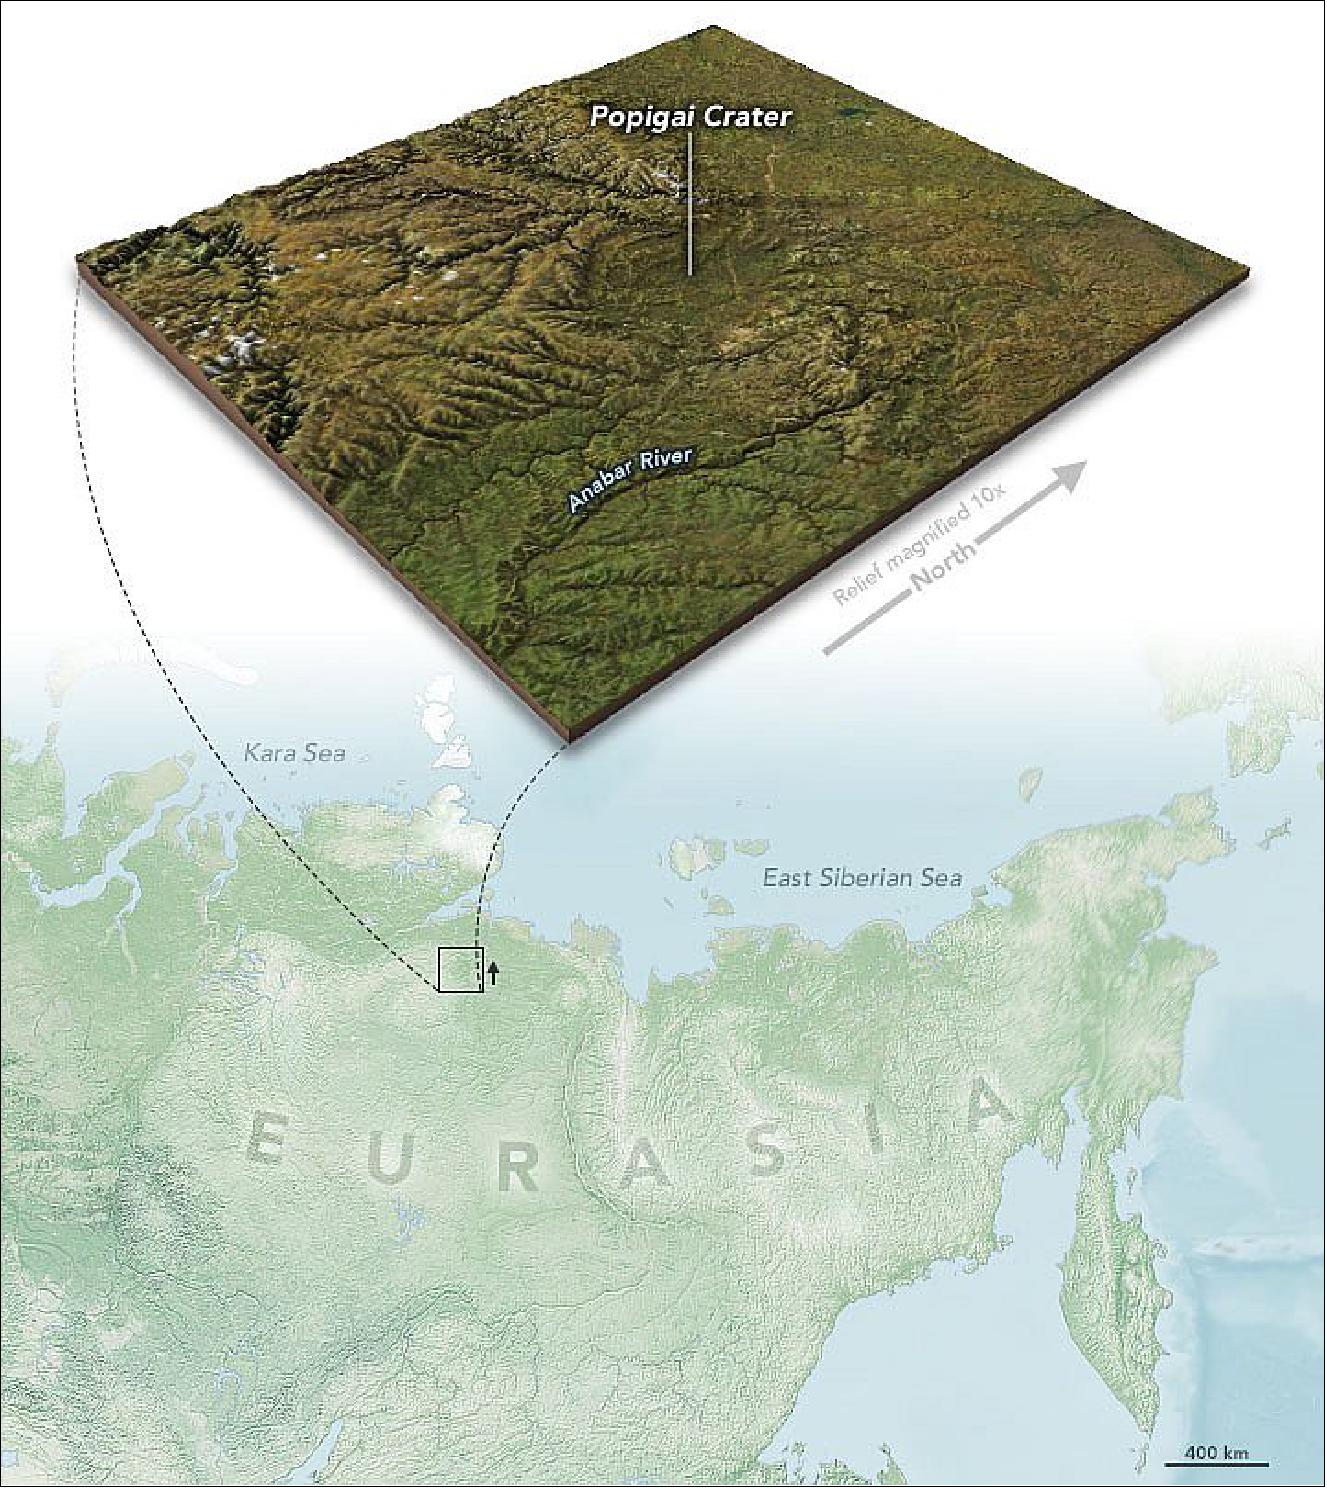
• June 7, 2021: About 36 million years ago, an asteroid slammed into northern Siberia and created one of the largest craters on Earth. Streaking in at an estimated speed of 20 kilometers (12 miles) per second, the asteroid made an impact that ejected millions of metric tons of material into the air. The asteroid—between 5 and 8 km (3 to 5 miles) wide—created a crater nearly 100 km (60 miles) in diameter. 18)
- The Popigai crater is the fourth largest verified impact crater on Earth, tying the Manicouagan Reservoir in Canada. The three larger craters are either buried (Chicxulub), deformed (Sudbury), or severely eroded and deformed (Vredefort). Popigai has only been slightly modified by erosion, leaving it as one of the most well-preserved craters in the world.
- The images on this page show Popigai crater, named for a nearby river. The images were created using Blue Marble data, a cloud-free composite of monthly observations from NASA's Moderate Resolution Imaging Spectroradiometer (MODIS) observations. The data was draped over an ASTER-derived global digital elevation model, which shows the topography of the area.
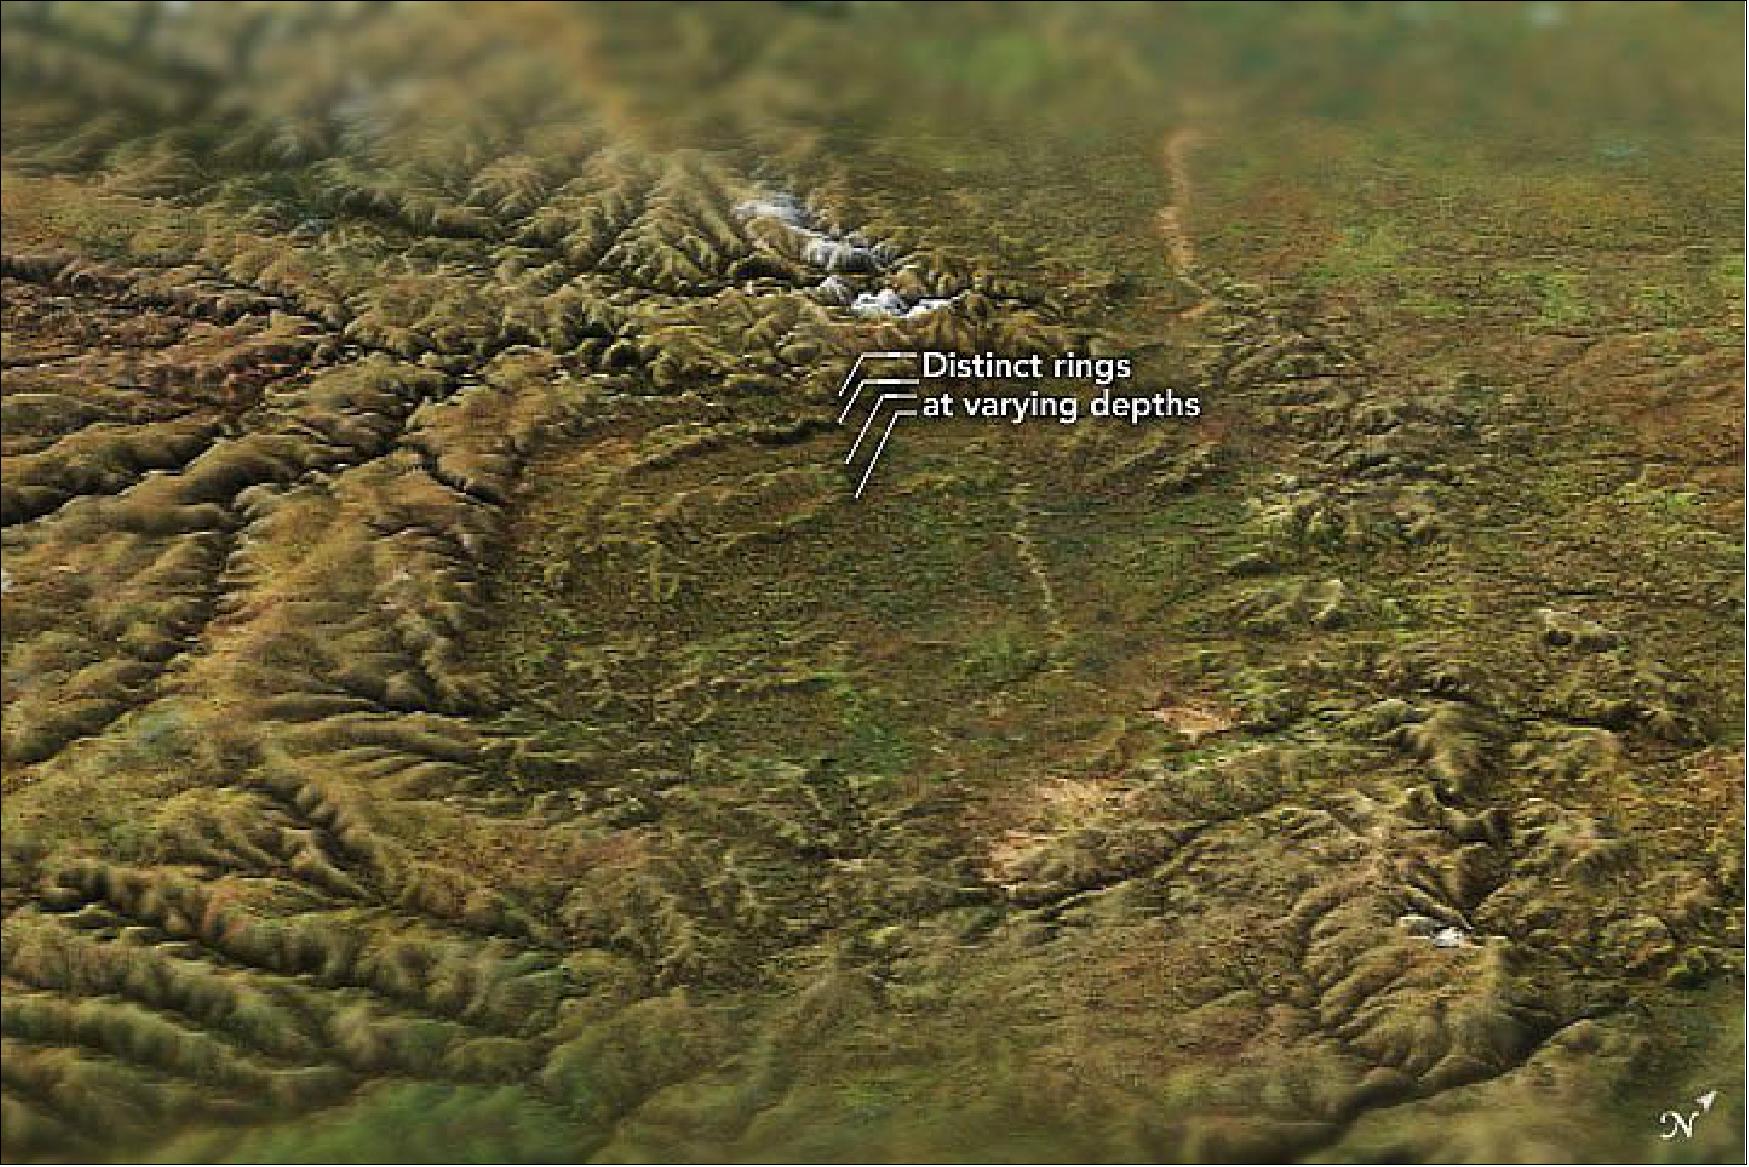
- The Popigai crater is the site of one of the largest diamond fields in the world today, estimated to contain "trillions of carats." Because they were formed instantly, the "impact diamonds" did not have time to develop as large, single gemstones. Most are polycrystalline stones smaller than two millimeters and with low purity, making them better for industrial uses than for jewelry.
• May 22, 2021: Given adequate sunlight and nutrients, phytoplankton populations can multiply into blooms large enough to be visible from space. That was the case on May 18, 2021, when the Moderate Resolution Imaging Spectroradiometer (MODIS) on NASA's Terra satellite acquired this natural-color image of a phytoplankton bloom along the coast of New Jersey, Delaware, Maryland, and Virginia. 19)
- Some of the nutrients that fueled the bloom likely came from runoff from the Delaware River watershed. Farms, wastewater treatment plants, urban and suburban areas, and other sources all contribute nutrients that can encourage blooms.
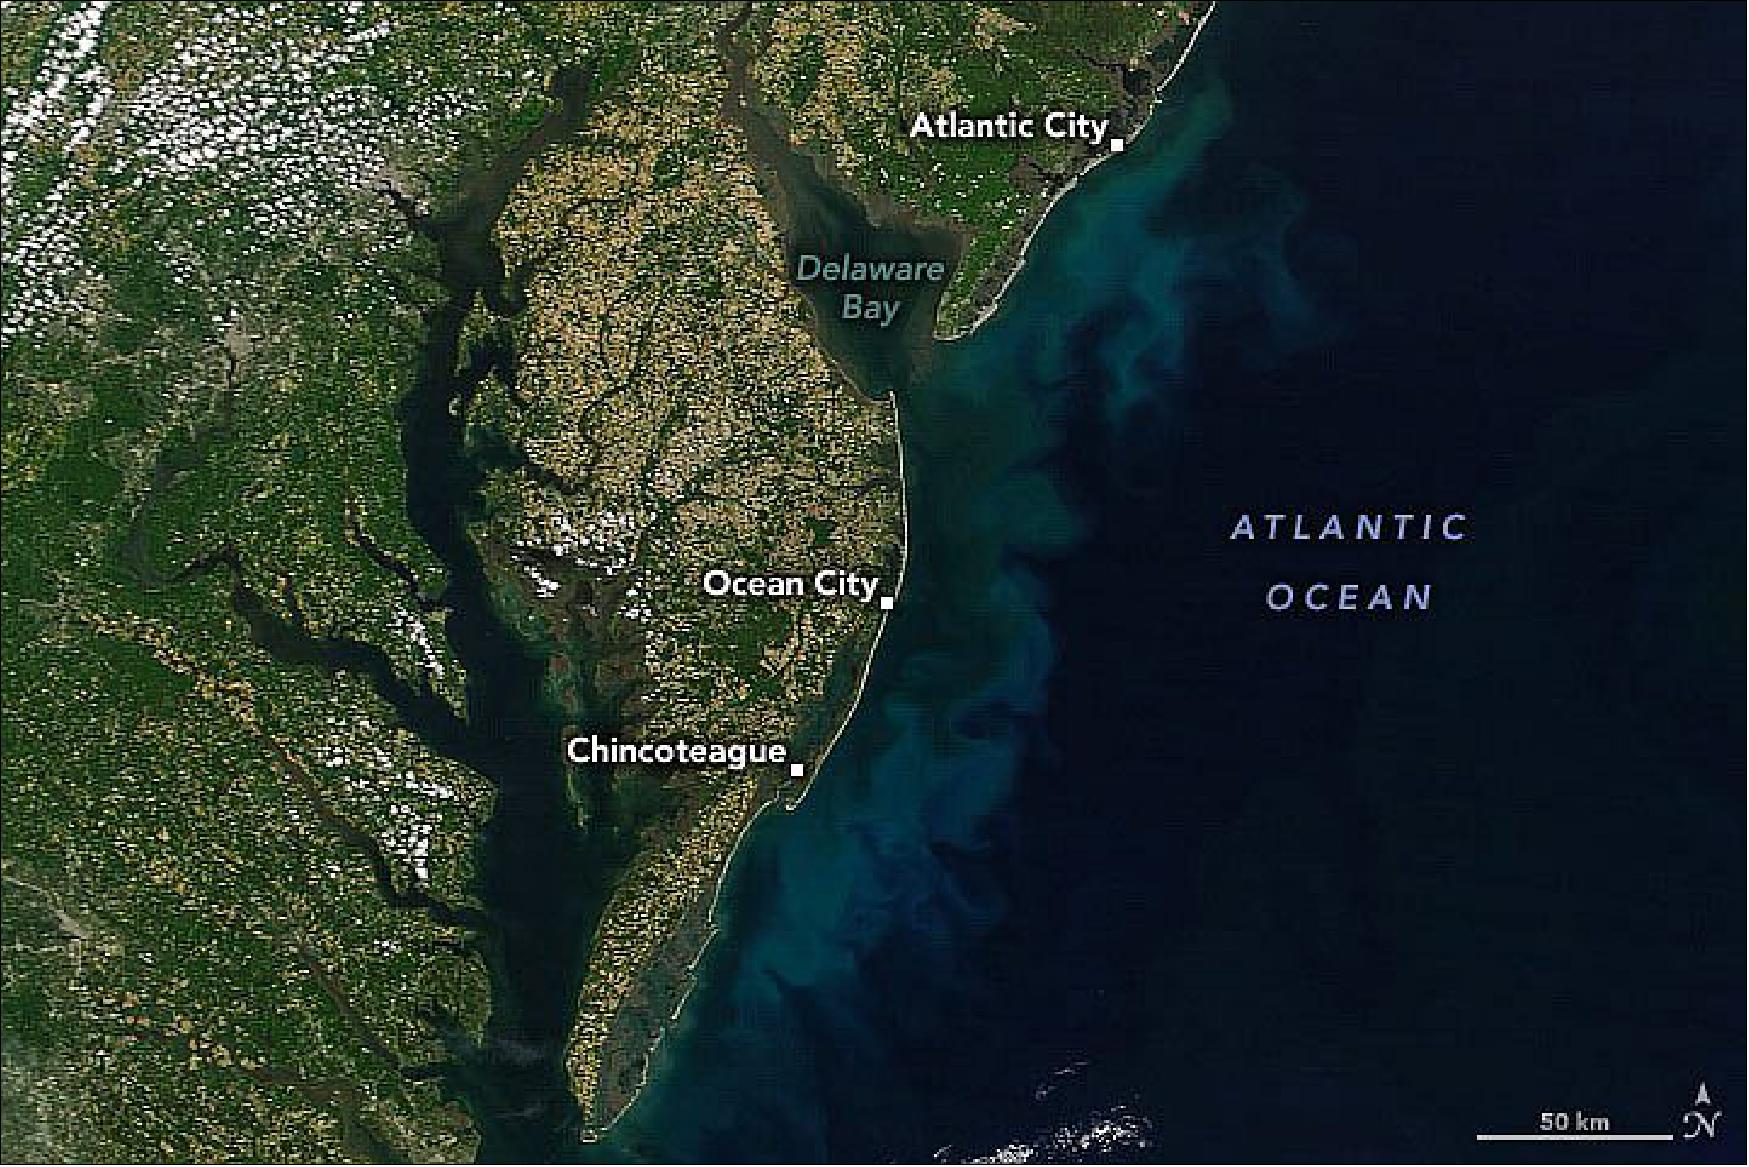
- The Delaware River plume may have also gotten some help from below the waterline. "Winds from the south often drive surface waters offshore due to Earth's rotation and Ekman Transport," said Chant. "This often causes nutrient-rich water to well up toward the surface in the summer."
- On a global scale, phytoplankton are responsible for nearly half of Earth's primary production, turning carbon dioxide, sunlight, and nutrients into the food that ultimately fuels almost everything in the sea, from finfish to shellfish and from zooplankton to whales.
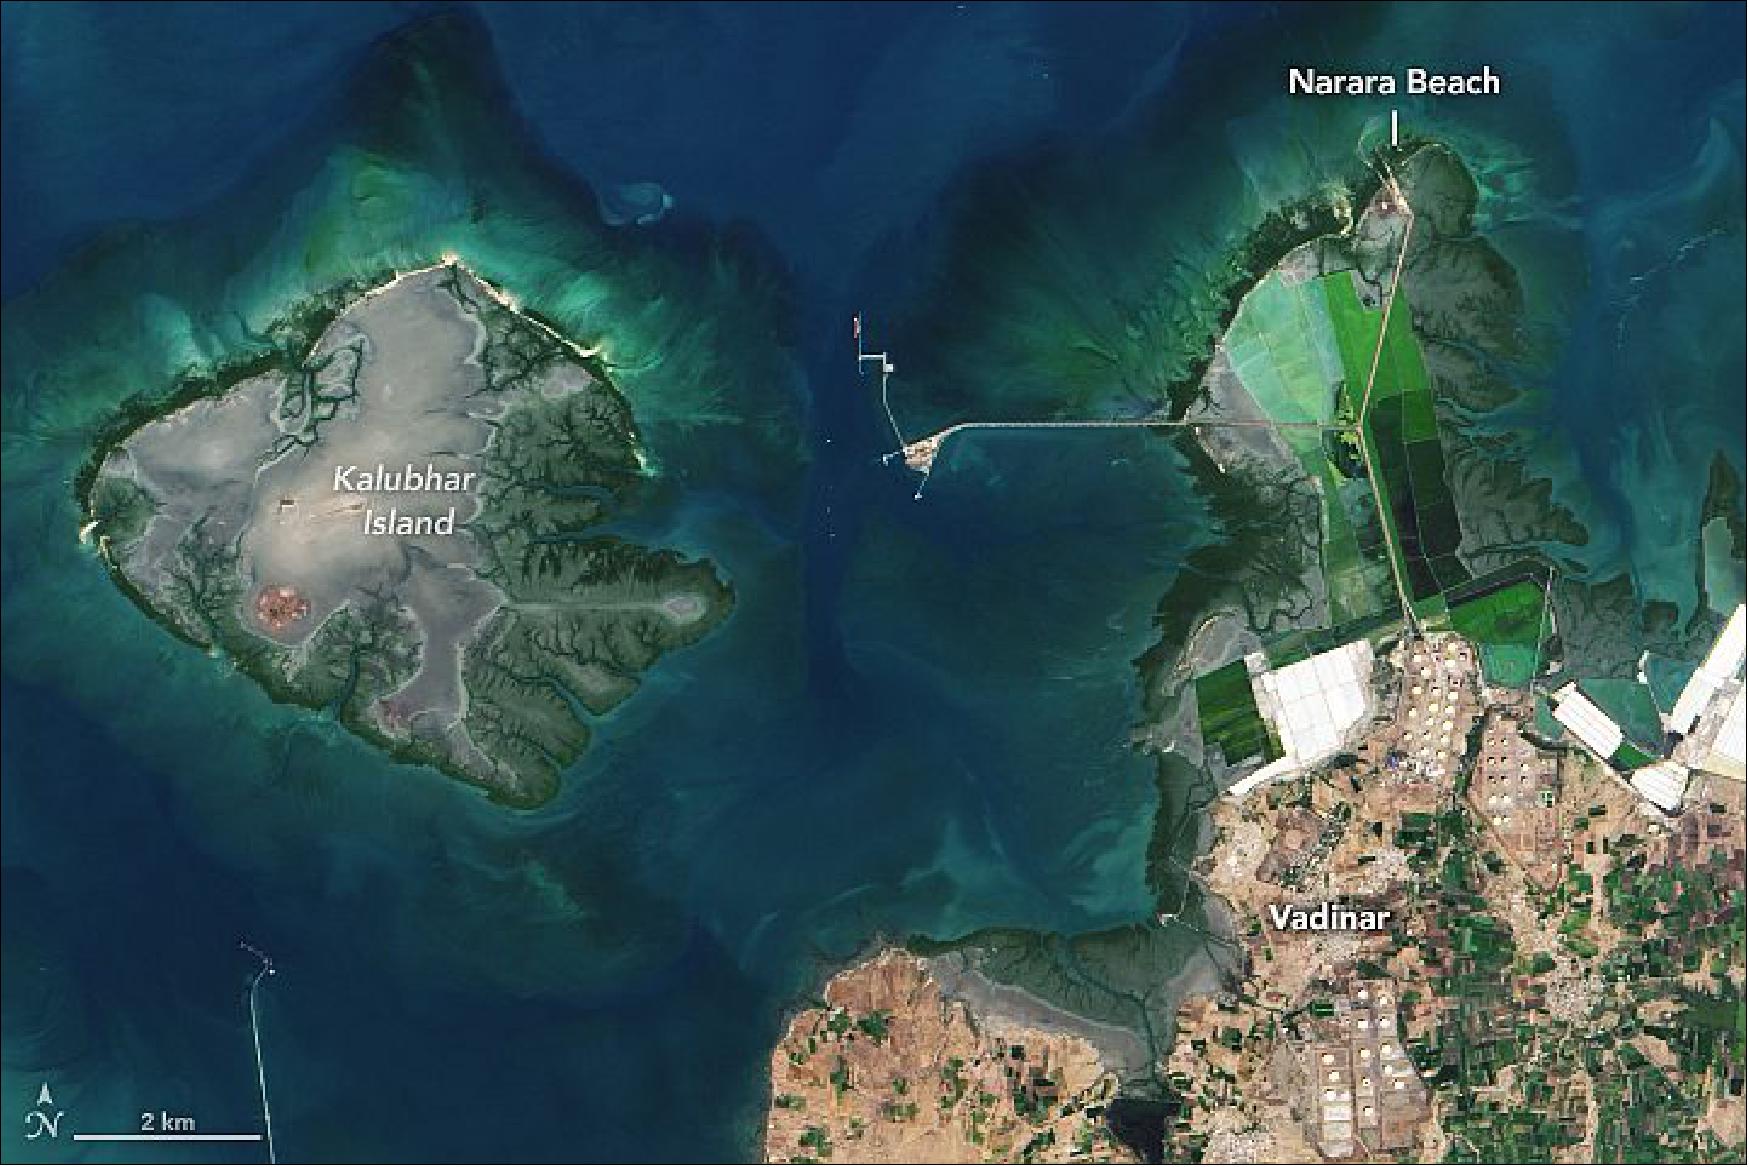
• May 8, 2021: Of more than 100 national parks in India, only about six are marine parks. The first was the Marine National Park and Sanctuary located in the Gulf of Kutch on the western shore. Not only does the reserve draw in tourists, but it also contains some of the most northerly coral reefs in the world as well as diverse marine life. 20)
- Established in 1980, the marine sanctuary spans about 450 km2 (170 square miles) spanning from the mouth of the gulf near Okha towards the head near Jodiya. In 1982, a core area within the sanctuary was declared a national park. The reserve primarily protects two major ecosystems: corals and mangroves.
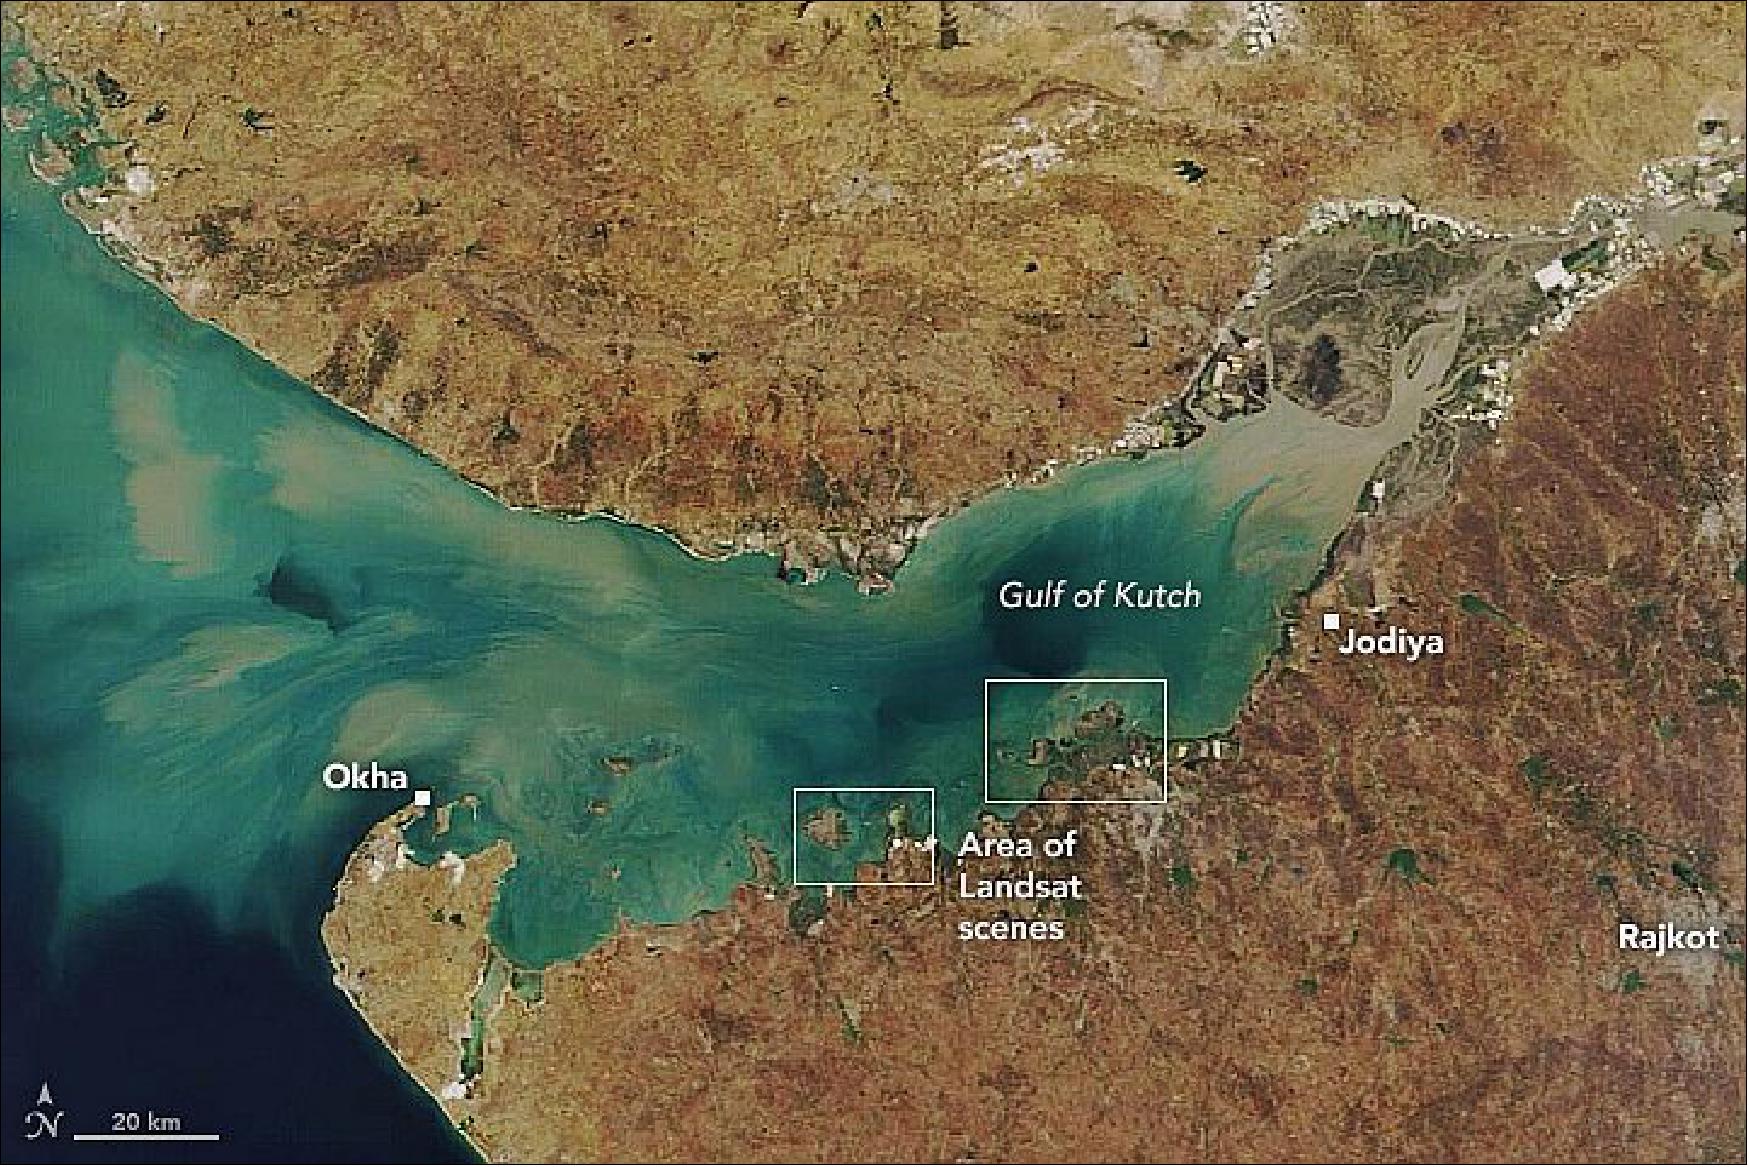
- Due to its wide temperature range and high salinity, the gulf has fewer species than the other reef ecosystems around the world. Even so, about 40 species of hard coral and 10 species of soft coral live in the protected area. The reserve also contains seven species of mangroves, which are important breeding grounds for birds such as the painted stork, darter and black-necked Ibis.
- The sanctuary is also home to more than 40 species of sponges, starfish, octopuses, puffer fish, and dolphins. Nearby beaches serve as breeding grounds for the green sea turtle, while deeper areas are home to the endangered whale shark.
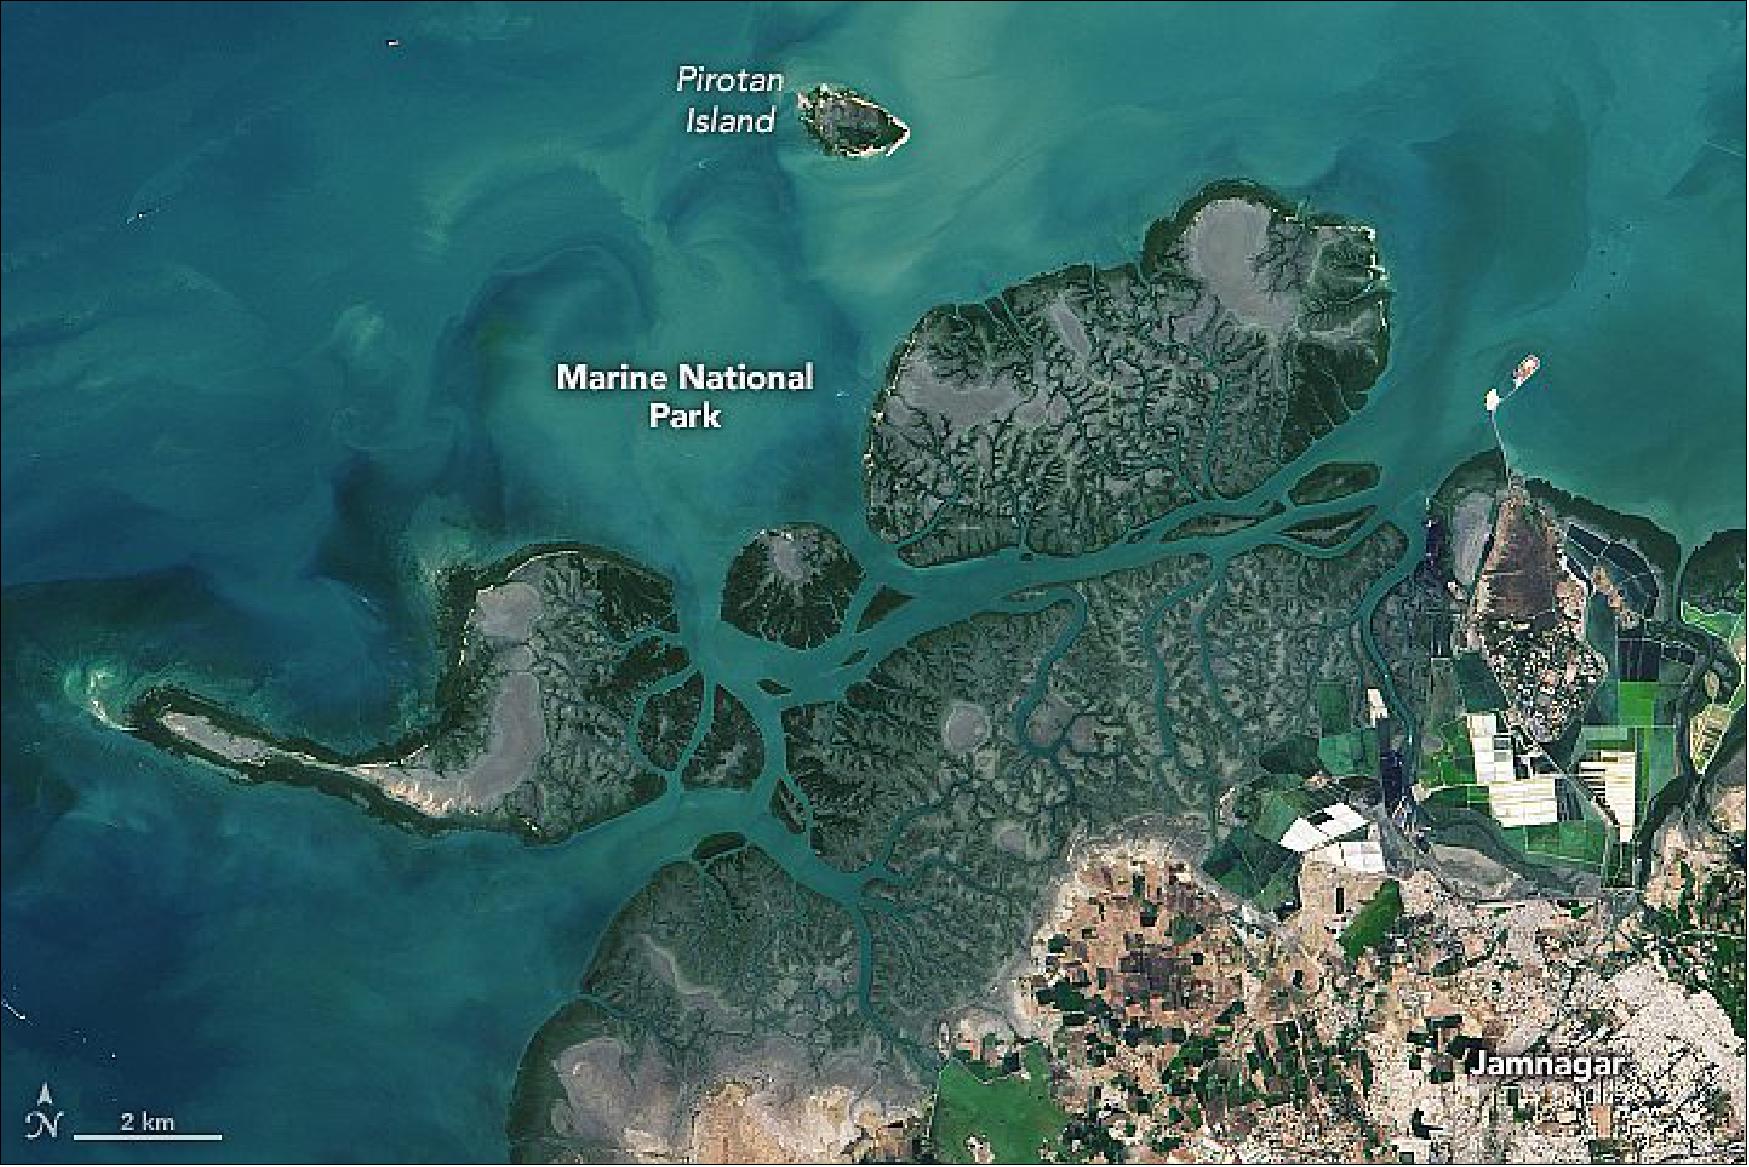
- The Gulf of Kutch is well known for its extreme daily tides, which are useful for viewing the underwater reefs. The difference between high and low tides can be more than four meters. When the tide is high, visitors can sail around the islands. When the tide is low, visitors can walk in ankle-high water at Pirotan and Narara and view the reefs, seagrasses, and animals without diving.
- The Gulf of Kutch is one of four major coral reef formation sites around India. Like many corals around the world, India's reefs are threatened by bleaching and by human activity. Scientists are working to preserve the corals in the marine reserve. They restored a family of staghorn corals to the gulf that had gone extinct about 10,000 years ago in 2015.
• April 13, 2021: Although there are telltale signs that a volcano is likely to erupt in the near future – an uptick in seismic activity, changes in gas emissions, and sudden ground deformation, for example – accurately predicting such eruptions is notoriously hard. 21)
- This is, in part, because no two volcanoes behave in exactly the same way and because few of the world's 1,500 or so active volcanoes have monitoring systems in place. Under the best of circumstances, scientists can accurately forecast an eruption of a monitored volcano several days before it happens. But what if we knew months or even years in advance?
- Using satellite data, scientists at NASA's Jet Propulsion Laboratory in Southern California and the University of Alaska, Fairbanks have developed a new method that brings us closer to that reality. The research was recently published in Nature Geoscience. 22)
- "The new methodology is based on a subtle but significant increase in heat emissions over large areas of a volcano in the years leading up to its eruption," said lead author Társilo Girona, formerly of JPL and now with the University of Alaska, Fairbanks. "It allows us to see that a volcano has reawakened, often well before any of the other signs have appeared."
- The study team analyzed 16 ½ years of radiant heat data from the Moderate Resolution Imaging Spectroradiometers (MODIS) – instruments aboard NASA's Terra and Aqua satellites – for several types of volcanoes that have erupted in the past two decades. Despite the differences between the volcanoes, the results were uniform: In the years leading up to an eruption, the radiant surface temperature over much of the volcano increased by around 1 degree Celsius from its normal state. It decreased after each eruption.
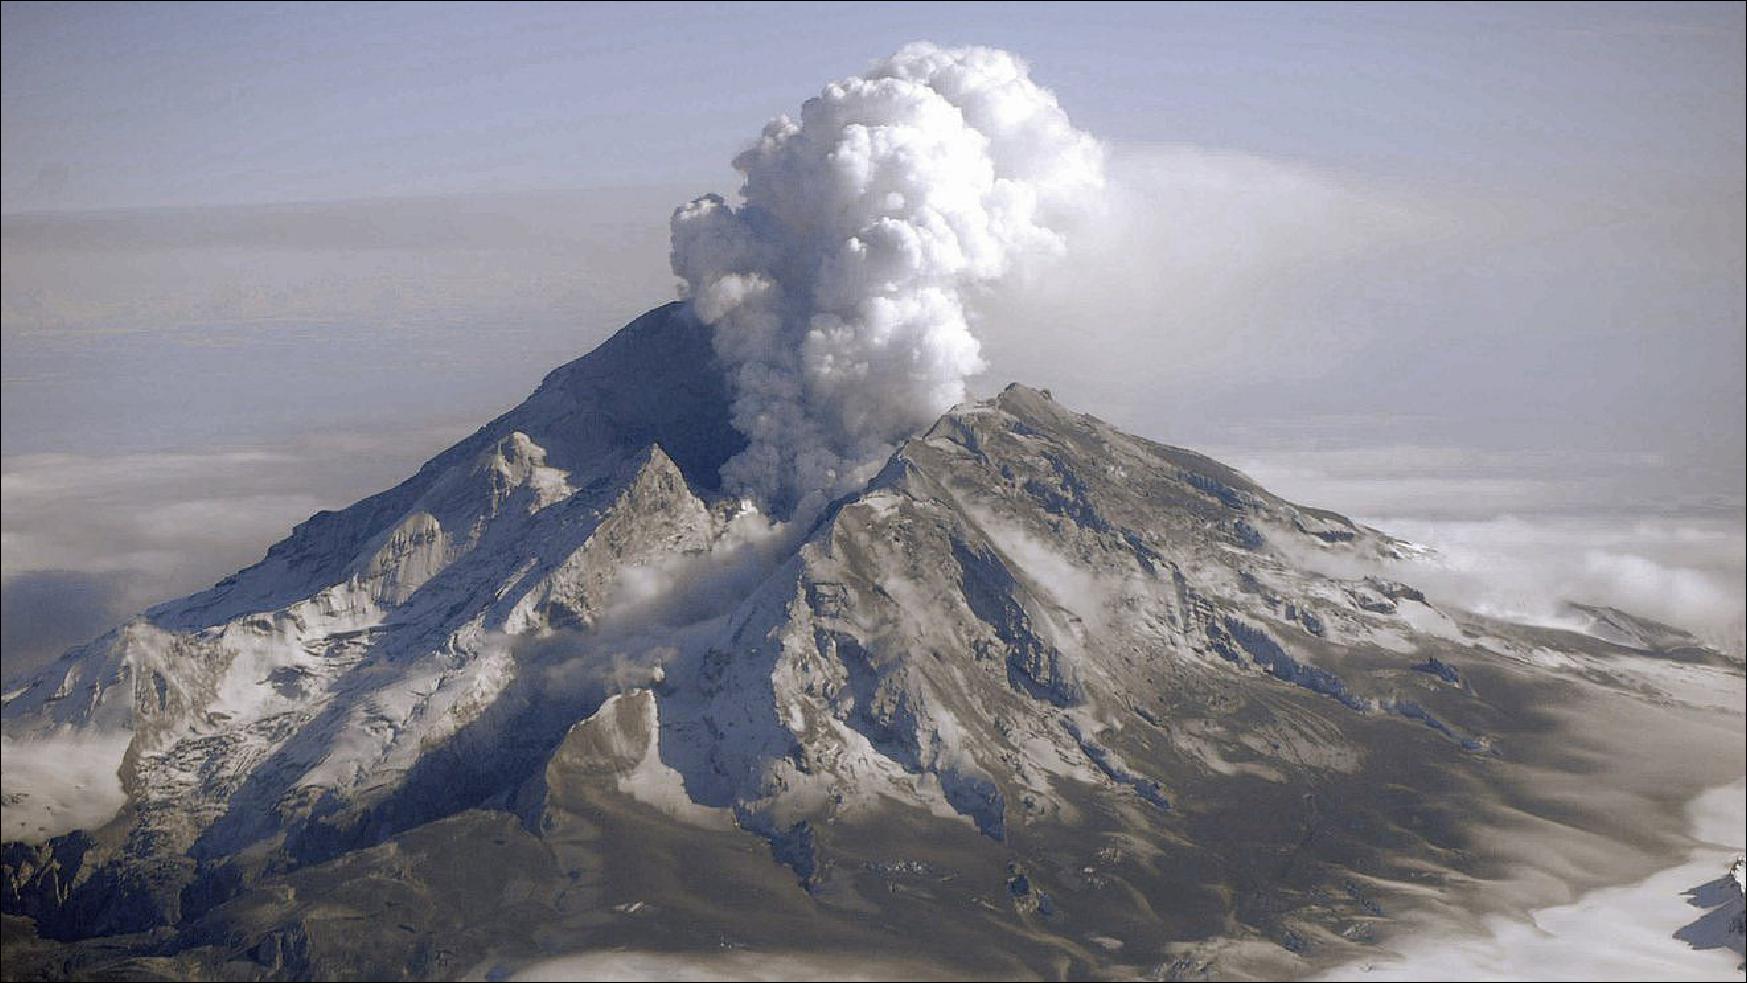
- "We're not talking about hotspots here but, rather, the warming of large areas of the volcanoes," said co-author Paul Lundgren of JPL. "So it is likely related to fundamental processes happening at depth."
- In particular, the scientists believe that the heat increase may result from the interaction between magma reservoirs and hydrothermal systems. Magma (molten rock below Earth's surface) contains gases and other fluids. When it rises through a volcano, the gases diffuse to the surface and can give off heat. Similarly, this degassing can facilitate the up-flow of underground water and the elevation of the water table, as well as hydrothermal circulation, which can increase soil temperature. But scientists say other processes may also be at play, because while their understanding of volcano behavior is improving, it remains limited.
- "Volcanoes are like a box of mixed chocolates: They may look similar, but inside there is a lot of variety between them and, sometimes, even within the same one," Lundgren said. "On top of that, only a few volcanoes are well monitored, and some of the most potentially hazardous volcanoes are the least frequently eruptive, which means you can't rely strictly on historical records."
Combining Data
- The new method is significant on its own, but it may provide even more insight into volcano behavior when combined with data from models and other satellites.
- In a study published in Scientific Reports last summer, Lundgren used interferometric synthetic aperture radar (InSAR) data to analyze long-term deformation at Argentina's Domuyo Volcano. At the time, scientists weren't certain whether Domuyo was a dormant or extinct volcano, or whether it was just a mountain. Lundgren's research cleared that up quickly. He unexpectedly detected a period of inflation, which is when part of a volcano expands as a new mass of magma moves upward and pushes rock out of the way. It turns out that Domuyo is very much a volcano – and an active one.
- Next, Lundgren compared this deformation time series to the thermal time series Társilo Girona created for Domuyo Volcano. Lundgren's goal: to determine whether the two processes – an increase in both radiant surface temperature over large areas of the volcano and deformation – were connected.
- "We found that the thermal time series very much mimicked the deformation time series but with some time separation," said Lundgren. "Even though it remains unclear which process is likely to happen first, by showing the correlation, we can connect the processes through physics-based interpretations rather than simply relying on what we are able to observe at the subsurface."
- In other words, combining the datasets provides clues about what's happening deeper inside the volcano and how the various processes influence and interact with each other – data that can improve the accuracy of models used to forecast eruptions.
- "Although the research does not answer all of the questions, it opens the door to new remote sensing approaches – especially for distant volcanoes – that should get us some fundamental insights into competing hypotheses for how volcanoes behave in general dynamic terms over timescales of a few years to decades," Lundgren added.
Looking Ahead
- Moving forward, the scientists will test the thermal time series method on more volcanoes and continue to fine-tune its precision.
- "One of the goals is to one day have a tool that can be used in near real-time to check for volcanic activity in volcanic areas," said Girona. "Even for small eruptions, there is evidence of thermal unrest before the initiation of the eruption event, so the new method helps bring us a little closer to that goal."
- The data help to supplement existing tools used at monitored volcanoes. But they also greatly increase the number of volcanoes for which potentially life-saving data can be made available.
- "Using the new thermal method that detects changes in the surface temperature around volcanoes and the InSAR ground-surface deformation measurements helps enable volcano observatories around the word to identify which volcanoes are the most likely to erupt and which volcanoes should be instrumented for closer observations," Lundgren said. "In using satellite data, you increase the scope of what can be monitored on a regular basis."
- As for the once-largely-ignored Domuyo, the story is still evolving: It is one of several volcanoes recently prioritized by the Argentine government to be outfitted with a monitoring system.
• April 8, 2021: The Kafue River—the longest river flowing entirely within Zambia—winds more than 1500 km (900 miles) until it joins the Zambezi River. Before reaching the Zambezi, the Kafue's west-to-east course crosses a flat, shallow floodplain known as the Kafue Flats. 23)
- The disturbance caused by annual floods plays an important role in the Kafue Flats ecosystem. Historically, naturally occurring floods that peaked along the flats from March to May provided vital habitat for spawning fish; when the floodplain dried around October, grazers moved in to eat the newly grown grasses.
- Dams built for hydropower in the 1970s upstream and downstream of Kafue Flats altered that rhythm. "Since the dams were built, the natural dynamics of high and low flows have been strongly reduced," said Fritz Kleinschroth, a landscape ecologist at Swiss Federal Institute of Technology (ETH Zürich), who has used satellite images and field surveys to study decades-long changes in the region. "Nowadays, the less-flooded areas are dominated by shrublands, and the more permanently humid zones are comprised of reeds and species like papyrus." With less water flowing through, trees and shrubs moved in, spawning grounds were lost, and human settlements were disturbed.
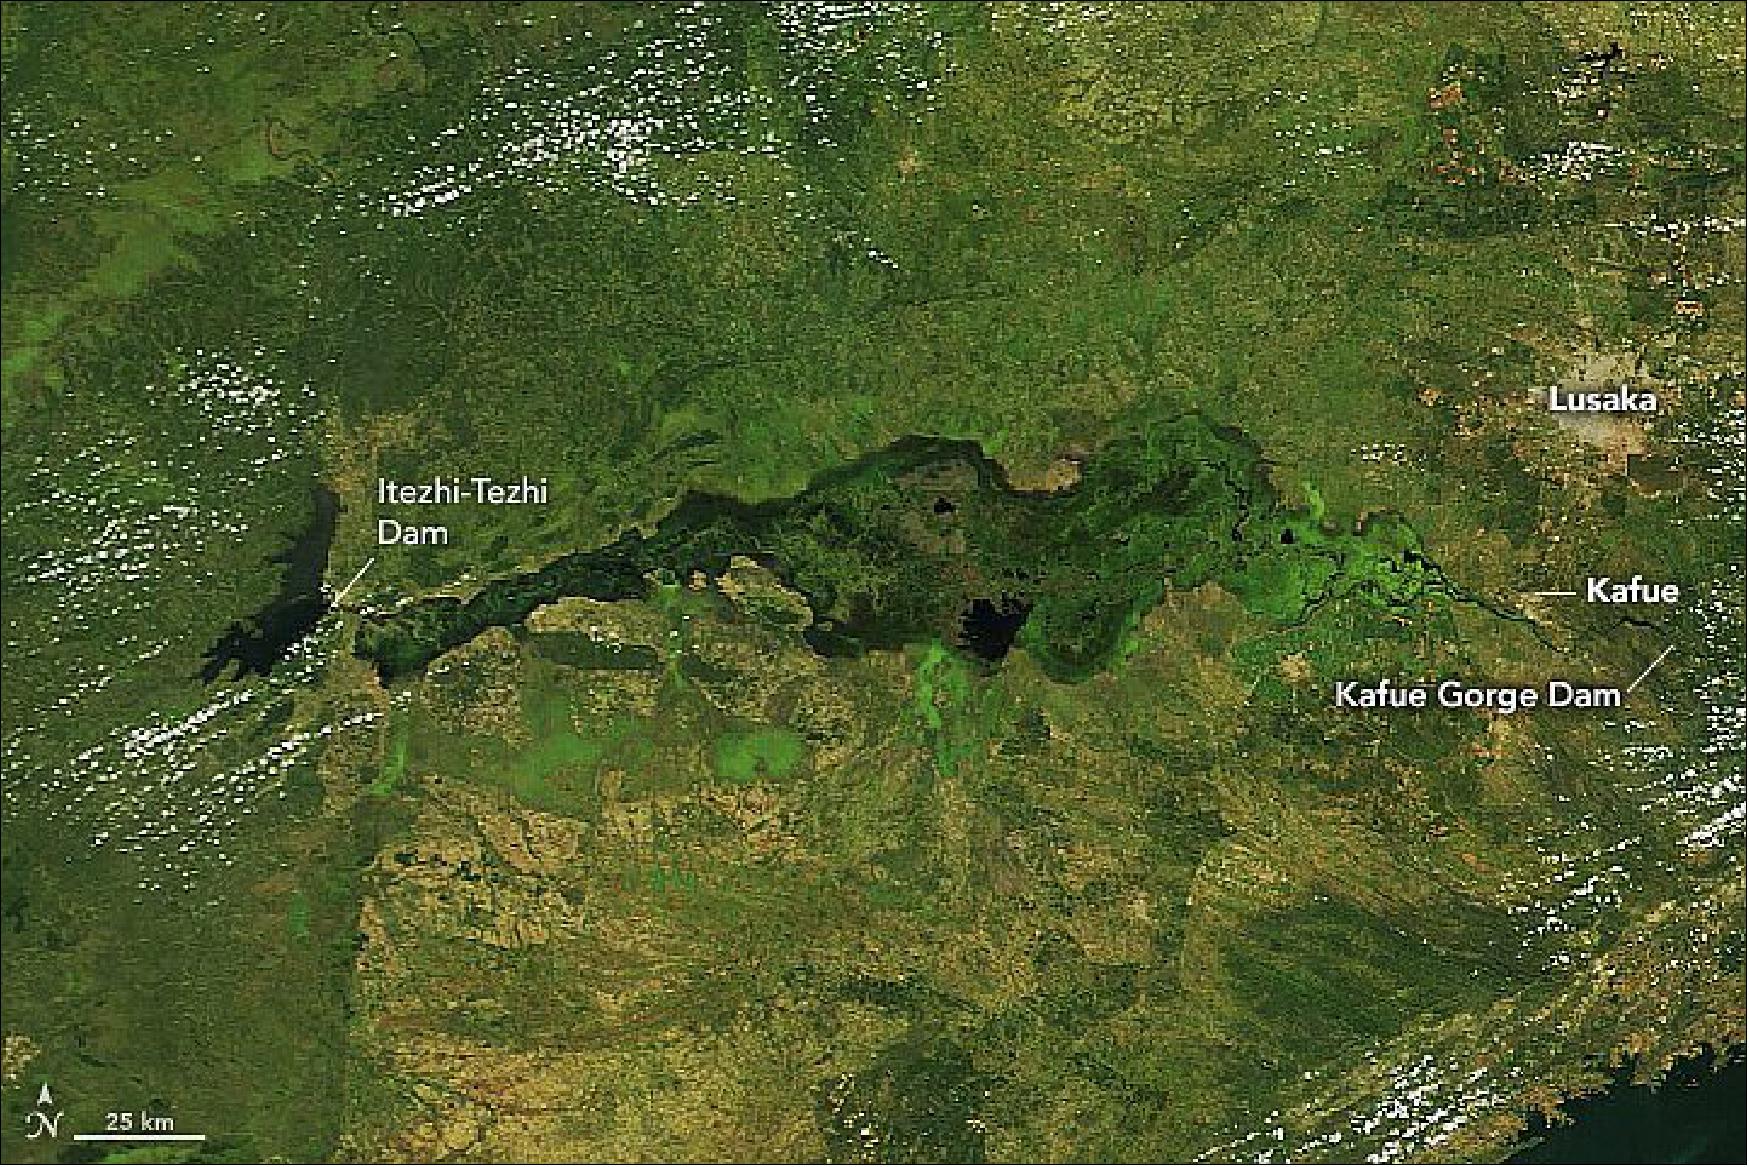
- The inundated network of channels and lagoons span the plain, which measures about 240 km long and up to 50 km wide (30 miles). It crosses moderately settled land: the town of Kafue lies along the north bank, and green areas southeast of the flats are irrigated sugar cane fields. River water also passes through Blue Lagoon and Lochinvar National Parks, but even these conservation areas have been altered.
- "Biological invasions are a big issue both from ecological and economic points of views, and everything should be done to prevent the spreading of non-native species in the first place," Kleinschroth said. But given that invasive plants like hyacinth have been in the region for decades (despite efforts to eradicate them), researchers set out to see if there were any benefits.
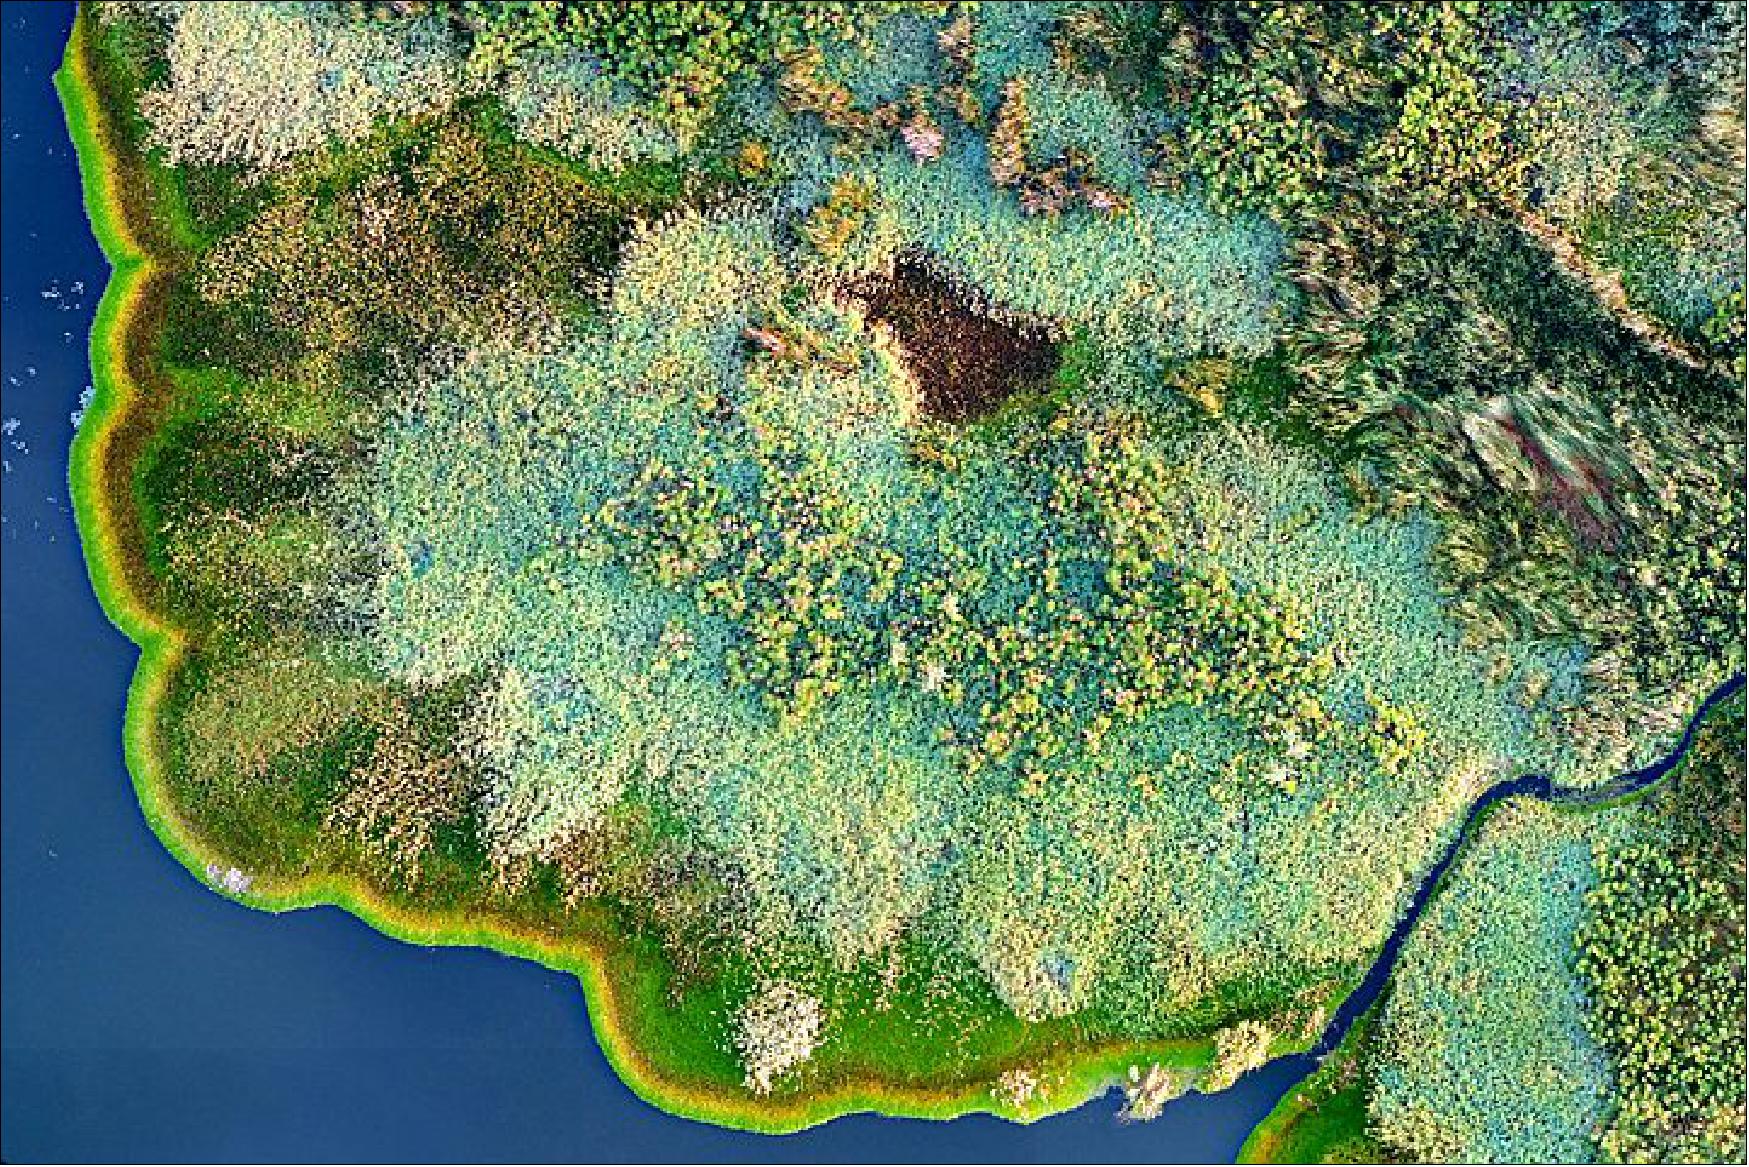
- Scott Winton, a biogeochemist at ETH Zürich, and colleagues used data from Landsat images, water samples, and models to find that near the Kafue Gorge Dam, floating plants absorb 19 percent of the total phosphorus and 2.8 percent of the total nitrogen in the river water. In excess, these nutrients can cause blooms of algae and cyanobacteria. Consequences include the release of harmful toxins and the formation of oxygen dead zones that can lead to fish kills and cause methane emissions.
- "In this situation, we ask the question: how can we live with these invasions and are there certain benefits that can be harnessed?" said Kleinschroth, a co-author on the 2020 paper published in Scientific Reports. "And here the novelty is indeed that the mass occurrence of these ‘nuisance' plants is actually helping to reduce the pollution that is coming from untreated wastewater." 25)
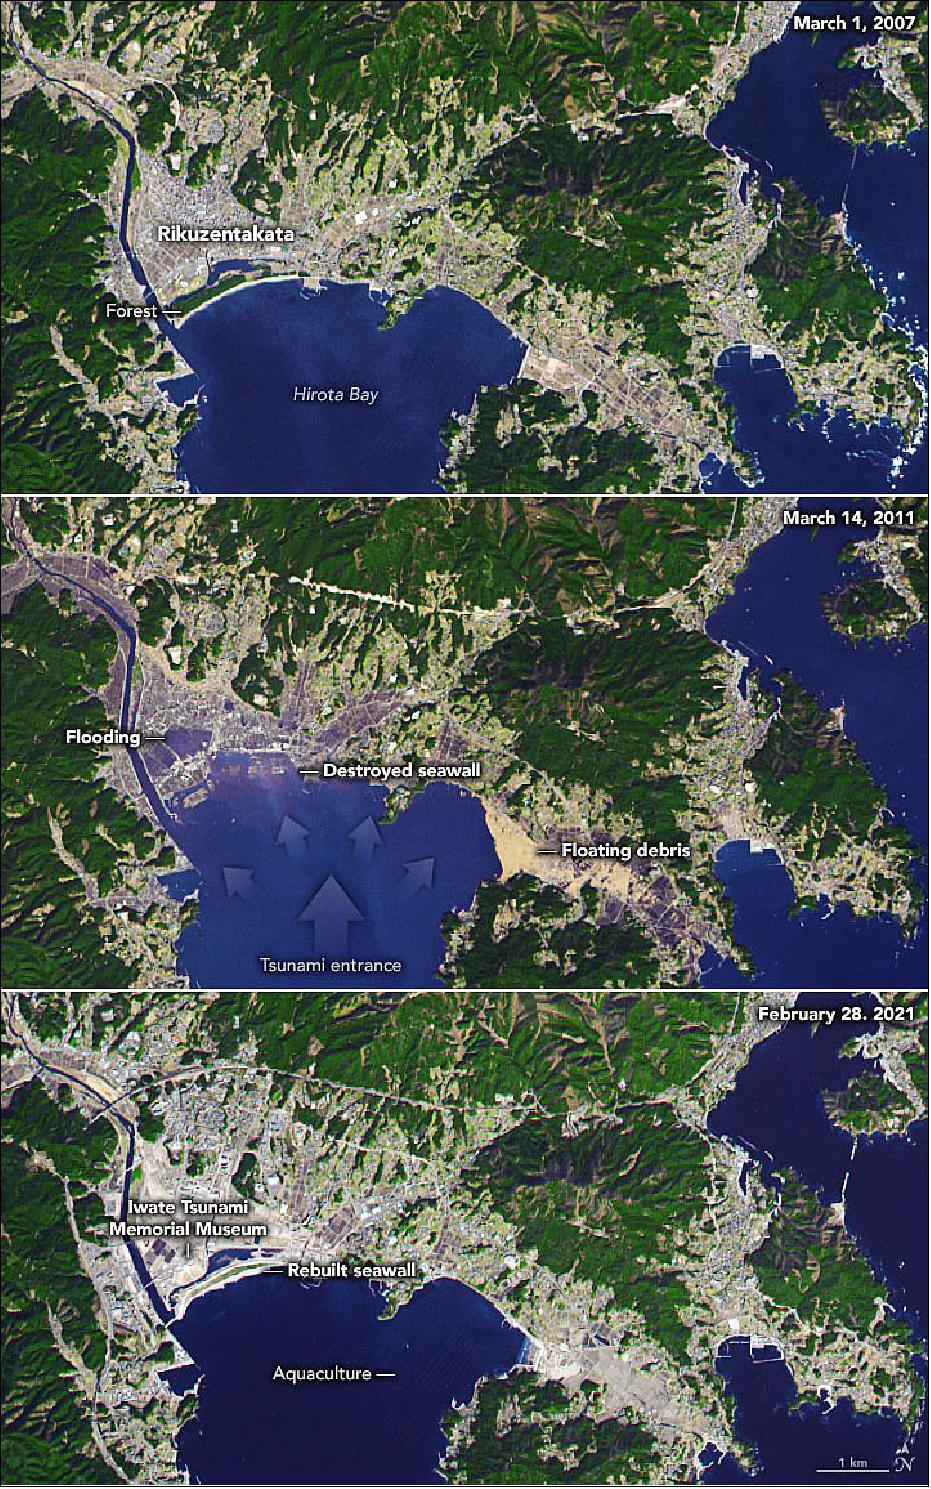
• March 12, 2021: On March 11, 2011, a magnitude 9.1 earthquake jolted the seafloor about 70 km (45 miles) offshore of Japan's Tohoku region. It was the largest quake recorded in Japan and the fourth largest in the world since seismic recording began around 1900. 26)
- Within an hour, tremendous tsunami waves inundated much of the eastern Japanese coast, sending 5- to 10-meter walls of water into coastal towns and cities. In Miyako, Iwate Prefecture, the runup height from the tsunami—the maximum elevation that water moved upland from the shore—reached 40.5 meters (133 feet) above sea level. Near Sendai, flood waters penetrated 10 kilometers (6 miles) inland.
- According to the U.S. Geological Survey, the earthquake moved Japan's main island of Honshu eastward by 2.4 meters (8 feet) and dropped about 400 km (250 miles) of coastline by 0.6 meters (2 feet). The tsunami affected a 2000-kilometer stretch of coast and inundated more than 400 km2 of land in Iwate, Miyagi, and Fukushima prefectures.
- The March 2011 tsunami killed more than 1,700 residents (about 8 percent of the population) of Rikuzentakata and destroyed 80 percent of its residential areas. More than 70,000 trees in the Takatamatsubara pine forest on the waterfront—planted in the 17th century as a tidewater control—were washed away. Flood waters sat for weeks on rice paddies and other agricultural land. Satellites captured scenes of the devastation just one day and three days after the event. On March 14, 2011, The Mainichi Daily News declared: "Rikuzentakata has been erased."
- A decade later, the area is still rebuilding. A 12.5-meter (41-foot) high concrete seawall now stands along two kilometers of the waterfront in Rikuzentakata. (More than 430 kilometers/265 miles of seawalls have been built up and down the Tohoku coast.) Engineers and construction crews also carried in massive amounts of soil and rock to raise the level of the land by 10 meters before new buildings were constructed. And local officials launched a project in 2017 to plant 40,000 tree seedlings along the town's coastline.
- According to the Japan Reconstruction Agency, nearly 400,000 buildings were destroyed or irreparably damaged and another 750,000 were partially destroyed across the country in March 2011. Nearly 16,000 people were killed and 2,500 are still listed as missing. The meltdown and explosions at the nearby Fukushima Daichi nuclear plant between March 12-15, 2011, added to the misery and displacement of Japanese citizens. More than 21,000 hectares of farmland were destroyed by flooding and by salt water; some has been reclaimed and some has returned to wildland. The World Bank estimated it to be the costliest natural disaster in world history. According to some estimates, Japan has spent nearly $300 billion (U.S) on rebuilding the region to date.
- Visit our Tohoku/Sendai gallery to see twenty other images and stories from the days and months after the earthquake and tsunami.
• March 10, 2021: For at least a century, air, ocean, and land temperatures on Earth have been steadily rising. For at least the past forty years, the planet has been growing a bit greener. Now researchers have found that the greening of the planet can change the movement of air near the land surface in ways that offset at least some warming. Essentially, global warming would be even worse were it not for extra greenery changing how and where heat builds up across the landscape. 27)
- In 2019, remote sensing scientists Chi Chen, Ranga Myneni, and colleagues at Boston University used satellite observations to show that vegetation cover had increased globally by 5 percent since the early 2000s. In 2020, the research group linked that increase in greenness to a slight offset in global temperatures.
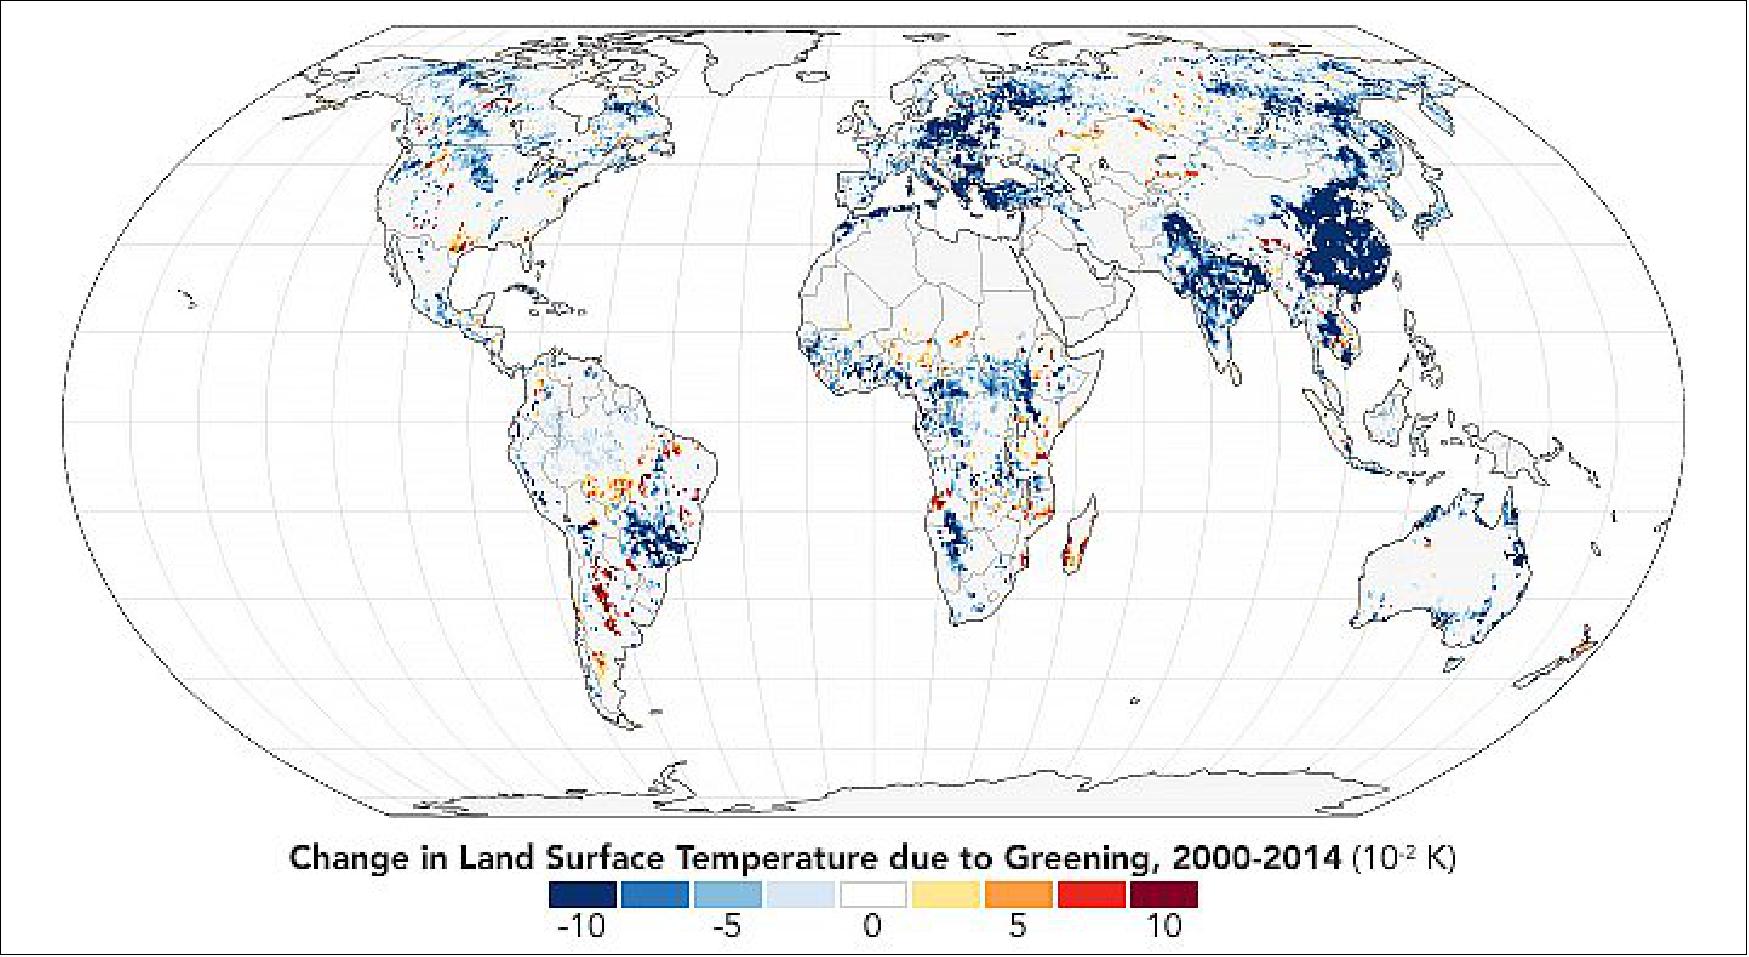
- Now, in a new study, Chen and colleagues have worked to decipher how that greening could affect land temperatures. Using satellite data and advanced computer models, they found that increased vegetation has a cooling effect that comes from an increased efficiency in the vertical movement of heat and water vapor between the land surface and atmosphere.
- There are several ways vegetation can alter temperatures at the surface. Changing leaf area can change albedo, or how much sunlight is absorbed or reflected by a landscape. More greenery can also change land surface resistance, or how well water can penetrate and be retained by soil and leaves. And it can change emissivity, or how the surface emits or reflects longwave radiation.
- But according to the new study, the strongest cooling effect comes from the way increasing leaf cover leads to less aerodynamic resistance, or how features on the ground increase or decrease drag and turbulence in the air above. In many environments, extra leaves can enhance the efficiency of vertical air mixing, allowing more heat and water vapor to rise into the atmosphere. Extra leaves may also increase the amount of water transpired (exhaled) by plants, allowing even more water to be transferred. That extra moisture can carry away a significant amount of heat from the ground level and lead to cooler surfaces.
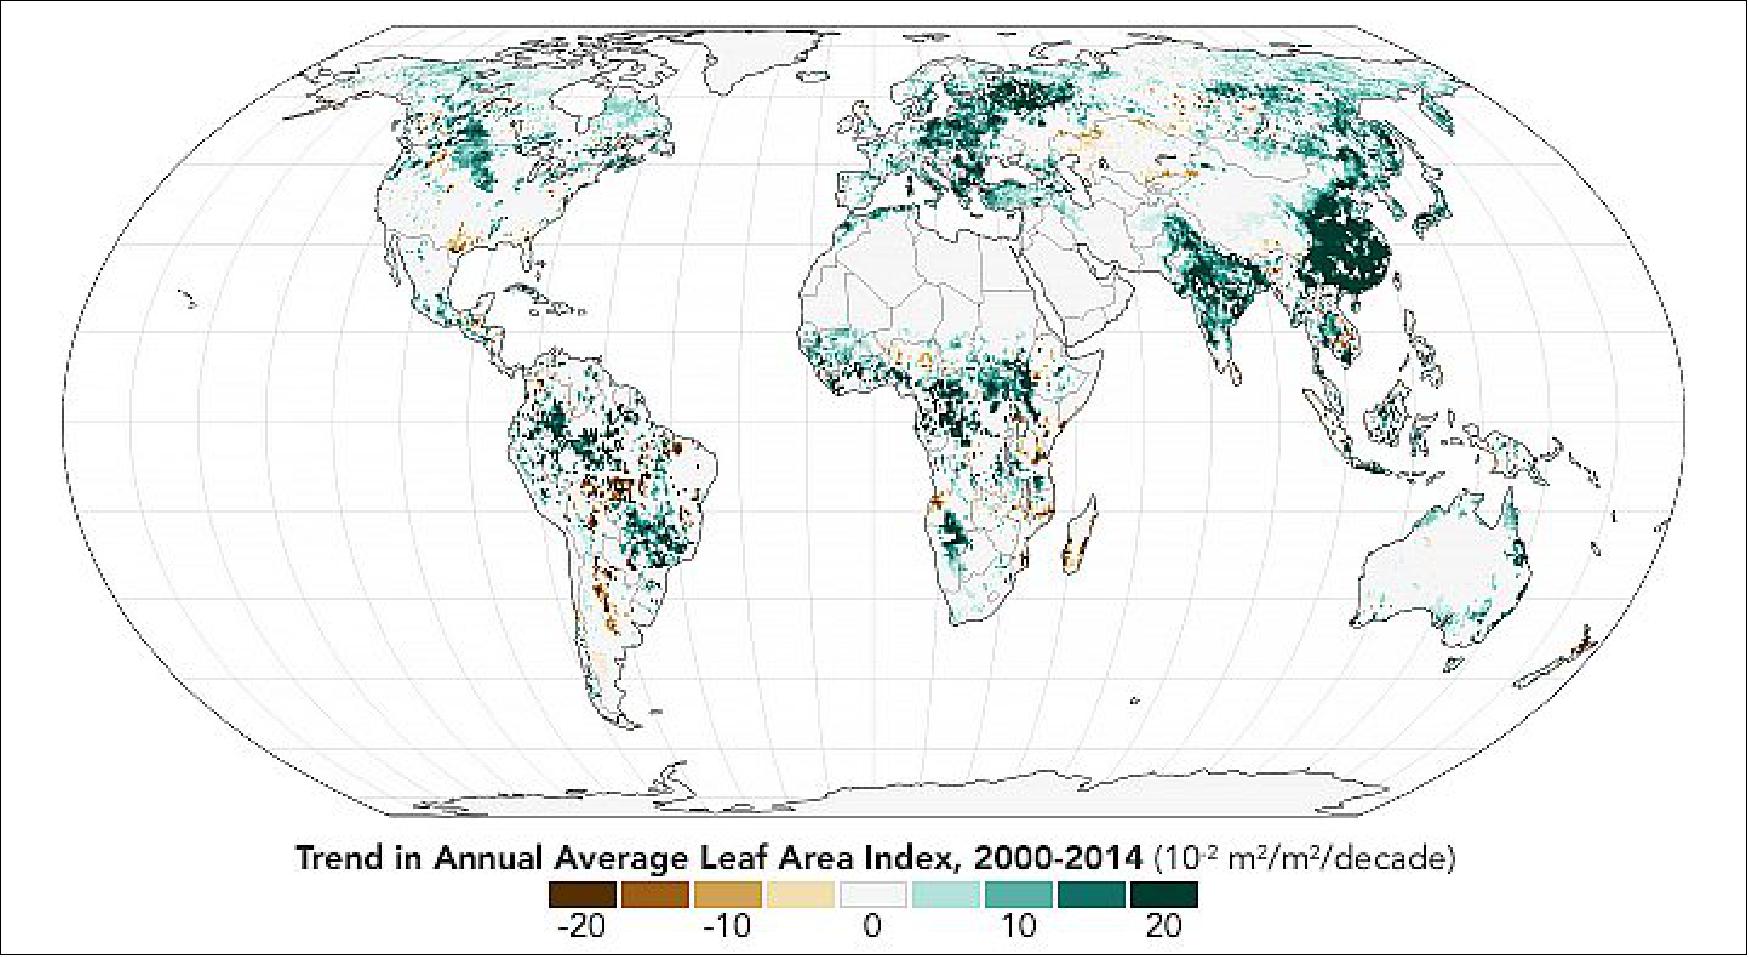
- In their studies, Chen and colleagues have found that most vegetated areas on Earth (about 93 percent) see their land surfaces cool when leaf area increases. Since 2000, at least 30 percent of areas with more leaf coverage have been cooled by it, while 5 percent have grown warmer.
- "In the fight against climate change, plants are the lonely-only defenders," said Chen, now a postdoctoral researcher at the Lawrence Berkeley National Lab. "Stopping deforestation and ecologically sensible large-scale tree-planting could be one simple, but not sufficient, defense against climate change."
- The study authors noted, however, that the cooling effect from extra vegetation is large from an energy dissipation perspective, but it is small compared to the pace and intensity of global warming.
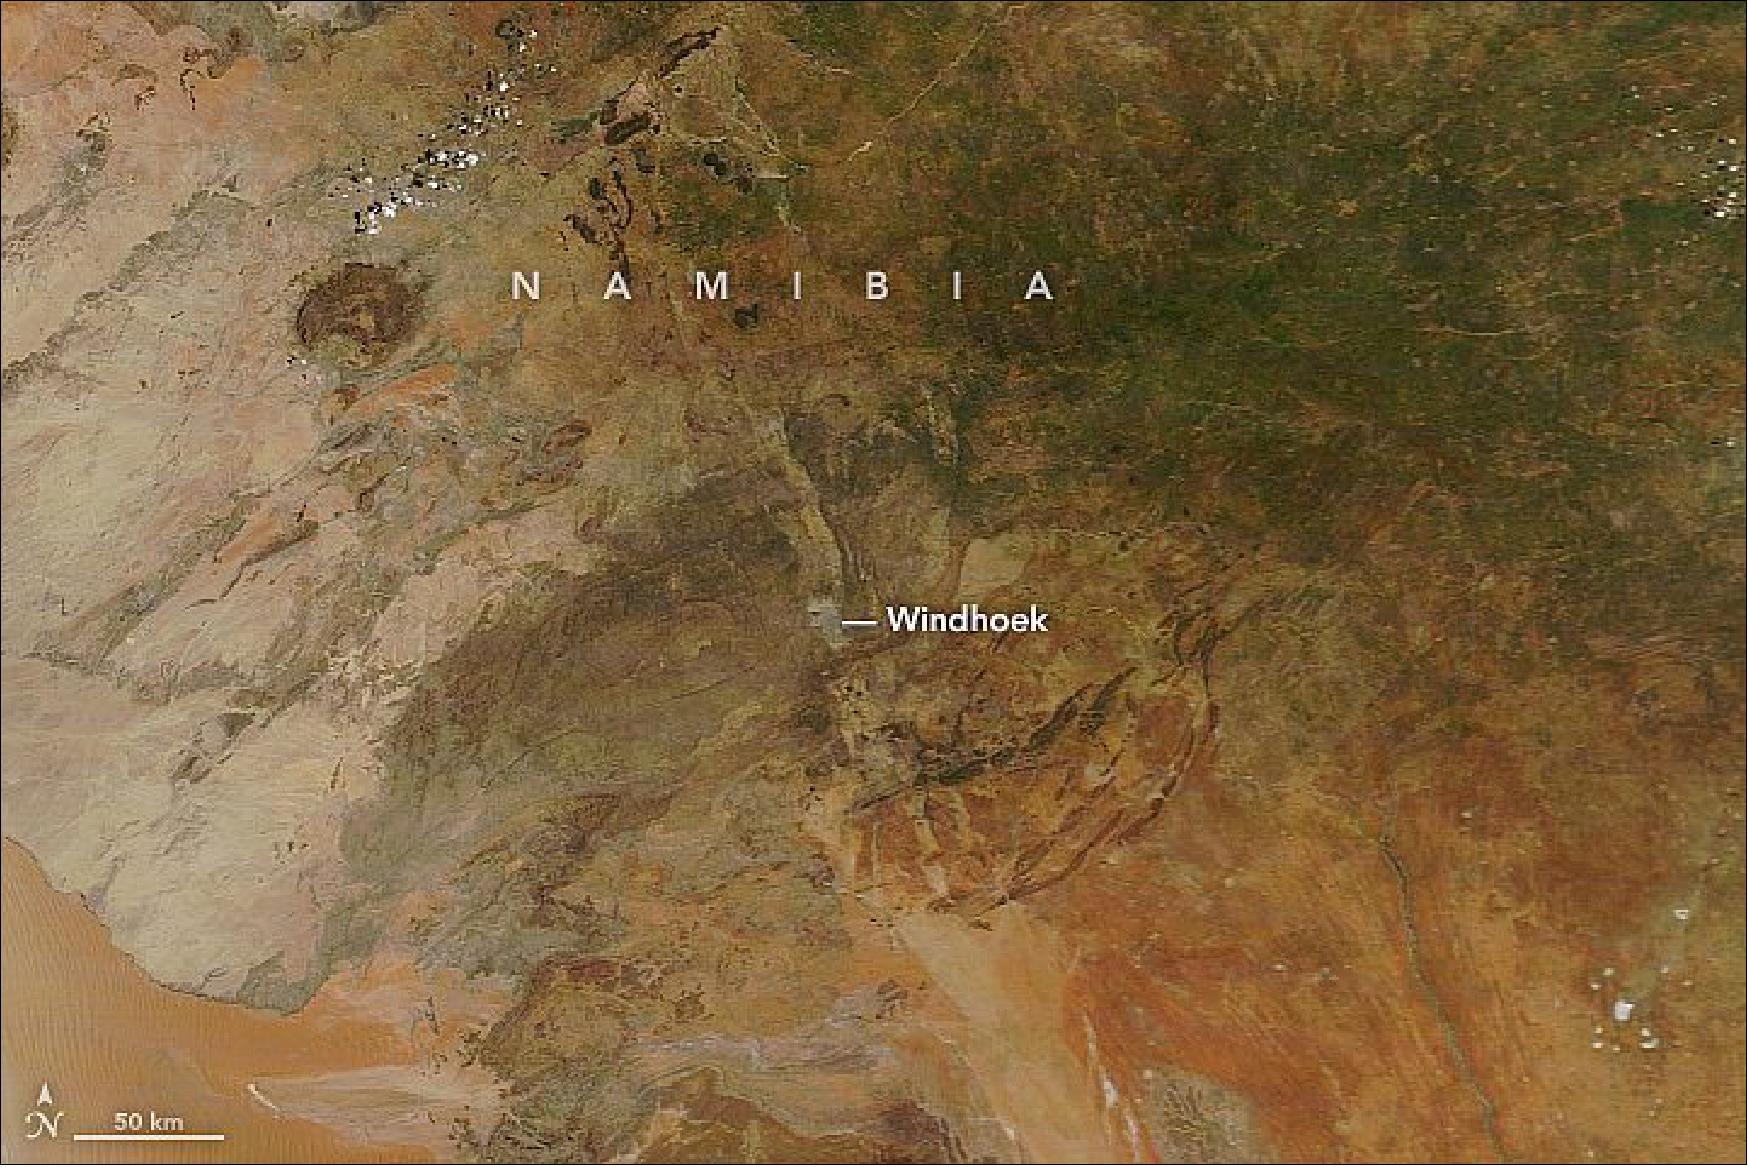
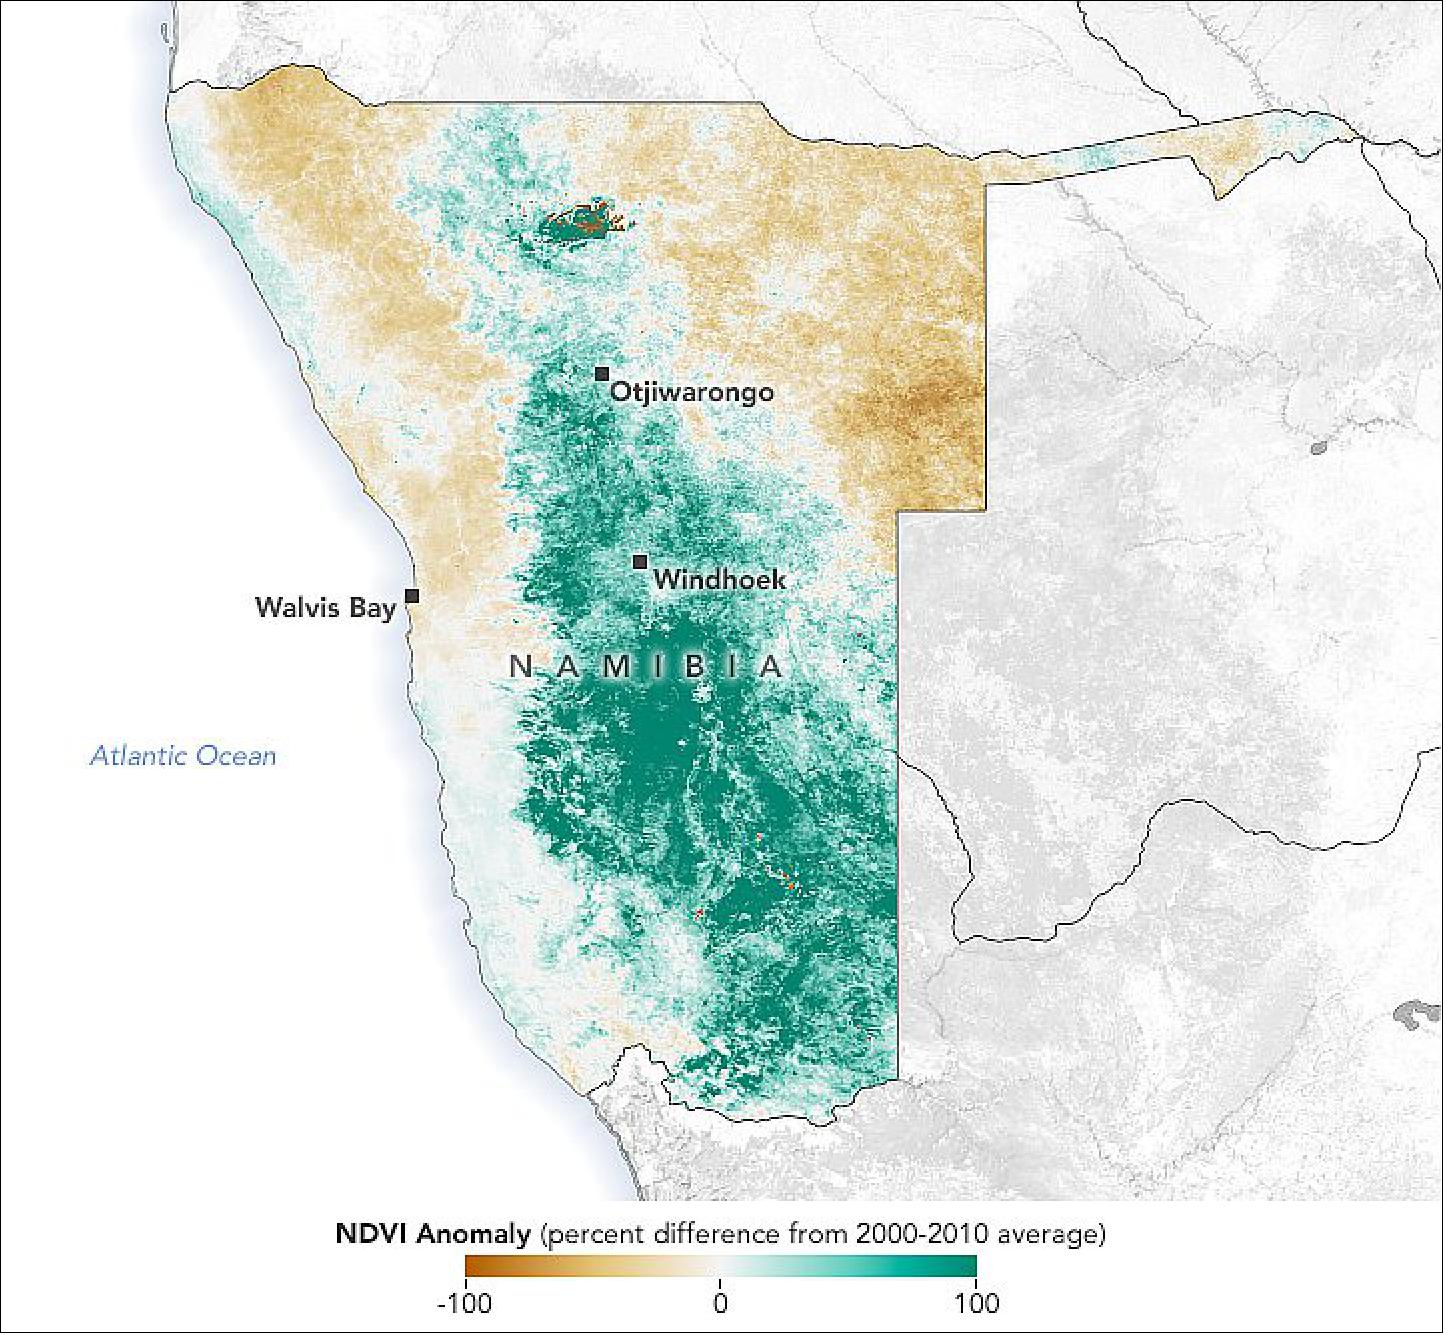
• February 16, 2021: With approximately 300 days of sunshine annually, and persistent, dry onshore winds provoked by the Benguela current, Namibia is quite dry for much of the year. The rainy season (November through April) is modest by most precipitation standards in the world. This year, it has brought an abundance. 28)
- January 2021 saw rainfall totals double to triple the norm in the northeastern, central, and southern parts of Namibia. According to a weather monitor in Windhoek, 228 mm (9 inches) of rain fell in January; the long-term average is 85 mm (3 inches). The period of relatively abundant rains followed a December that brought about 25 percent more rain than normal. The wet season rainfall totals are the highest since 2010 and 2011. (This map shows precipitation anomalies as recorded by NOAA's Climate Prediction Center.)
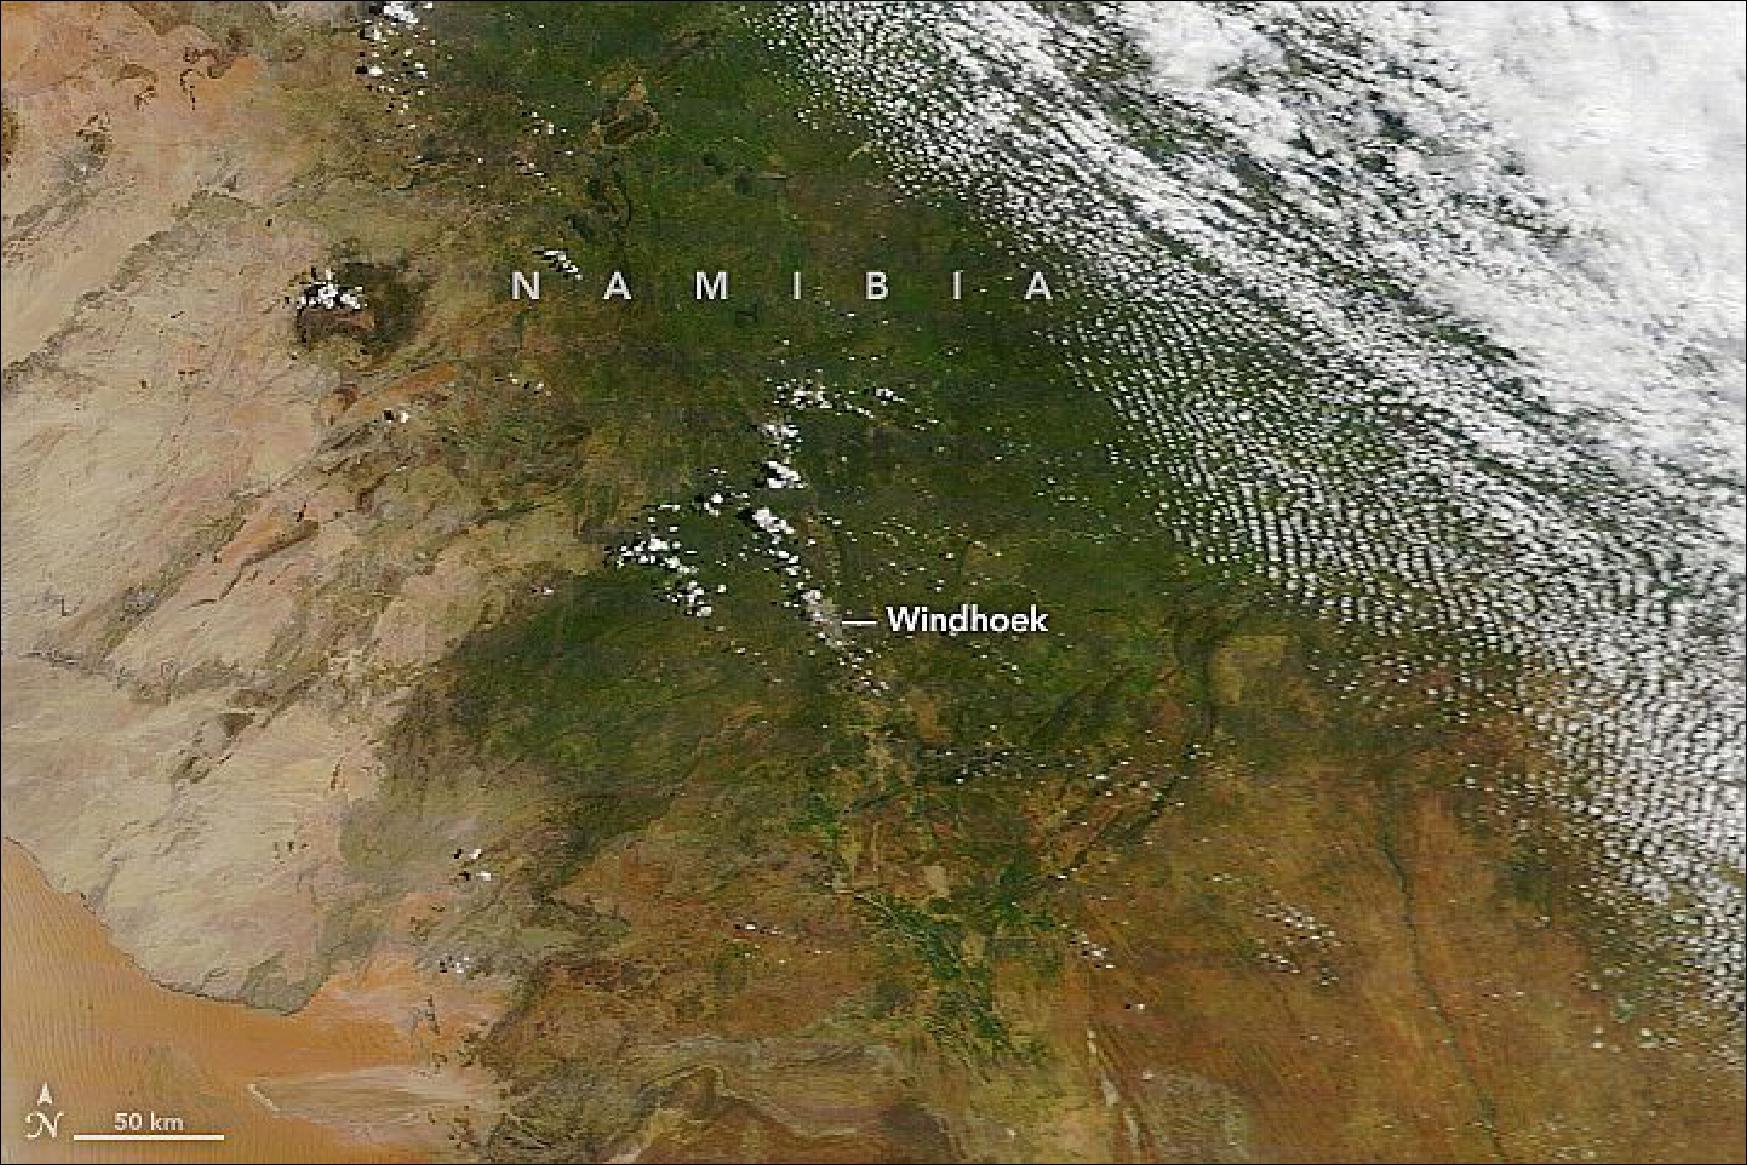
- The strong rainfall has been a boon to farmers in the region, as nearly half of Namibia's people depend on subsistence farming. The extra rain has filled many reservoirs behind the country's dams. At the same time, the typically dry region has sporadic storm-drain systems, and some roads are poorly equipped to handle heavy rain. Flash floods and overflowing ephemeral rivers posed problems for much of January.
- "It has been a good year for sure, even across into Botswana and South Africa," wrote Frank Eckardt, a researcher at the University of Cape Town. "We had similar good rains in 2000 and 2011. There is a periodicity to it, which is essential for replenishing surface and groundwater storage. It will also provide much grazing for lifestock and, later, biomass for burning. By April the rains will be gone." He noted, however, that the region has been getting drier over the long term.
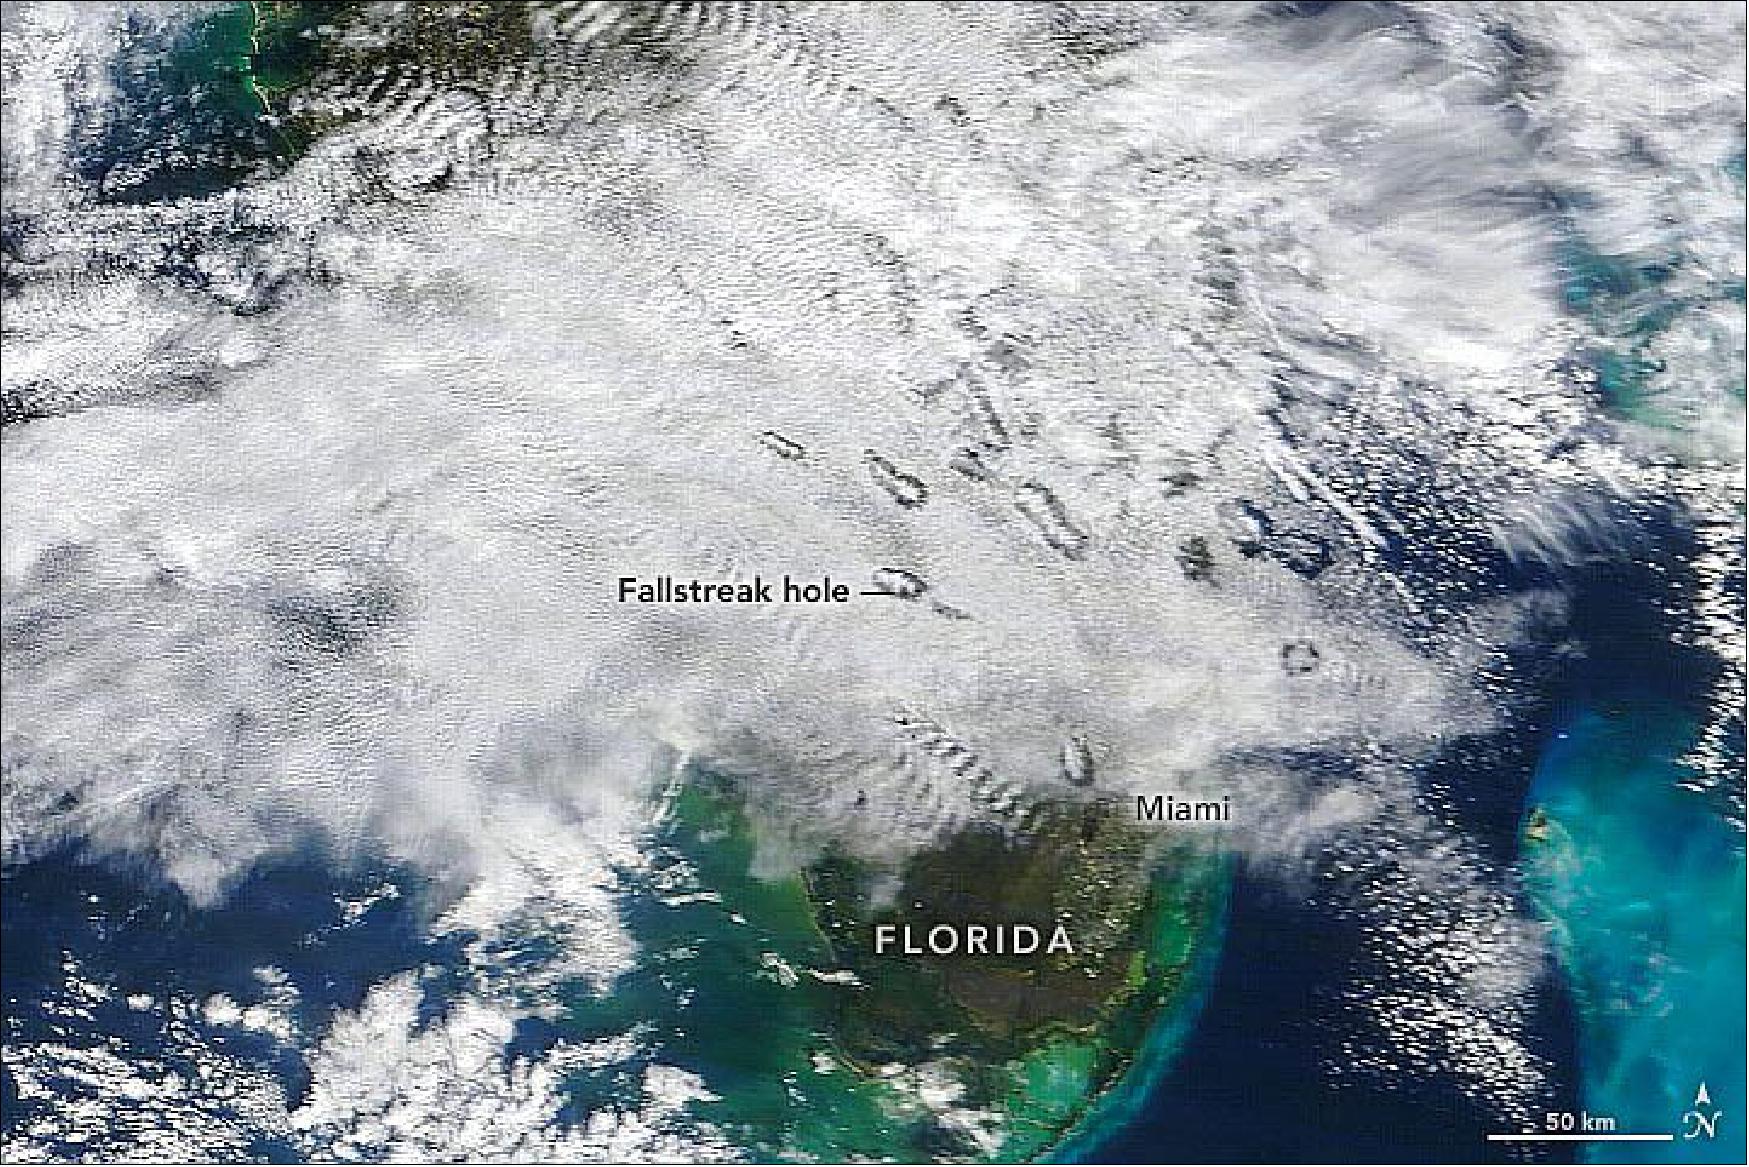
• February 8, 2021: In January 2020, the sky over Sweden delivered an early valentine to people on the ground in the form of a heart-shaped hole in the clouds. Unfortunately, the sky appeared heartless to NASA satellites looking down from above. But other cases of the unusual atmospheric display—so-called "fallstreak holes"—dotted the sky that month over the southern United States. 29)
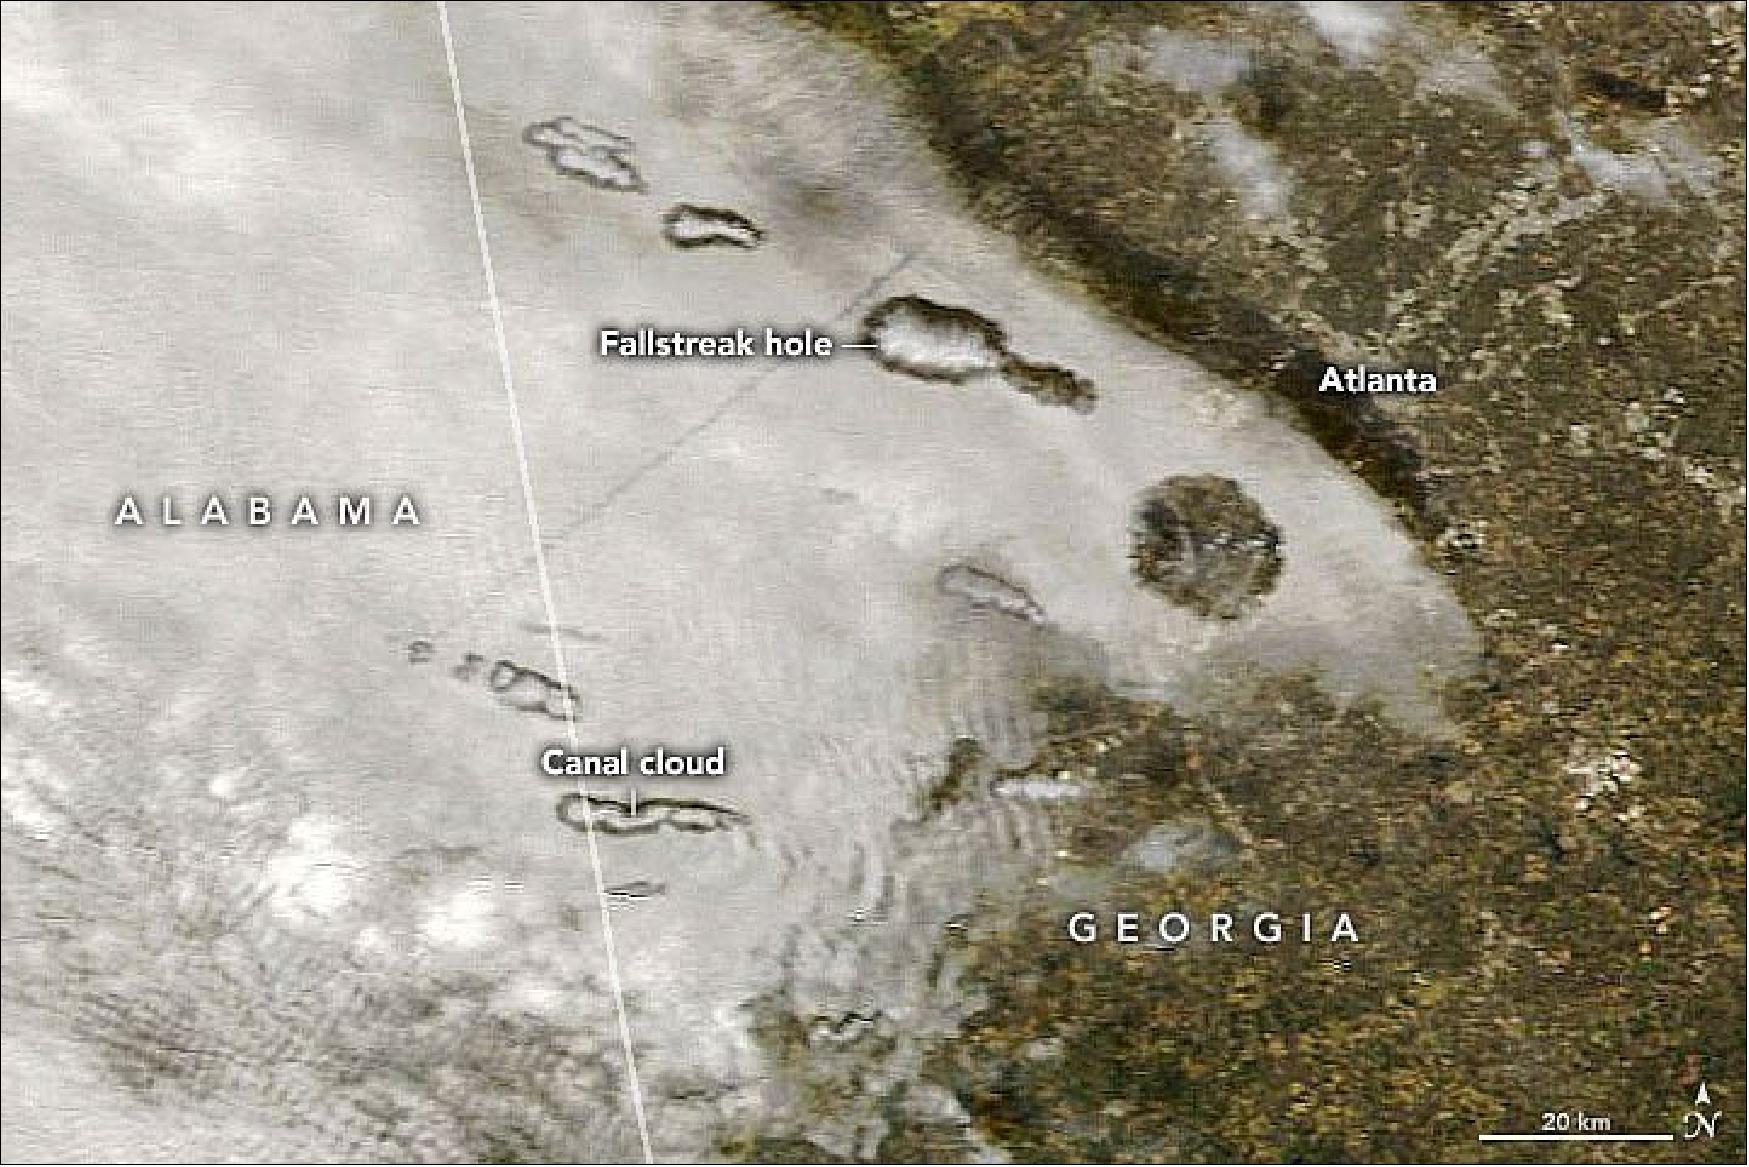
- Fallstreak holes, also known as hole-punch clouds, are the result of cold air temperatures and atmospheric instability. Viewed from below, it can appear as if part of the cloud is falling out of the sky. As it turns out, that is actually what's happening.
- The phenomenon occurs in mid-level clouds composed of liquid water droplets that are super-cooled; that is, the droplets remain liquid even when temperatures are below the typical freezing point of water (32°F, or 0°C). But even super-cooled droplets have their limits. The additional cooling that occurs over the wings of aircraft, for example, can push the droplets to the point of freezing as an airplane passes through the cloud layer. Ice crystals beget more ice crystals as the liquid droplets continue to freeze. They eventually grow heavy enough that the ice crystals fall out of the sky, leaving behind a void in the cloud layer.
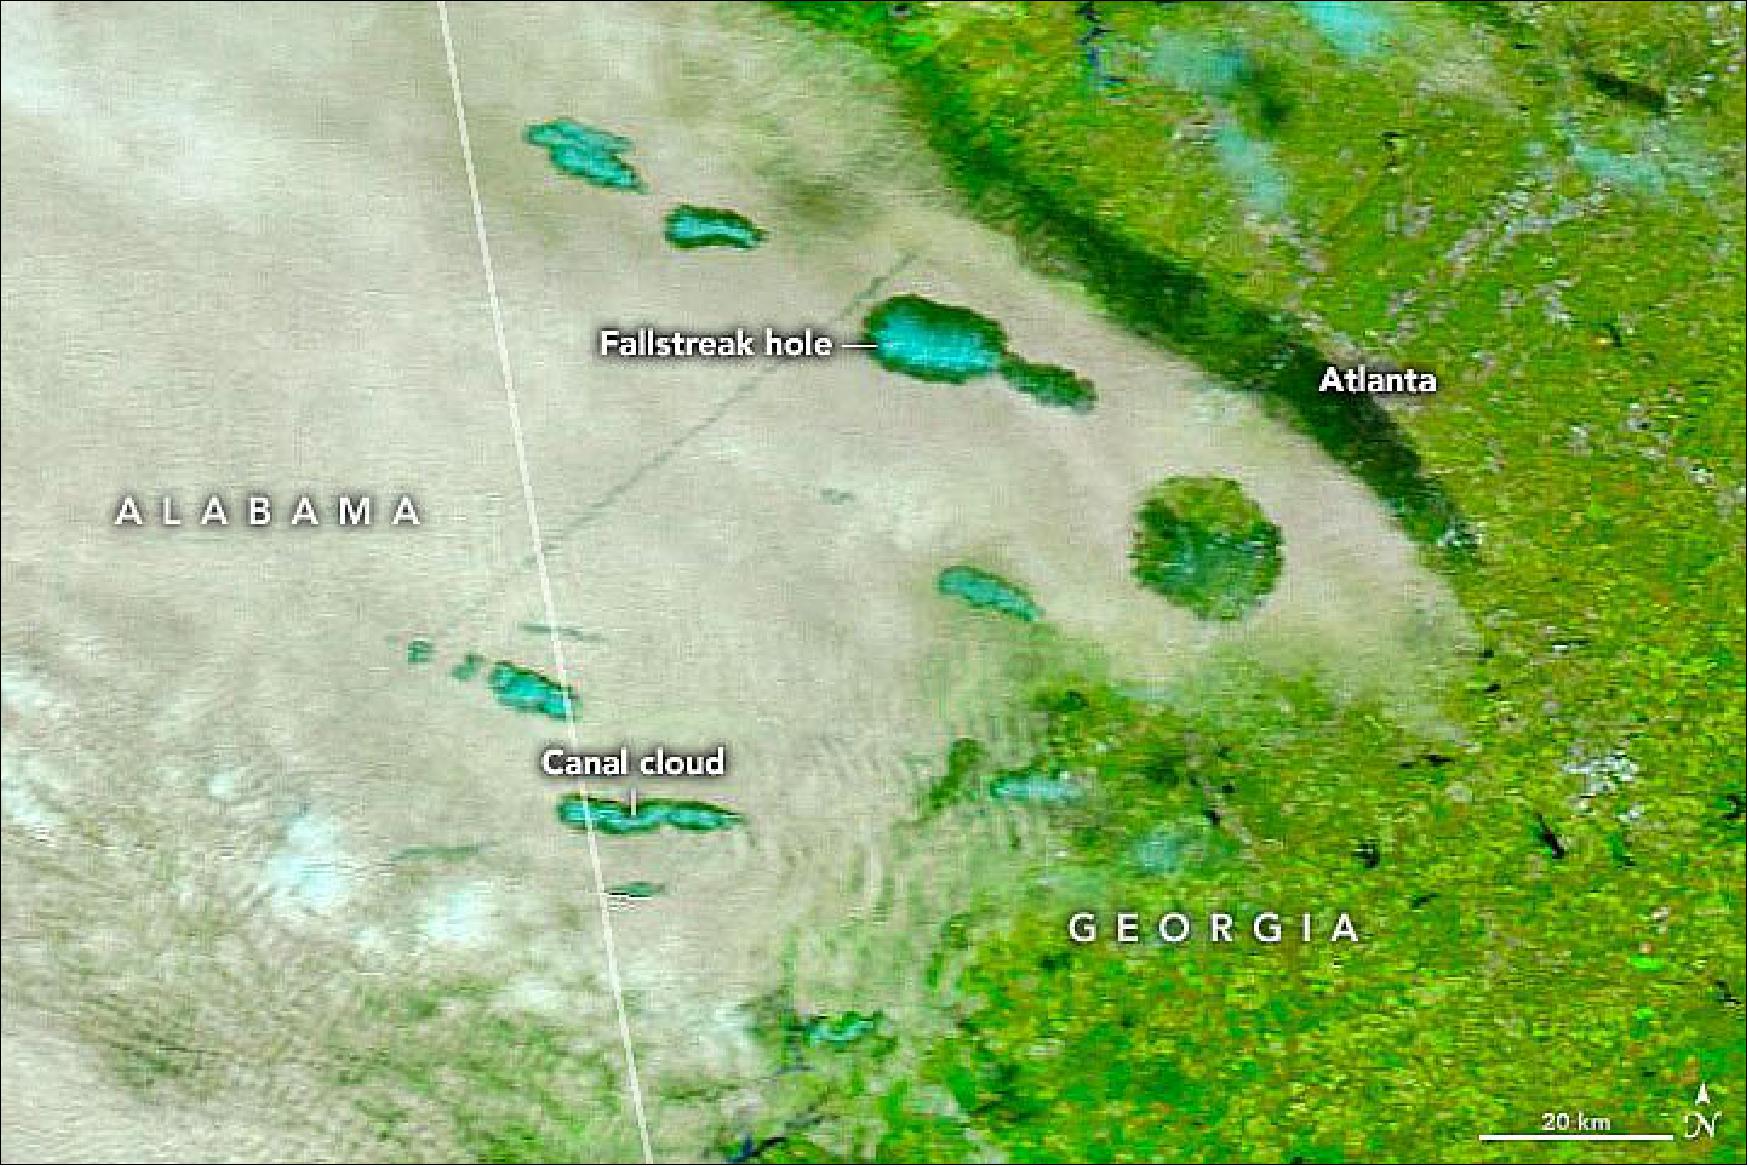
- The falling ice crystals are often visible in the center of the holes. They are especially apparent in the false-color image at the top of this page, which uses a combination of infrared and visible light (MODIS bands 7-2-1) to distinguish between water and ice. In this view, ice clouds (blue) appear centered within the voids in the water clouds (white).
- Both ascending and descending aircraft are a common trigger for fallstreak holes and their longer, skinner cousins, canal clouds. It is no coincidence that the holes are located near busy airport hubs.
• February 4, 2021: With winter in full swing, the Wasatch and Uinta mountains in the Southern Rockies are still building their snowpack. Come springtime, snowmelt will be flowing downstream, delivering important water resources to lakes, reservoirs, and people. The question is: when does all this melting begin? 30)
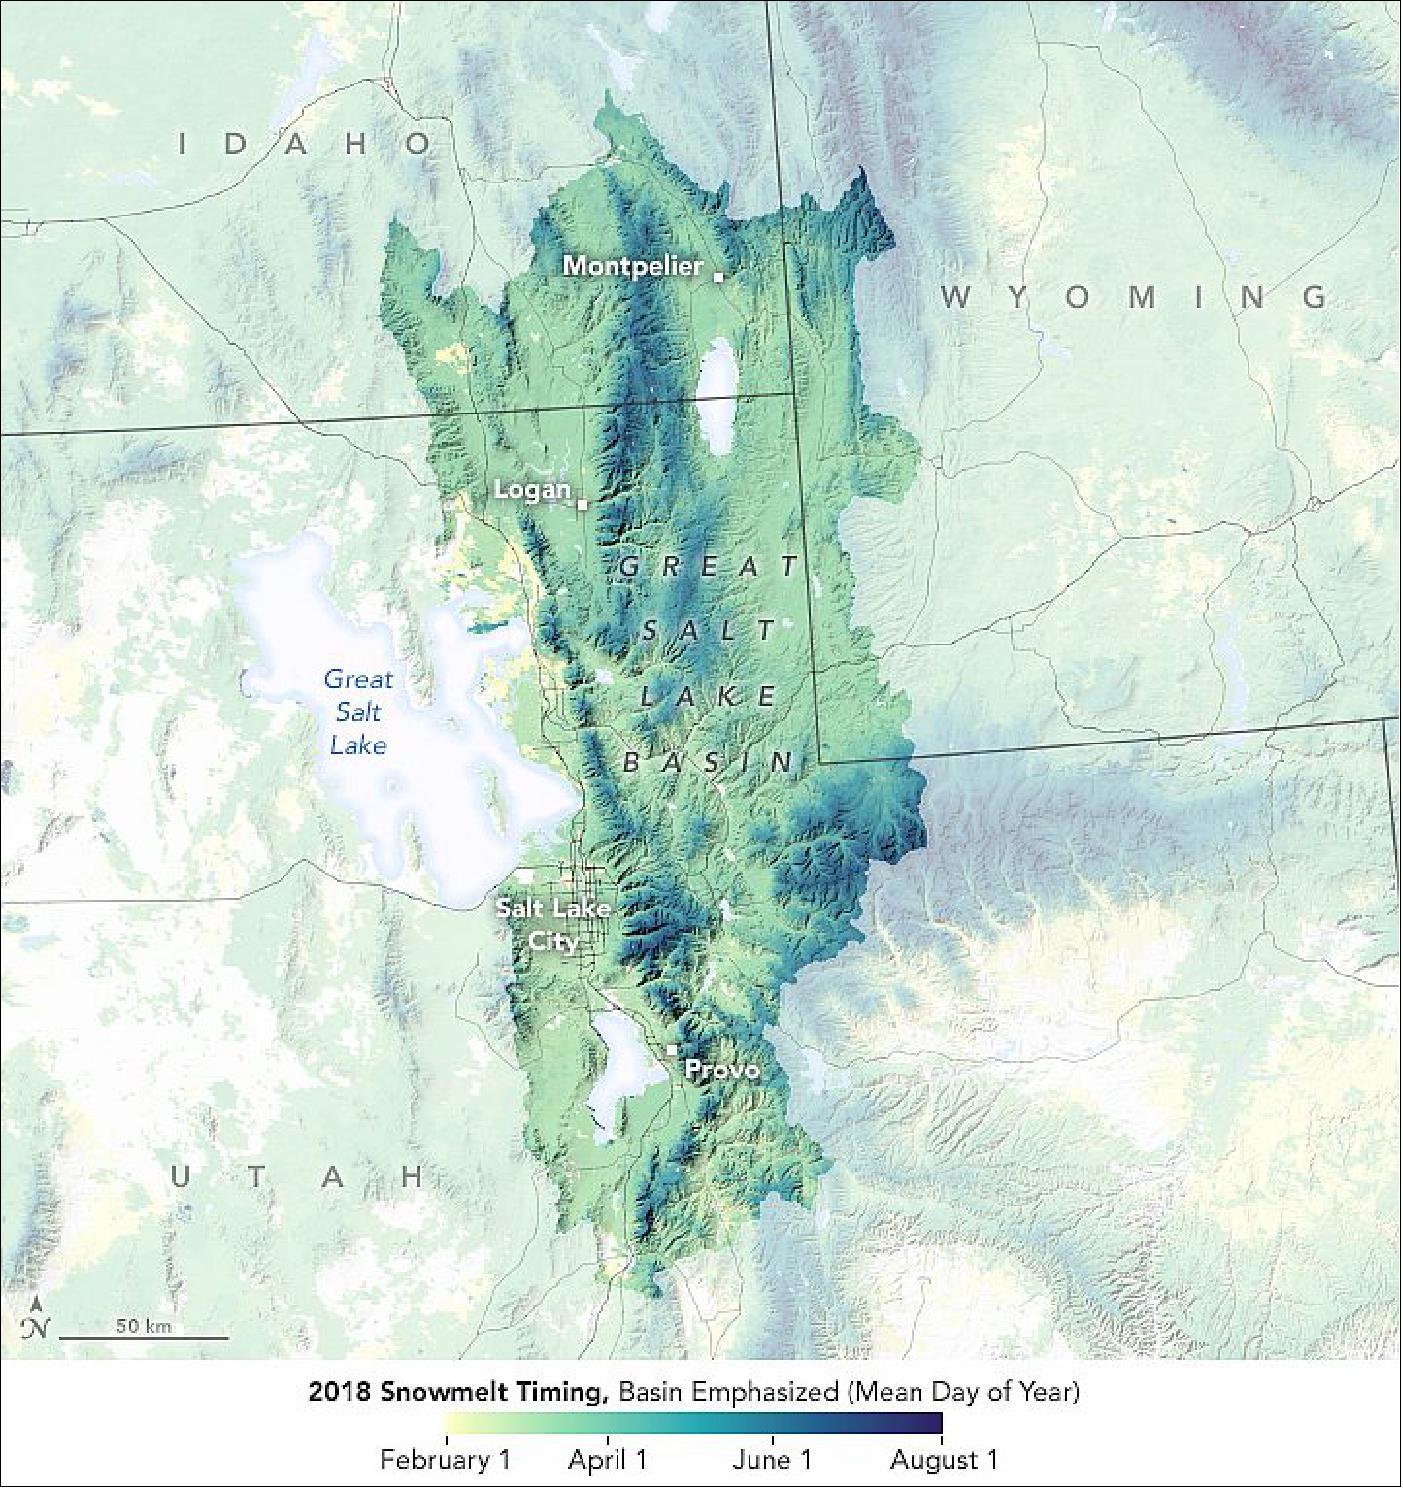
- "Most of North America is covered in snow in the winter, but the timing of when the snow comes and goes can be very different from place to place," said Donal O'Leary, a scientist at Battelle Memorial Institute's National Ecological Observatory Network, and author of the snowmelt timing maps. "These maps show the date that the snow melted away completely, exposing the bare earth below."
- O'Leary noted that snowmelt timing maps have primarily been used in studies of spring vegetation phenology; that is, how the melting of snow influences the emergence of grasses and flowers, which in turn influences things like animal hibernation and migrations.
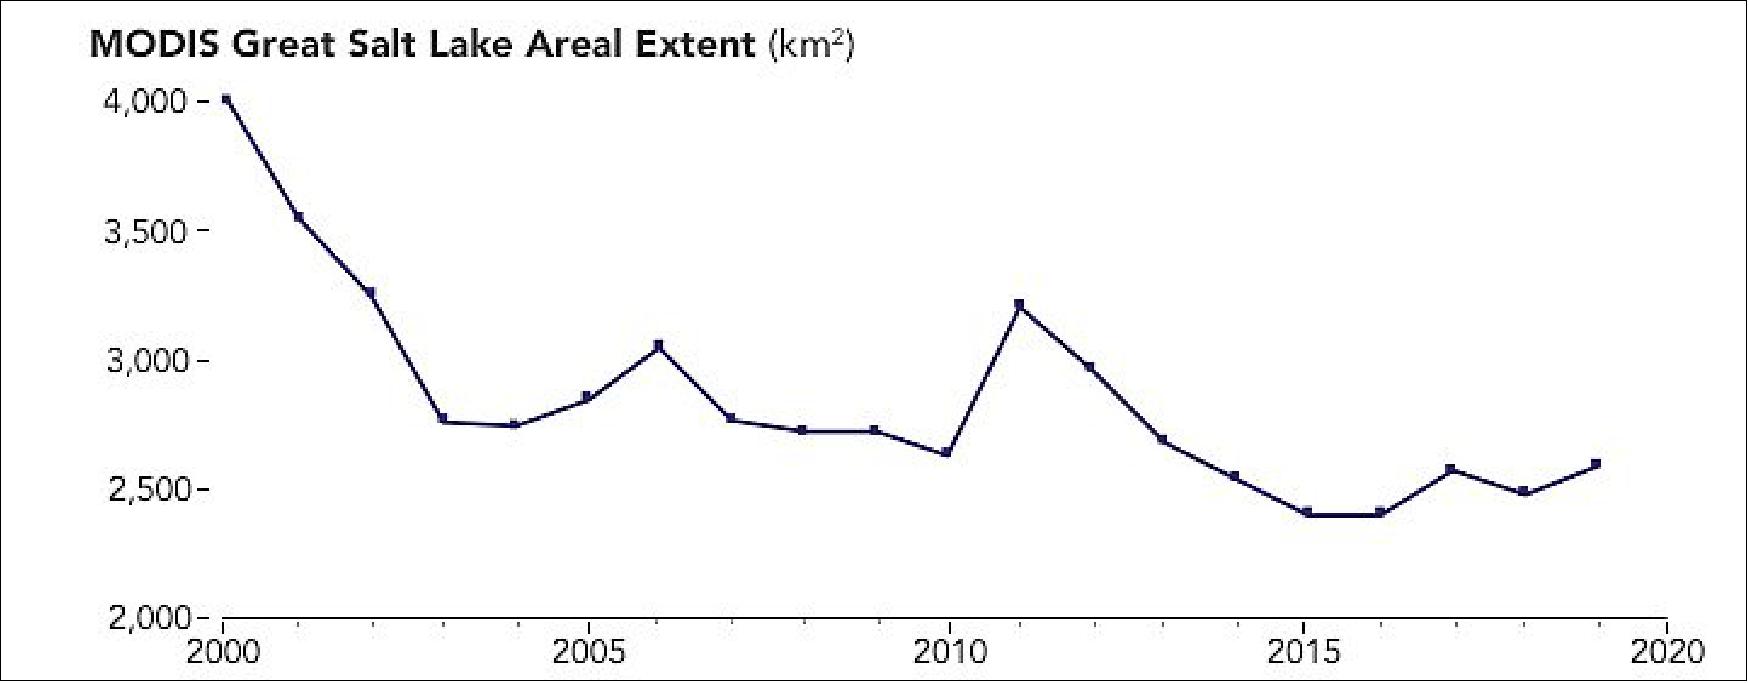
- The water flowing into the Great Salt Lake comes primarily from streams and rivers (66 percent)—most notably from the Bear, Jordan, and Weber rivers that run down from the mountains. Contributions also come from rain and snow falling directly on and around the lake (31 percent) and from groundwater (3 percent).
- "We have the tools now—satellites and ancillary geophysical data—combined with two decades of MODIS data that allow us to study the environmental contributions to the desiccation of the Great Salt Lake and other terminal lakes," said Dorothy Hall, a research scientist at the Earth Science Interdisciplinary Center at the University of Maryland.
- Hall and colleagues showed in recent research that melting in the Great Salt Lake basin has generally been trending earlier since 2000, the start of the MODIS era. By 2018, snow in the Great Salt Lake basin east of the lake had melted on average more than a week earlier than in 2000.
- Premature melting skews the water cycle, allowing more runoff to be lost to the atmosphere through evaporation as the water flows from the mountains to the lake. Hall notes, however, that the relative contribution of this early snowmelt to the lake's desiccation is not yet clear. "The magnitude of the snowmelt is a very important source of runoff that ends up in the Great Salt Lake," Hall said. "But so far we have not been able to separate the effects of climate change from the effects of consumption for human uses."
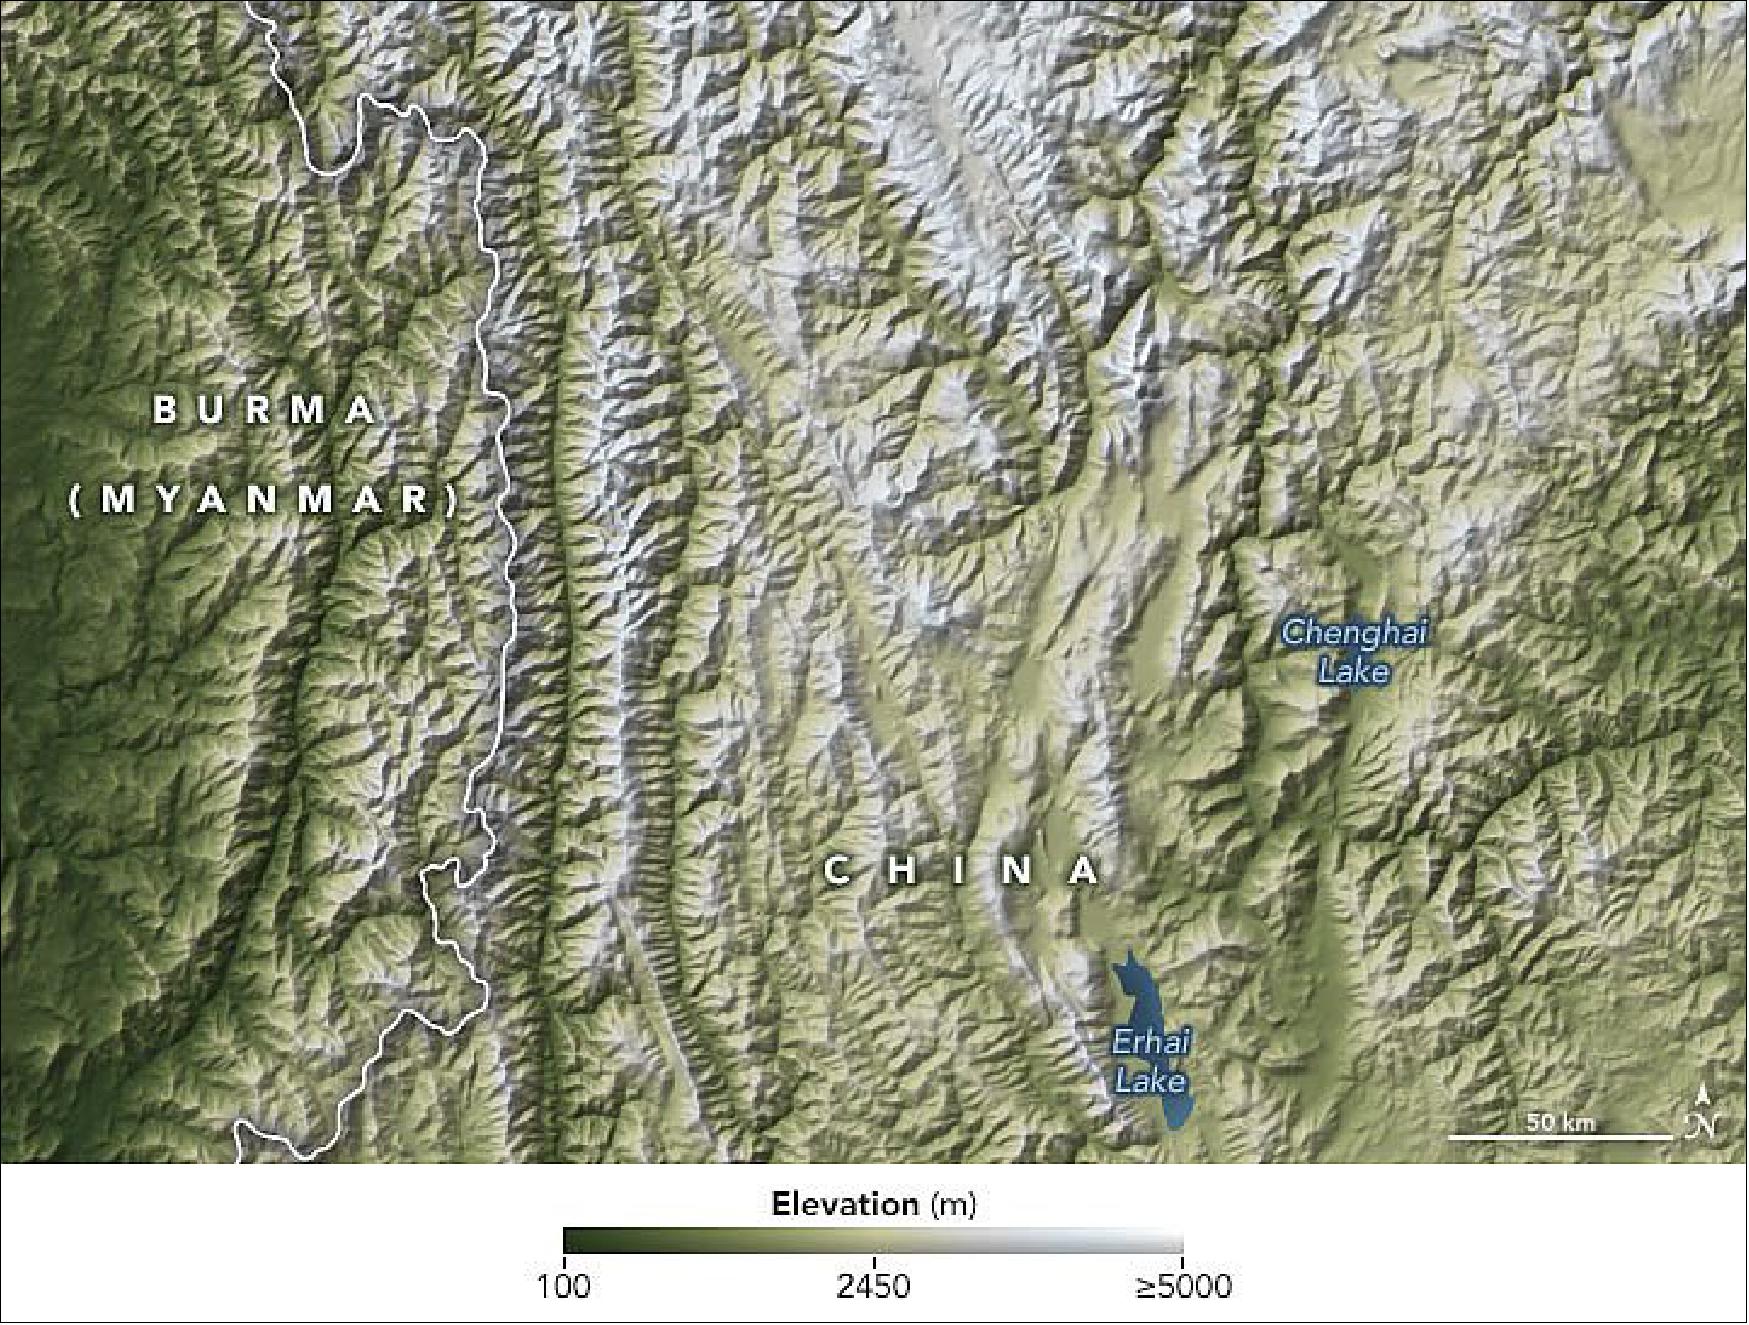
• January 27, 2021: In the Chinese province of Yunnan, soaring mountain ridges flank a series of deep river gorges. The ridges rise well above 5000 meters (16,000 feet), while the lower parts of the gorges lie just a few hundred meters above sea level. 31)
![Figure 46: When the MODIS instrument on NASA's Terra satellite observed the region on January 6, 2021, one of the most striking features was an ephemeral one—long rows of parallel clouds that traced some of the ridges [image credit: NASA Earth Observatory images by Joshua Stevens, using MODIS data from NASA EOSDIS LANCE and GIBS/Worldview and topographic data from the Shuttle Radar Topography Mission (SRTM). Story by Adam Voiland]](https://eoportal.org/ftp/satellite-missions/t/Terra2021_050422/Terra2021_Auto3E.jpeg)
- These orographic clouds form when the shape of the landscape (in this case, the ridges) forces moist air up to altitudes high enough and cold enough for the water vapor to condense. After the air passes over the ridges, it sinks downward again, allowing the air to warm as it descends and preventing clouds from forming until another ridge forces the air upward again. Orographic clouds can take many shapes and forms, but they move slowly and often appear stationary because their formation is so dependent on the shape of the land surface below.
- Between the rows of clouds, look for glimpses of the headwaters of three of Asia's major rivers: the Jinsha (Yangtze), Lancang (Mekong), and Nujiang (Salween). Parts of two large lakes (Erhai and Chenghai) are also visible. The rivers and rugged terrain comprise part of the Three Parallel Rivers of Yunnan Protected Areas—a UNESCO World Heritage Site.
- The site is known as one of the most biodiverse areas in a temperate climate. According to one estimate, the area hosts at least 6,000 species of plants, 173 species of mammals, and 417 species of birds.
• January 25, 2021: Nearly 75 percent of Kenya's people rely on farming for their food and income, so environmental issues like drought, locusts, and climate change can put many lives and livelihoods at risk. Crop insurance programs can help mitigate those risks, but it is not always easy to know where resources are needed. Now NASA-funded scientists are working with colleagues in Kenya to make better assessments of agricultural needs through the use of satellite data. 32)
- In the first few years of the country's crop insurance program, Kenyan agriculture agents collected much of their information through in-person visits, traveling to individual farms to determine how crops were performing and if financial assistance was necessary. It was labor-intensive and time-consuming. Officials urgently needed timely information spanning vast areas of the country—and that is where NASA Earth observations came in.
- "We suggested that instead of looking for farmers, we look at fields by using products derived from NASA satellite data," said Catherine Nakalembe, a geographical scientist at the University of Maryland and a leader of the Africa section of the NASA-funded Harvest program. By adding satellite observations into their models and calculations, managers of Kenya's agricultural insurance program could more readily assess critical information necessary to help farmers.
- Grants from the USAID-NASA SERVIR program allowed the Harvest team and the Regional Center for Mapping of Resources for Development (RCMRD) to incorporate satellite data on rainfall, soil moisture, and land use in ways that can inform Kenya's agriculture monitoring programs. It also supported efforts to assess crop conditions from afar by using a technique called "cropland masks." These mapping tools use computer analyses of satellite images and data to build highly localized views of where crops are growing and the health of those fields. The Kenyan ministry and researchers in the RCMRD can then confirm the satellite data by sampling crop conditions on the ground.
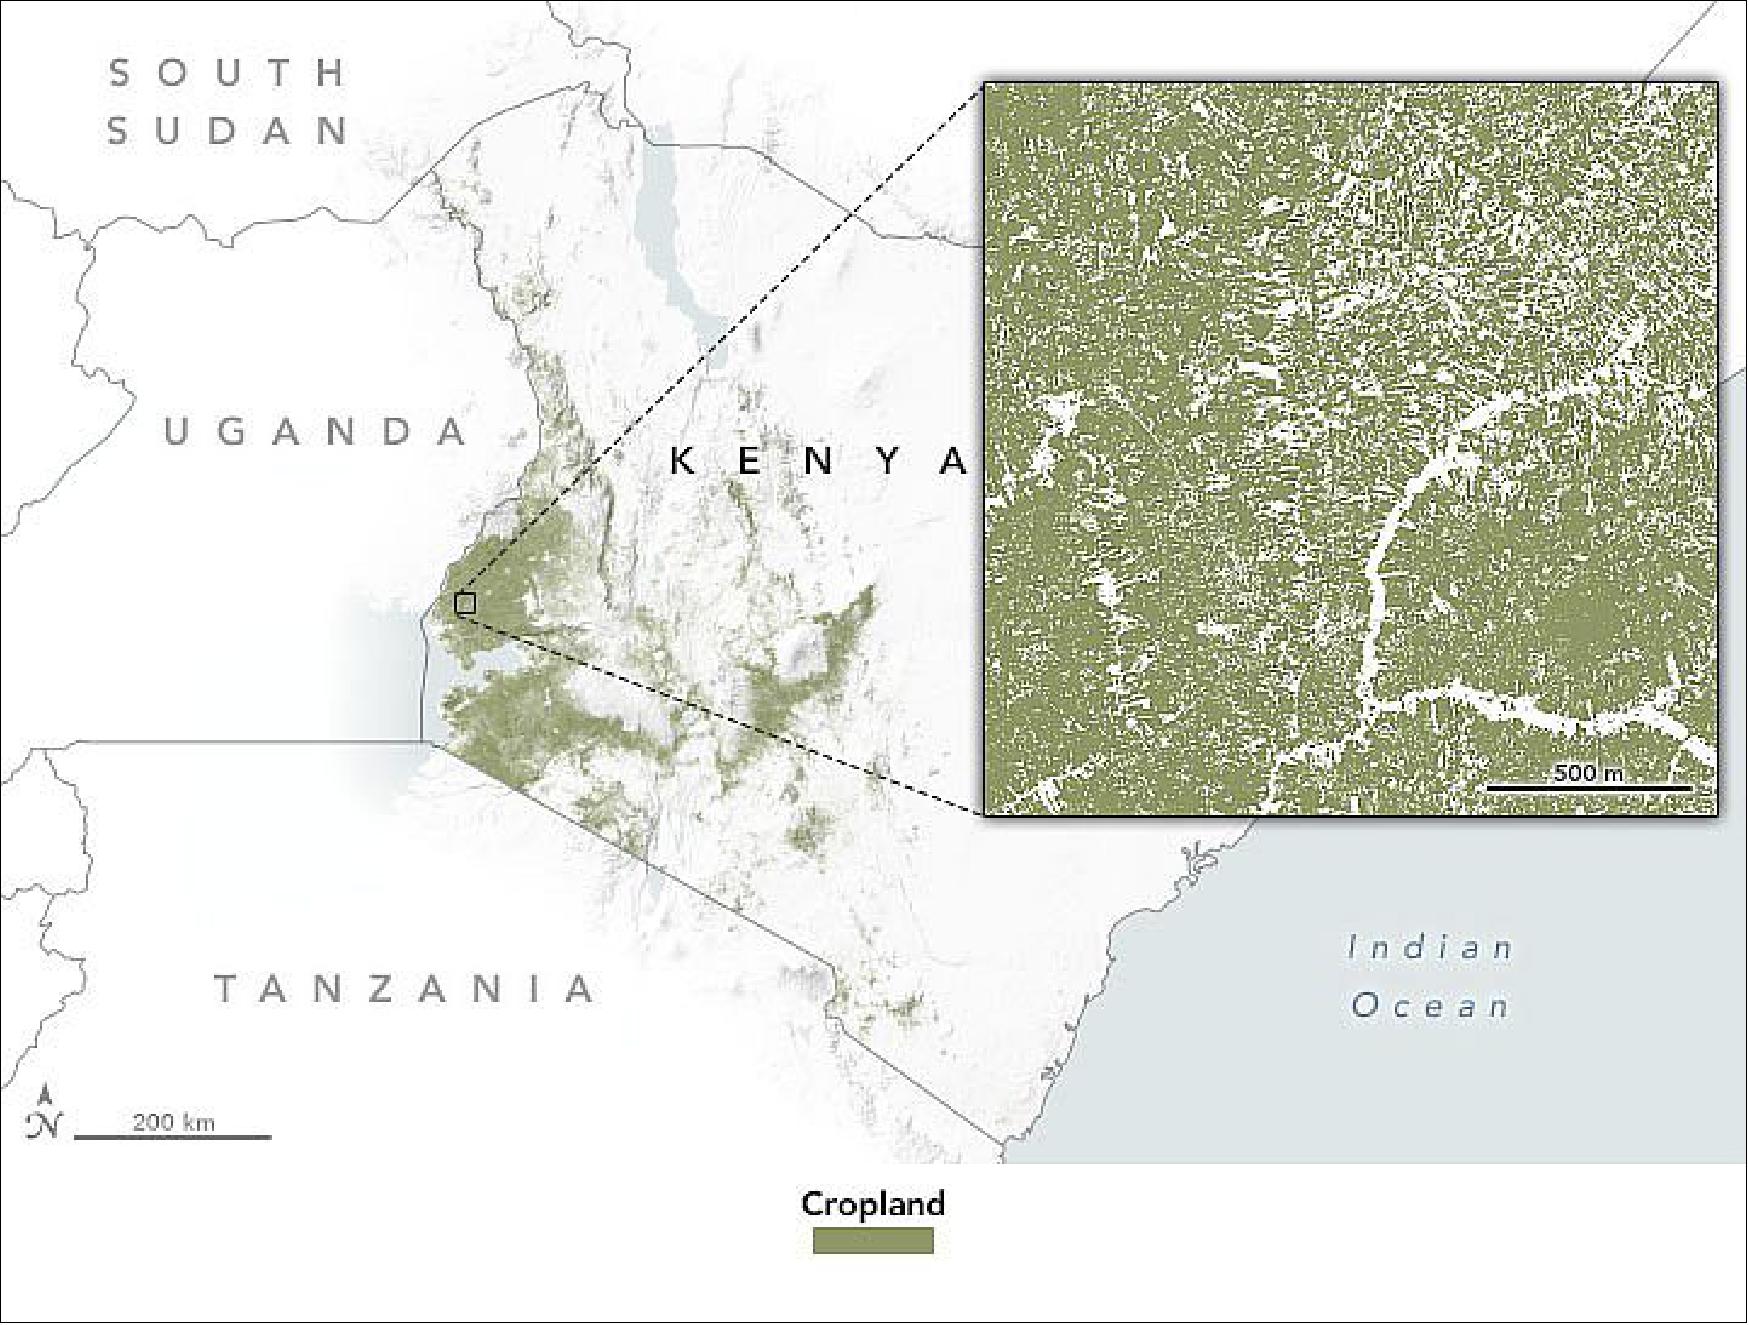
- If project plans come to fruition, the cropland masks will eventually inform efforts like the Crop Conditions Bulletin, released monthly by the Kenyan Ministry of Agriculture. Researchers currently produce broad national maps indicating where conditions are favorable or unfavorable for specific crops such as maize. With such data, agriculture ministers can more quickly discern where to focus their evaluation and monitoring efforts.
- SERVIR is a joint venture between the U.S. Agency for International Development (USAID) and NASA's Earth Applied Sciences Program. Named for the Spanish and French word "to serve," the program provides Earth observations and research to help developing countries address critical challenges in food security and other environmental issues. The SERVIR hub in Eastern and Southern Africa is regionally implemented by RCMRD.
• January 8, 2021: The Goldilocks zone typically refers to the habitable area around a star where conditions are right for the existence of liquid water and possibly life. But on Earth, the South Atlantic Ocean has its own kind of Goldilocks zone. In spring and summer, conditions in the Argentine Sea off Patagonia often become just right for phytoplankton, and populations of the plant-like organisms explode into enormous blooms. 33)
![Figure 50: In late 2020, satellite images started to show the colorful signature of phytoplankton blooms off the coast of Argentina and around the Falkland Islands (Islas Malvinas). Vivid greens and blues still swirled in the sea on January 5, 2021, when the MODIS instrument on NASA's Terra satellite acquired this natural-color image [image credit: NASA Earth Observatory images by Lauren Dauphin, using Landsat data from the U.S. Geological Survey and using MODIS data from NASA EOSDIS LANCE and GIBS/Worldview. Story by Kathryn Hansen, with image interpretation from Barney Balch (Bigelow Laboratory for Ocean Sciences), Ana Dogliotti (Institute for Astronomy and Space Physics-CONICET/UBA), and Vivian Lutz (CONICET/INIDEP)]](https://eoportal.org/ftp/satellite-missions/t/Terra2021_050422/Terra2021_Auto3A.jpeg)
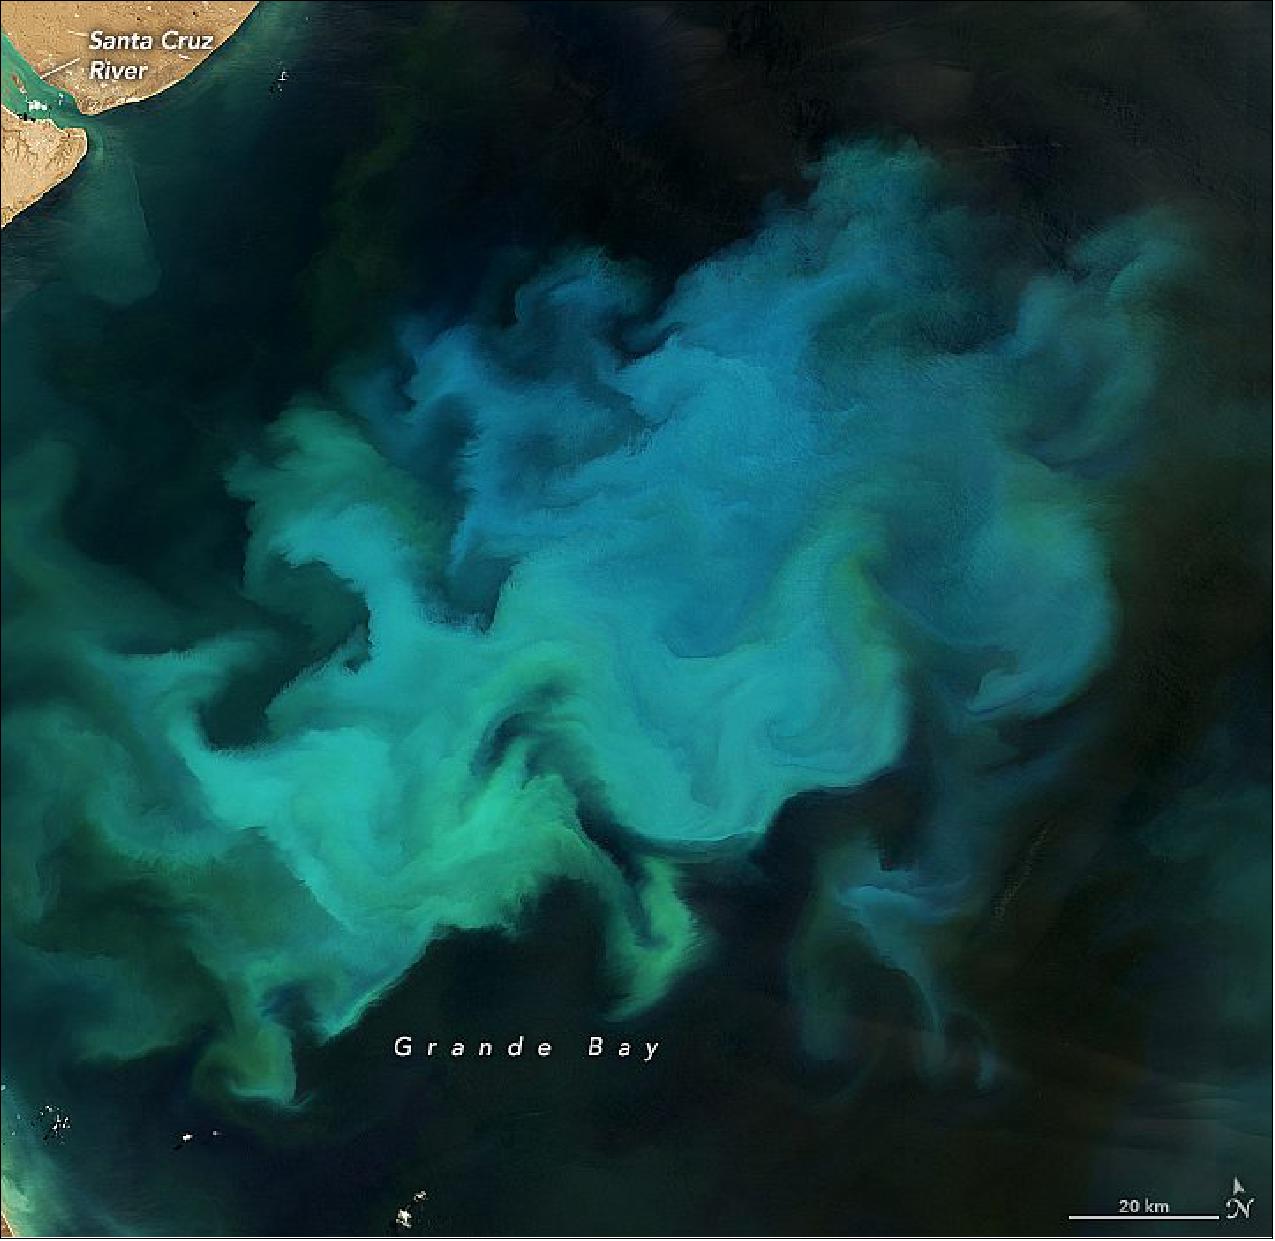
- Rivers like the Santa Cruz carry nutrients from the land and deliver them to the ocean, promoting phytoplankton growth. (Suspended sediment could be contributing some of the color visible in these images.) Another source of nutrients is dust from Patagonia, which strong westerly winds can carry offshore and drop on the ocean surface.
- But phytoplankton blooms are also stimulated by the ocean's complex circulation patterns and abundant fronts—where separate water masses (with distinct temperatures, saltiness, and nutrients) meet. At the Brazil-Malvinas Confluence, for example, warm, saltier tropical waters flow south and meet the cooler, fresher waters flowing north from the Southern Ocean. Along a front, the rising of a less-dense water mass can carry nutrients up to the surface, where phytoplankton also have ample sunlight to fuel their growth.
- Without a physical sample, it's not possible to say for sure which type of phytoplankton are present in these images. Scientists found dinoflagellates (Prorocentrum minimum) while collecting samples during an intense bloom in spring 2005; diatoms (Chaetocceros debilis) dominated a bloom in early summer 2003. Both phytoplankton groups tend to appear various shades of green in satellite images. In December 2008, scientists also found a dense bloom of coccolithophores (Emiliania huxleyi), which tend to turn the ocean a chalky green-blue.
- Notice the color gradients across the images. Bright green areas could be a mix of dinoflagellates, diatoms, and coccolithophores; in the bluer areas, coccolithophores likely dominate. Coccolithophores can continue to grow in waters where iron has been depleted, whereas diatoms need both silicate and iron.
- Whichever species were blooming, their abundance indicates the biological richness along Patagonia's continental shelf, which is the site of some of the world's richest fisheries.
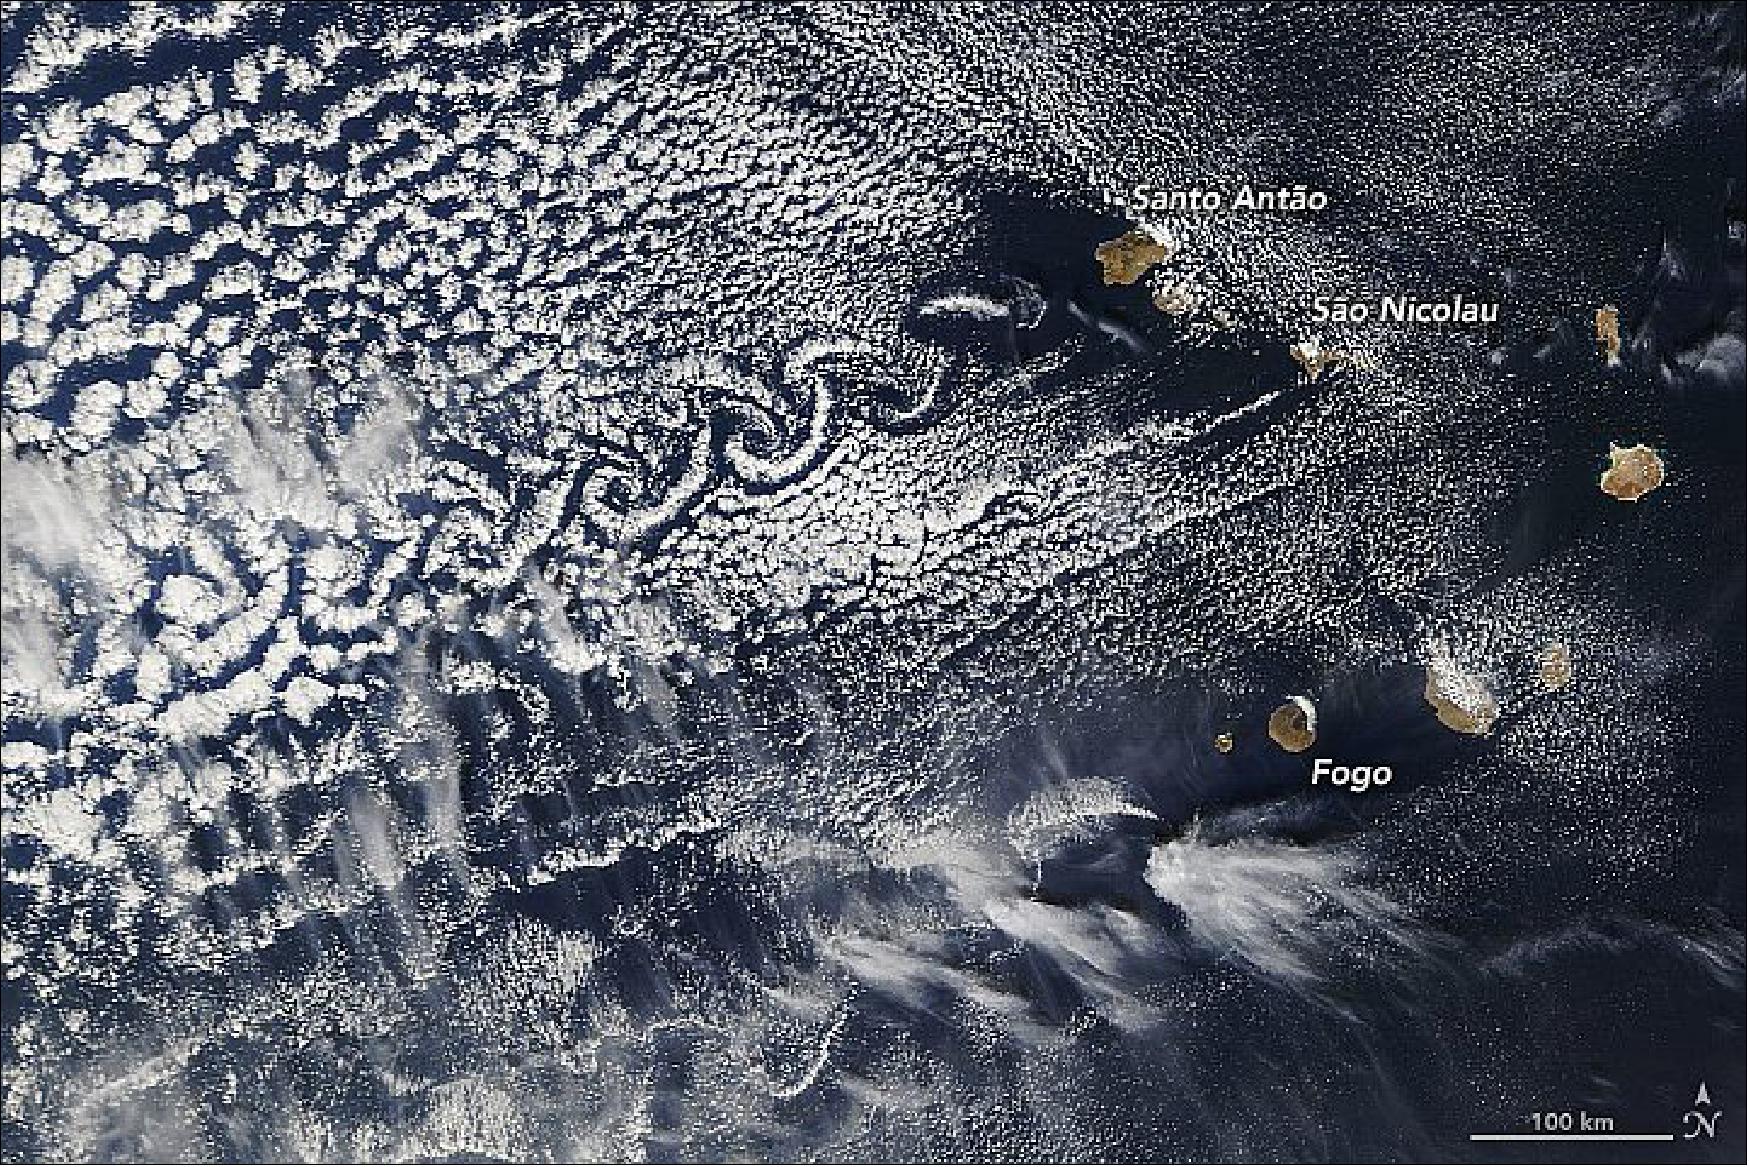
• January 5, 2021: On a clear day, the towering peaks on Fogo, Santa Antão, and São Nicolau stand out amid the flatter islands of Cabo Verde (Cape Verde). These three volcanic islands, the tallest in the archipelago, stand high enough to generate rain shadow effects that support unique dry forests on some of the islands. 34)
- The height also helps these islands disturb passing air masses and clouds in a way that Theodore von Kárman—an accomplished mathematician, aerospace engineer, and one of the Jet Propulsion Laboratory's founders—likely would have appreciated. The trails are called von Kármán vortex streets, a distinctive pattern that can occur when a fluid passes a tall, isolated, stationary object. In 1912, von Kármán was the first to describe the oscillating flow features in mathematical terms while he was working as a graduate assistant for the pioneering German fluid dynamicist Ludwig Prandtl.
- Though a French scientist was the first to photograph the feature, von Kármán's key insight was a mathematical proof demonstrating that staggered vortices were the most lasting flow pattern that such features can produce. "I found that only the anti-symmetric arrangement could be stable, and only for a certain ratio of the distance between the rows and the distance between two consecutive vortices of each row," von Kármán later wrote about the discovery. In other words, the vortices are always offset and never line up.
- Von Kármán was a student at the University of Göttingen (Germany) when he made his insight about the vortices. He remained in Germany until 1930, with a three-year interruption to serve in the Austro-Hungarian army. Concerned about the rise of the Nazis in Germany, von Kármán accepted an offer to direct the new Daniel Guggenheim Aeronautical Laboratory at the California Institute of Technology in 1930. That lab later became NASA's Jet Propulsion Laboratory in 1958.
• January 3, 2021: Transformation is common around the Aral Sea. Perhaps the most obvious shift has been the shrinking of the inland lake since the 1960s and its separation in 2007 into three distinct basins. But this region of Central Asia transforms in other ways, too: from hot and dry in the summer to cold and snowy in the winter. 35)
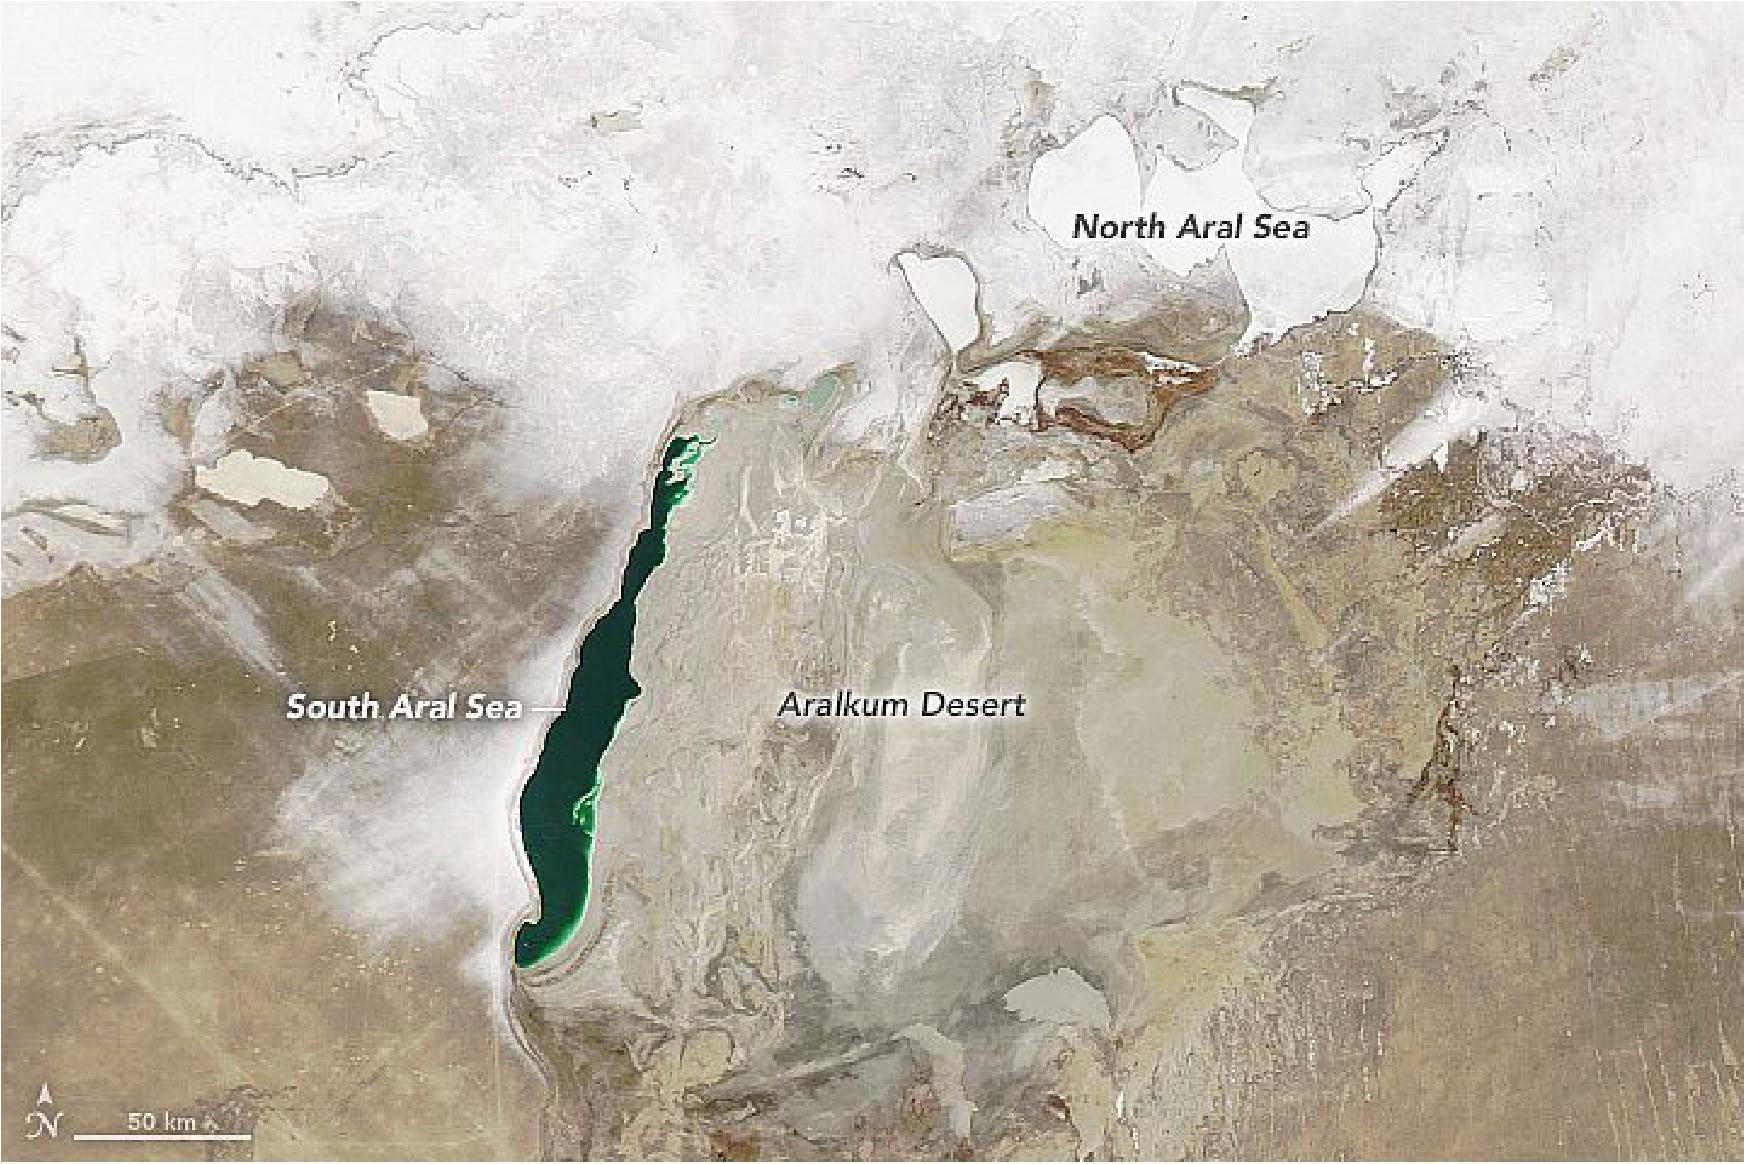
- Notice that the North Aral Sea appears entirely frozen over. Fishermen in the small town of Tastubek, Kazakhstan, on the lake's north side, endure winters with sub-zero temperatures, yet they continue to fish on the lake through holes dug in the ice. (For comparison, summertime temperatures rise above 40°C (110°F). On the day this image was acquired, the high temperature in Tastubek was -9°C (15°F).
- Toward the east, the dry bed of the Aral Sea's eastern basin is now sometimes referred to as the Aralkum Desert. Recent research has shown that in wintertime, the lake's desiccation could cause precipitation in the immediate area to fall as snow as opposed to rain because the dry surface is colder than a wet one. In contrast, the dry surface is thought to lead to substantial regional warming in summer.
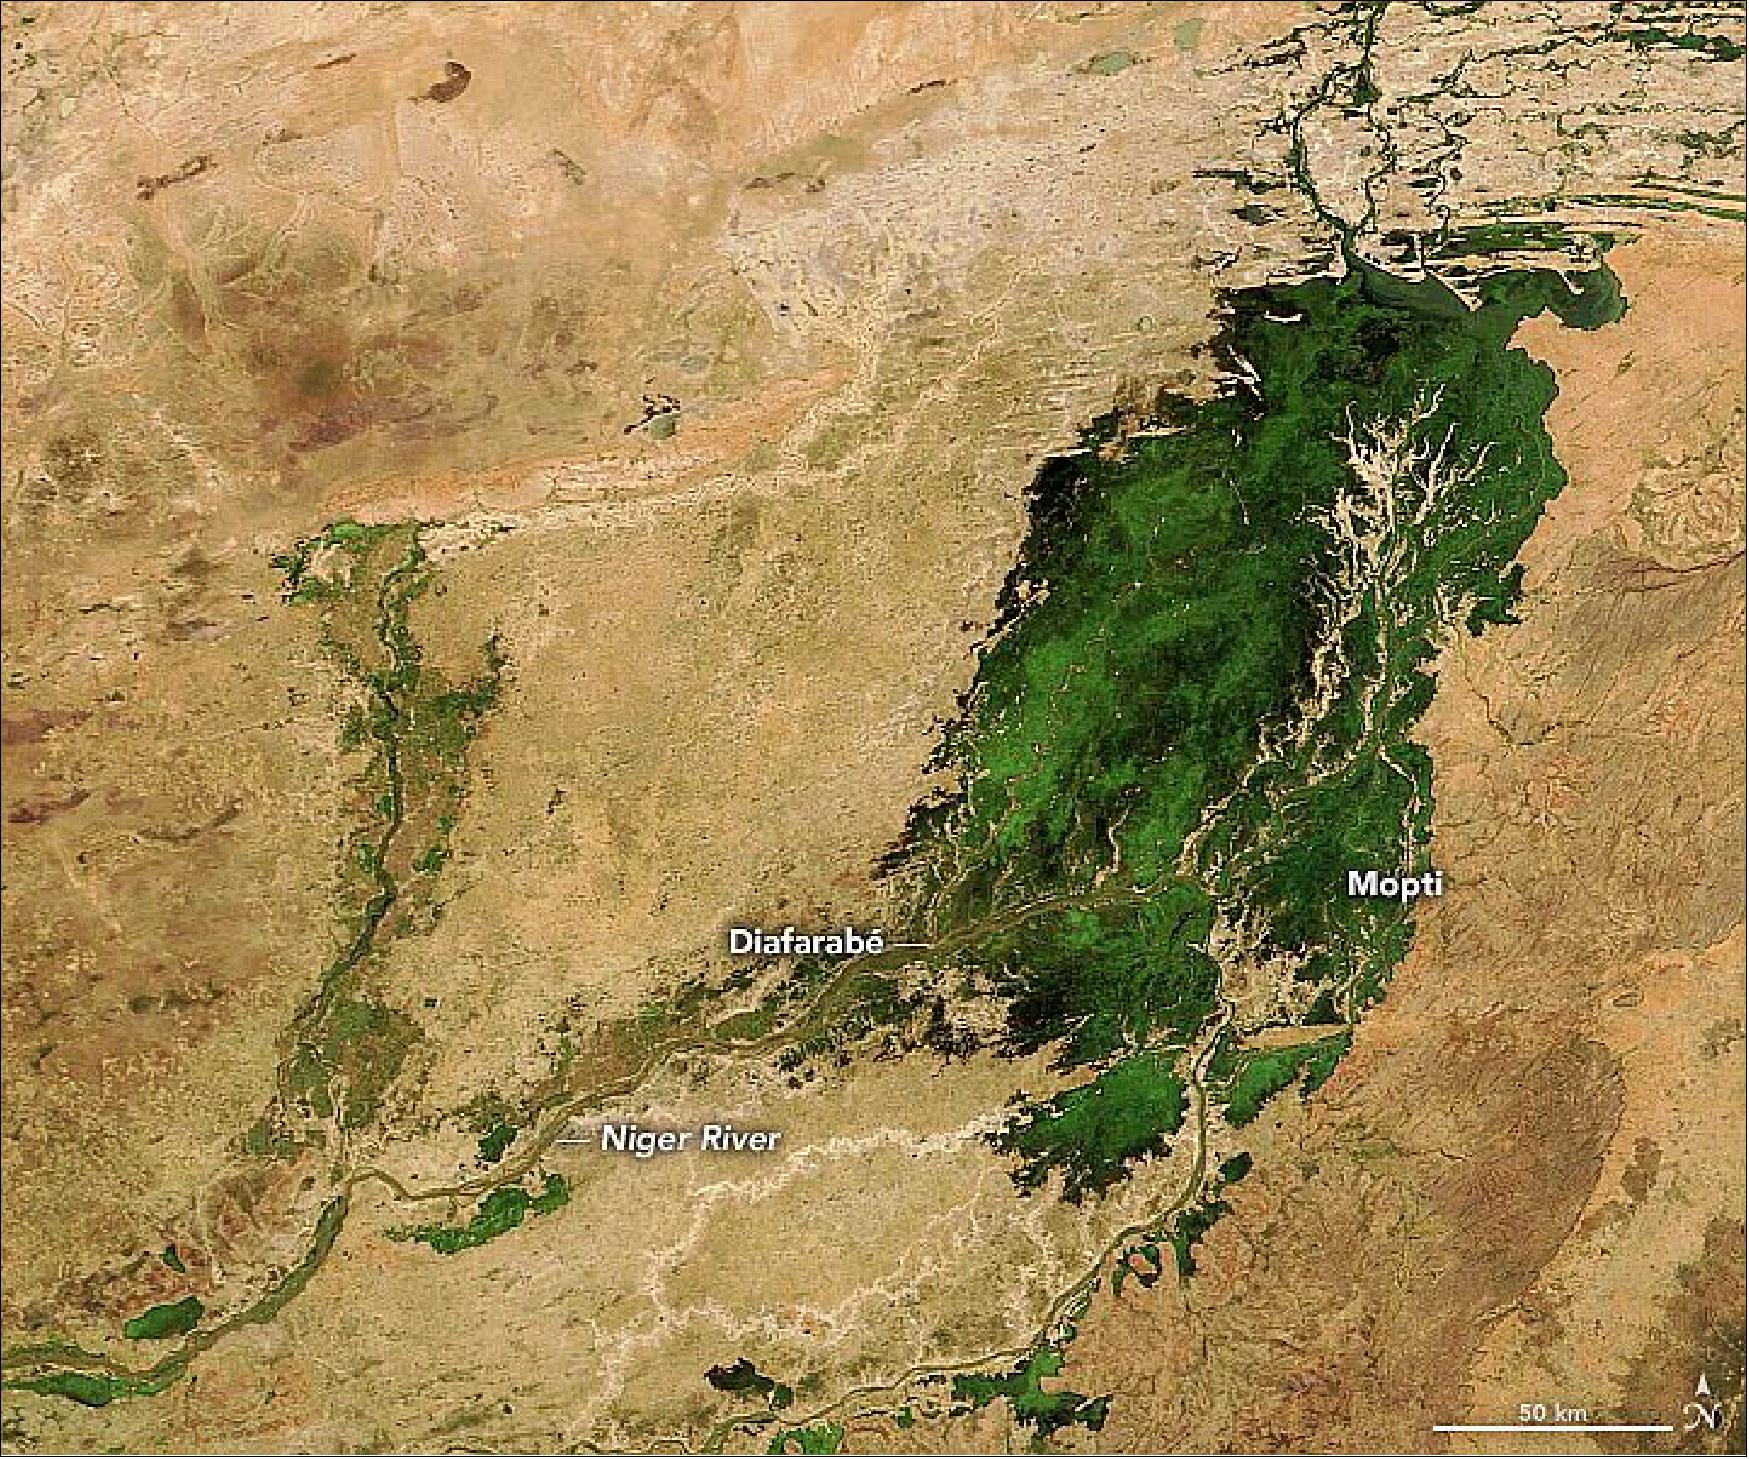
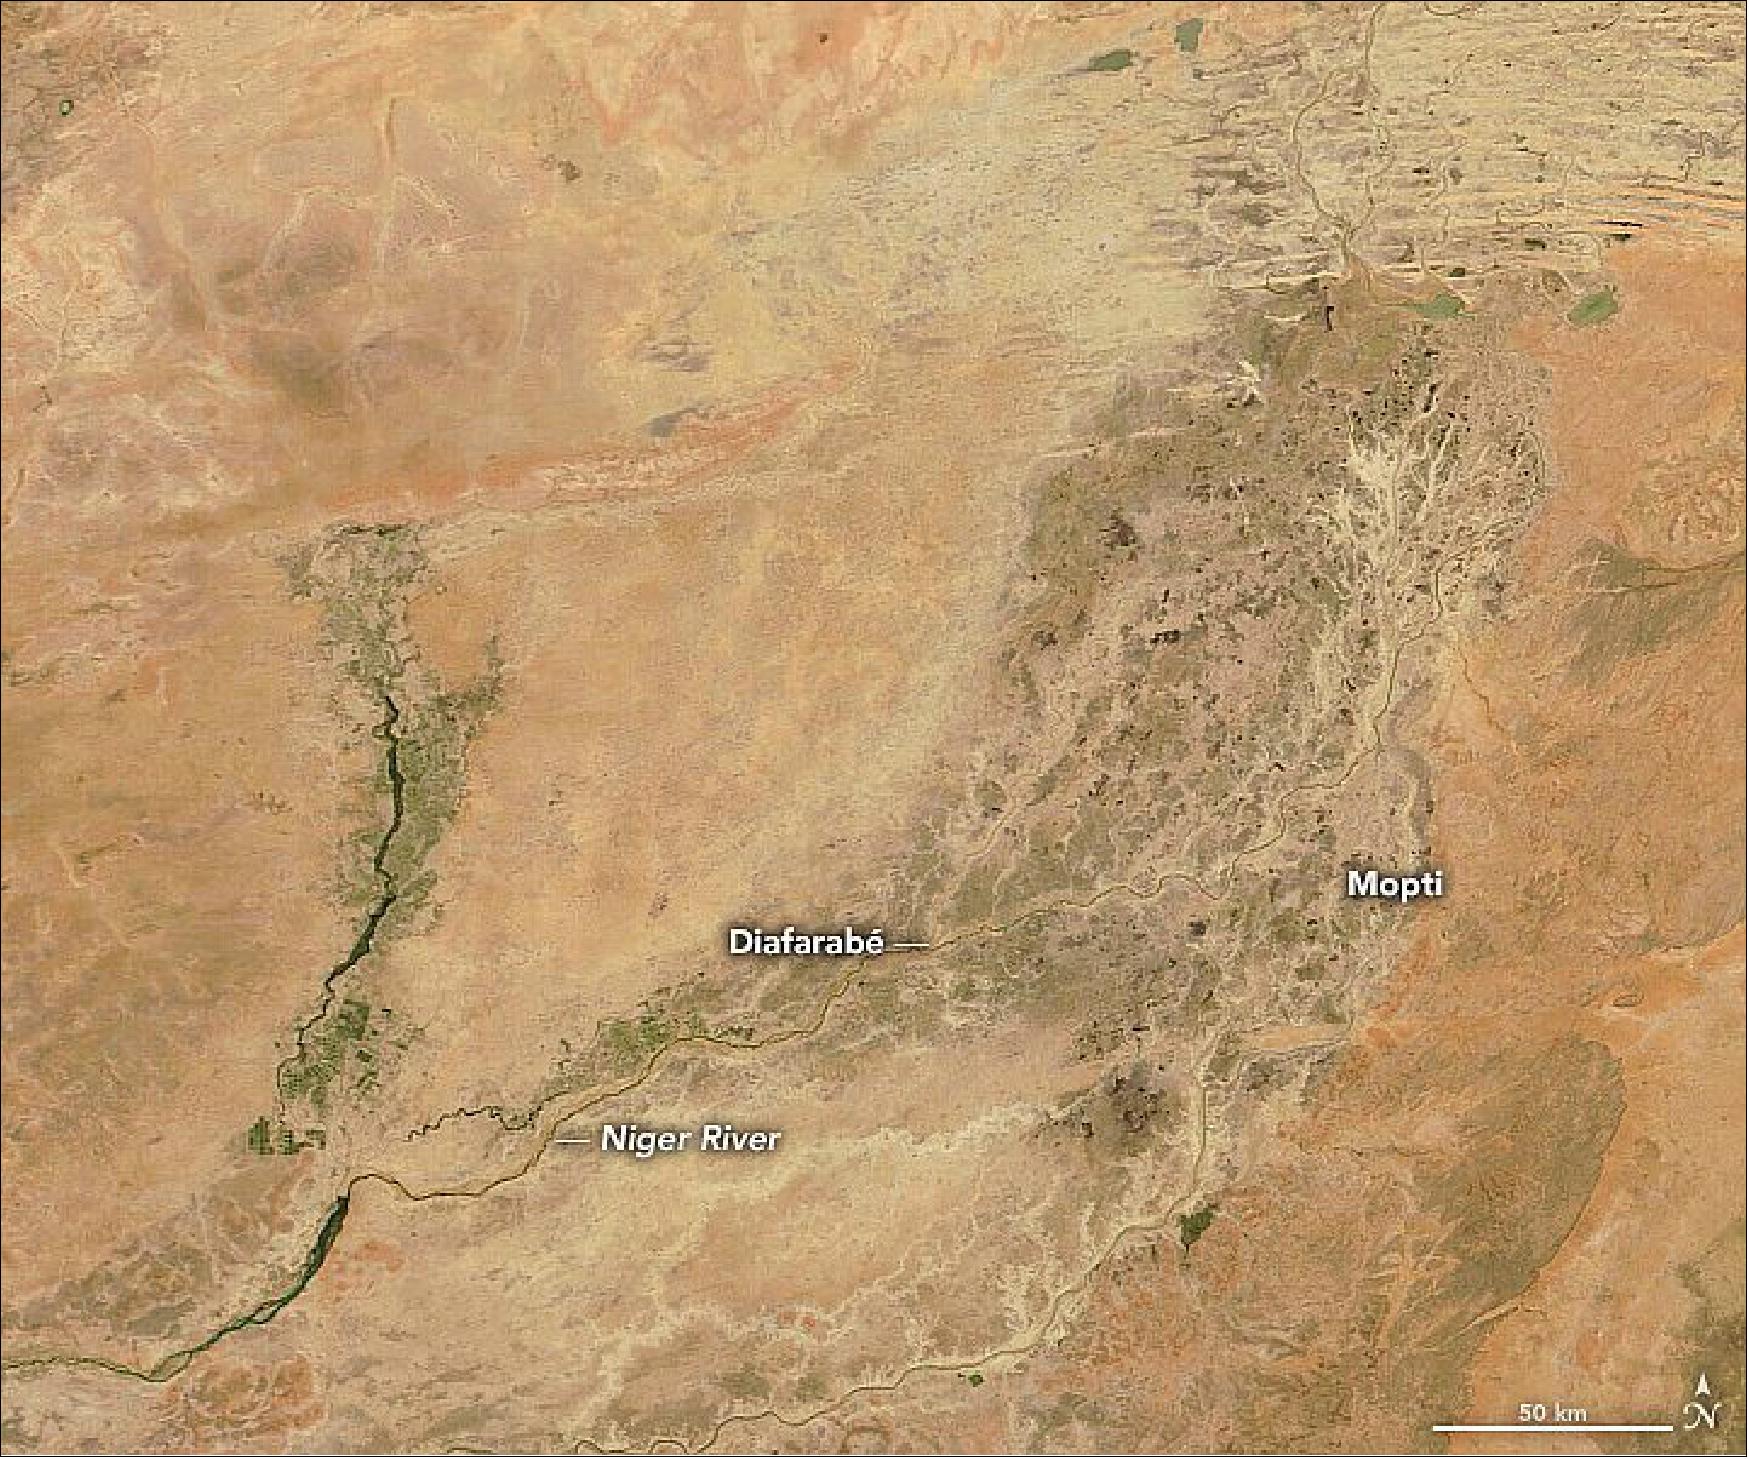
• December 21, 2020: Drought is a perennial problem in the semi-arid Sahel region of Africa. But in 2020, in Mali and other countries in West Africa, excessive rainfall has been the problem at times. Exceptionally heavy summer rains pushed seasonal floods on the Niger River and its inland delta to destructive levels. 36)
- In late October, floodwaters reached their peak height at Mopti, a town at the confluence of the Niger and Bani Rivers. Water levels in the delta were recorded at 670 centimeters (22 feet) on October 26 and remained at that level until November 2, according to Mali's National Directorate of Water Resources. That tied the peak water levels from 2018, the highest since 1969.
- After November 2, waters receded at Mopti even as they continued to rise at points downstream such as Akka and Diré. It typically takes water a full six months from falling in the Guinea Highlands to reach the ocean at the Niger Delta in Nigeria. People watch the timing of flooding closely because it affects when rice can be grown, when fish will be available to catch, and when pastures can be ready for grazing. Water levels were expected to be low enough in mid-December 2020 for the annual cattle crossing on the Niger River at Diafarabé. In the much anticipated event, nomadic herders drive cattle across the river toward rich grazing lands in the inland delta and are reunited with their families after months apart.
- While seasonal floods are common in Mali, the severity of the floods this year caused widespread damage. The United Nations Office for the Coordination of Humanitarian Affairs estimates that 1,160 homes were destroyed by flooding.
• December 12, 2020: In late autumn 2020, a wide area of the northwestern United States and western Canada bathed in sunlight during a long spell of clear skies. The cloud-free conditions gave satellites an unimpeded view of the landscape, including this image of the snowcapped Rocky Mountains. 37)
- The clear skies were the result of a high-pressure weather system that parked over the region during the first week of December. In areas of high pressure, air slowly sinks to lower altitudes and warms, a pattern that inhibits cloud formation.
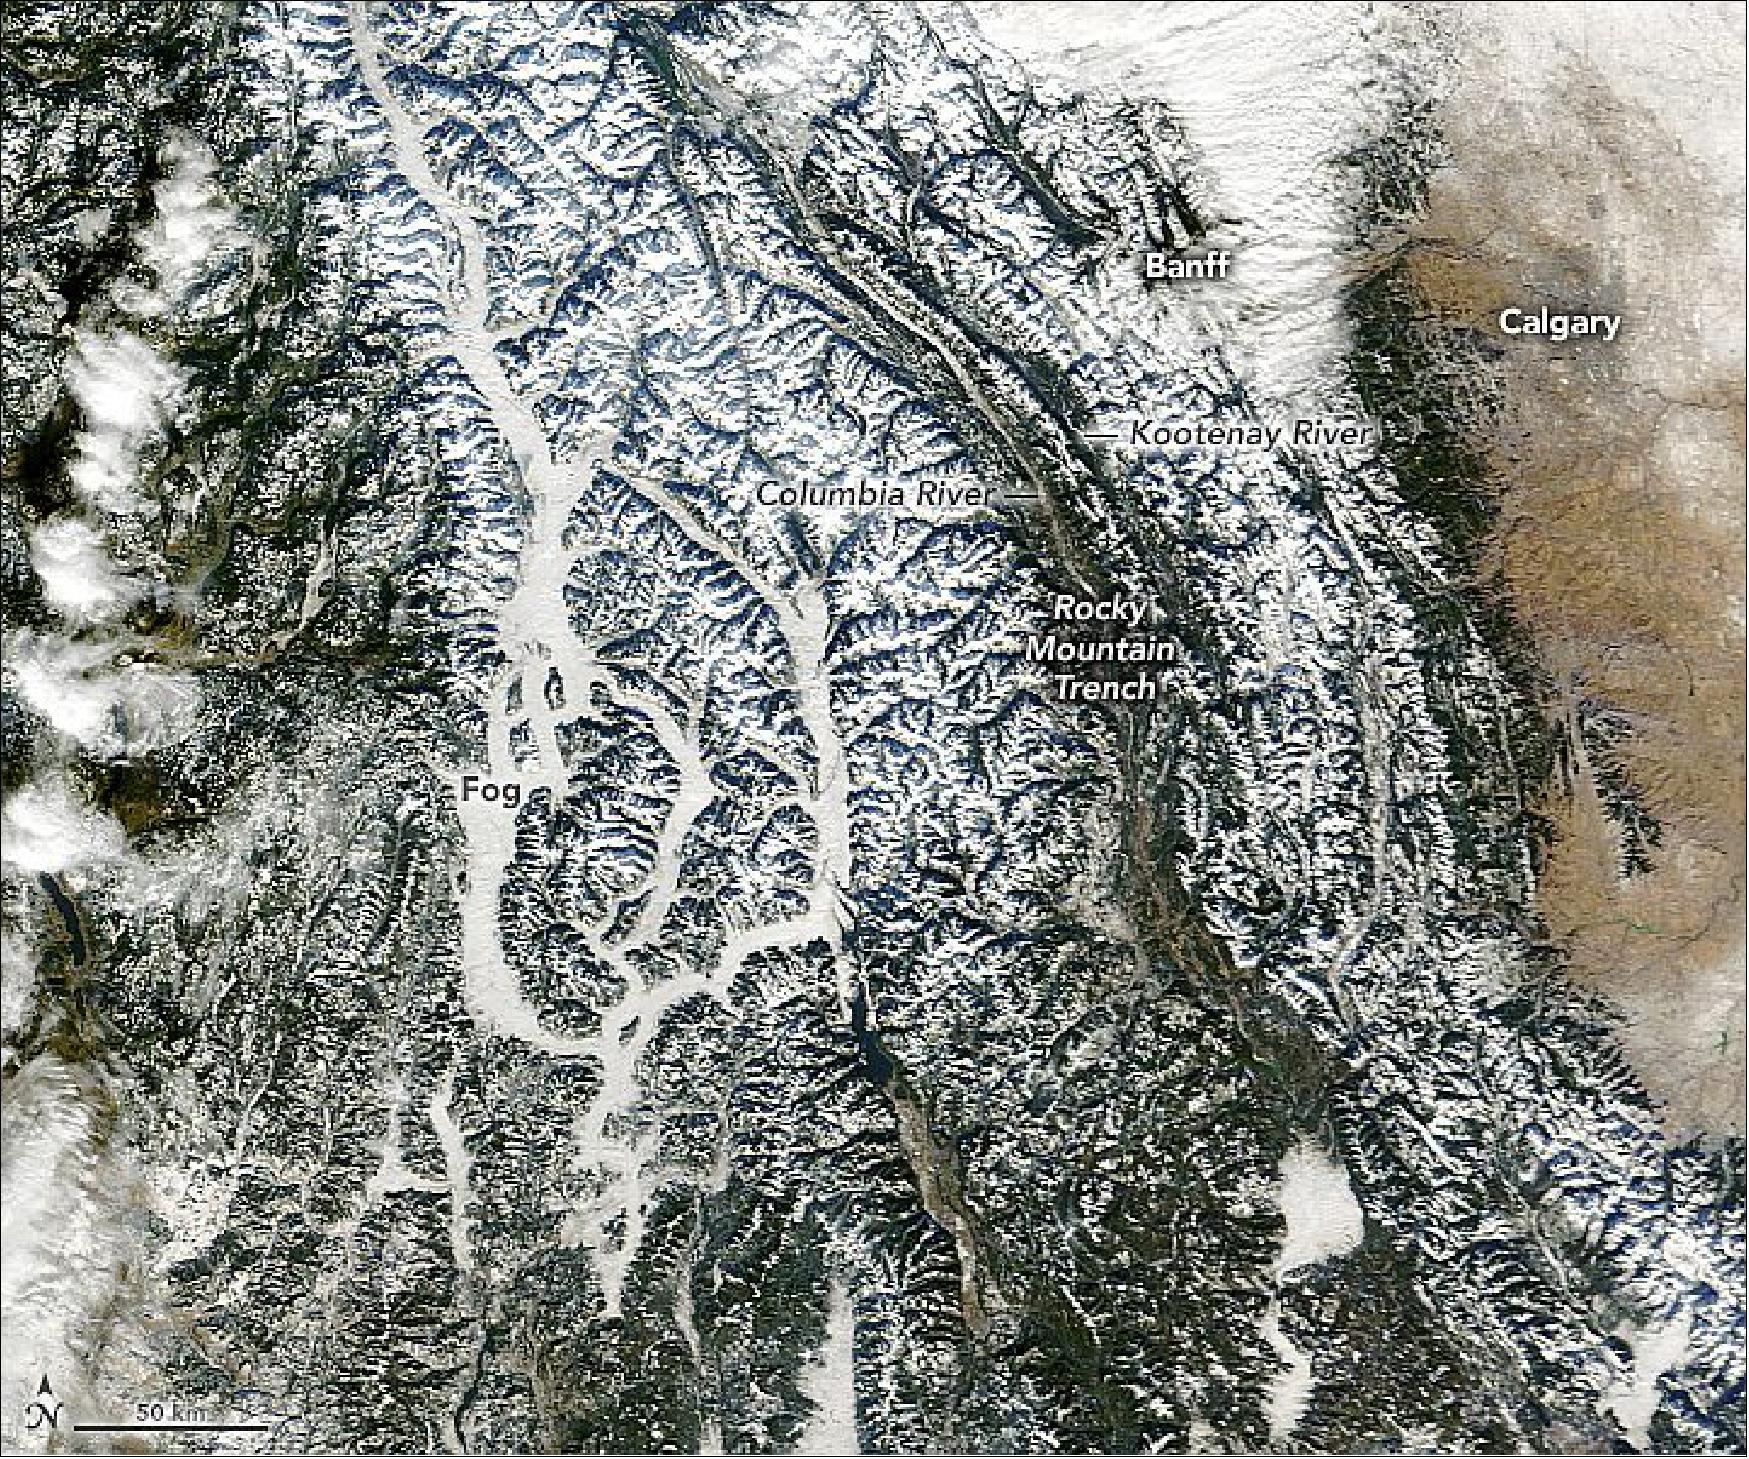
- The generally cloud-free skies kickstarted a phenomenon common in late fall and winter known as a temperature inversion. As the name implies, air temperatures become inverted from the normal warmer-to-cooler gradient from the ground to the higher atmosphere. Instead, air becomes colder near the ground than the air aloft. This happens when clear skies, especially at nighttime, allow heat from the Sun-warmed ground to easily escape back to space. The cooler, sometimes shaded ground sitting low in mountain valleys helps to chill the near-surface air, while the air above is still trying to shake the heat.
- When moist air near the ground is cooled to its dew point, low-level stratus clouds and fog can form in the valleys. Mountain snow cover can intensify the effect, by reducing daytime warming and by adding extra moisture to the air.
- While the inversion layer produces a stunning view from above, it can be hazardous to people on the ground. The phenomenon is associated with light winds and very little mixing of air masses, so sinking air can trap air pollution at low altitudes and cause poor air quality. According to the U.S. National Weather Service, an "air stagnation advisory" was in effect from December 3-5 for parts of northern Montana, Idaho, and Washington.
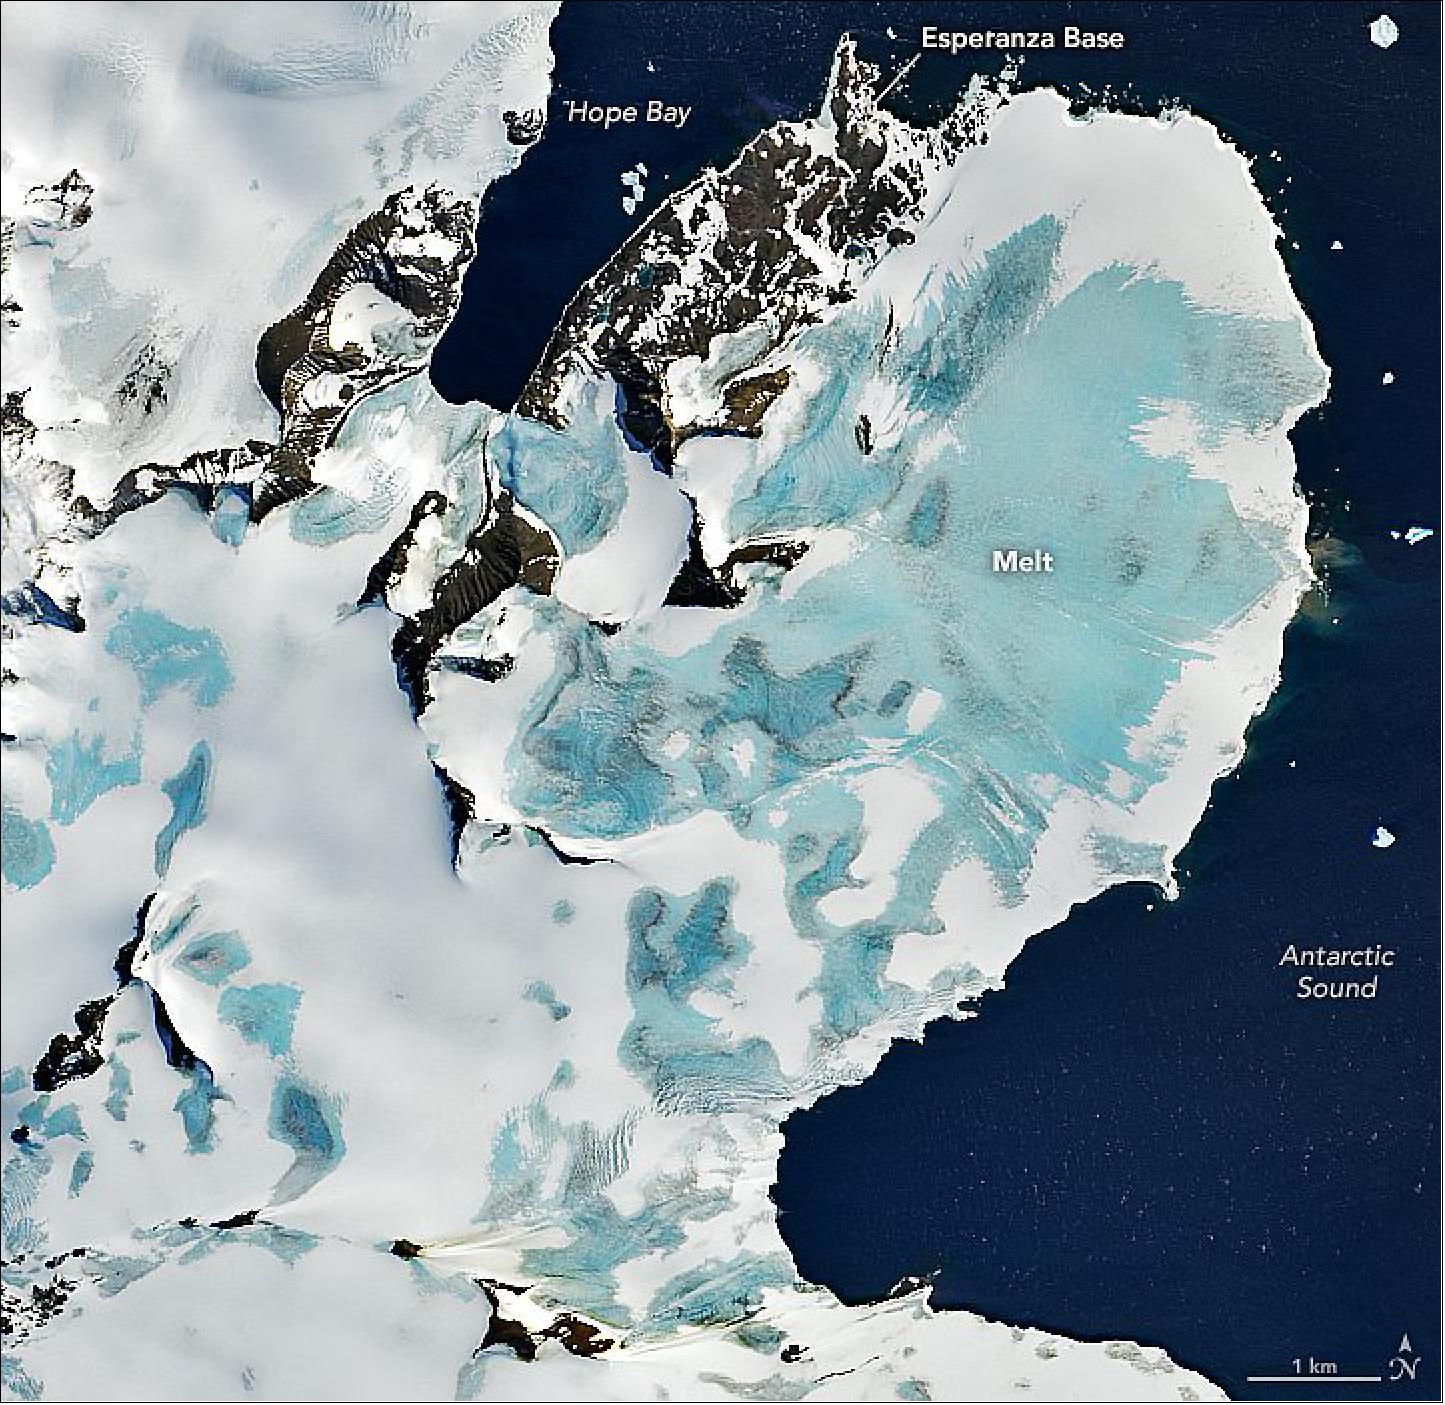
• December 3, 2020: In mid-November, about a month before the start of summer in the southern hemisphere, the Antarctic melting season is usually just starting. By that time this year, vast areas along the Antarctic Peninsula were already painted blue with meltwater. 38)
- By the end of November 2020, much of the meltwater on the ice had refrozen. But scientists want to know if this event was similar to a strong early season melt that launched the 2019-2020 melt season. Last year, unusually warm air and water led to record-breaking melting across the Larsen C Ice Shelf. It is the largest remaining ice shelf along the Antarctic Peninsula, even though it lost a Delaware-sized iceberg in 2017.
- Widespread melting on Larsen C, located just south of this image, was not apparent in natural-color satellite images. But scientists are watching how this season progresses. The ice shelf surface on the Larsen A was full of ponded meltwater just before its complete collapse in 1995; the same thing occurred before the near-complete collapse of Larsen B in 2002.
- Only a small remnant of the Larsen B Ice Shelf remains today, stabilized by fast ice in front of the shelf. Loss of the fast ice can destabilize the floating shelf ice, which in turn would allow glacial ice on land to flow unimpeded into the ocean. The effect has already been observed in the Larsen A and upper Larsen B embayments.
![Figure 58: This natural-color image was acquired on November 21, 2020, by the MODIS instrument on NASA's Terra satellite. The sea ice anchored to the peninsula's coast appears light blue where the surface ice has melted. The white ice farther off the coast is a mixture of broken sea ice and small icebergs. Dark areas indicate open water [image credit: NASA Earth Observatory images by Lauren Dauphin, using MODIS data from NASA EOSDIS/LANCE and GIBS/Worldview. Story by Kathryn Hansen, with image interpretation from Christopher Shuman (NASA/UMBC)]](https://eoportal.org/ftp/satellite-missions/t/Terra2021_050422/Terra2021_Auto33.jpeg)
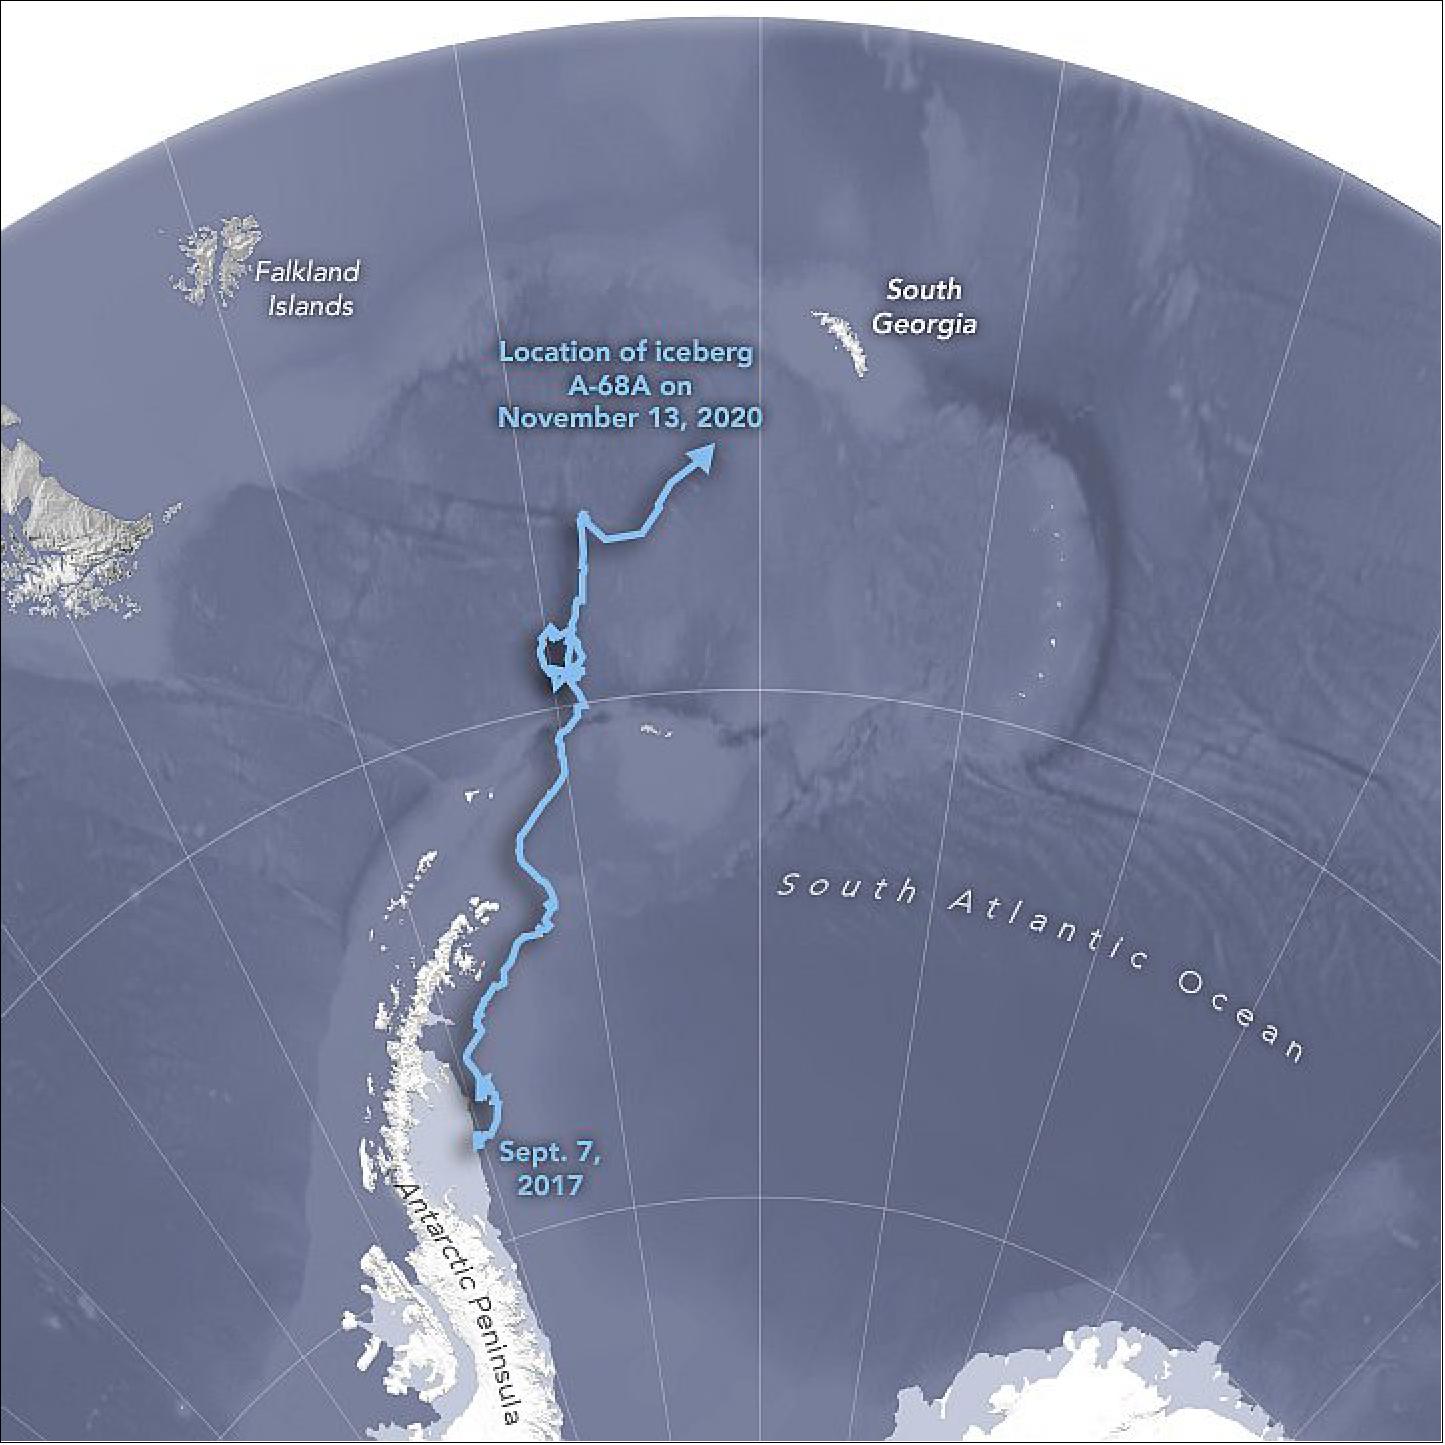
• November 16, 2020: Iceberg A-68A made headlines in July 2017 when the Delaware-sized block of ice broke from the Larsen C Ice Shelf on the Antarctic Peninsula. The berg has regained the spotlight in austral spring 2020, as it is now drifting toward South Georgia, a remote island in the southern Atlantic Ocean. 39)
- In just over three years at sea, Iceberg A-68A has moved generally northward, passing the tip of the Antarctic Peninsula and floating into "Iceberg Alley." According to David Long, a remote sensing and polar ice scientist at Brigham Young University, more than 90 percent of all Antarctic icebergs are swept along this path from the Weddell Sea toward the South Atlantic Ocean.
- "Most just don't survive the journey from the Weddell to South Georgia," Long said. So far, A-68A's huge size has helped it survive the relatively warm, iceberg-killing waters of the South Atlantic that can cut like knives through lesser bergs.
![Figure 60: The iceberg and island are both visible in this image, acquired on November 5, 2020, with the Moderate Resolution Imaging Spectroradiometer (MODIS) on NASA's Terra satellite. The berg now measures (151 km) 94 miles long and 48 km (30 miles) wide—comparable to the island's length and width of 167 and 37 km (104 and 23 miles), respectively. It is less than 500 km (300 miles) from the island's southwest shore [image credit: NASA Earth Observatory images by Lauren Dauphin, using MODIS data from NASA EOSDIS/LANCE and GIBS/Worldview, Reference Elevation Model of Antarctica (REMA) data from the Polar Geospatial Center at the University of Minnesota and data from the Antarctic Iceberg Tracking Database. Story by Kathryn Hansen, with image interpretation from David Long/BYU, Christopher Readinger/USNIC, and Christopher Shuman (NASA/UMBC)]](https://eoportal.org/ftp/satellite-missions/t/Terra2021_050422/Terra2021_Auto31.jpeg)
- While A-68A is following a similar path of many icebergs before it, the details of its journey are unique. In April 2020, A-68A was already adrift in relatively warm waters near the South Orkney Islands, about 800 km (500 miles) from where it broke from the Antarctic ice shelf in 2017. Over the course of the austral winter, sea ice grew to mostly surround A-68A, according to Christopher Readinger of the U.S. National Ice Center (USNIC). Then, currents and wind carried the iceberg out of the sea ice. For several months the berg meandered north, spinning and revolving around oceanic eddies, until it was recently kicked to the northeast toward South Georgia.
- News reports have pointed to a possible collision with the island, or that the iceberg could become stuck, or "grounded," in the shallow waters surrounding it. Either outcome could mean trouble for the island's abundant wildlife if the berg blocks the foraging routes of penguins and seals.
- "The currents and eddies are probably too chaotic to really make a prediction about where it will go and how fast it will get there besides some average component of north-east over the next few months," Readinger said. "The recent news about it seems to be expecting that it will ground at South Georgia. I'm not so sure."
- Long agrees, noting that historical precedent suggests the iceberg is likely to pass just south of South Georgia. "If it is close enough to the island, it could get caught in the vortex in ocean currents to the east of the island and be pulled back toward the island by counter currents, much as A-22A did more than a decade ago," Long said. "If, however, it passes far enough to the south, it will miss the counter current the vortex and probably keep heading east-northeast."
- Whether it becomes stuck or sails smoothy on by, Iceberg A-68A will eventually move past South Georgia. That's when Readinger thinks the iceberg is likely to break up into smaller bergs, a few of which should be sizable enough to be named by the USNIC. For example, A-68C is located about 420 km (260 miles) northeast of Sough Georgia in the image at the top of this page. That new berg, identified in April 2020, is already breaking up into smaller pieces and will soon be too small for USNIC scientists to track.
• October 29, 2020: For the fifth time this year, a named tropical storm or hurricane is going to make landfall in Louisiana. For the eleventh time in 2020, a named storm is going to hit the continental United States; according to meteorologist Jeff Masters, that is the most since nine made landfall in 1916. For just the sixth time in 170 years, a hurricane is going to come ashore in the U.S. on or after October 28. 40)
- At 1 p.m. Central Daylight Time on October 28, the National Hurricane Center (NHC) reported that the center of Zeta was about 155 miles (255 km) south-southwest of New Orleans. The category 2 storm had maximum sustained winds of 100 miles (155 km) per hour, with higher gusts. Hurricane-force winds stretched as far as 35 miles (55 km) from the center, and tropical storm-force winds extended to 150 miles (240 km).
- A hurricane warning was raised from Morgan City, Louisiana, to the border of Mississippi and Alabama. A storm surge warning was in effect from the mouth of the Atchafalaya River in Louisiana to Navarre, Florida, and specifically for Lake Borgne, Lake Pontchartrain, Pensacola Bay, and Mobile Bay. Forecasters said Zeta should make landfall in southeastern Louisiana by early evening on October 28 and then cross toward the Mississippi and Alabama coasts. Storm surges from 5 to 9 feet (1.5 to 3 meters) were expected from Dauphin Island to the mouth of the Mississippi River. The rapid movement of the storm system was expected to limit rainfall accumulation.
- Zeta previously made landfall on the Yucatan Peninsula of Mexico on October 26. It was the third time in a month that the Yucatan was hit by a tropical storm or hurricane. The storm brought 3 feet (1 meter) of storm surge and up to 7 inches (18 cm of rain) in some areas. Trees and power lines were damaged, but no deaths or severe injuries were reported.
- Zeta is the 27th named tropical storm of the 2020 Atlantic season and the 11th hurricane. The record is 28 named storms and 15 hurricanes, set in 2005. Hurricane season officially ends on November 30.
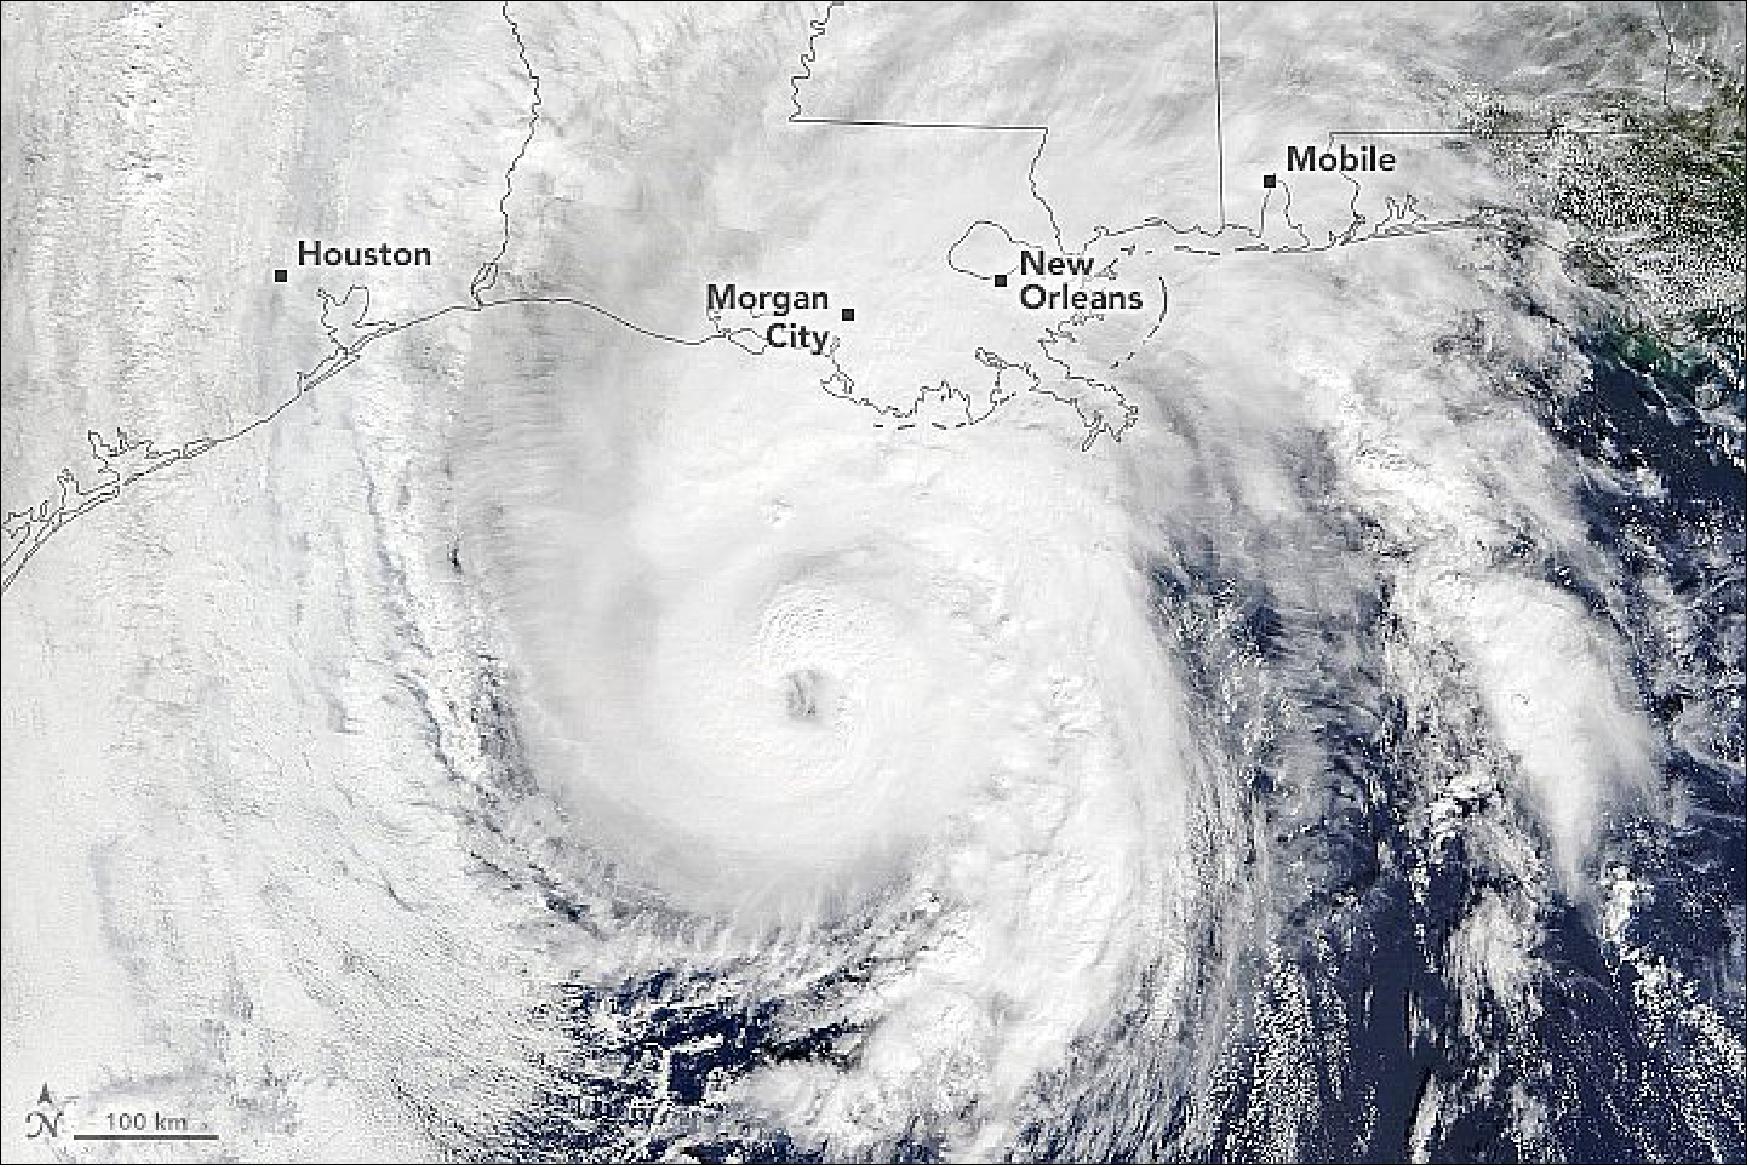
- The NASA Earth Applied Sciences Disasters Program has activated in support of the event, and is working to determine what NASA resources and capabilities may be available to aid risk reduction, response, and recovery. For hurricanes Laura, Sally, and Delta, the program worked closely with stakeholders from the Federal Emergency Management Agency (FEMA), the Louisiana National Guard, and the Alabama Emergency Management Agency.
• October 25, 2020: Like Earth, the dwarf planet of Pluto has mountains. Like their earthly cousins, some of those peaks are covered in blankets of white. But the origins of these ice-like deposits are very different. 41)
- According to new research published on October 13, 2020, in Nature Communications, some of the mountains discovered on Pluto during the flyby of the New Horizons spacecraft in 2015 are covered by a blanket of methane ice. An international team of scientists analyzed data from Pluto's atmosphere and surface and used numerical simulations of its climate to reveal that these ice caps are created through different processes than they are on Earth.
- The study authors noted that "within the dark equatorial region of Cthulhu, bright frost containing methane is observed coating crater rims and walls as well as mountain tops, providing spectacular resemblance to terrestrial snow-capped mountain chains."
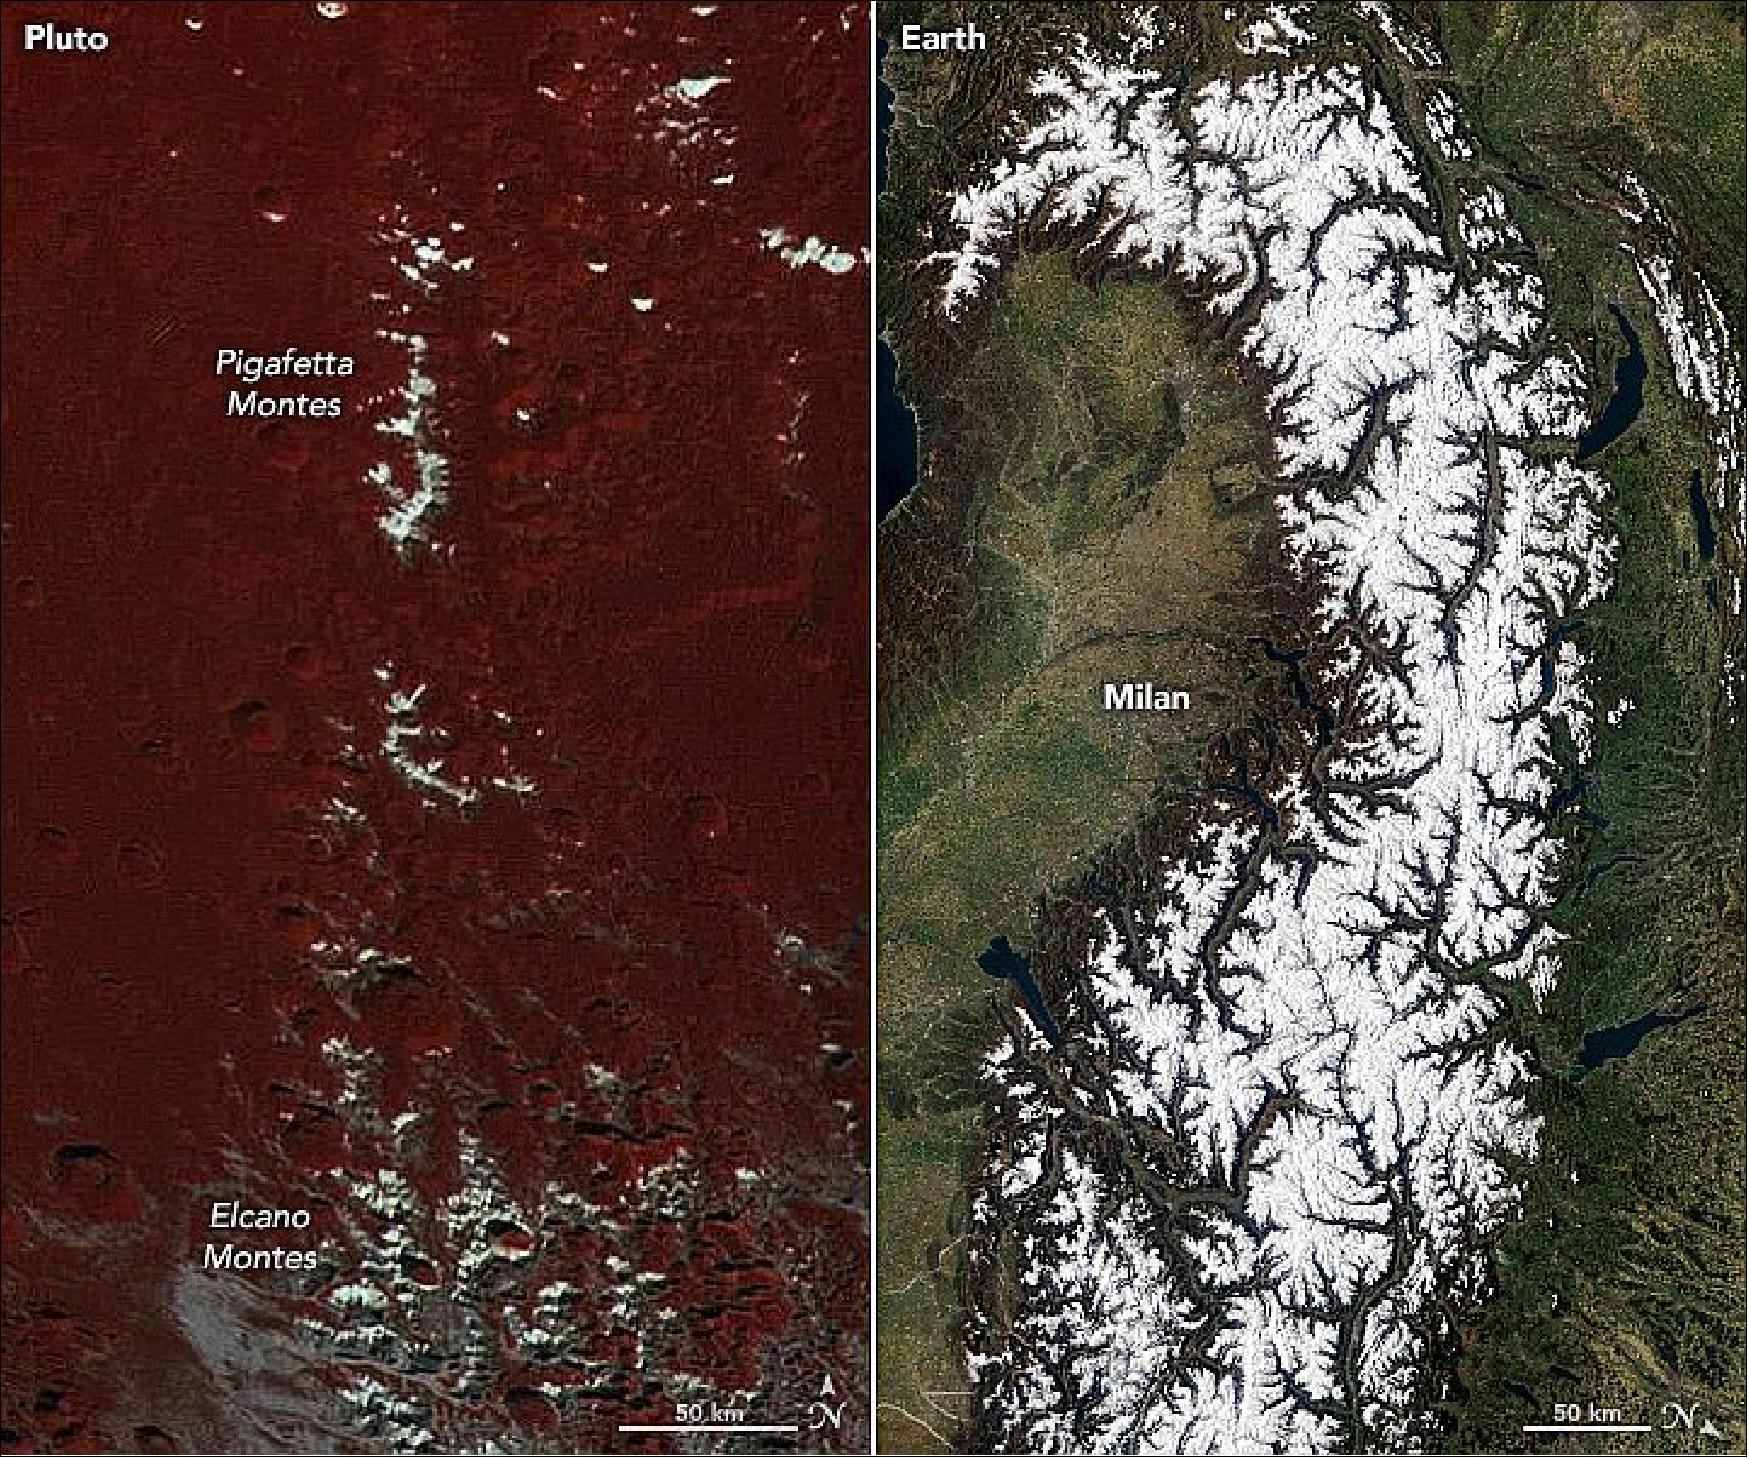

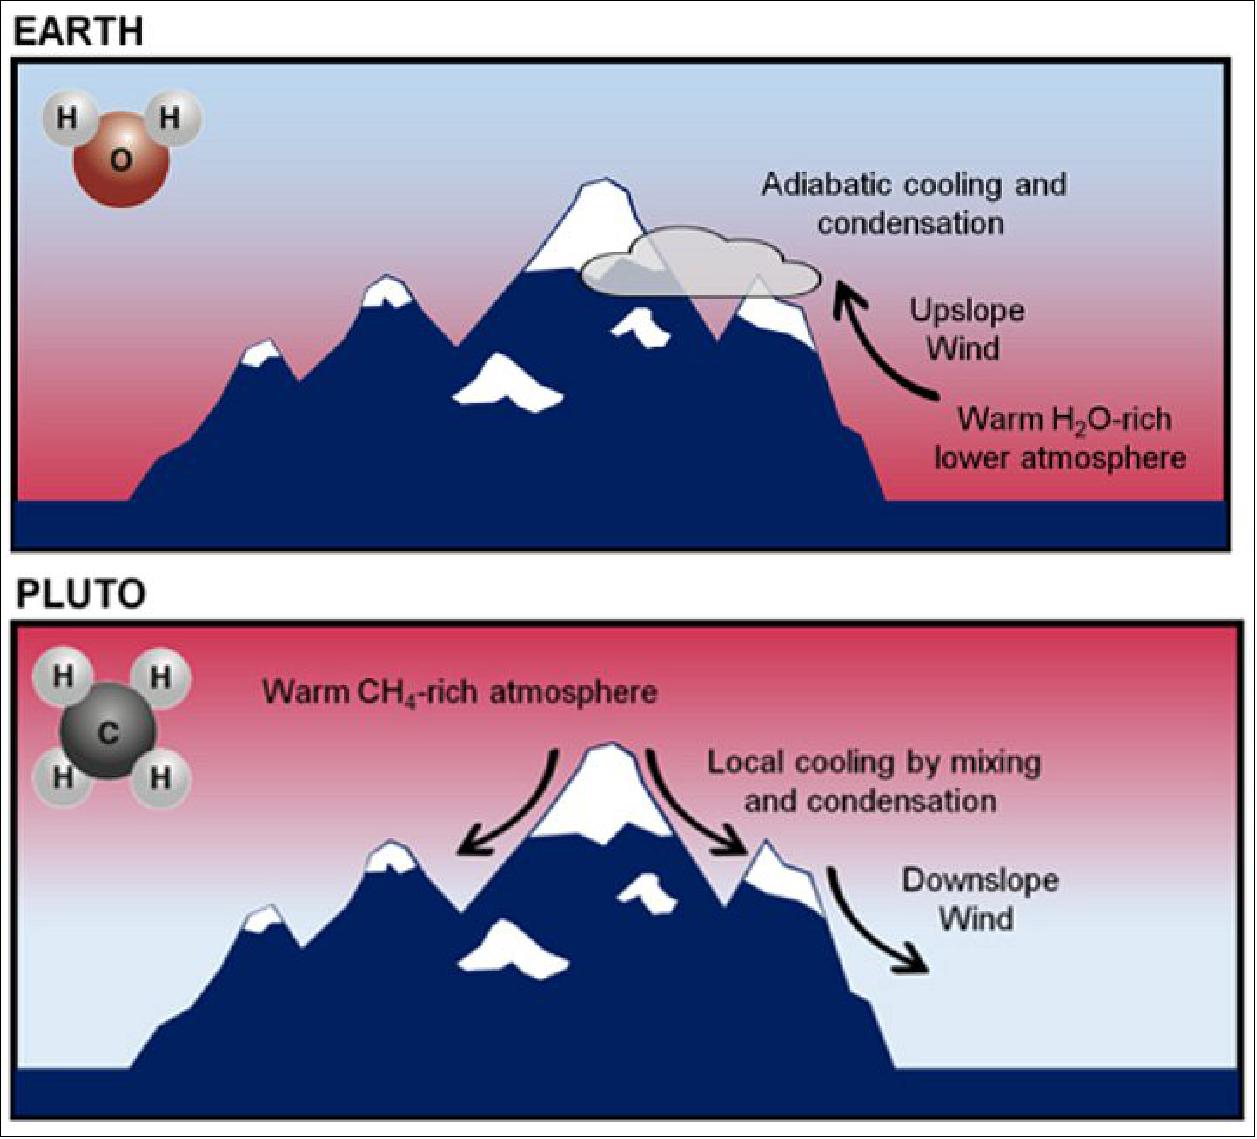
- "It is particularly remarkable to see that two very similar landscapes on Earth and Pluto can be created by two very dissimilar processes," said Tanguy Bertrand, a postdoctoral researcher at NASA's Ames Research Center and lead author on the paper. "Though theoretically objects like Neptune's moon Triton could have a similar process, no other place in our solar system has ice-capped mountains like this besides Earth."
- To understand how similar landscapes develop from different conditions and chemistries, the researchers at the Laboratoire de Météorologie Dynamique (France) developed a three-dimensional model simulating the atmosphere and surface of Pluto. They found that the dwarf planet's atmosphere has more gaseous methane at its warmer, higher altitudes. That gas can saturate, condense, and then freeze directly on mountain peaks without any clouds forming. At lower altitudes on Pluto, there is no methane frost because there is too little methane for condensation to occur.
- This condensation process not only creates methane ice caps on Pluto's mountains, but also similar features on its crater rims as well. The mysterious bladed terrain found in the Tartarus Dorsa region around Pluto's equator can also be explained by this cycle.
- "Pluto really is one of the best natural laboratories we have to explore the physical and dynamic processes involved when compounds that regularly transition between solid and gas states interact with a planetary surface," said Bertrand. "The New Horizons flyby revealed astonishing glacial landscapes we continue to learn from."
• October 17, 2020: Australia is a top iron ore producer and exporter in the world, holding nearly 30 percent of the estimated global supply. The majority of those reserves are found in Western Australia, home to one of the country's largest and oldest iron ore mines. 42)
- The deposits at Mount Whaleback were discovered in 1957 by prospector Stan Hilditch. After World War II, Hilditch began exploring Western Australia for minerals. He concentrated their search in the hills because he believed the mountainous terrain would help the minerals precipitate. Searching in the Ophthalmia Range, he climbed up a hill and stumbled upon a massive iron ore deposit that soon became Mount Whaleback iron ore mine.
- Hilditch tried to open Mount Whaleback for business in 1961, after Australia lifted an embargo on exporting mineral goods. But in spite of the abundance of ore, he had trouble convincing companies to invest in his mine because the deposits were located far from the coast (for shipping) and with a very small population to work on extracting them. Eventually, Hildritch and his business partner sold their temporary reserves to an interested company for $10 million. The Mount Newman Mining Company later built the adjacent mining town, which is now home to about 8,000 people.
- The mine, which is still operating after more than five decades, stretches 5.5 km long and 1.5 km wide. The satellite image also shows several smaller mines nearby; the smaller mines and Mount Whaleback are now collectively known as Mount Newman. Deposits from these smaller mines are transported to Mount Whaleback, blended, and then sent to port.
- A lot of the iron ore found at Mount Whaleback is hematite, which has been the dominant iron ore mined in Australia since the 1960s. Pure hematite contains around 70 percent iron and ranges in color from silver to reddish brown. Iron is extracted from the minerals and commonly used for making steel.
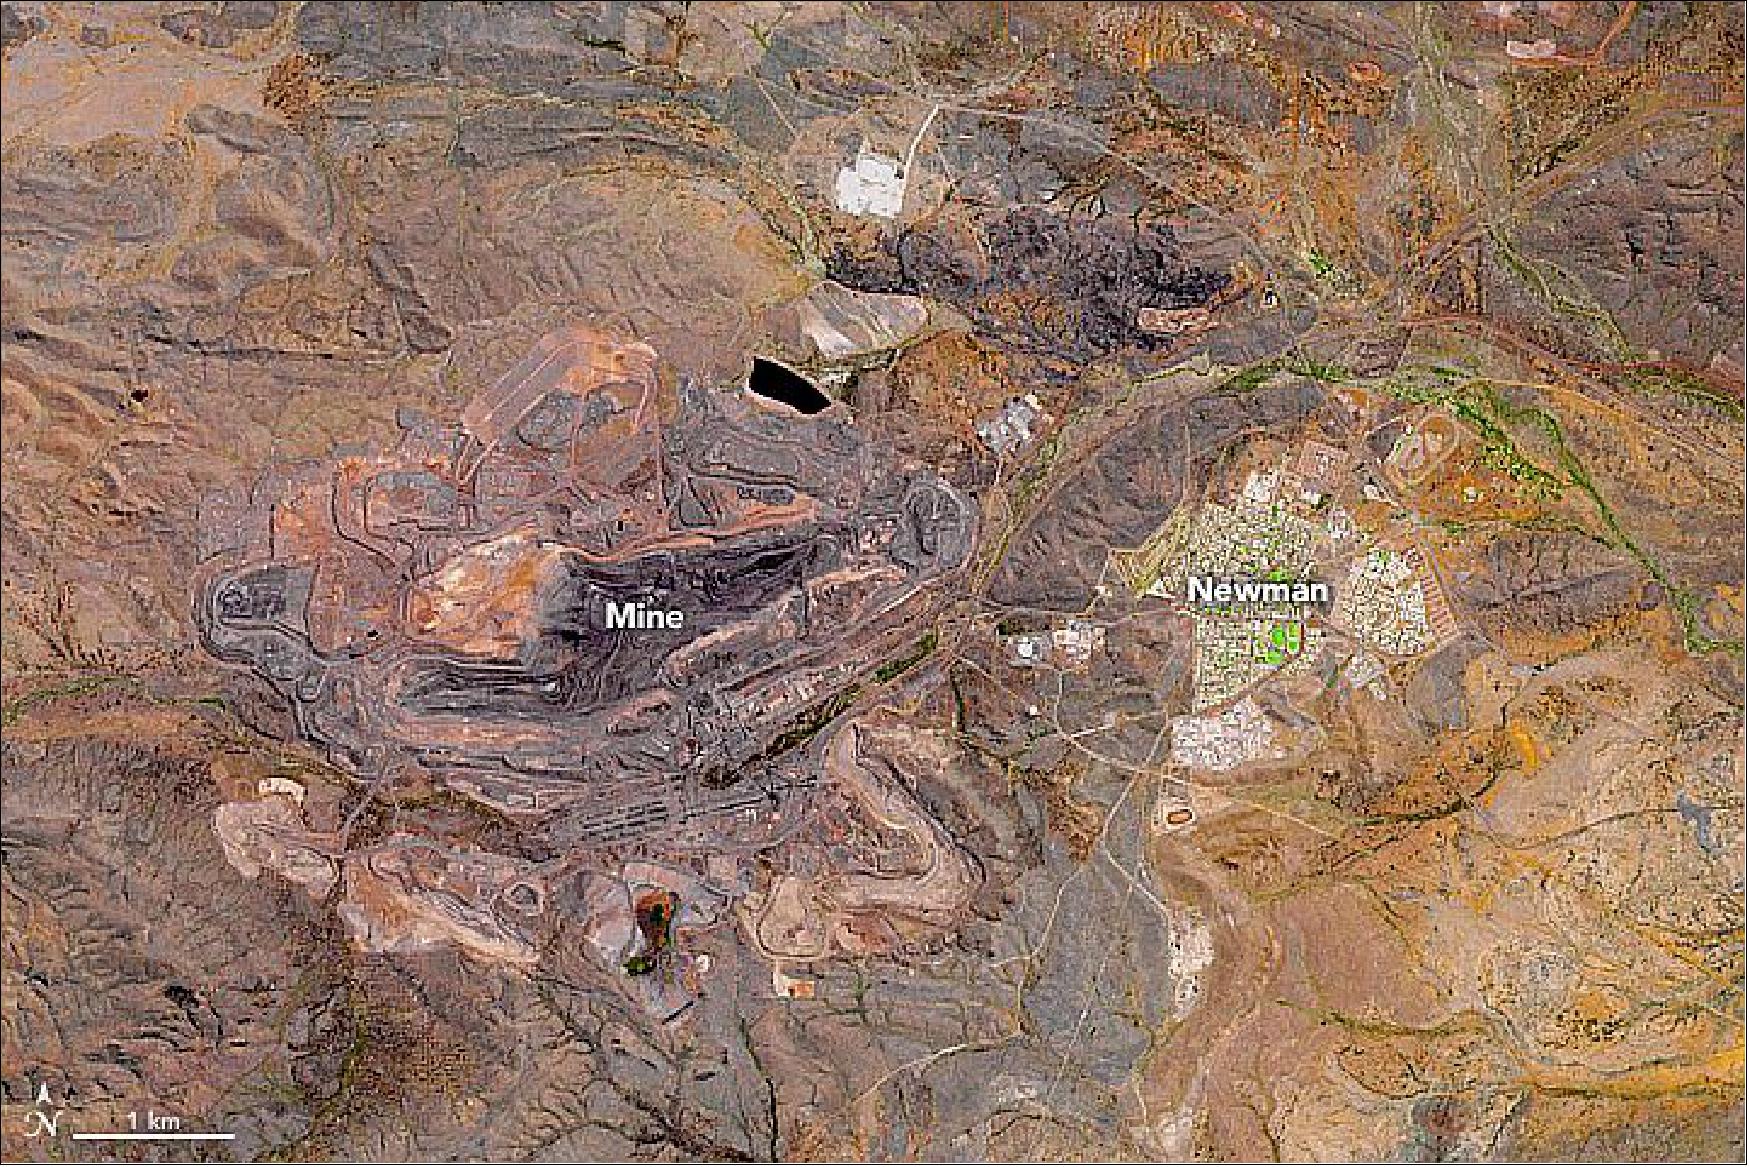
- The ore at Whaleback mostly occurs in banded iron formations, appearing as colorful alternating layers of mineral deposits on the landscape. The formations were first started more than 2.5 billion years ago when the landmass was under water. Ancient forms of bacteria photosynthesized and released large amounts of oxygen; that oxygen reacted with seawater to form insoluble iron oxide. The iron would precipitate out of the salt water as minerals such as hematite, which then accumulated as sediment on the sea floor.
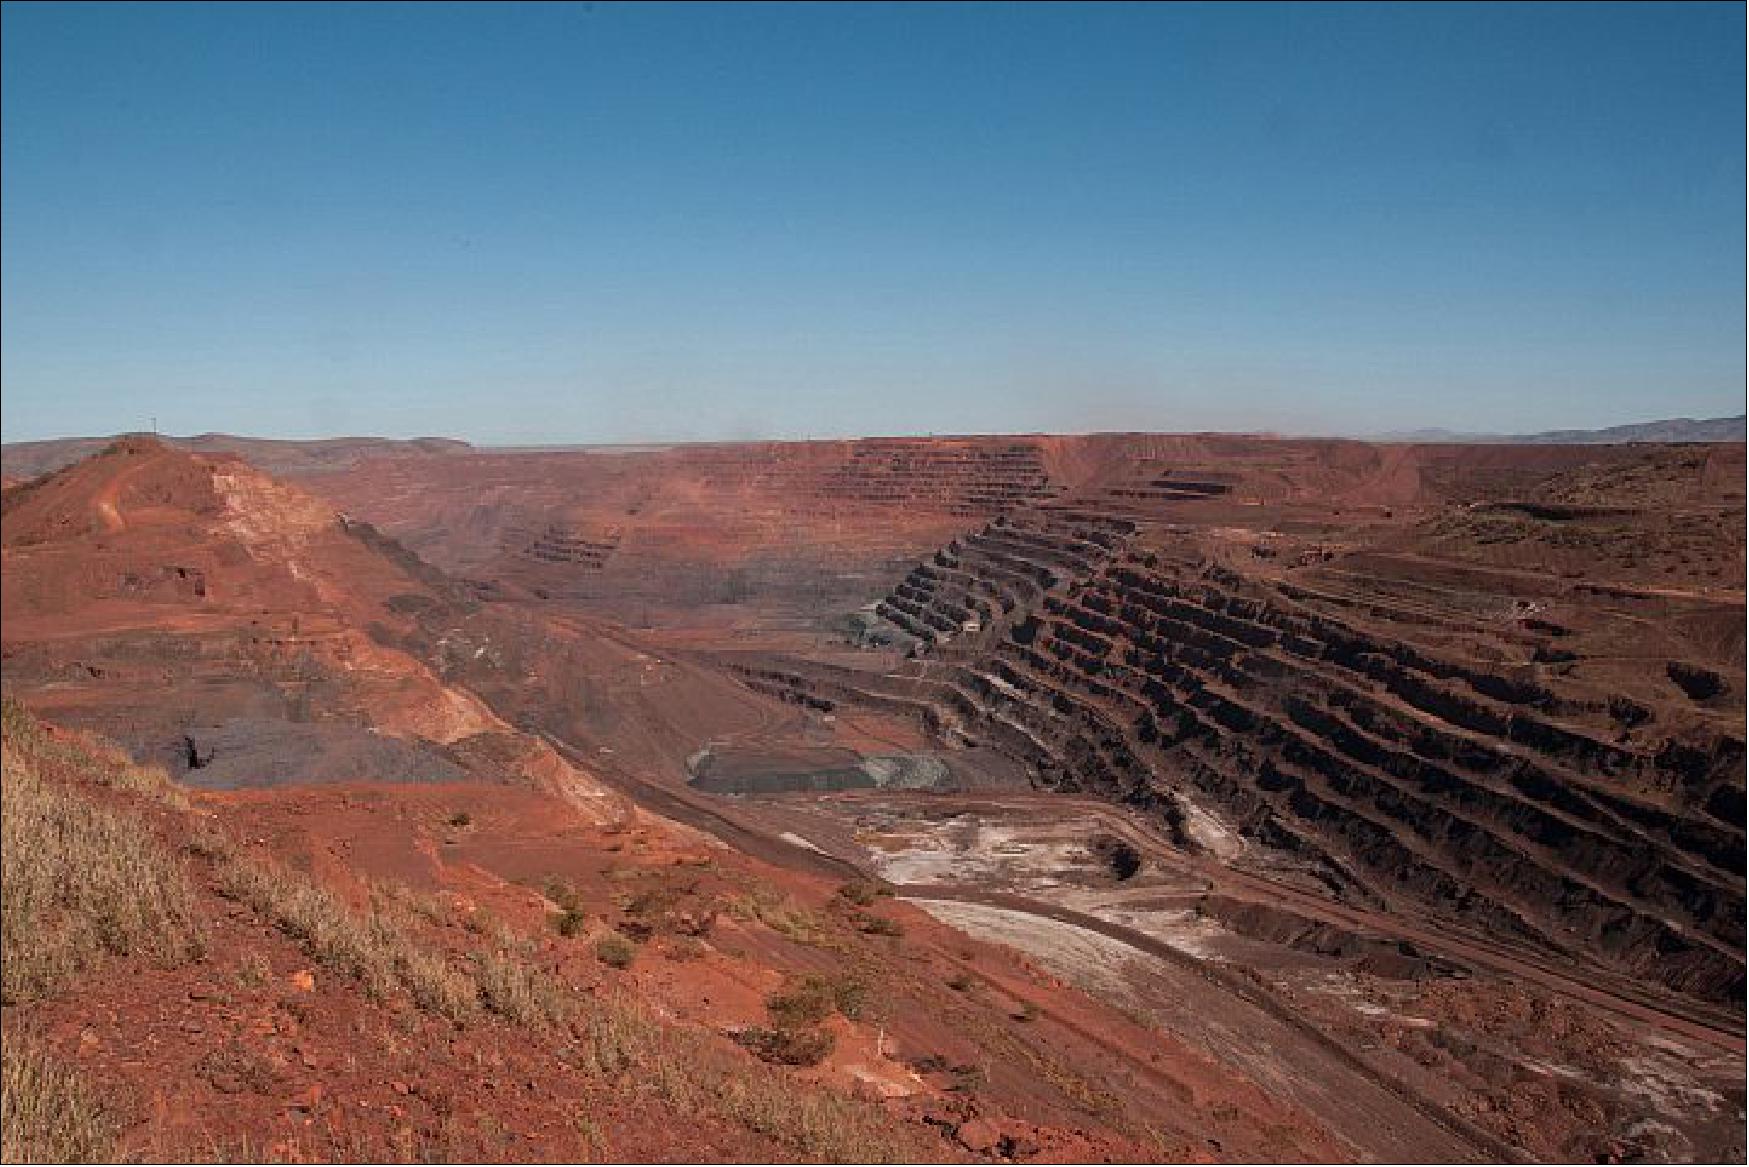
• October 12, 2020: Wave clouds (sometimes called undulatus or billow clouds) like these are the product of atmospheric gravity waves. They typically form when something forces a mass of air upward. The air cools as it rises and, if there is enough moisture in the air, the water condenses and forms clouds. After the air has passed over the obstacle, it typically sinks downward again. The air warms as it descends, preventing clouds from forming. But like ripples on a pond, the initial disturbance creates a propagating wave that continues to spread, causing air to rise and drop again and again until the wave dissipates. The end result is long lines of clouds that mark the crests of the waves, with cloud-free areas between them that correspond to the troughs of the waves. 43)
- Wave clouds often form when mountains or islands force the flow of air upward. But in this case, the undular bore was likely caused by masses of cool and warm air colliding, with the cool air pushing the warmer air upward. As the group of wave clouds passed Guadalupe Island, notice how cross-currents in the air flow created by the island's rugged terrain made a pocket of air to the west less amenable to cloud formation.
- "Guadalupe Island often creates some awesome von Karman vortex streets, but making the cloud bands of an undular bore briefly disappear is one of its more impressive tricks," said Scott Bachmeier, a meteorologist with the Cooperative Institute for Meteorological Satellite Studies at the University of Wisconsin-Madison.
- These were not the only eye-catching wave clouds along North America's Pacific Coast in recent days. As Bachmeier also pointed out, northwesterly winds flowing past the rugged shoreline of Point Reyes, California, generated a series of striking cloud bands on October 3, 2020, that were similar to bow waves.
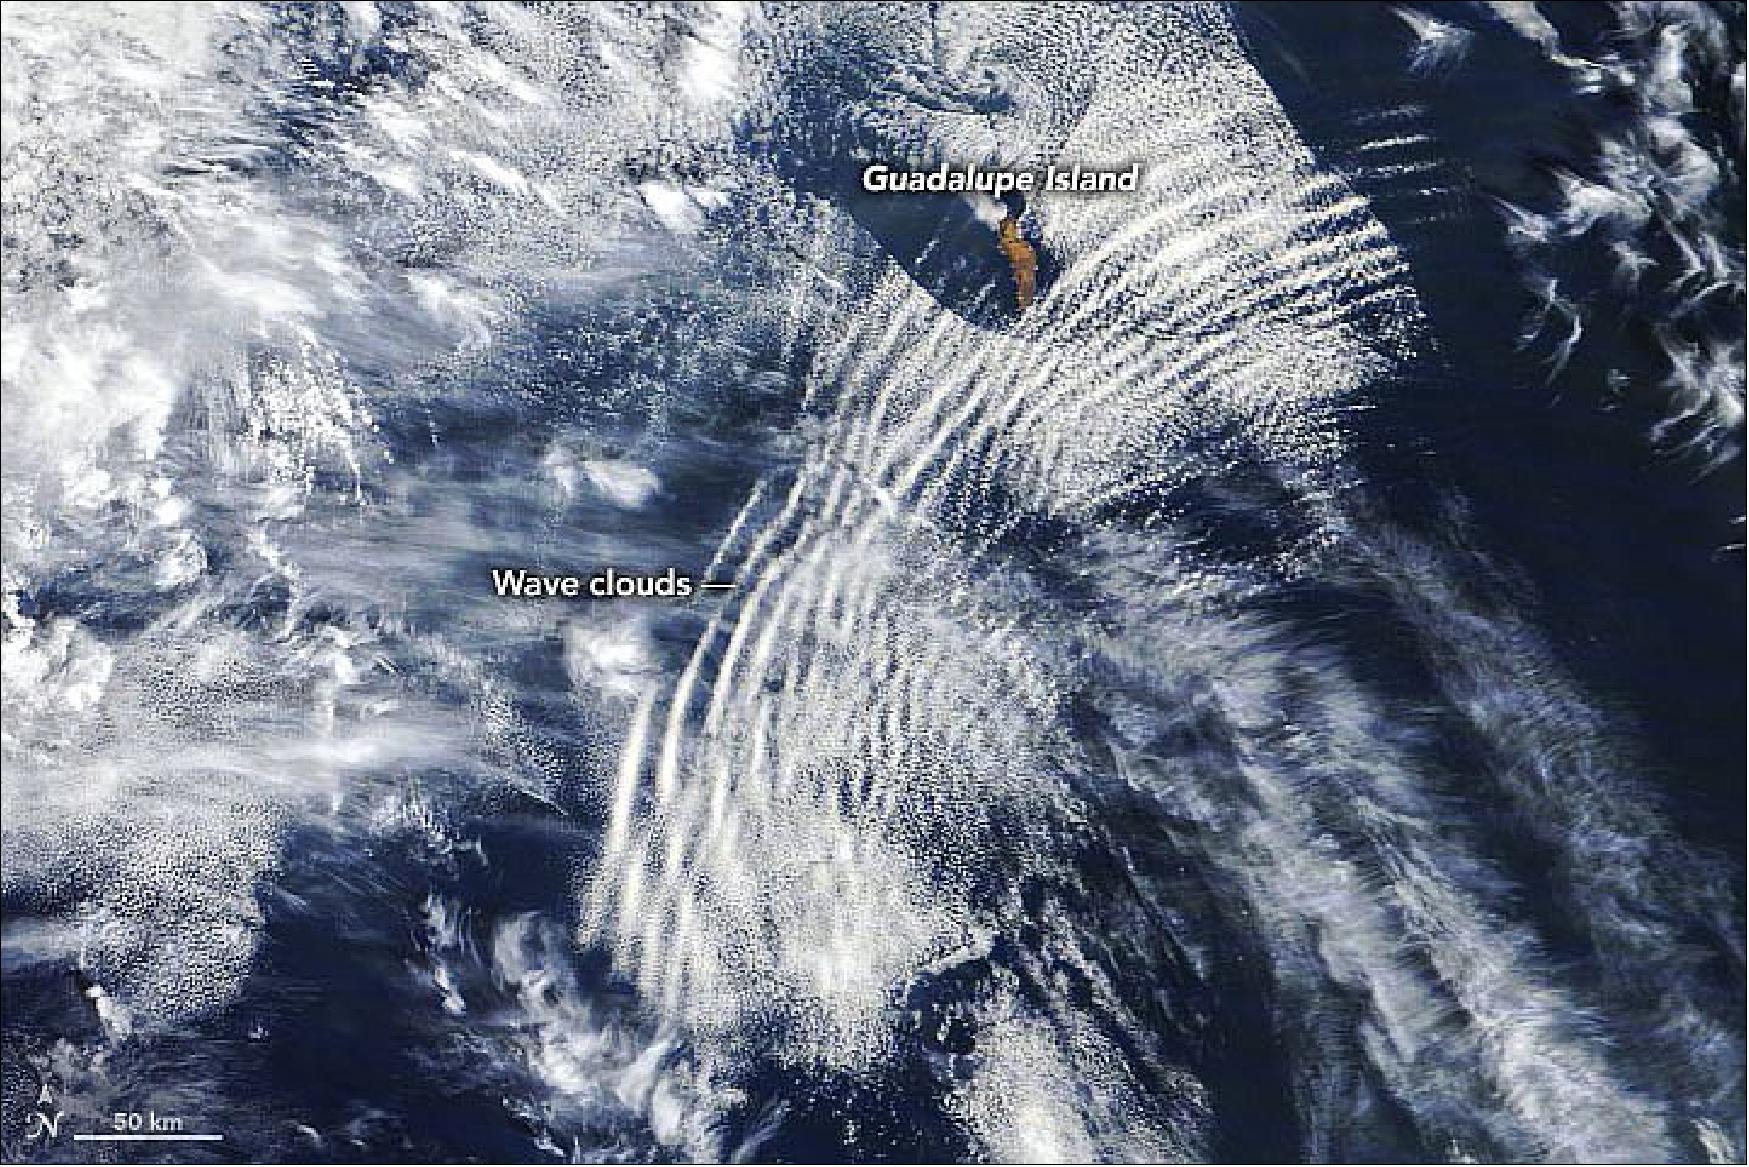
• October 2, 2020: Every day, some 1.3 million tons of sediment pour from the mouth of the Amazon River into the Atlantic Ocean. The abundance of sediment—bits of rocks, soil, and clay carried by currents or resting on the bottom—is what gives much of the main stem of the Amazon River its milky brown color. 44)
- Note also the low-altitude cumulus clouds, sometimes called popcorn clouds, tracing the landscape. Warm, humid air rises from the forest and cools as it rises, resulting in the development of the clouds. But the river waters—and the air above them—are cooler, so there is less moisture rising into the air.
- Almost all of the sediment that reaches the Atlantic Ocean via the Amazon River has traveled a tremendous distance, much of it from the foothills of the Andes Mountains in Peru and Bolivia. Hydrologists estimate that erosion from the mountainous far western part of the river basin contributes about 85 to 90 percent of all the sediment that reaches the sea.
- Most of the sediment comes from three "whitewater" rivers that flow through the western Amazon: the Marañón, the Ucayali, and Mamoré. In contrast, the "clearwater" rivers found in the southern Amazon lowlands and the leaf-stained "blackwater" rivers found in the western and northern Amazon transport minimal amounts of sediment.
- The effects of the sediment are not just aesthetic. The muddy water is loaded with nutrients (such as nitrogen and phosphorous) and organic matter that make whitewater rivers and the várzea floodplain forests particularly rich in plant and animal species, notably fish. The estuary region shown here is known for its many freshwater and marine catfish and croakers. Many of the commercial fisheries in the estuary target piramutaba and marine shrimp.
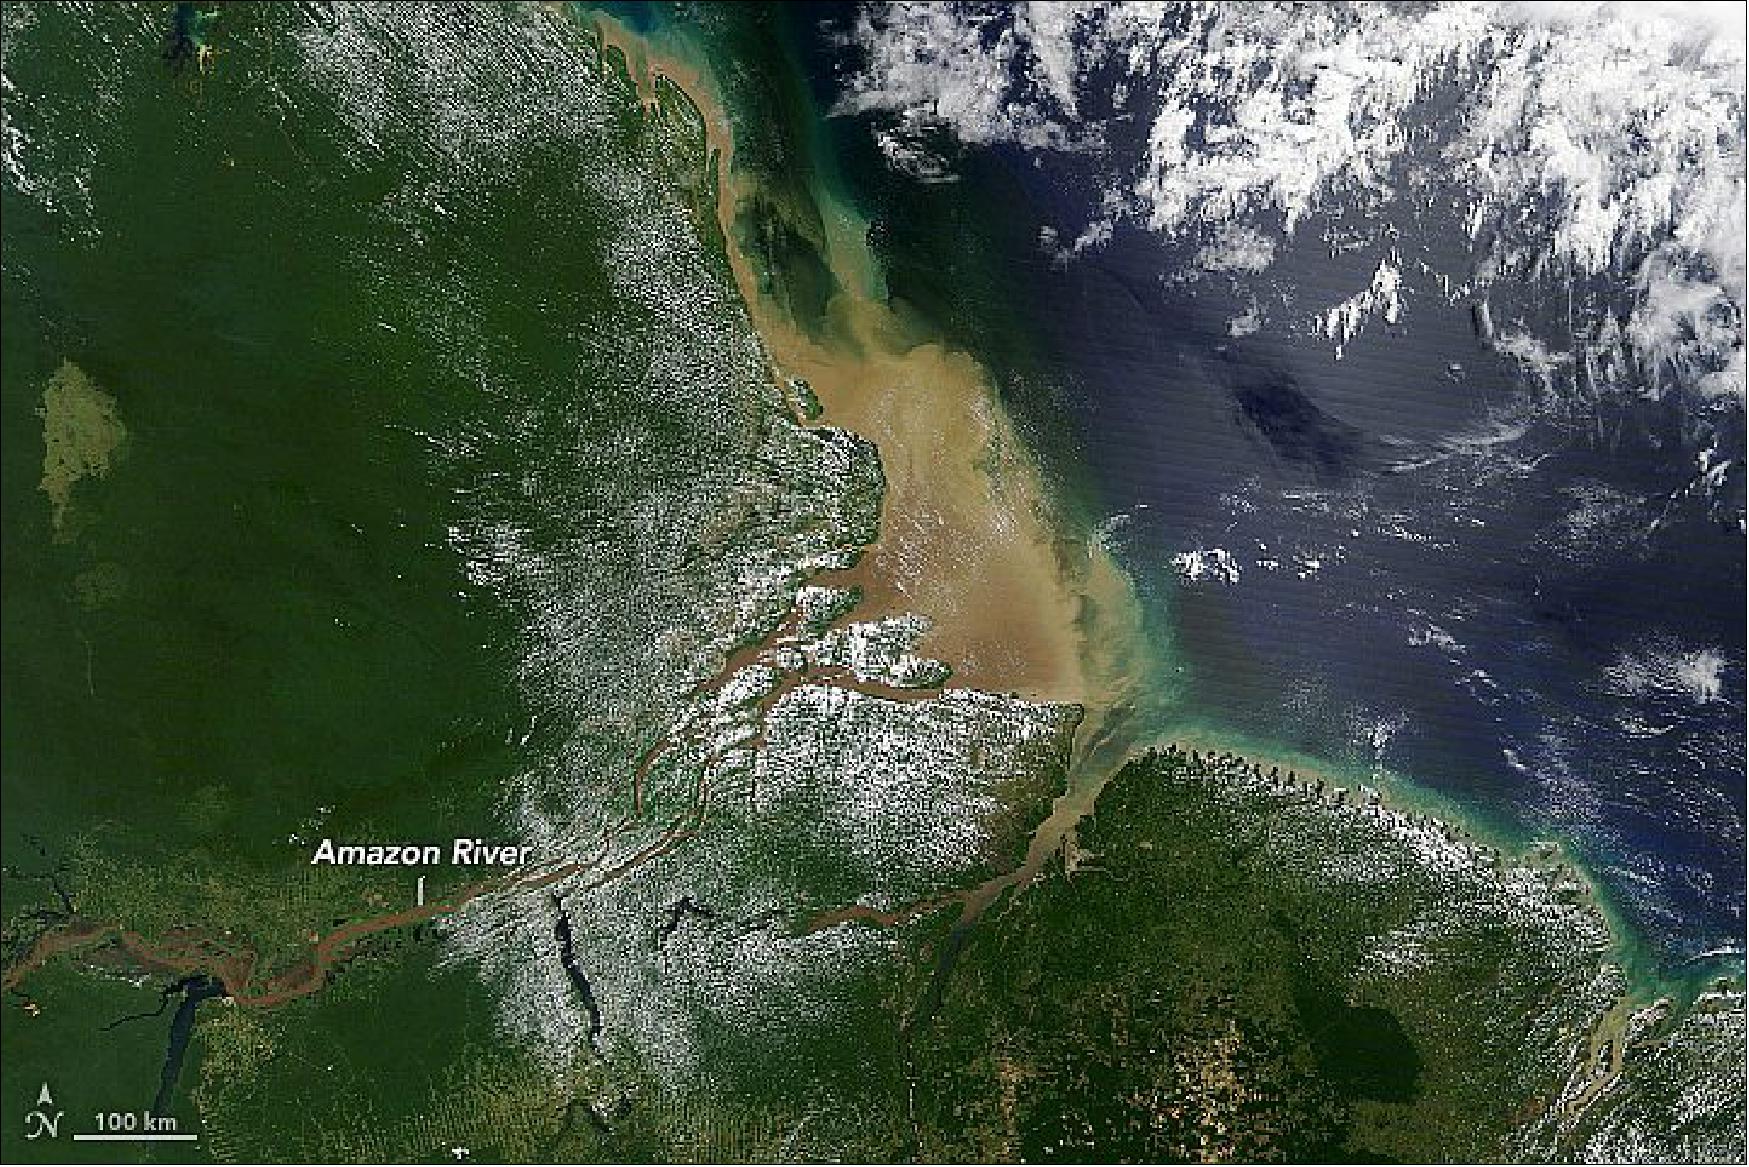
• September 22, 2020: In the late summer of 2019, the waters off of Newfoundland teemed with phytoplankton for three weeks. It seemed extraordinary at the time. One year later, the Northwest Atlantic bloomed persistently for two months, and the reasons are not entirely clear. 45)
- The turquoise-colored bloom was likely made up of coccolithophores of the species Emiliania huxleyi, which are common to this area in summertime. The phytoplankton have chalky outer shells made of calcite, so they give the water a milky blue color when they aggregate in great numbers. Emiliania huxleyi cells are about 5 µm across — 1,000 times smaller than a grain of sand—so their numbers have to be incredibly abundant for MODIS to detect them.
- Phytoplankton are common in the North Atlantic in spring and summer; they are also becoming more common around the Arctic Ocean and other far northern seas. But it is not often that one species blooms so much for so long because any given species needs just the right balance of sunlight, nutrients, water temperatures, and salinity. In recent years, Emiliania huxleyi has bloomed most abundantly in this area in mid-summer. It is not yet clear why the bloom here lasted so long and late in 2020.
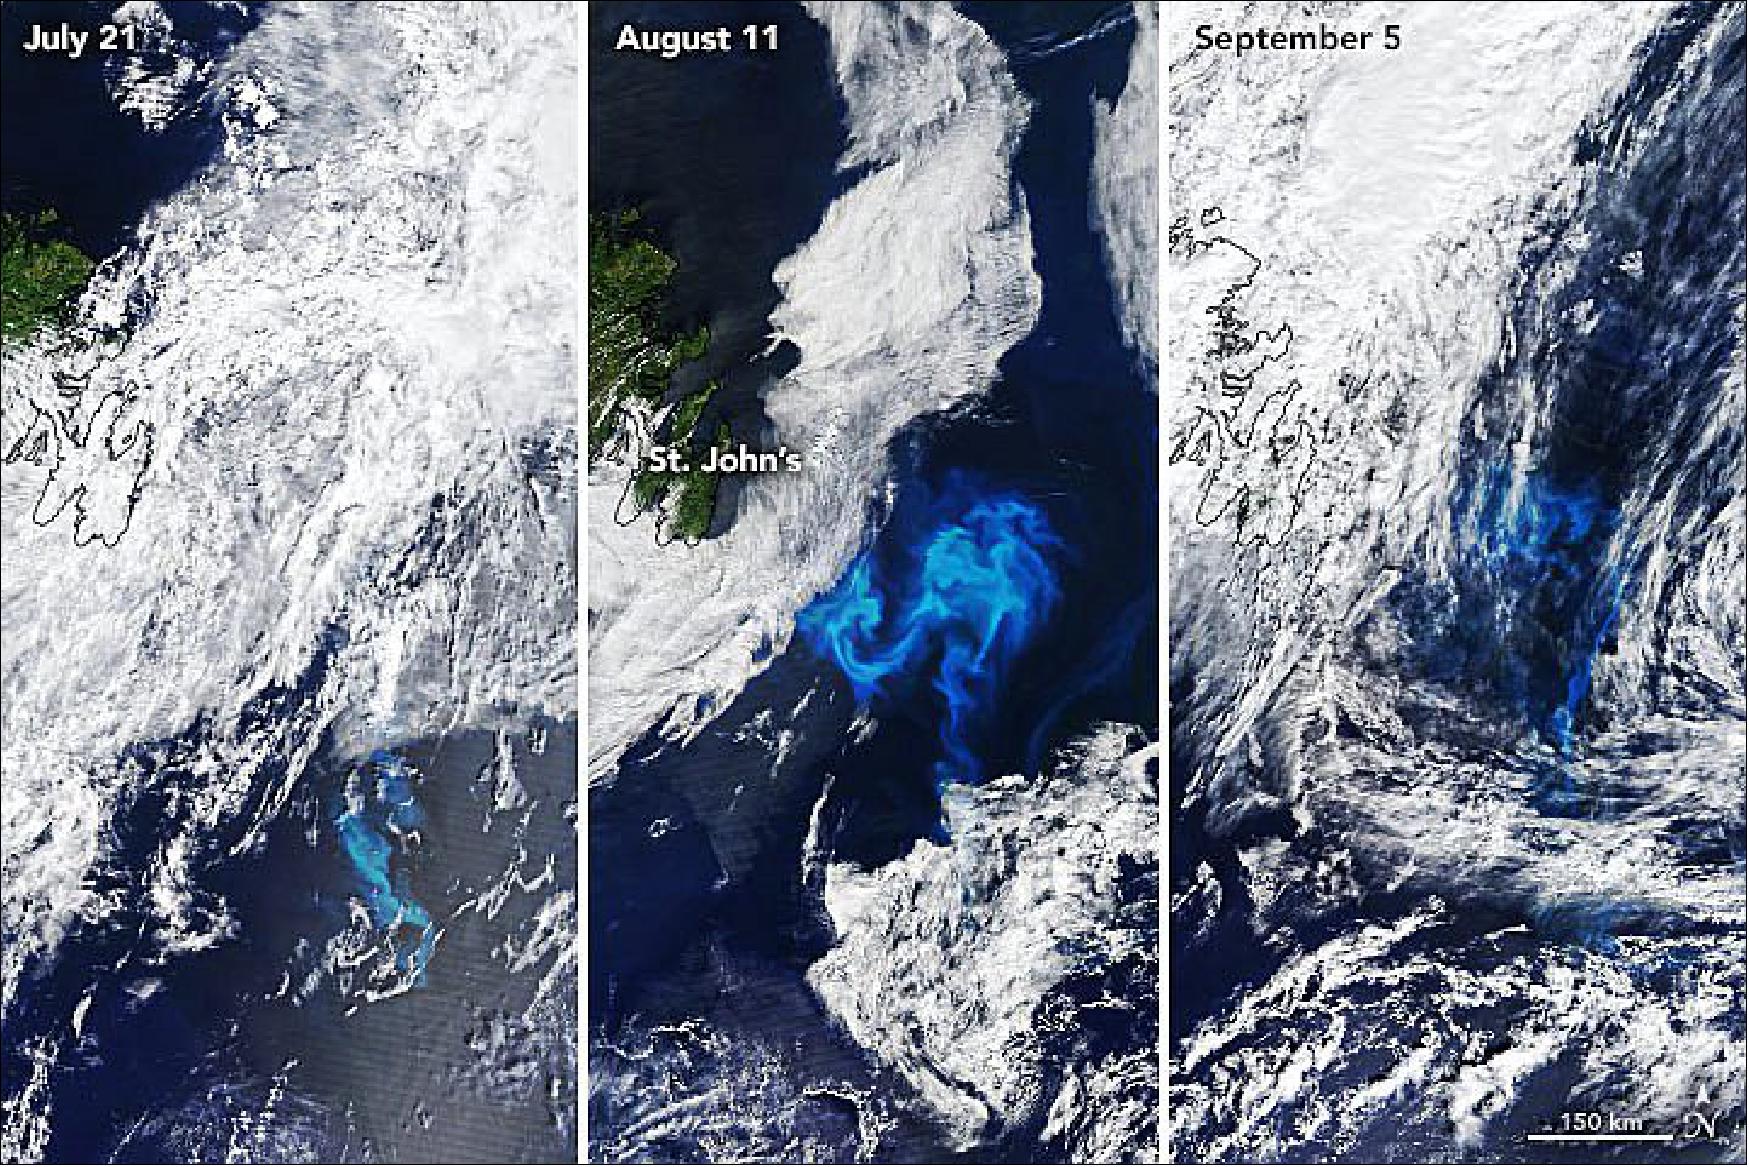
- "Seven weeks is a long time for a single bloom driven by a single nutrient enrichment event. Usually, those blooms last two to three weeks," said Barney Balch, a biological oceanographer at Bigelow Laboratory for Ocean Sciences. "However, events this long are not uncommon for features that are continually being sustained by a specific ocean process—such as a supply of water with a specific suite of nutrients. (The Patagonian Shelf bloom is one such example.) In such long-lived features, the coccolithophores outcompete everything else and can sustain maximal growth rates for extended periods."
- "One might guess that the location of the bloom was in some way tied to the submarine topography," suggested Kuring. "Shelf-edge dynamics probably have something to do with funneling the right conditions to the bloom."
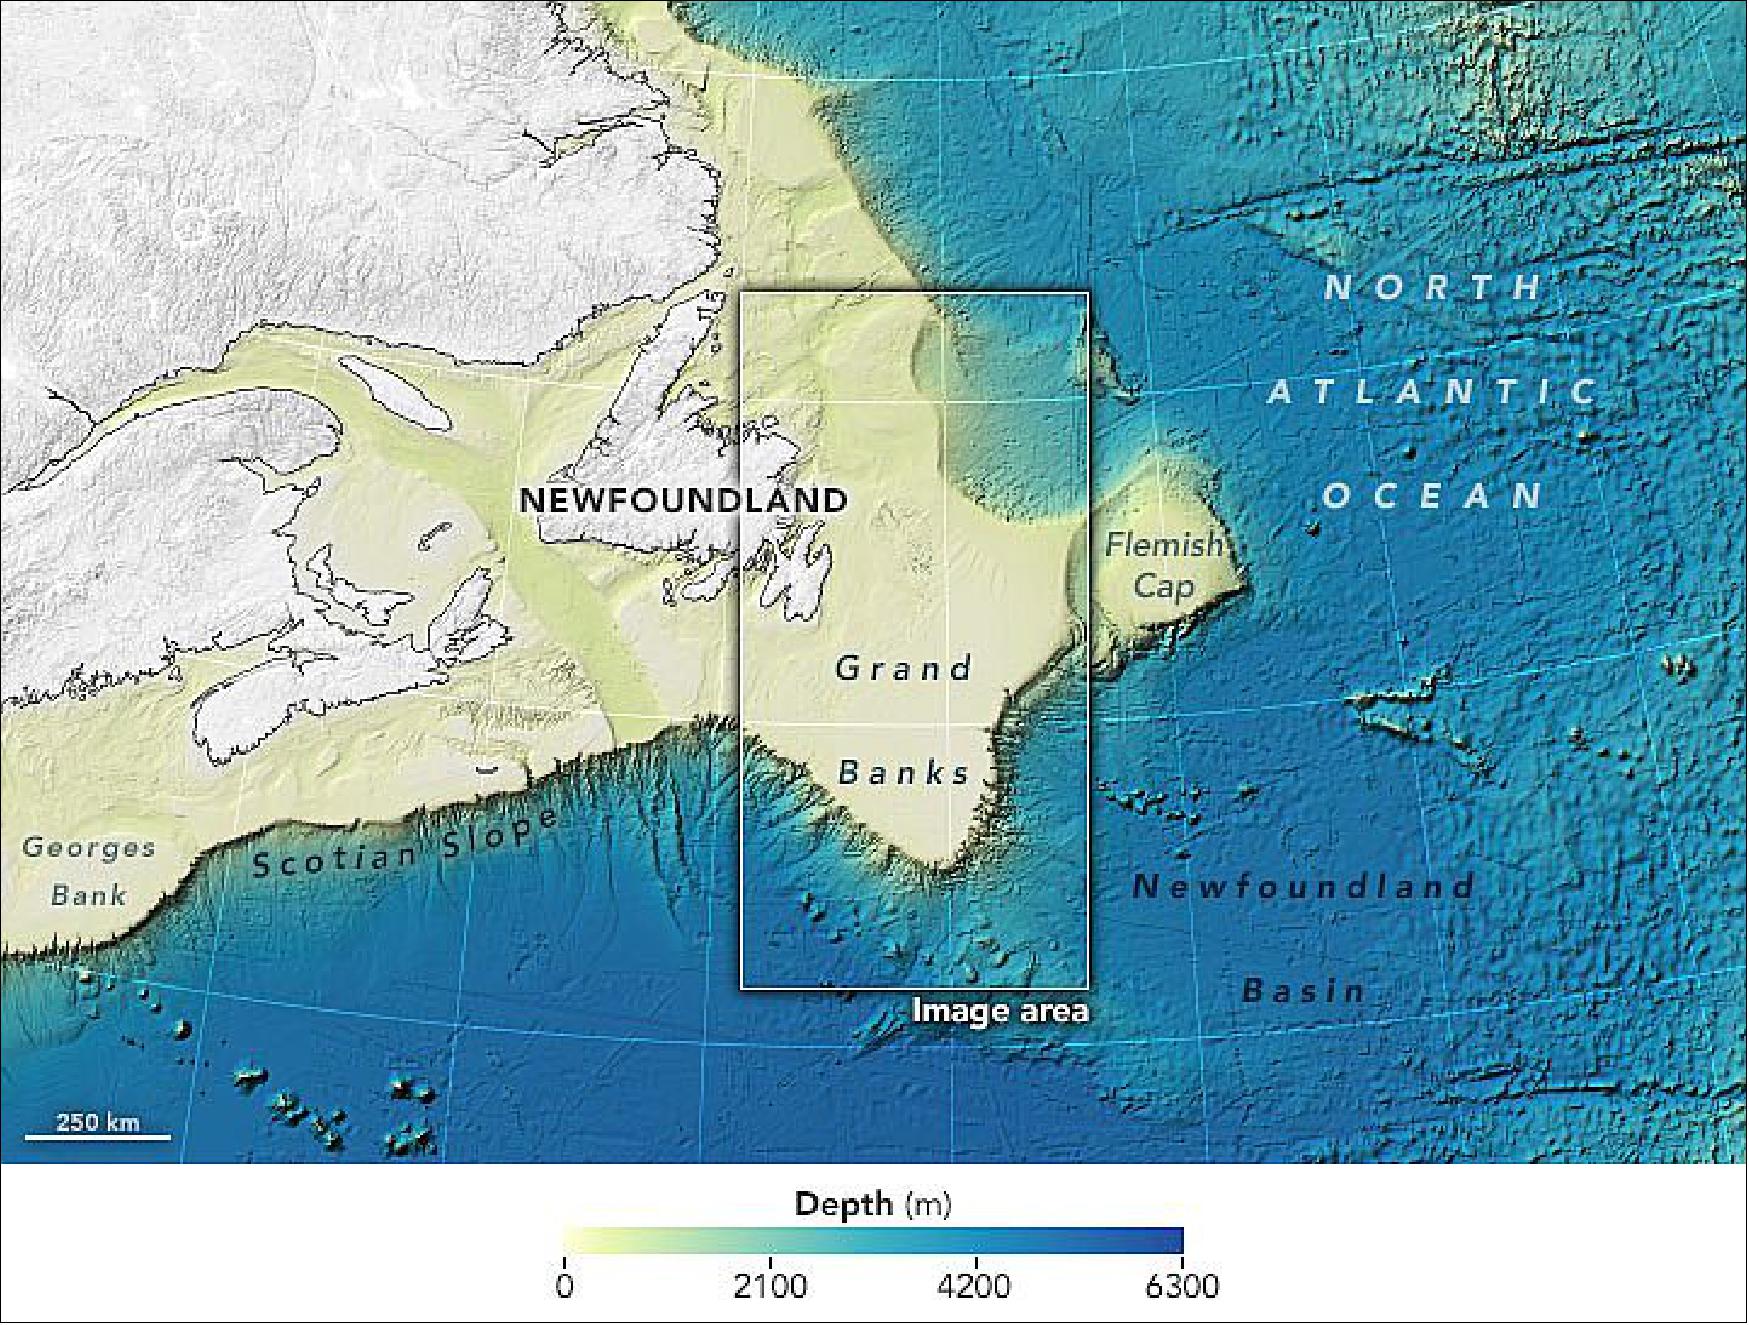
The plant-like organisms become food for zooplankton, shellfish, and other marine creatures on up the food chain. The waters near the Grand Banks are incredibly productive and home to some of the richest fisheries in the world, particularly for swordfish, haddock, lobster, cod, and scallops.
• September 14, 2020: Almost all of the 46 cm (18 inches) of rain that falls in Namibia's Etosha National Park each year arrives between October and March. The influx of moisture—a boon for the wildlife—completely transforms the landscape. It greens parched grasslands, replenishes ephemeral streams and watering holes, and sometimes pools enough to cover a flat basin with a layer of water that extends for thousands of square kilometers. 46)
- When the rains slow and then cease during the dry season (April through September), any water in the basin slowly evaporates, depositing salt and other minerals on the land surface in the process. Over time, this cycle of flooding and evaporation has built up a mineral-encrusted surface called a salt pan. In fact, the striking white surface of the salt pan is what originally earned Etosha Pan its name. In the language of the local Ovambo people, etosha means "great white place."
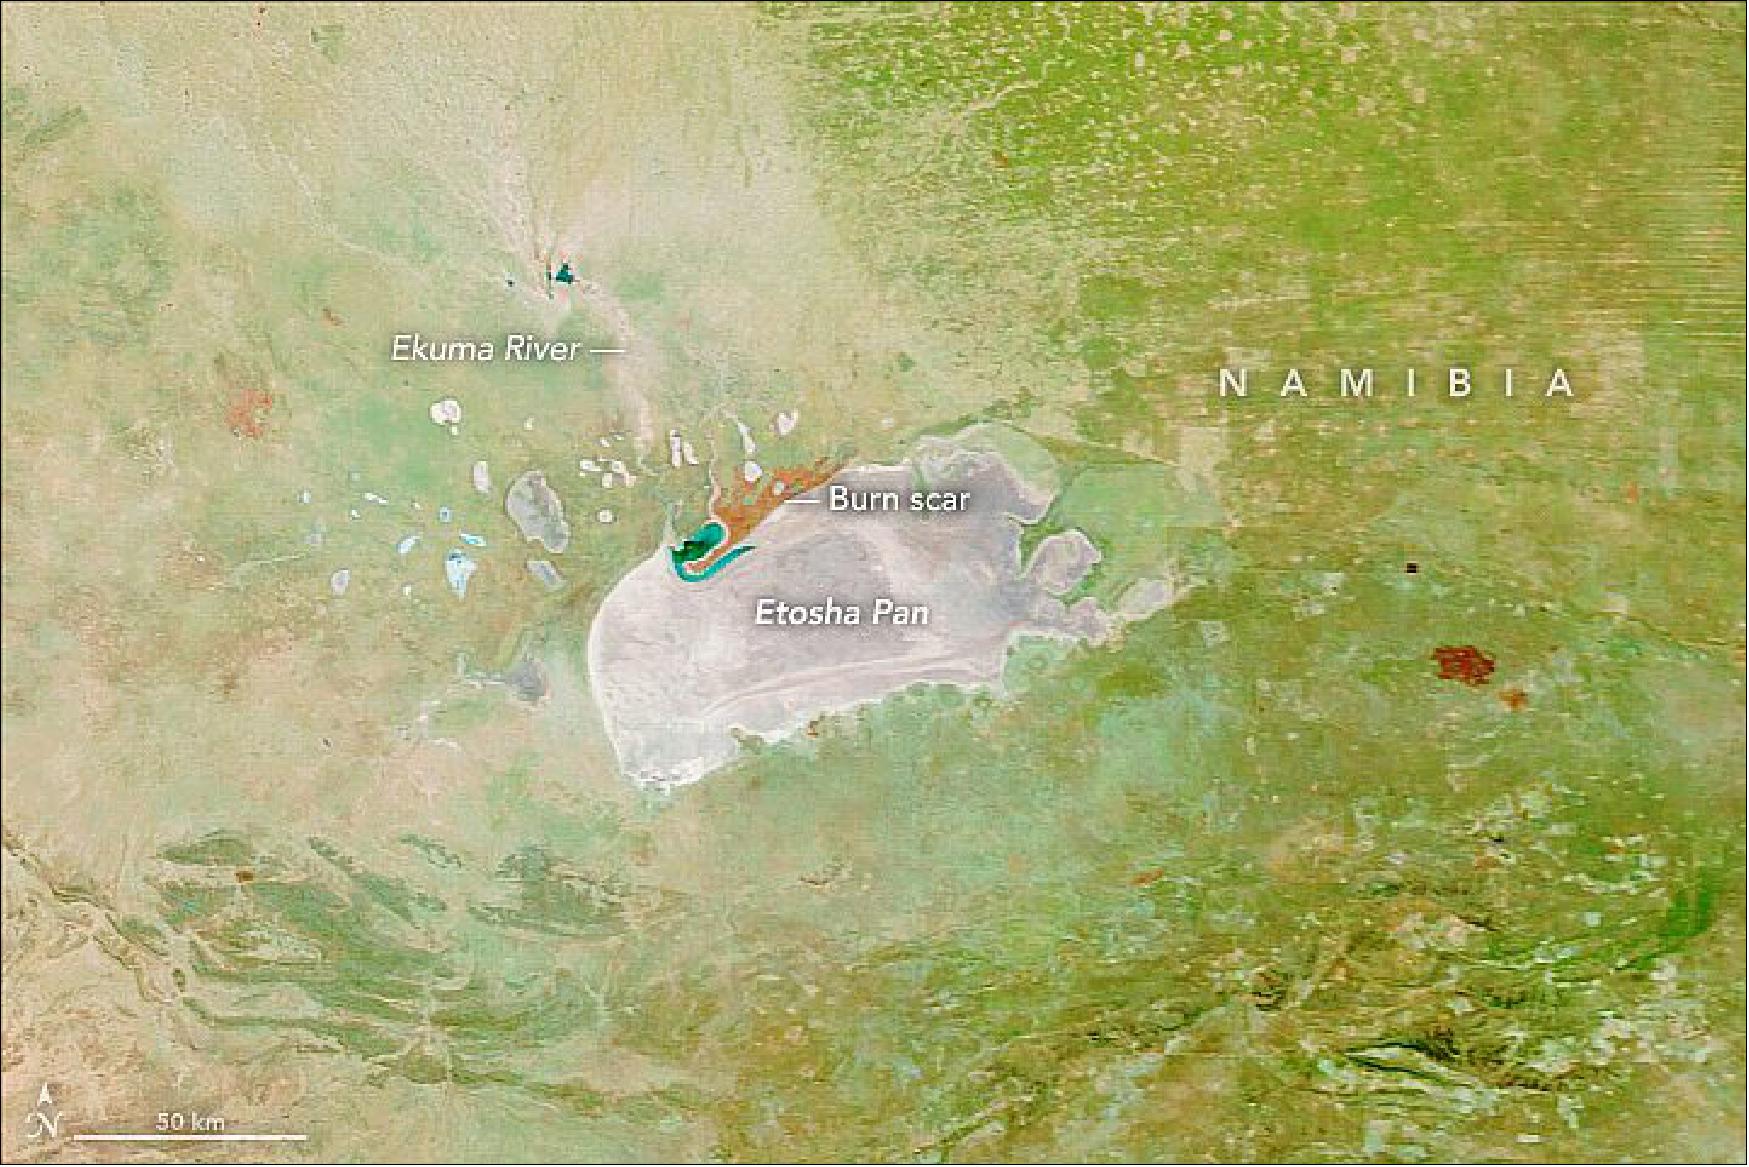
- Notice that a few new burn scars are visible in the August 2020 image (Figure 72). They were likely intentionally set management fires, which help reduce the likelihood of more destructive fires breaking out later. The satellite imagery shows that the scar closest to the Ekuma River burned for a few days beginning on July 13, 2020.
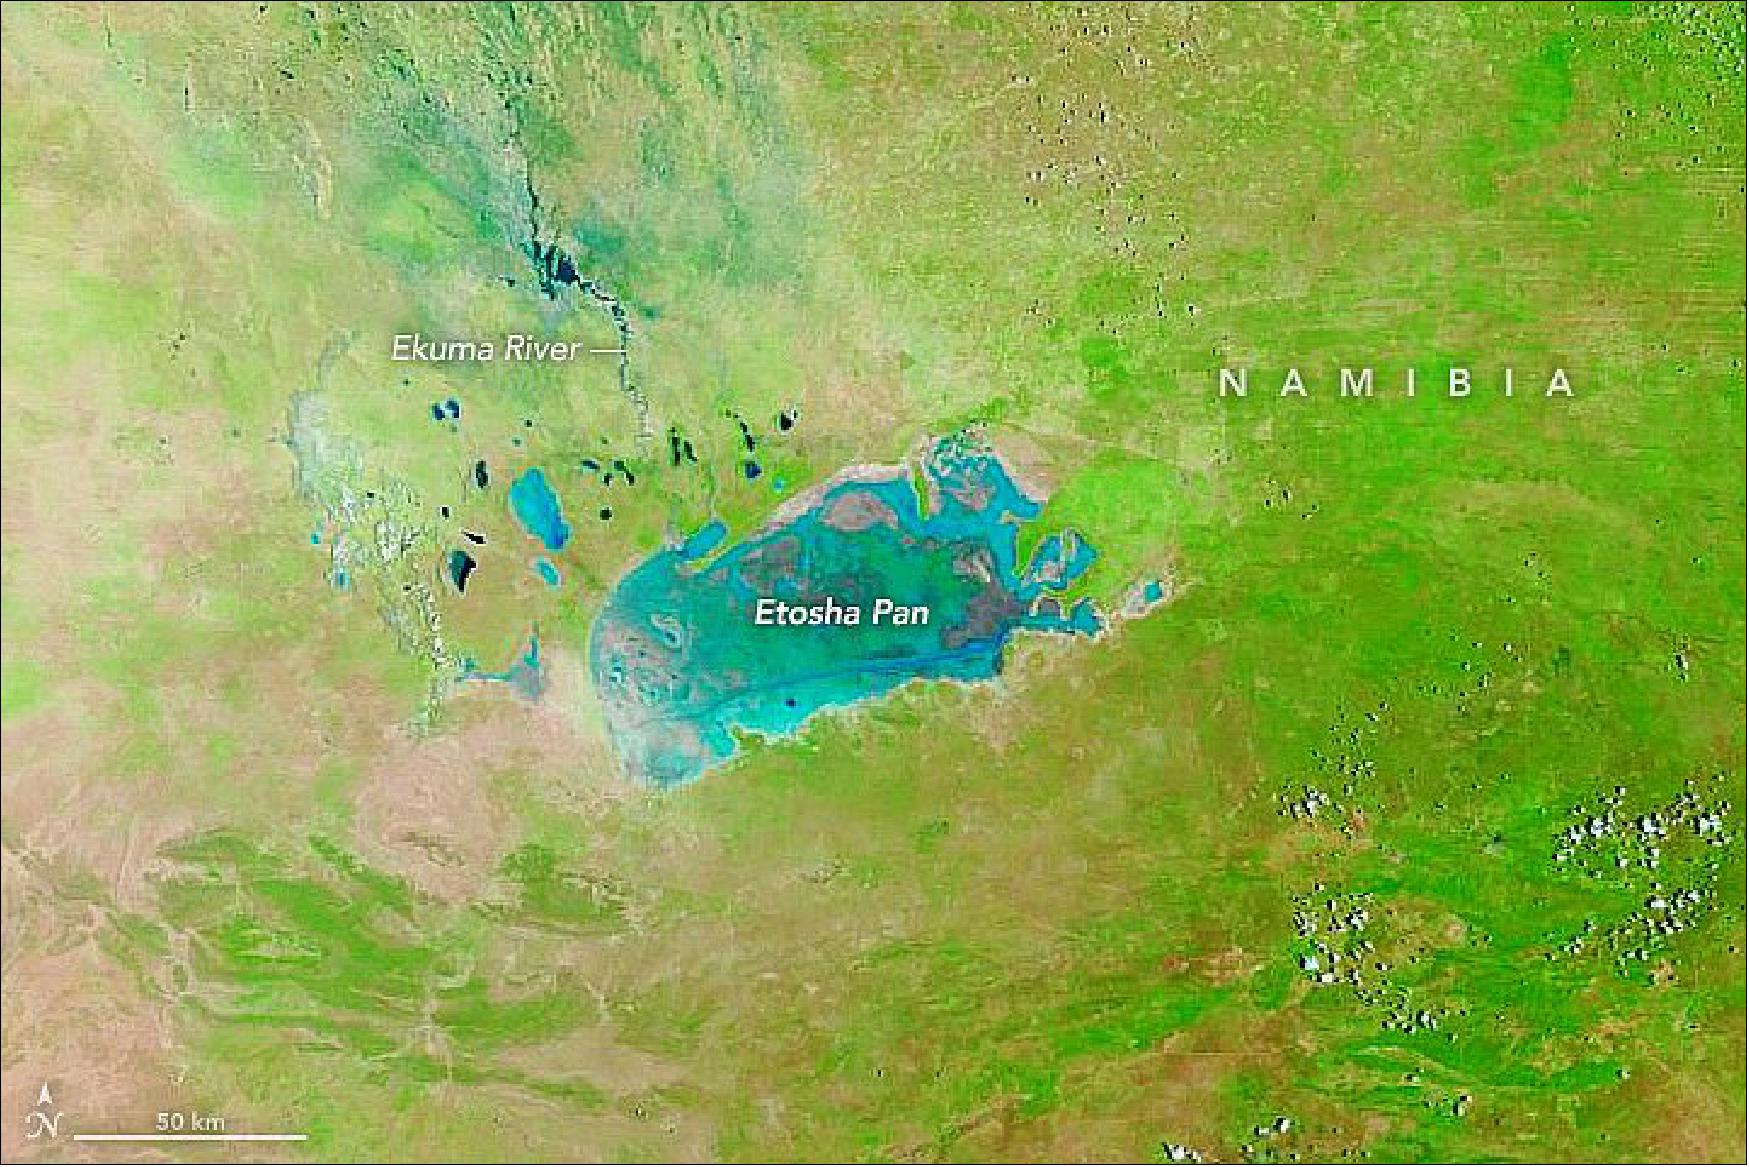
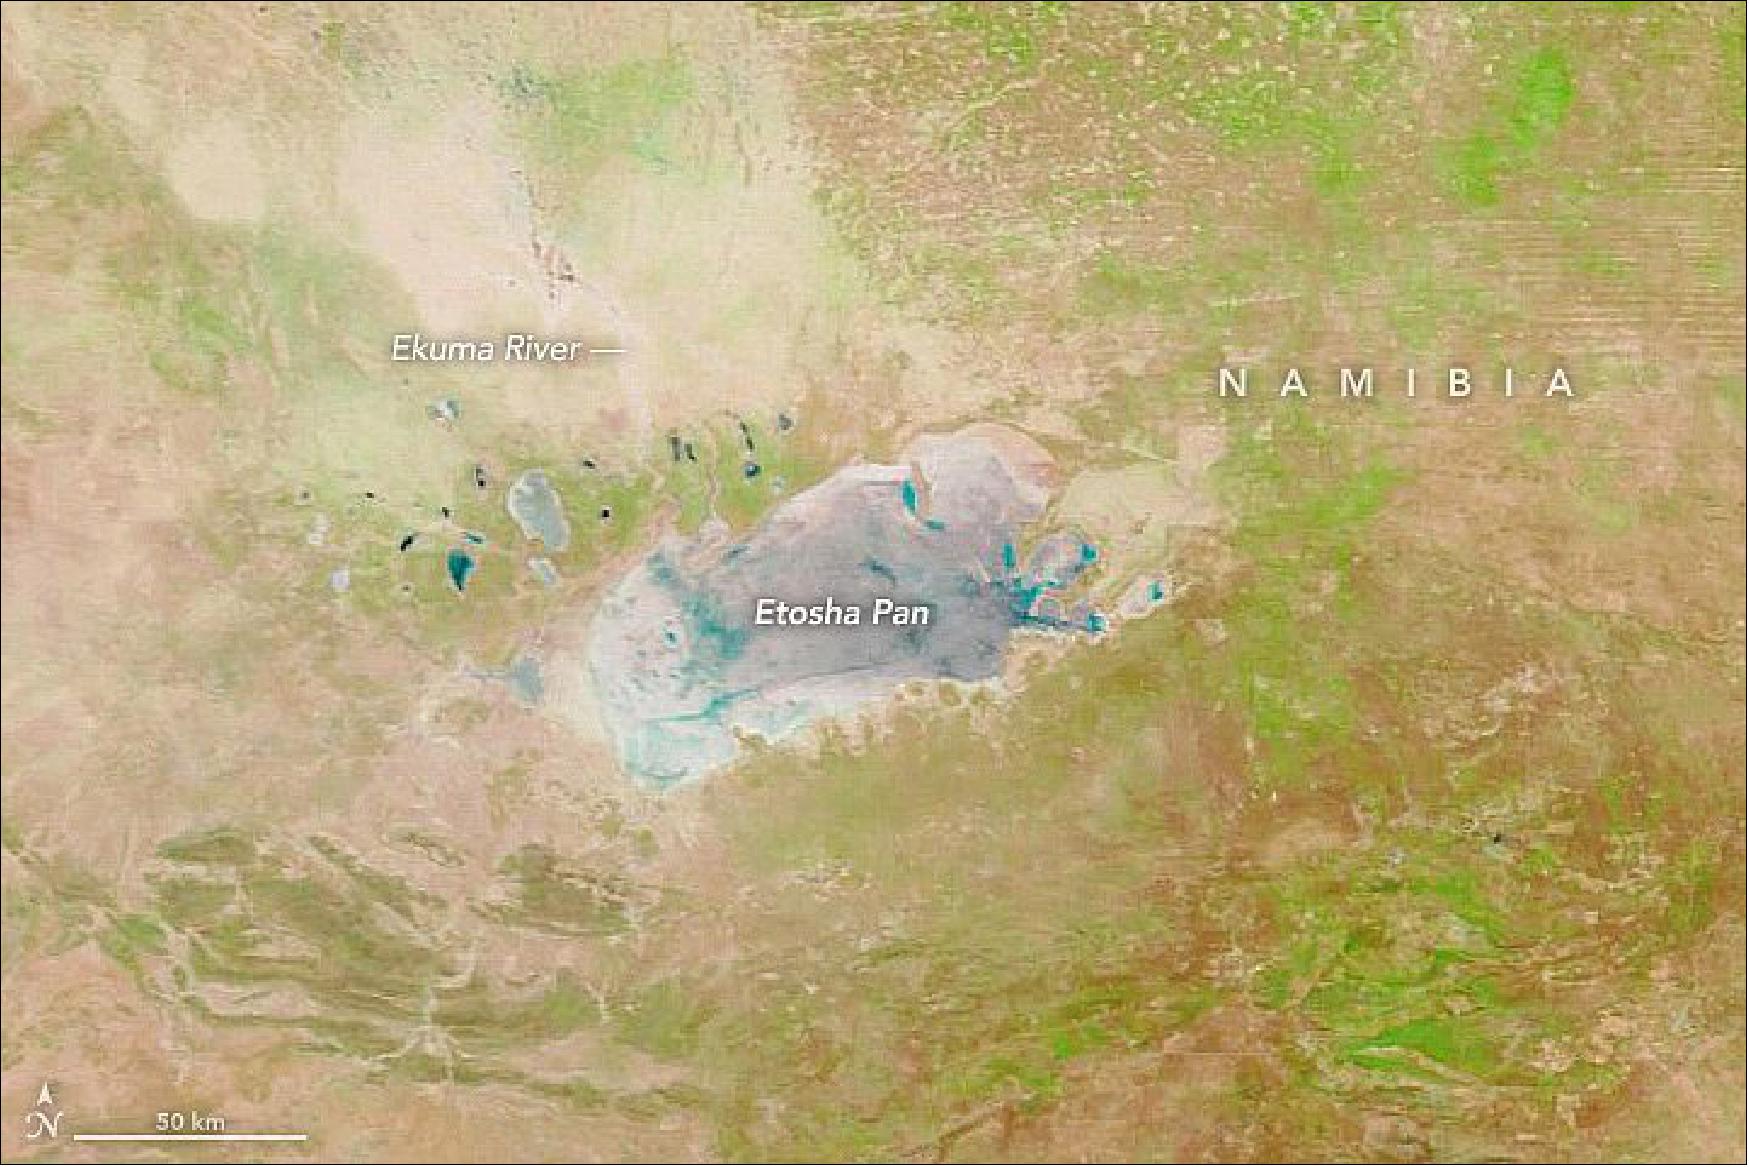
- Though unusually dry weather left Etosha Pan without water in December 2019, just two months later a surge of rain had refilled much of it. By late August 2020, the salt pan had mostly dried again, aside from some water near the mouth of the Ekuma River.
- Etosha National Park supports large populations of elephants, lions, rhinos, and several other animals. The dry season is one of the best times for visitors to see animals because they often congregate around shrinking bodies of water.
• September 9, 2020: Many wildfires continue to rage in the western United States. 47)
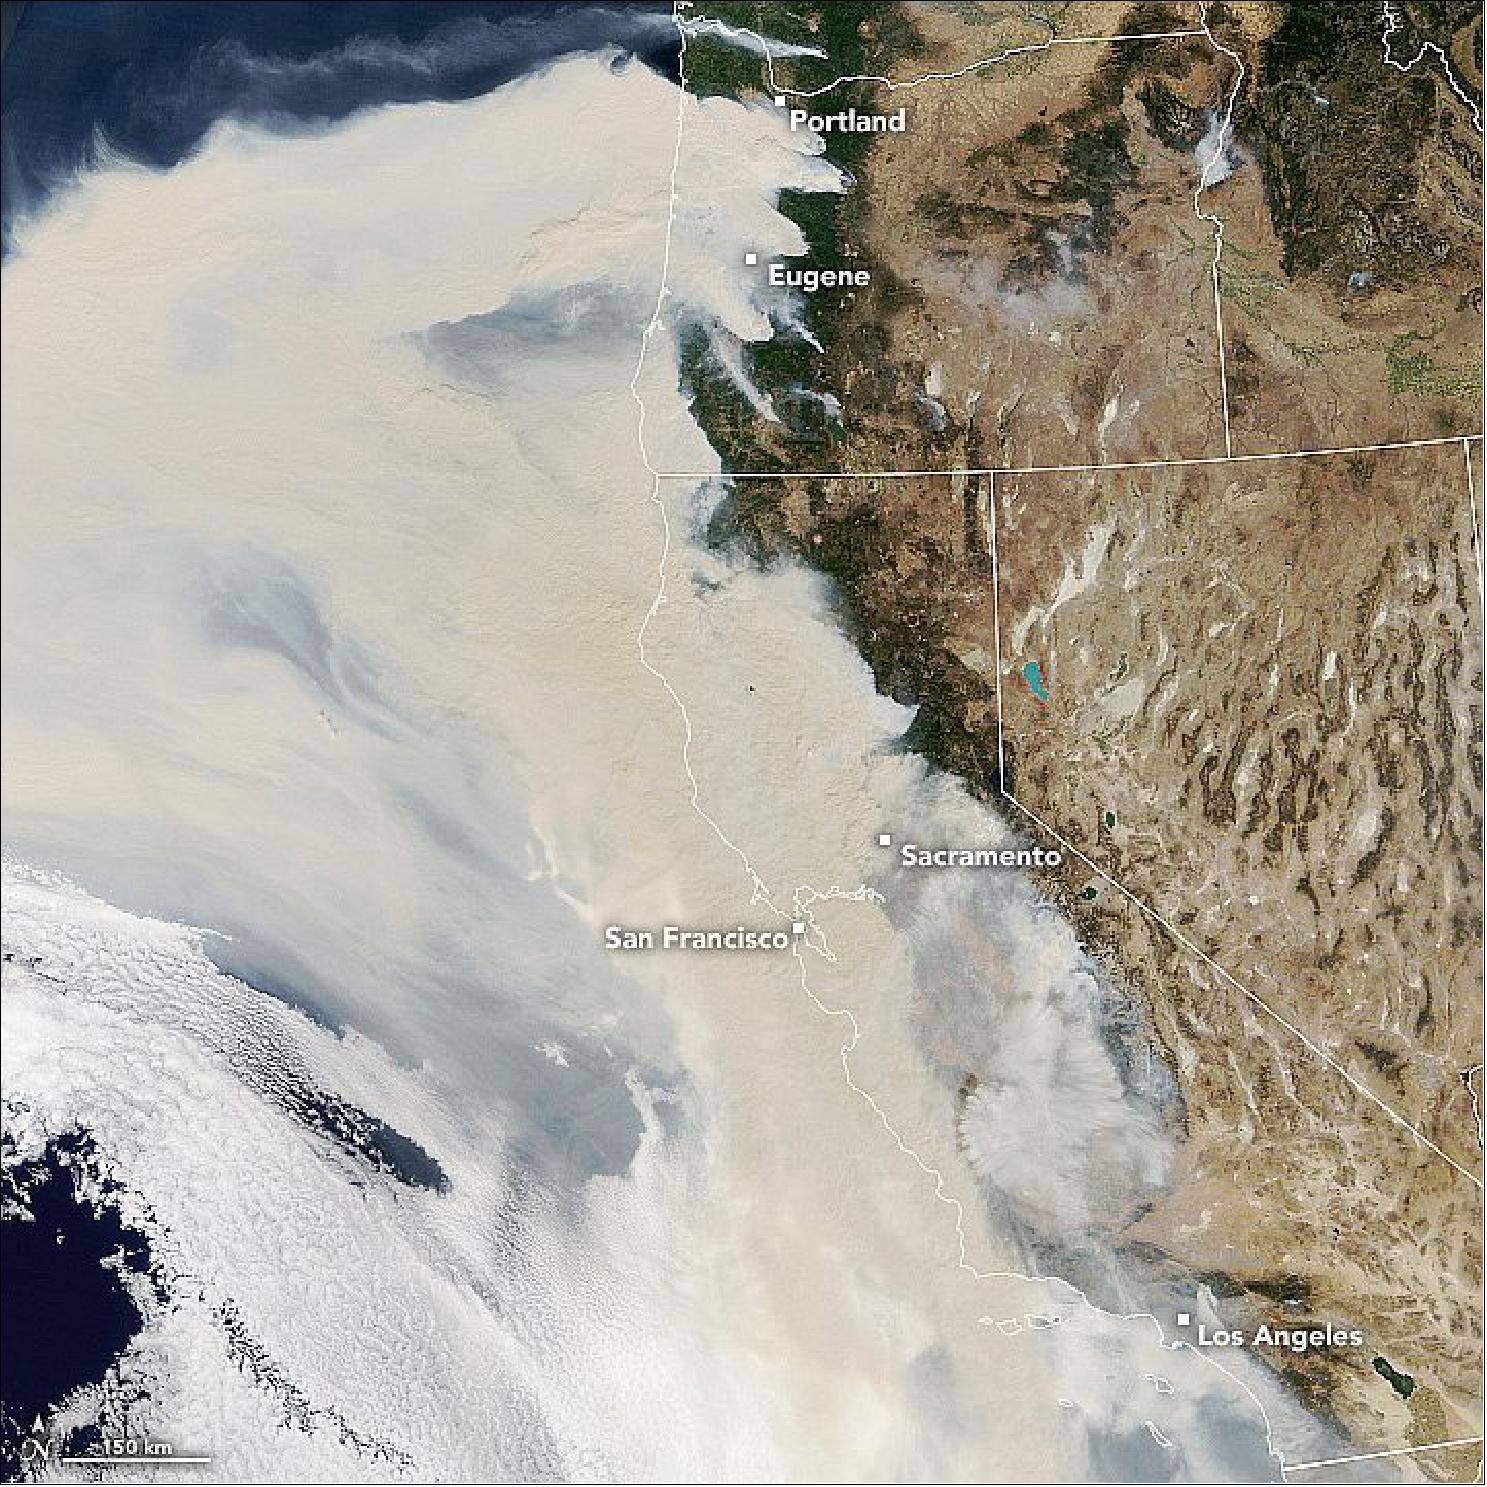
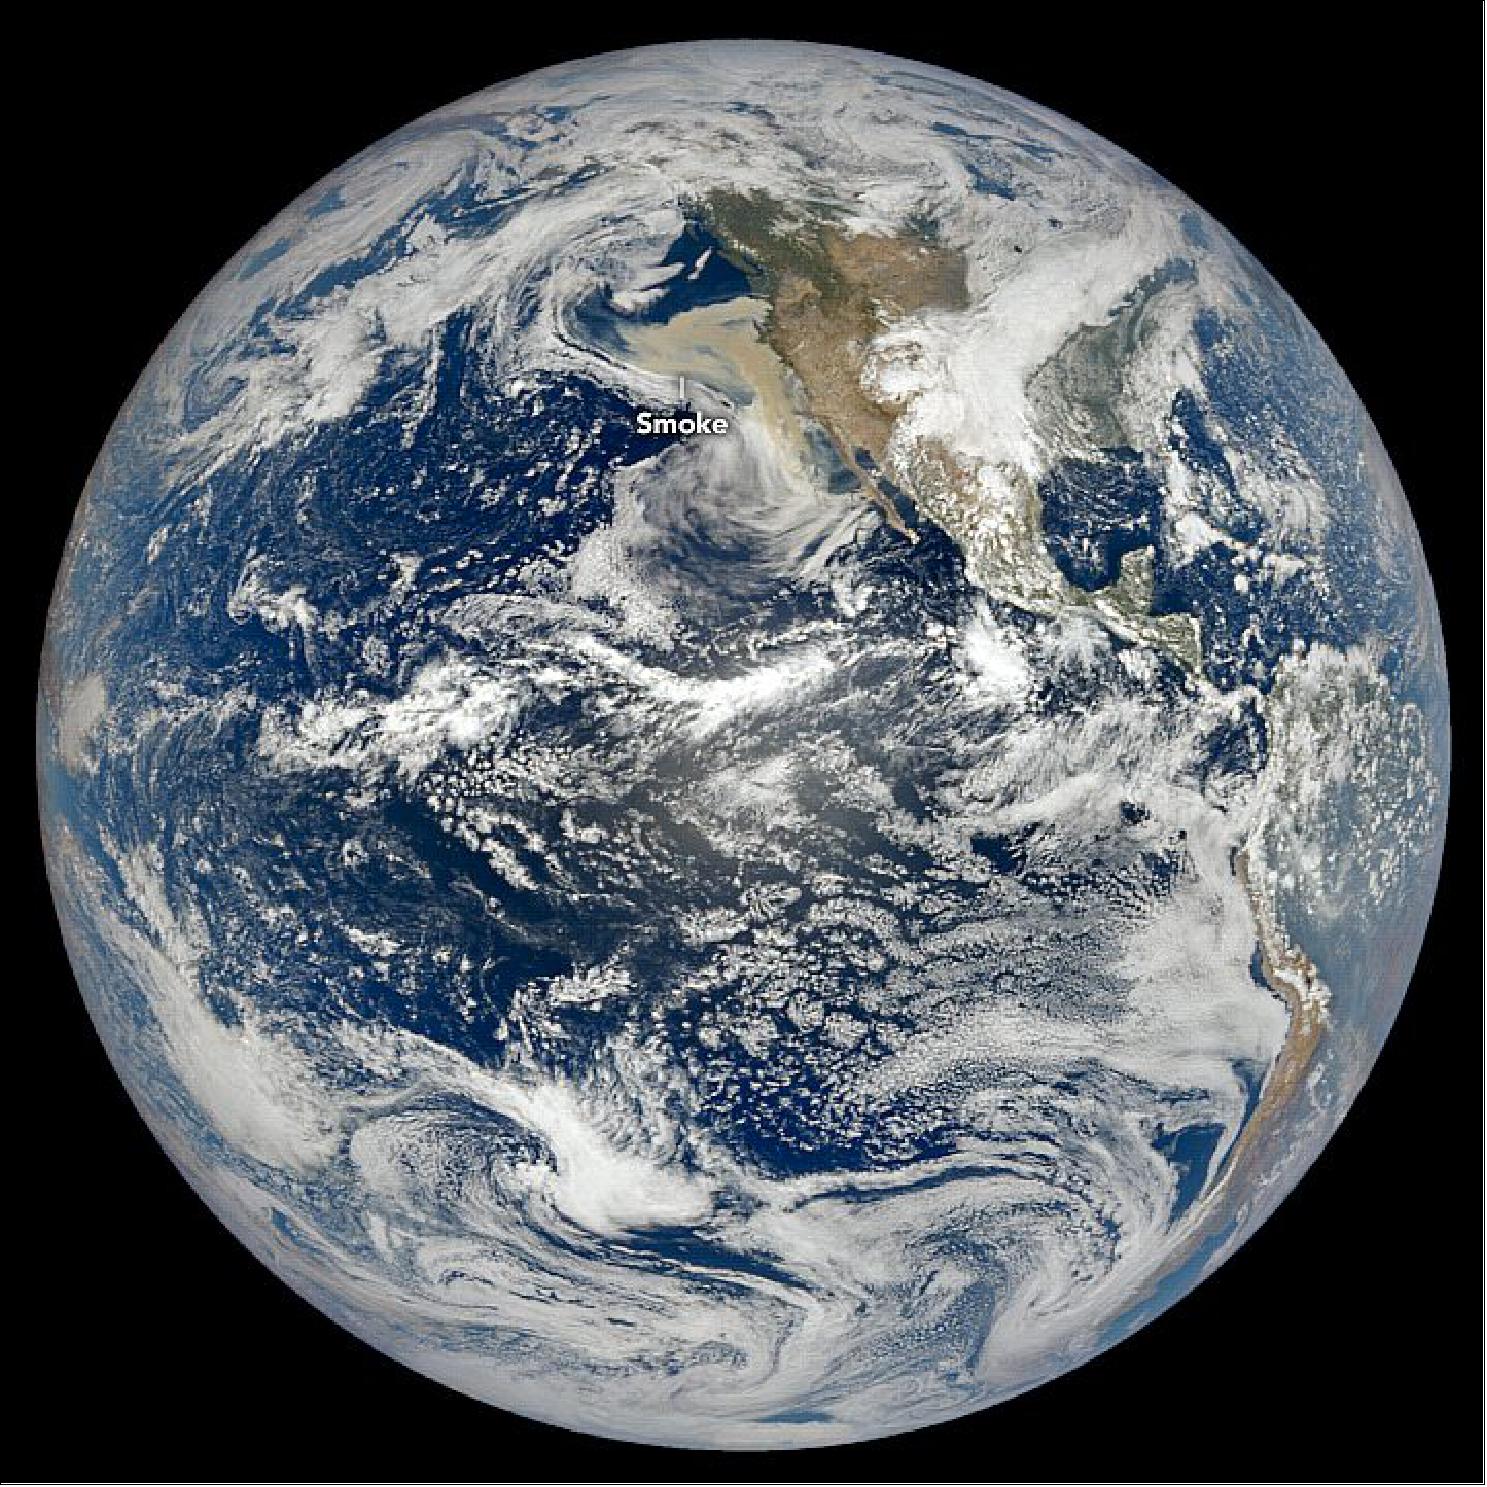
• August 27, 2020: Government meteorologists issued unusually dire warnings as a large hurricane neared the U.S. Gulf Coast on August 26, 2020. After rapidly strengthening as it passed across the Gulf of Mexico, Hurricane Laura was poised to make landfall near the border between Texas and Louisiana. The category 4 storm was expected to unleash strong winds, heavy rains, and a potentially catastrophic storm surge on an area that has not taken a direct hit from a category 4 or 5 storm since the start of modern hurricane records. 48)
- The gravest concern was for a coastal zone extending from Sea Rim State Park, Texas, to Intracoastal City, Louisiana—an area that National Hurricane Center forecasters warned could face a storm surge of 15 to 20 feet (5 to 6 meters) at the coast and flood waters that penetrate as far as 40 miles (60 kilometers) inland.
- A storm surge occurs when cyclonic winds from an approaching storm push a wall of extra water onto the shore. The magnitude of a storm surge depends not only on a hurricane's winds, but also on its speed, size, and the angle at which it approaches the coast. The timing of astronomical high and low tides can also affect the height of a surge. Storm surges are often the greatest threat to life and property from a hurricane.
- Hurricane Laura is also expected to deliver destructive winds and rain. Forecasters anticipate that hurricane-force winds will extend as far as 70 miles (100 km) from the storm's center into eastern Texas and western Louisiana. They expect rainfall totals of 5 to 10 inches (13 to 25 cm), with up to 15 inches in some areas—enough to cause dangerous flash floods.
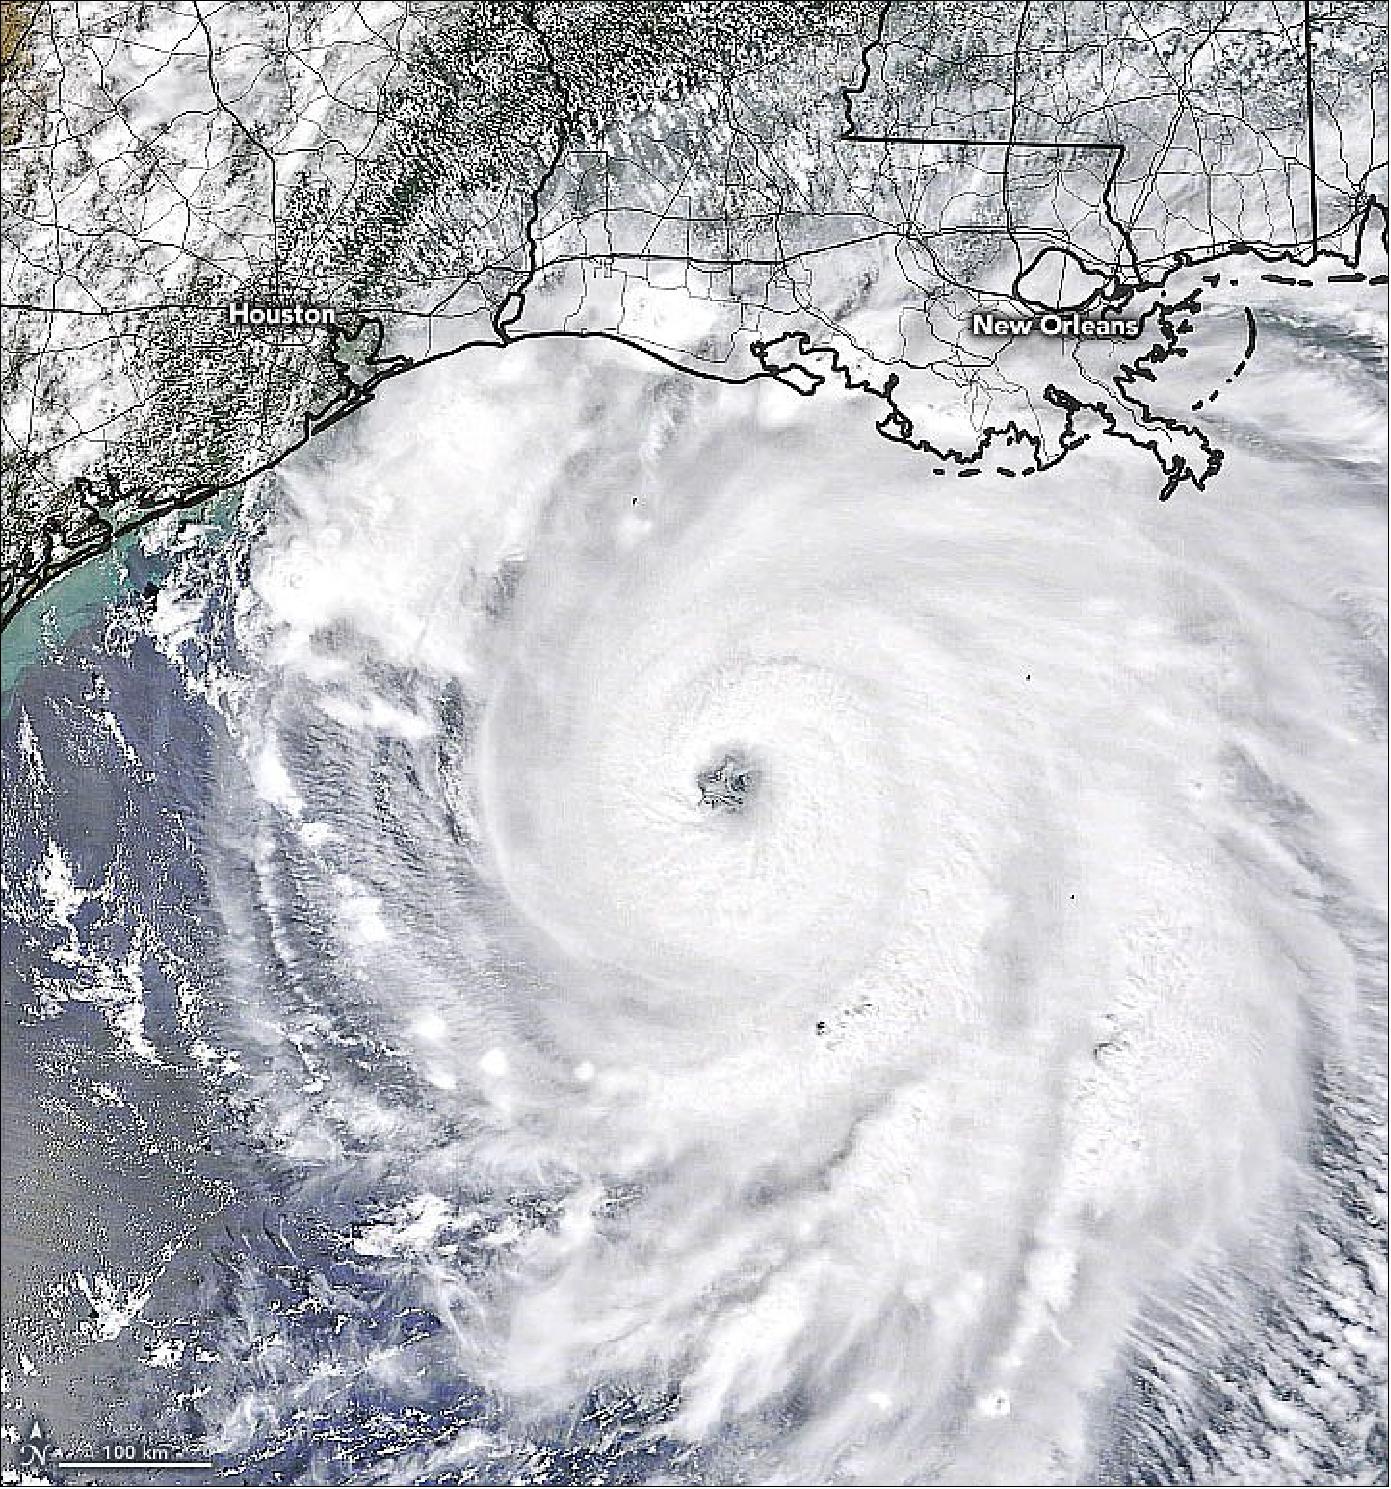
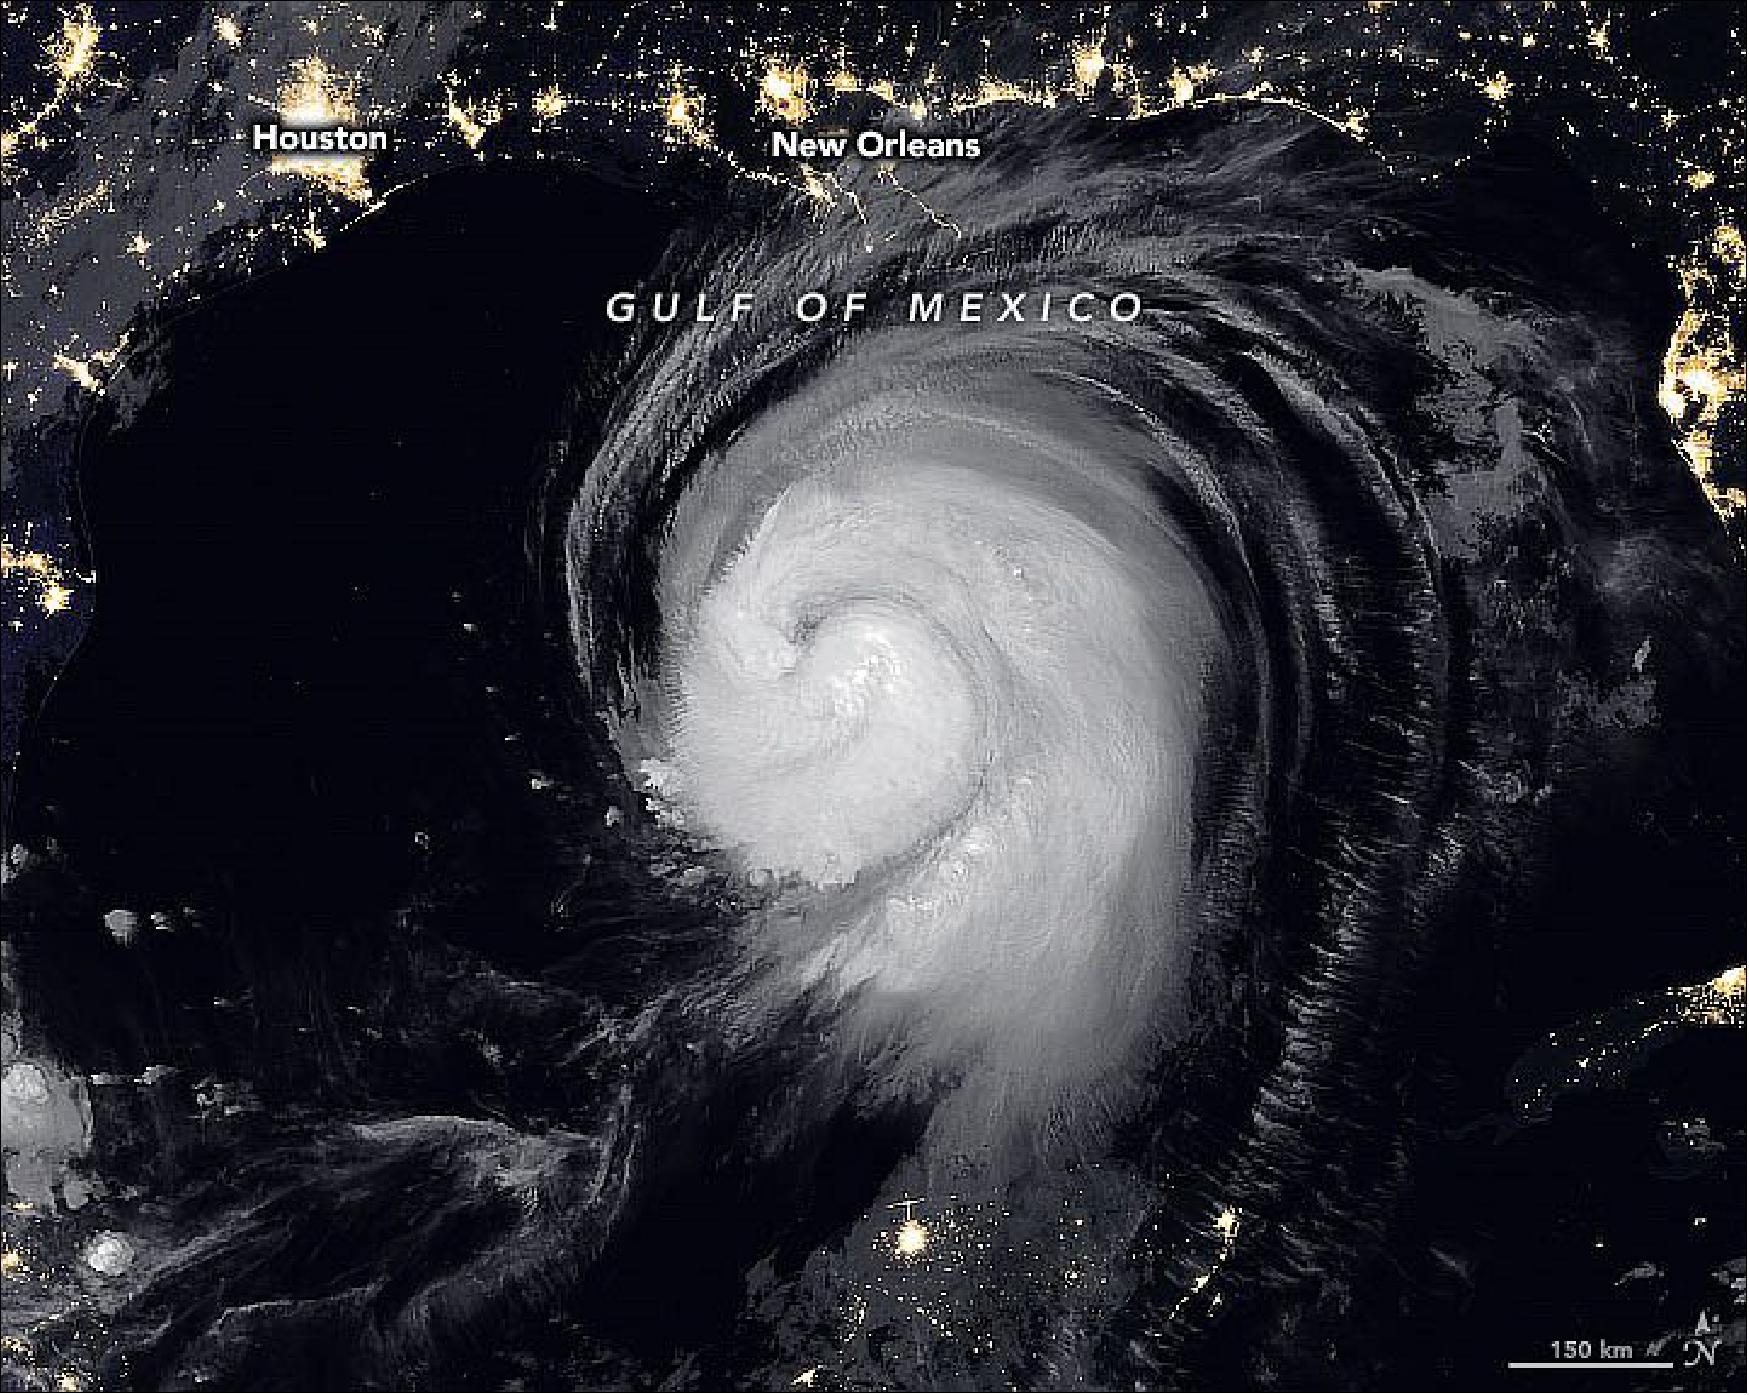
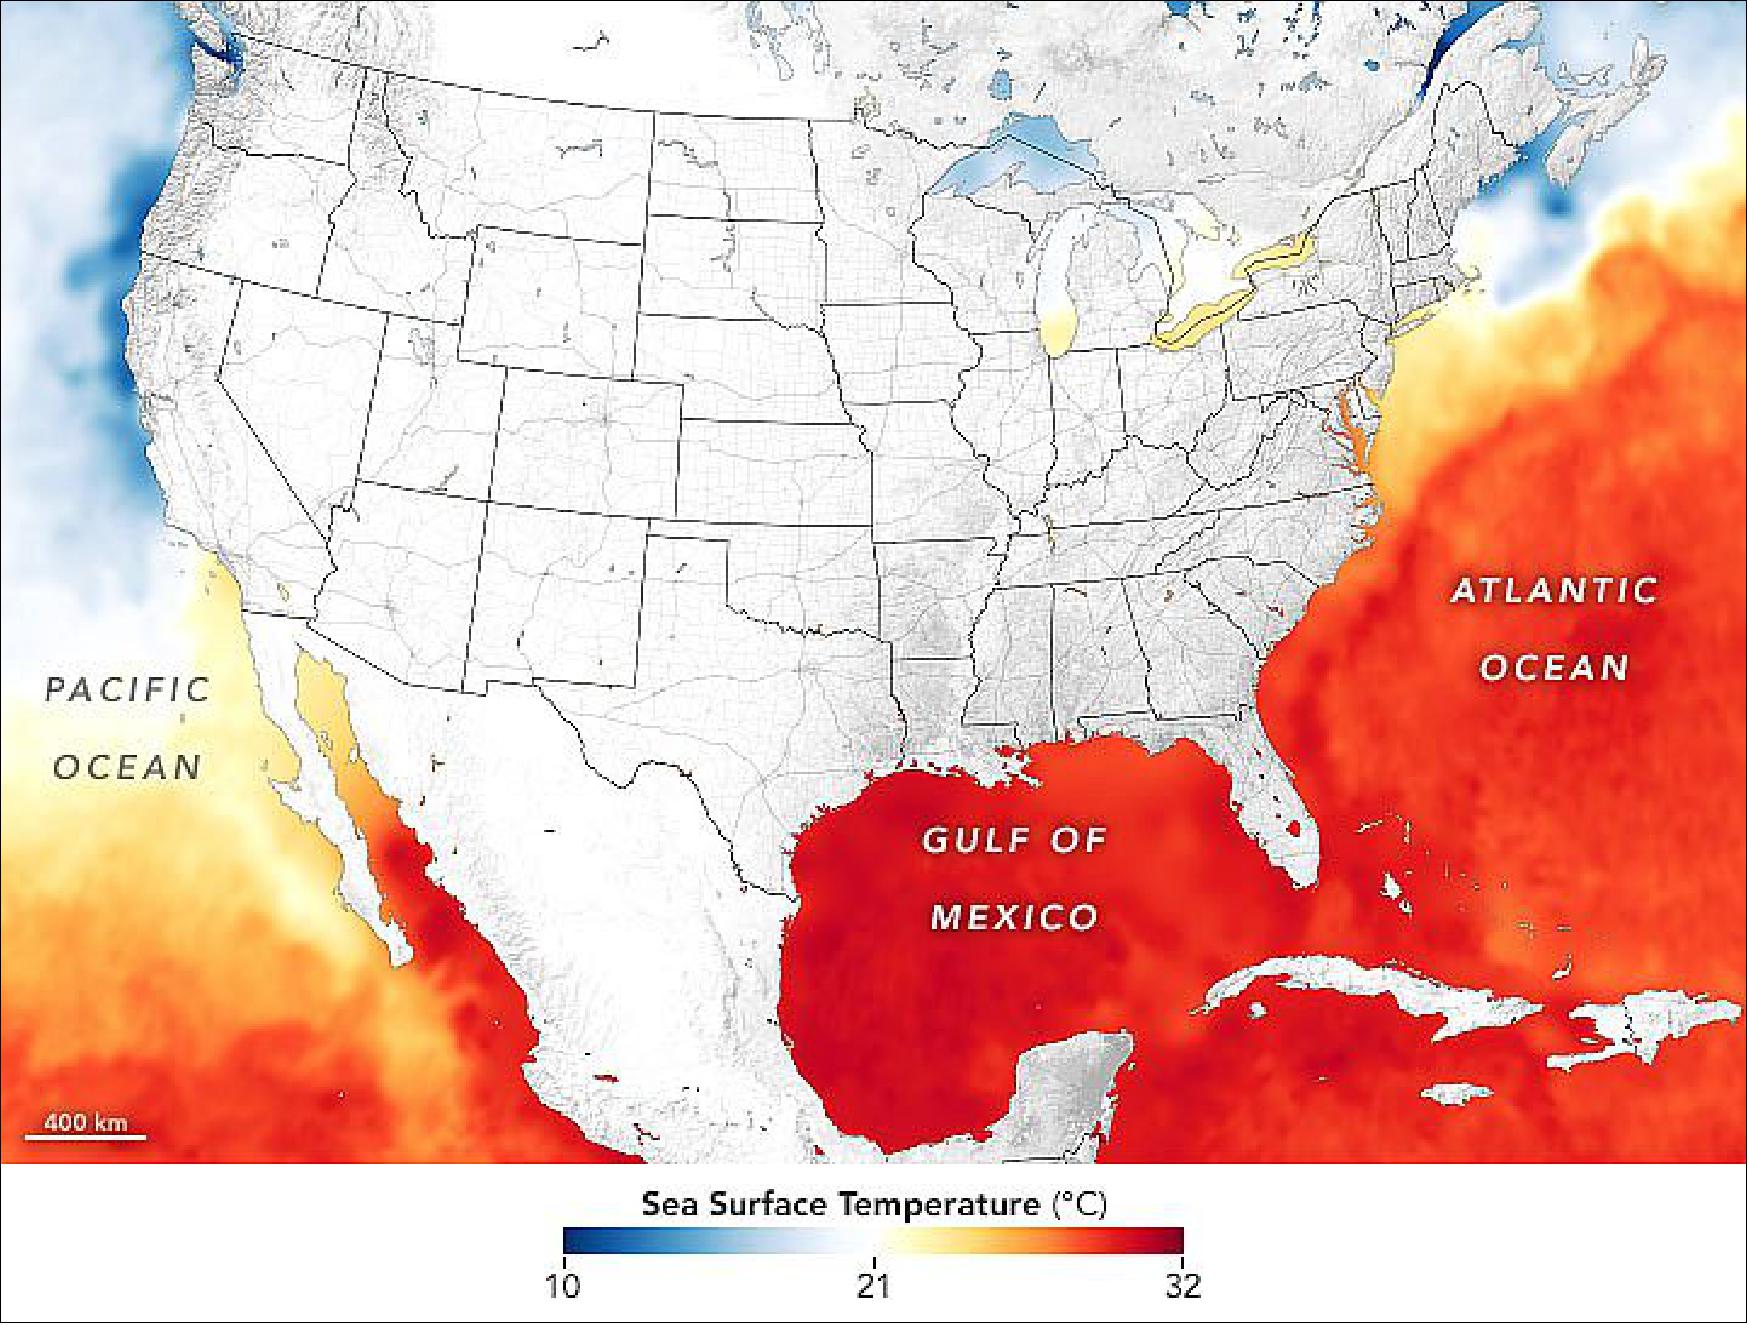
- The data for the map of Figure 79 come from the MUR Global Foundation Sea Surface Temperature Analysis, produced at NASA's Jet Propulsion Laboratory. It is based on observations from several satellite instruments, including the NASA Advanced Microwave Scanning Radiometer-EOS (AMSR-E), the Moderate Resolution Imaging Spectroradiometer (MODIS) on the NASA Aqua and Terra platforms, the U.S. Navy microwave WindSat radiometer, and the Advanced Very High Resolution Radiometer (AVHRR) on several NOAA satellites.
- While warm water can contribute to rapid storm intensification, it is just one of several factors that influence it, explained NASA atmospheric scientist Gary Partyka. "Other things, like efficient outflow in the upper levels of a storm; whether the wind shear is low enough and the atmosphere is stable; and whether dry air is getting into the storm can be quite important as well," he said. "The science is still quite a way from understanding why some tropical cyclones undergo rapid intensification and others do not."
- One worrisome aspect of this storm is how many oil refining and petrochemical facilities lie in its path. In anticipation of possible problems, NASA's Applied Sciences Disasters team has been assembling datasets and imagery (based on optical and synthetic aperture radar sensors) from the days leading up to the storm. "We'll use these to flag anomalous water extent and start assessing damage later in the week, when satellites again pass over after areas that the storm has hit," explained NASA researcher Lori Schultz.
• July 17, 2020: Poyang Lake—China's largest freshwater lake—routinely fluctuates in size between the winter and summer seasons. Between 2019 and 2020, however, water levels went from barely there to the highest on record. 49)
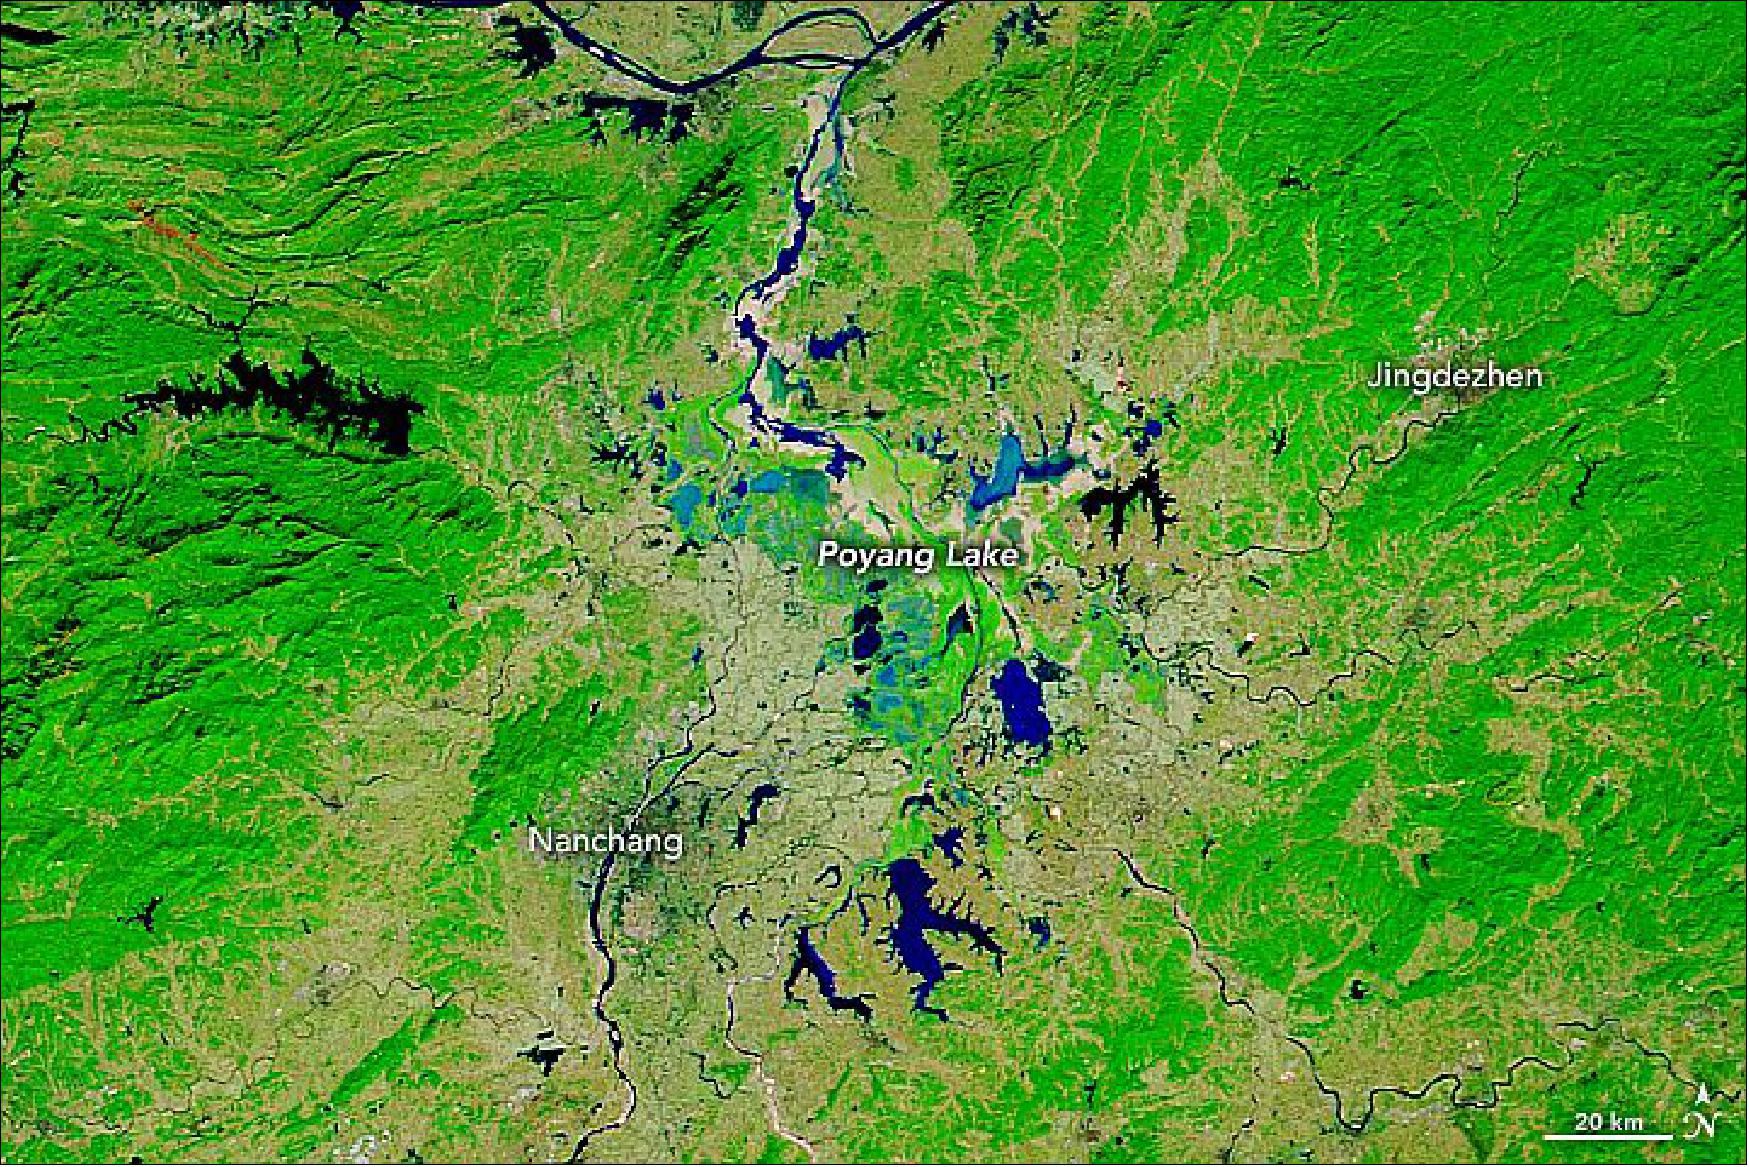
- Winter is a dry time of year in eastern China, and the lake typically shrinks considerably. Pools of water mixed with patches of grass form important wetland habitat for migrating birds. But the yearly low water levels have been trending even lower, and in December 2019 they were the lowest in 60 years.
- Human influences on the lake's inflow and outflow of water—landscape change, dams, and sand mining—have contributed to the lake's decline in recent years. Water levels in winter 2019-2020 were made even worse by a drought, with little rainfall since July 2019.
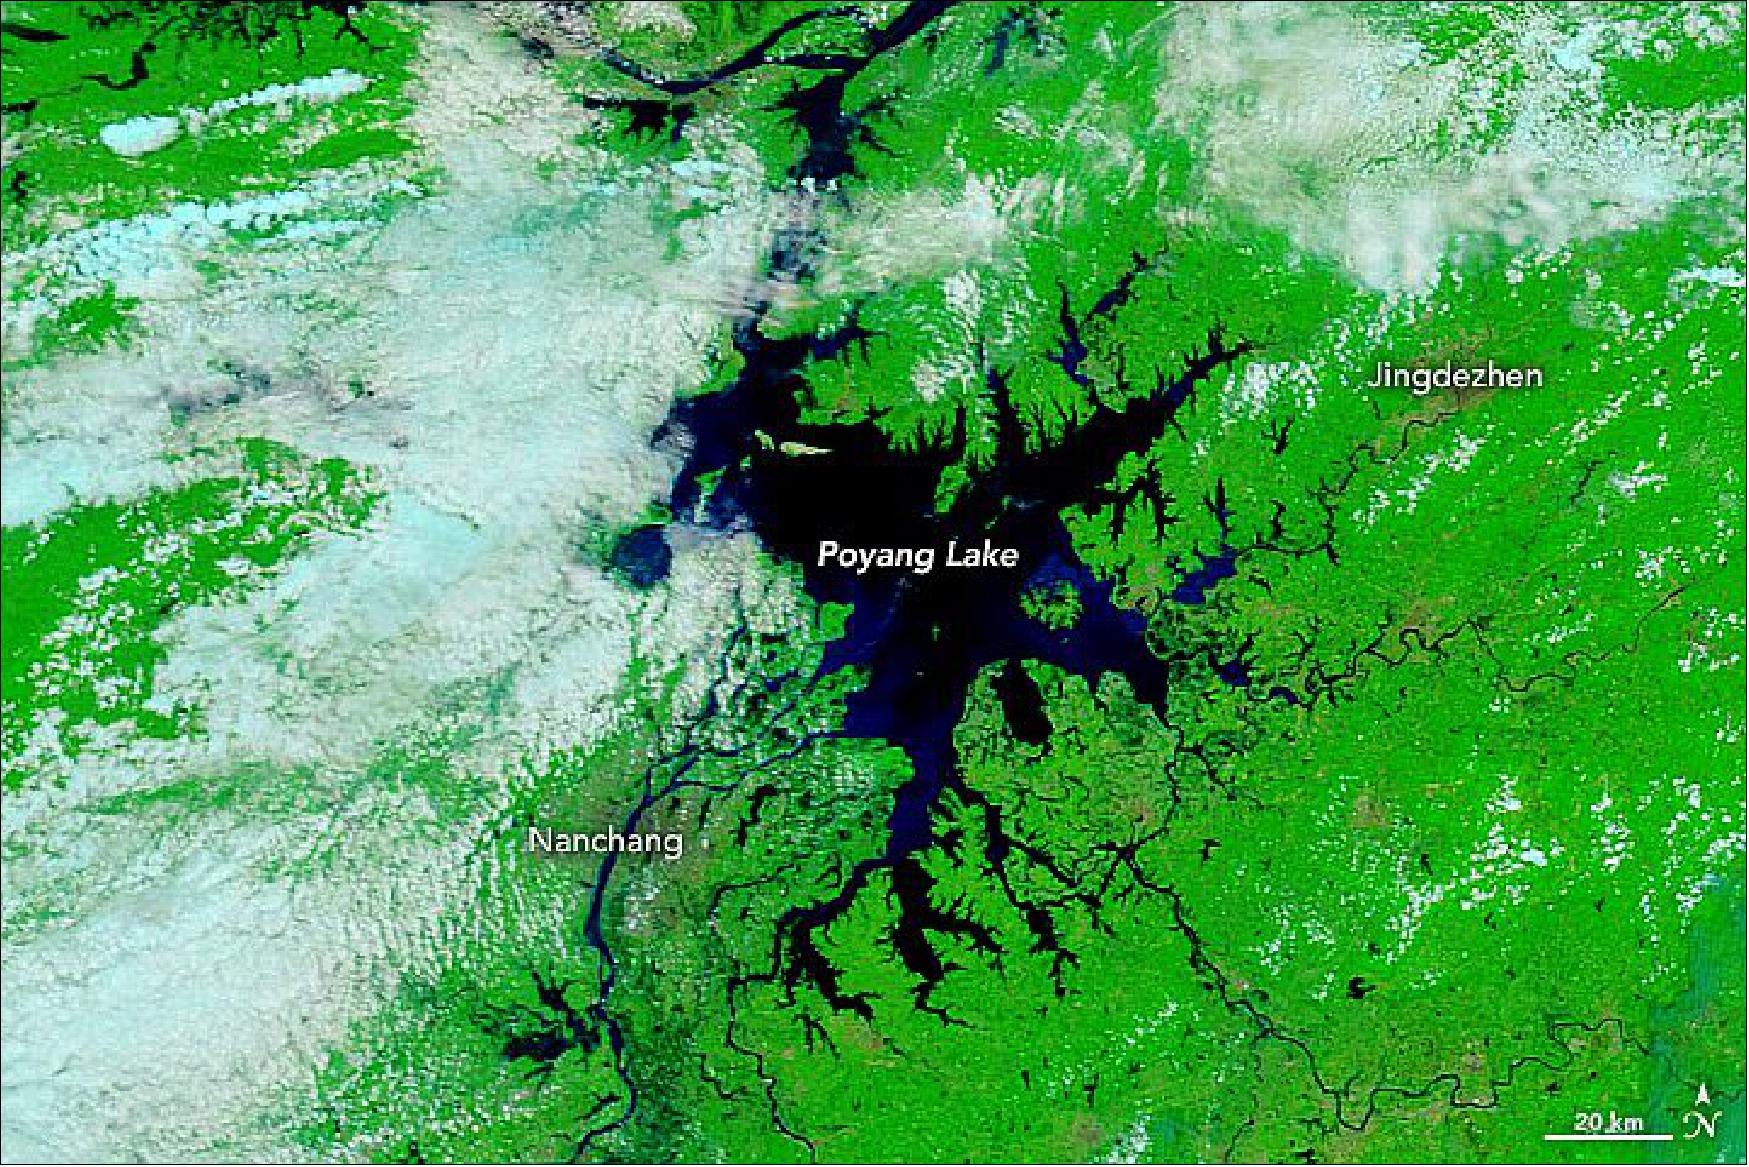
- In June and July 2020, the pendulum swung to the other extreme. Since early June, unusually strong, stationary weather systems have produced frequent storms and heavy rainfall across the Yangtze River Basin. The early and intense start to the rainy season caused water levels to rise so that by July 13, Poyang Lake reached 22.6 meters—its highest level on record, and surpassing the previous record of 22.52 meters reached in 1998.
- Flooding has been widespread and deadly in recent weeks. Beyond Poyang Lake, dozens of rivers across central and eastern China have reached record highs. But the worst of it has been in Jiangxi Province and around Poyang. Authorities declared a "red alert" for flooding at Poyang Lake and nearby populated areas, including Nanchang, the provincial capital and its largest city.
• July 11, 2020: Appearing like swirls of soft-serve ice cream, the twists and twirls of these clouds off the western coast of Africa are a demonstration of the artistic nature of our planet and fluid dynamics. 50)
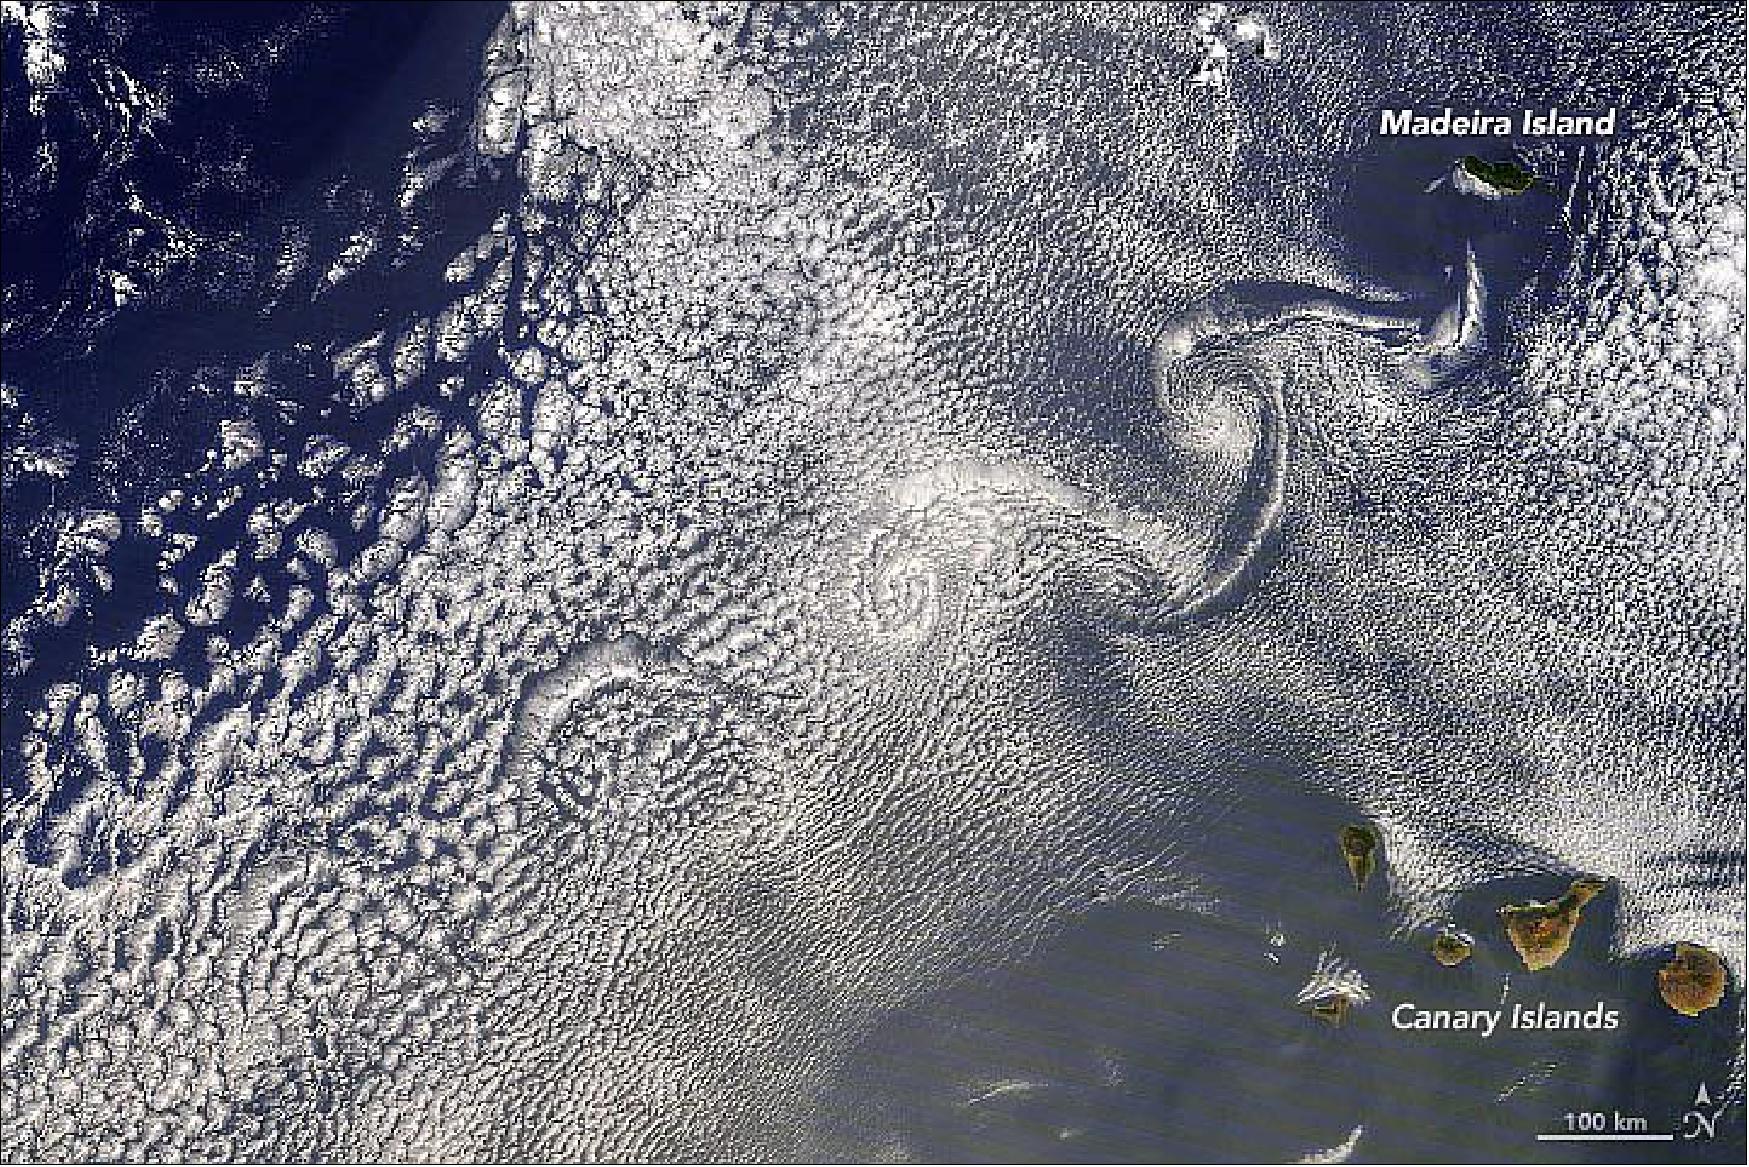
- Such vortices can form nearly anywhere that fluid flow—including an air mass, as shown here—is disturbed by a solid object. In this case, winds blowing across the ocean are disturbed by small, volcanic islands poking above the surface of the North Atlantic. The air mass, and clouds moving with it, blows around instead of over the islands.
- Physicist Theodore von Kármán, a co-founder of NASA's Jet Propulsion Laboratory, was the first to describe the physical processes that create these chains of spiral eddies. As winds are rerouted around the landmasses, the flow slows down and creates a vertical wall of whirling air—with faster wind flowing past slower wind below. These sheets can wrap themselves into vortices and shed alternately off the two sides of the island. The clouds within the air stream, acting like "dusting fingerprints," help show the details of the interrupted air flow. The pattern of the spirals depends on the intensity of the wind.
• July 5, 2020: From above, the linear features in the Kulunda steppe of southwestern Russia looks as if a large claw has scraped the land surface. In reality, the features are a byproduct of tectonic forces that folded rock layers in ways that created shallow, boggy valleys that are now filled with pine forests and lakes. 51)
- The expansive grasslands surrounding the valleys has a long history of being one of Russia's most important breadbaskets. Intensive production and overuse during the Soviet era led to significant erosion of the soil in many places, but farmers in the area still manage to grow a range of crops, including wheat, sunflowers, buckwheat, soybeans, flax, peas, and sugar beets.
- MODIS on NASA's Terra and Aqua satellites acquired this pair of images on April 1 and June 11, 2020. The forested valleys appear dark green in comparison to the lighter green and brown farmland that surrounds them. The loss of snow and ice cover is the most obvious seasonal change in the image pair, but notice also how the color of Lake Kuchukskoye shifts from green to pink.
- Many of the salt lakes in Russia's Alta Krai district undergo a seasonal color change as populations of aquatic organisms such as salt-loving Halobacteria and brine shrimp increase in the summer. Many of the lakes achieve their most intense flamingo-shades of pink in July and August, when the water becomes especially salty due to hot, dry weather, which increases the rate of evaporation and lowers lake water levels.
- In recent years, Kuchukskoye's water has usually turned pink by the last week of June or the first few weeks of July. This year, the color change happened earlier than usual—in the third week of May—likely because Siberia experienced an unusually intense and prolonged heat wave.
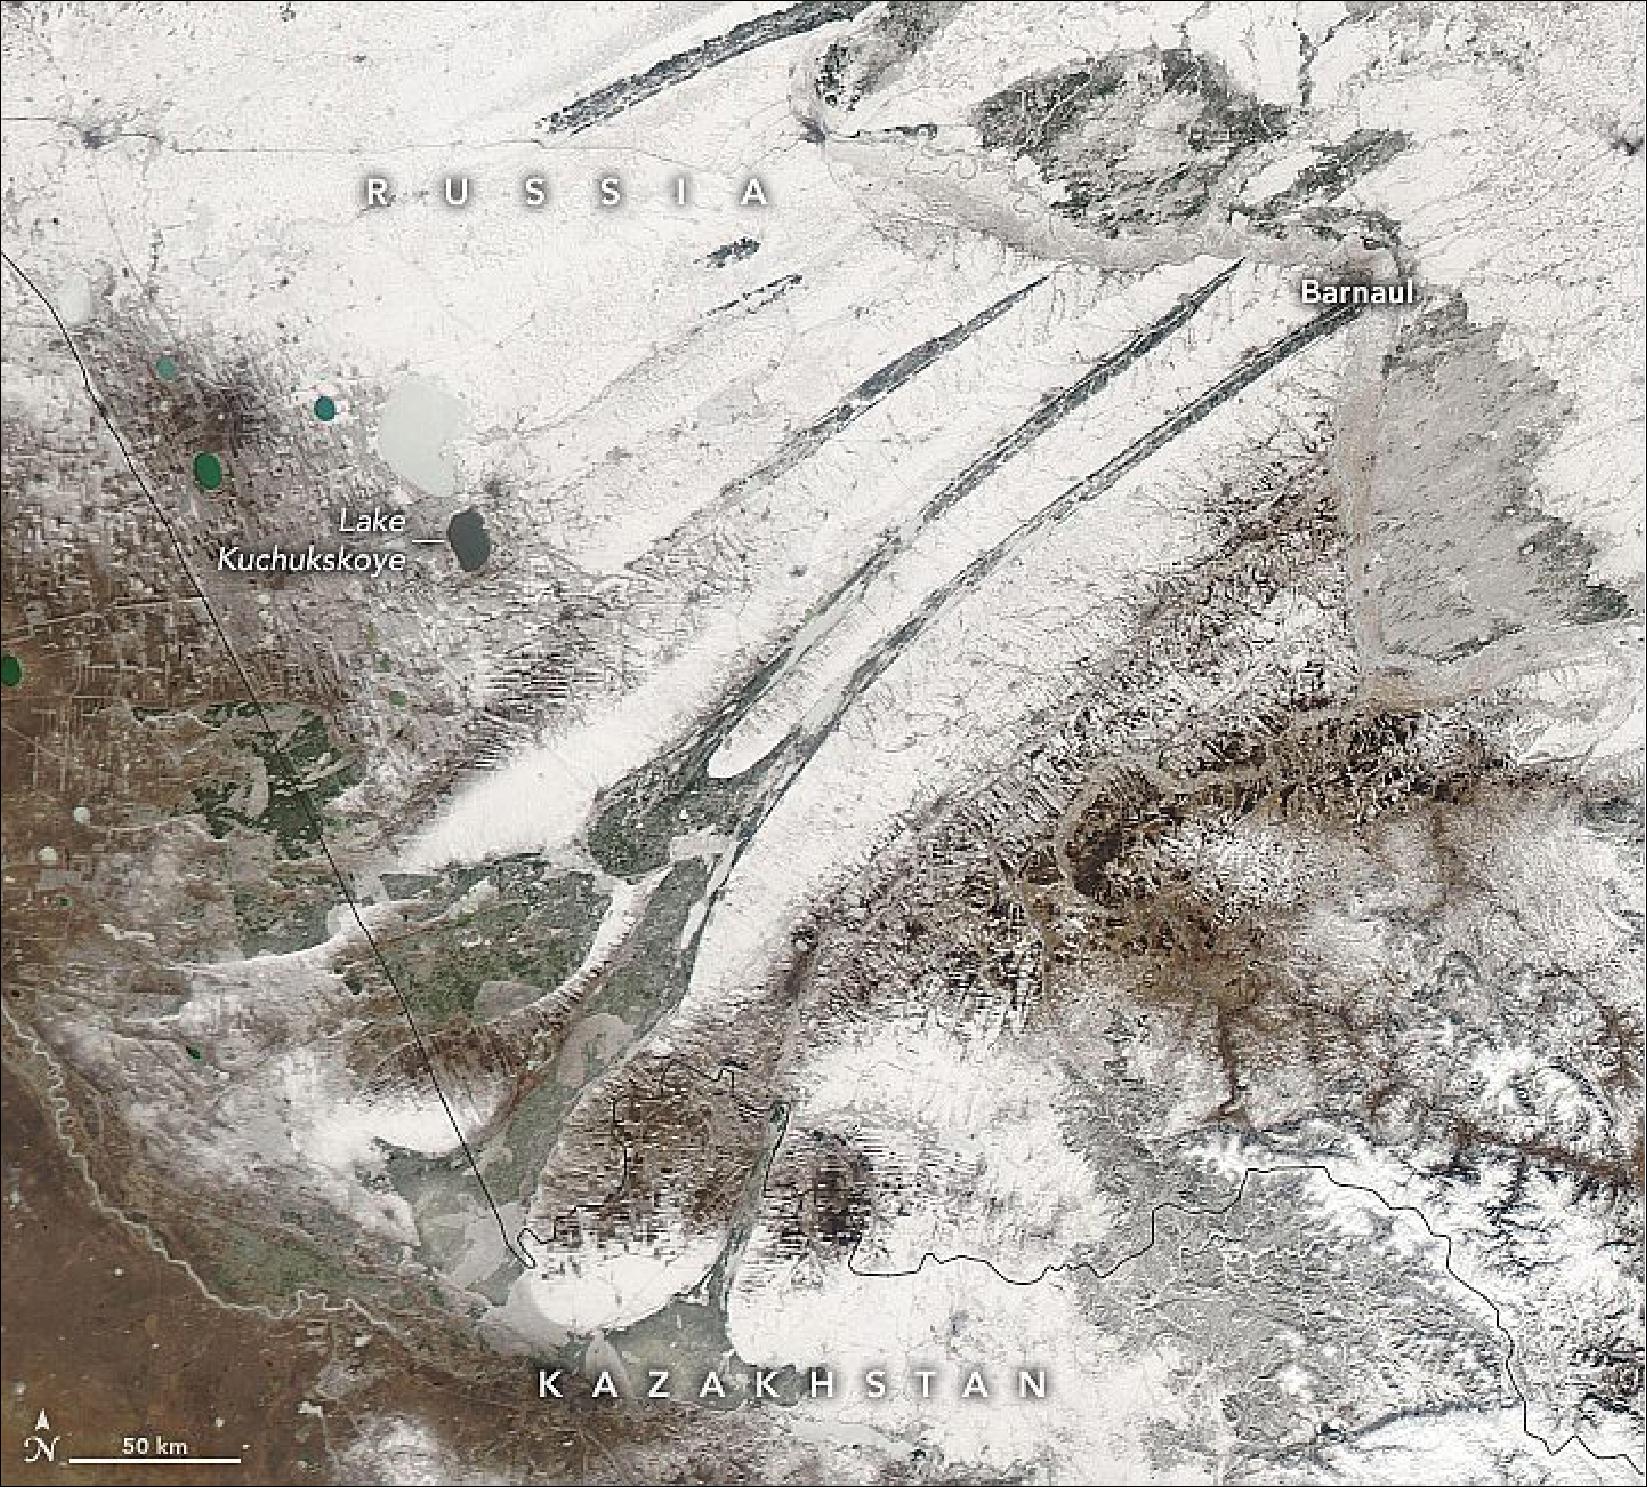
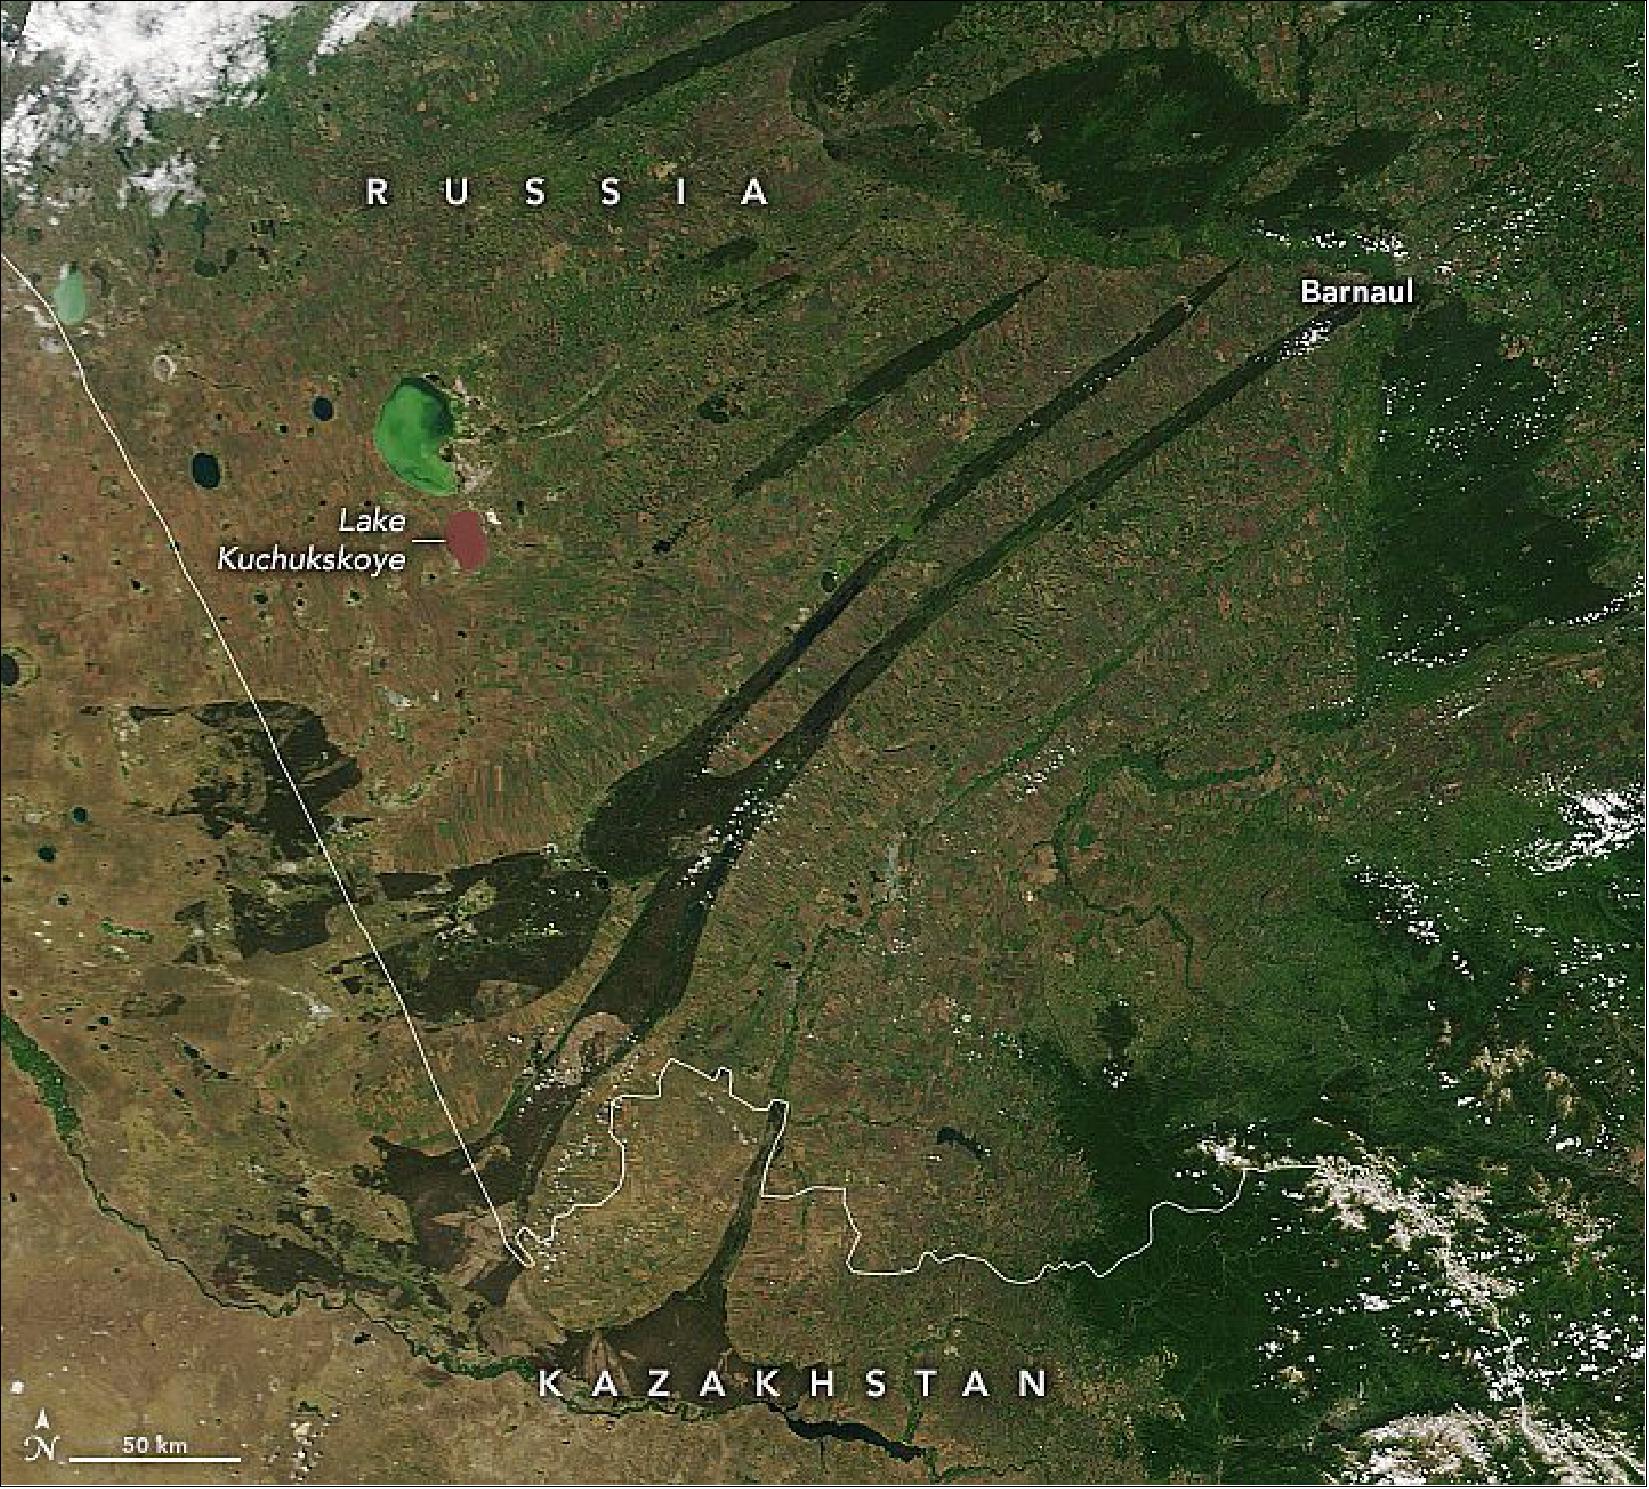
• June 23, 2020: In 2008, atmospheric scientist Santiago Gassó authored a study that highlighted abnormally bright trails of clouds around remote peaks in the South Sandwich Islands. The unusual looking clouds were caused by volcanoes emitting sulfur dioxide and other gases and particles that interacted with passing clouds and made them brighter and more lasting than the surrounding clouds. 52)
- More than a decade later, the NASA and University of Maryland scientist is still tracking and learning from these "volcano track" clouds over the South Atlantic Ocean. In 2020, he watched several of them during a period of sustained period of activity on Mount Michael. For two weeks in mid-May, NASA satellites observed volcano tracks nearly every day.
- On some days, wide tracks extended for hundreds of kilometers from the volcano. But on most days, the tracks were thin and faint, indicating that the volcanic activity was not especially intense. Degassing of sulfur dioxide and other gases is routine on Mount Michael, which has a persistent lava lake roiling deep inside its central crater. On May 30, 2020, the Moderate Resolution Imaging Spectroradiometer (MODIS) on NASA's Terra satellite captured this false-color image of a volcano track near Mount Michael. Waves clouds and Von Kármán vortices are visible downwind of neighboring islands.
- Cloud brightening—the technical term is the Twomey effect—is something scientists have observed for decades. Clouds with extra particles from volcanoes have more and smaller cloud droplets than normal clouds. This means there are more surfaces to reflect light, making volcanically "polluted" clouds appear brighter than others. The same process produces bright ship track clouds over the ocean, except in that case the extra particles come from ship exhaust.
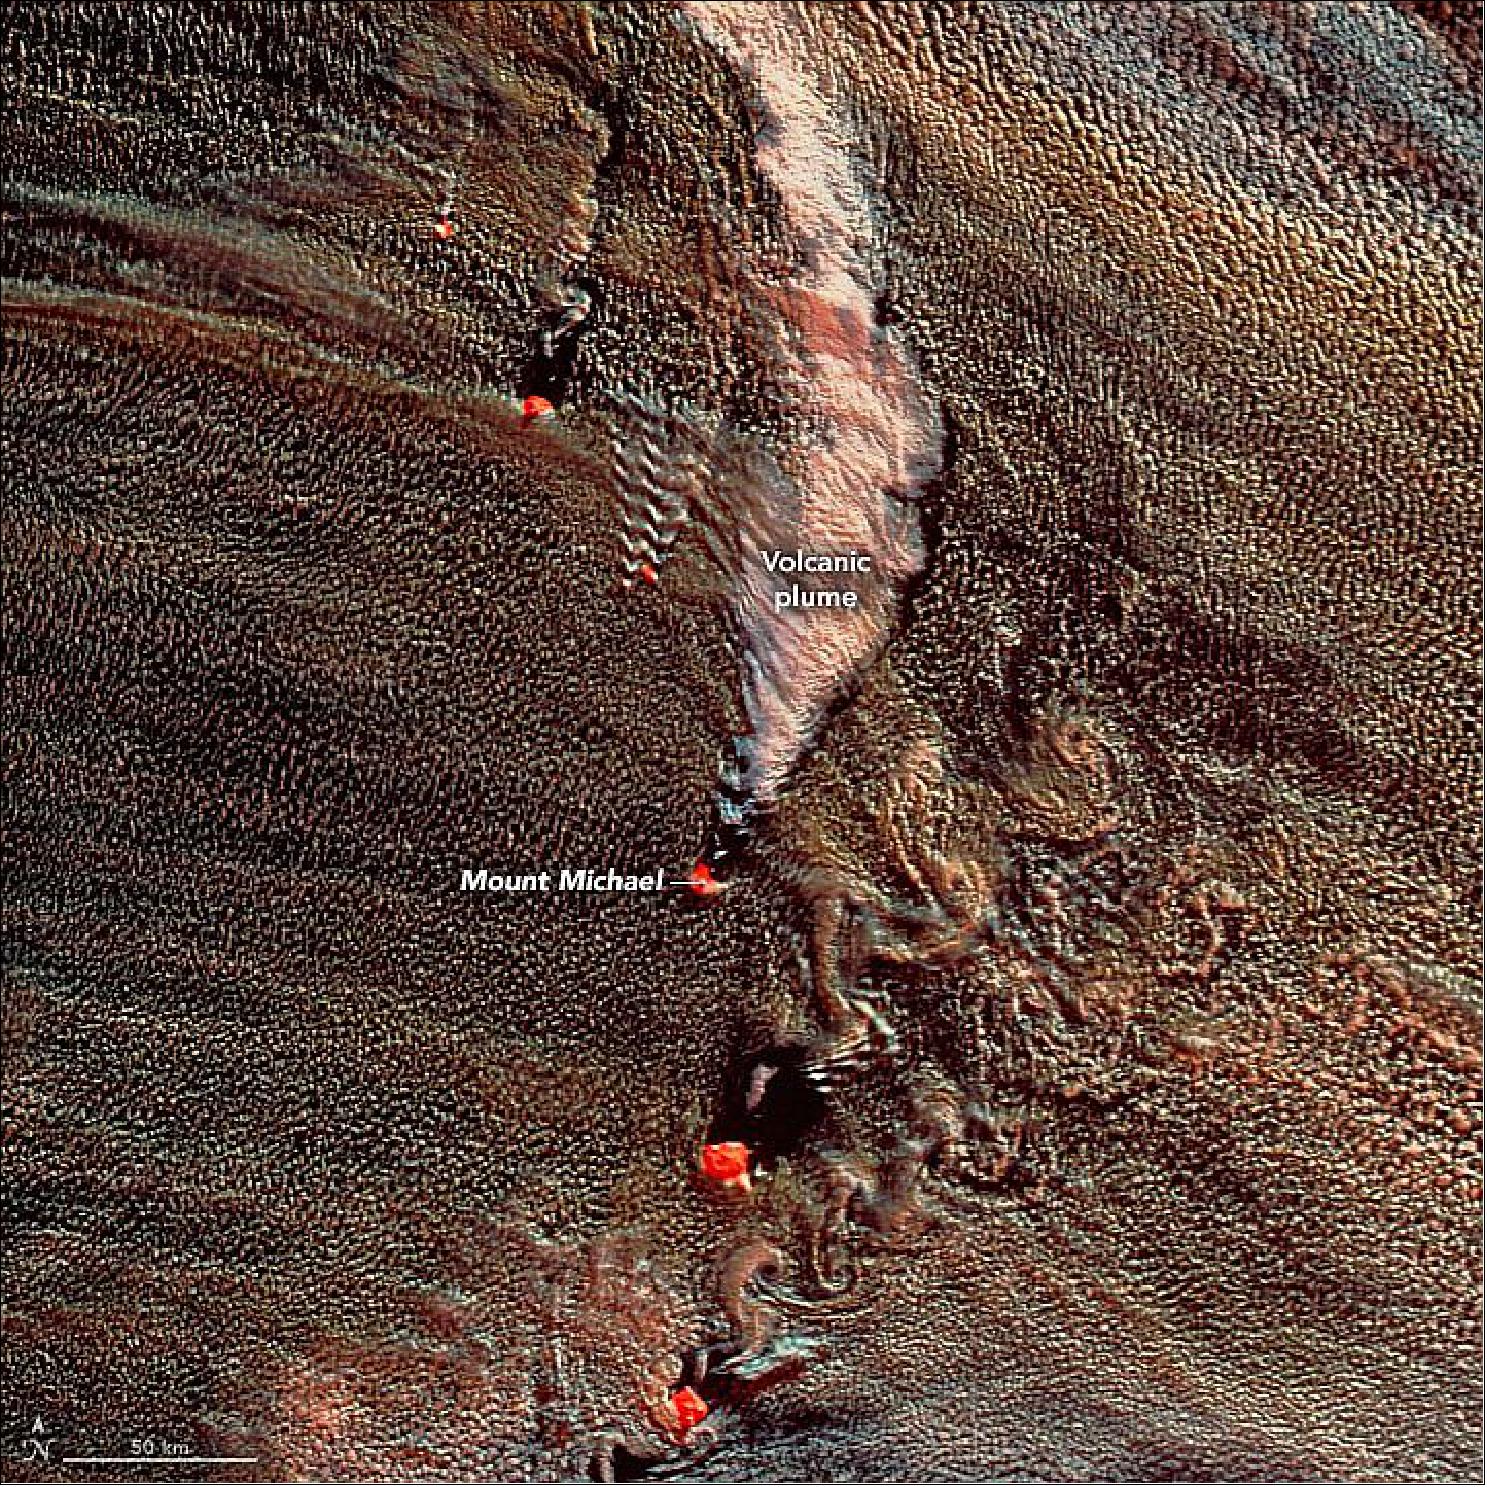
- While faint volcano tracks can be difficult to see in natural-color imagery, near-infrared light can help. "When I look for volcano tracks with MODIS, I use the 3-6-7 band combination because it includes near-infrared channels that are particularly sensitive to changes in droplet size, a direct result of the volcanic particles entering the cloud," explained Gassó. "That way the volcano track jumps out without me having to squint much."
- The many active volcanoes, abundant cloud cover, routinely fierce winds of the "Roaring Forties"—plus the laws of fluid dynamics—often make for unusually beautiful swirls, patterns, and waves in the air above the South Sandwich islands.
- The island chain has also proven to be an ideal natural laboratory for science. "There is a lot of interest in how human-caused pollution affects clouds on a global scale and how it is affecting the climate. But in other areas of the world, it can be difficult to tell if cloud brightening is caused by shifts in meteorology or the presence of pollution particles," said Gassó. "With the volcano tracks from the South Sandwich Islands, there is no question at all. The brightening is from volcanic ‘pollution,' and that is really useful for developing models that can quantify how this cloud brightening effect works on a global scale."
• June 12, 2020: Emiliania huxleyi is about one-tenth the size of a human hair. But in high enough concentrations —a "bloom"—this single-celled phytoplankton becomes visible from space. In May 2020, a vivid bloom of E. huxleyi colored the surface waters of a fjord in southern Norway. 53)
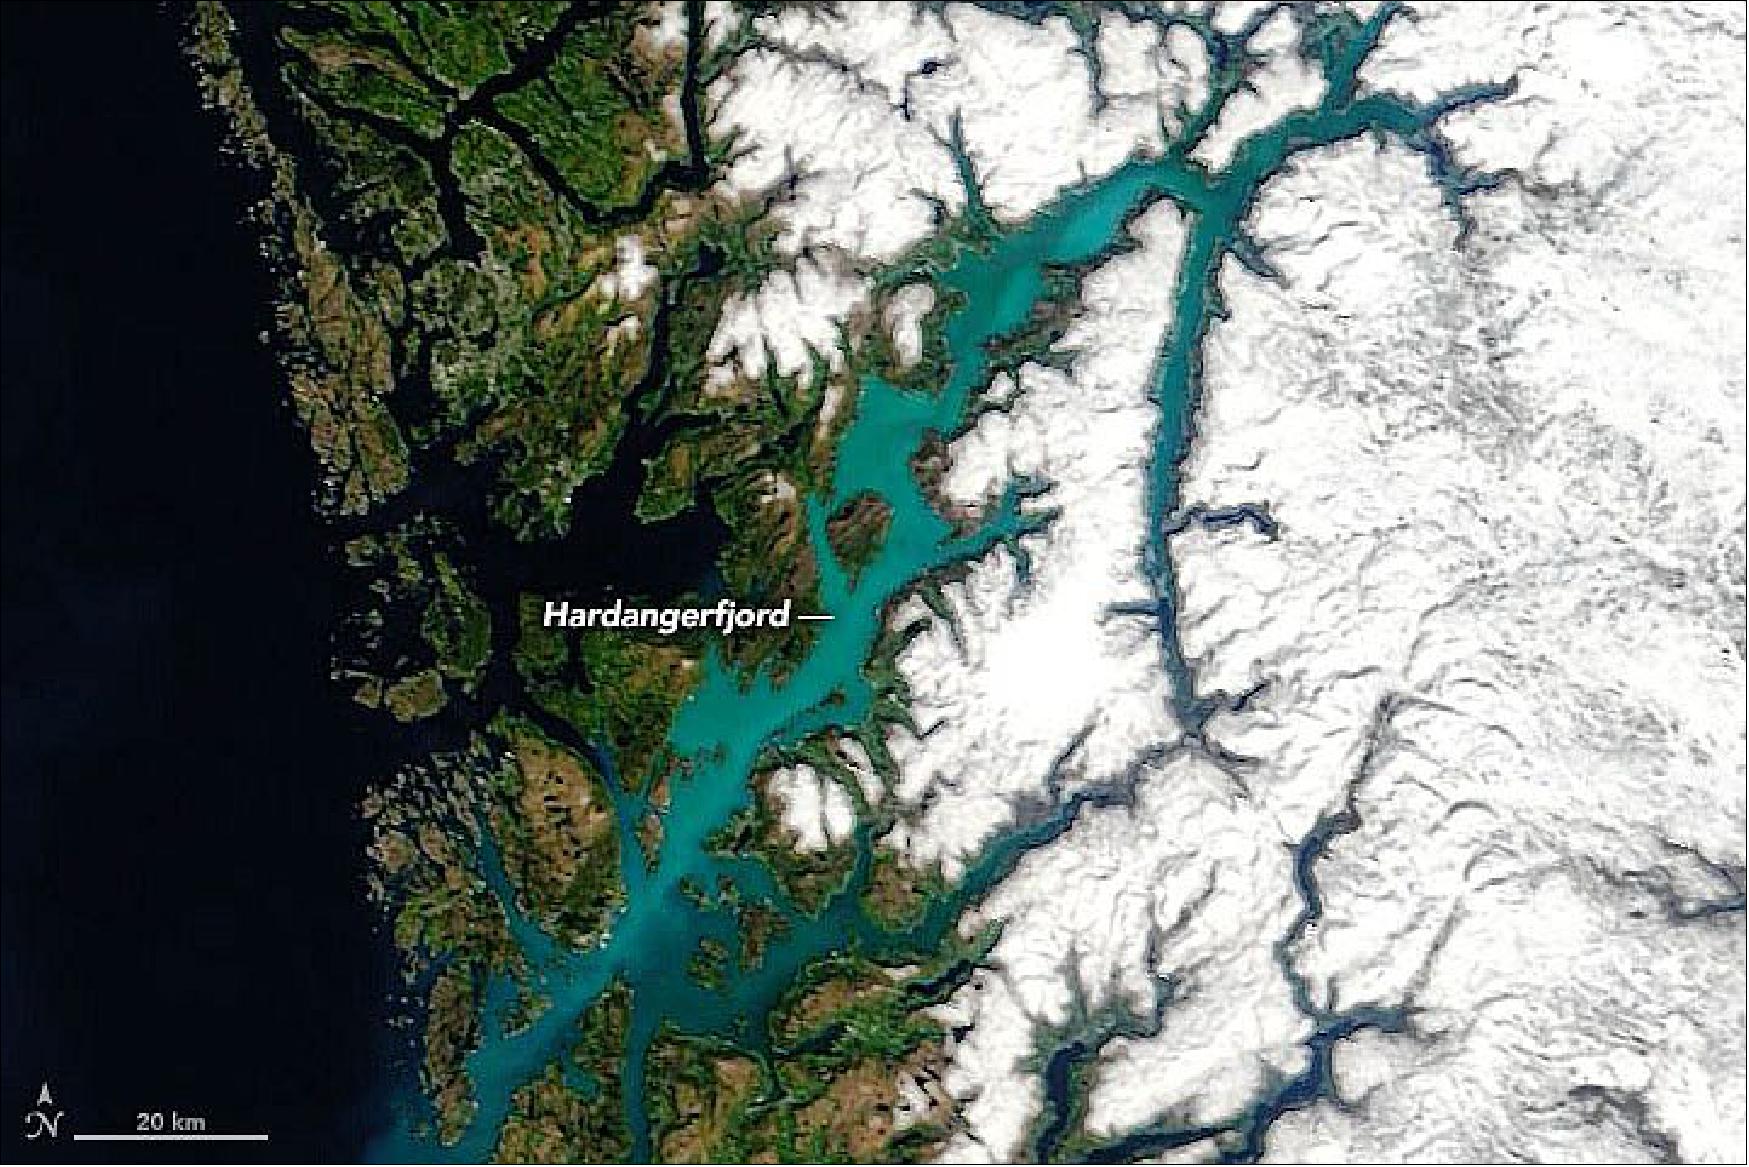
- E. huxleyi is the most abundant species of coccolithophore, a type of phytoplankton that builds itself a shell of calcium carbonate disks, or "coccoliths." The shells are so reflective that they can make otherwise dark blue water appear milky blue-green.

- Spring and early summer are common times to see phytoplankton blooms in the North and Norwegian seas. In May and June 2019, a stunning bloom, likely composed primarily of E. huxleyi, showed up along the Norwegian coast and filled Sognefjord—the country's longest and deepest fjord.
- Coccolithophores tend to be good competitors for nutrients, so they can grow well even under low-nutrient conditions that limit other phytoplankton. But other phytoplankton turn up in this region as well, and not all are as harmless as E. huxleyi. In 2019, a bloom of Chrysochromulina leadbeateri in the waters off northern Norway suffocated millions of farmed salmon.
• June 8, 2020: Each spring, the Canadian Arctic is the site of a fierce battle between water and ice. The flow of the Mackenzie River, swollen with meltwater, helps break up river ice and pushes north toward the Arctic Ocean. In some places, intact ice resists the pulses of water and spurs flooding. But spring warmth always prevails, and by summer the river flows freely into the Beaufort Sea. 54)
- The rush of fresh melt water, called a "freshet," is important for the hydrology of the Mackenzie River Delta because it recharges groundwater and sustains lakes. The river also carries sediments and nutrients—much of it eroded from rocks far upstream in the Rocky Mountains—to the delta plain and coastal ocean. In the images above, some sediment had already made it past the ice into the Beaufort Sea. You can see it just peeking out from the land-fast ice in the May 23 image. It is much more distinct in the May 30 image, coloring the water with a muddy brown plume.
- The land-fast ice visible was still acting like a barrier as late as May 30. But when it eventually gives way, it will release a large pulse of warm water into the Arctic Ocean. Previous research has shown this early summer pulse can raise offshore water temperatures across hundreds of kilometers, helping to melt and disperse nearby sea ice. The effect on sea ice becomes more important as the global climate warms and larger volumes of warm freshwater are discharged.
- More immediately, with the ice barrier still intact and ice jams still clogging rivers, numerous riverside communities have been on alert for flooding. On June 1, the Mackenzie River's East Channel near the town of Inuvik rose to 16.5 meters—the highest water level on record for that location. According to news reports, some people in the town were evacuated from their cabins.
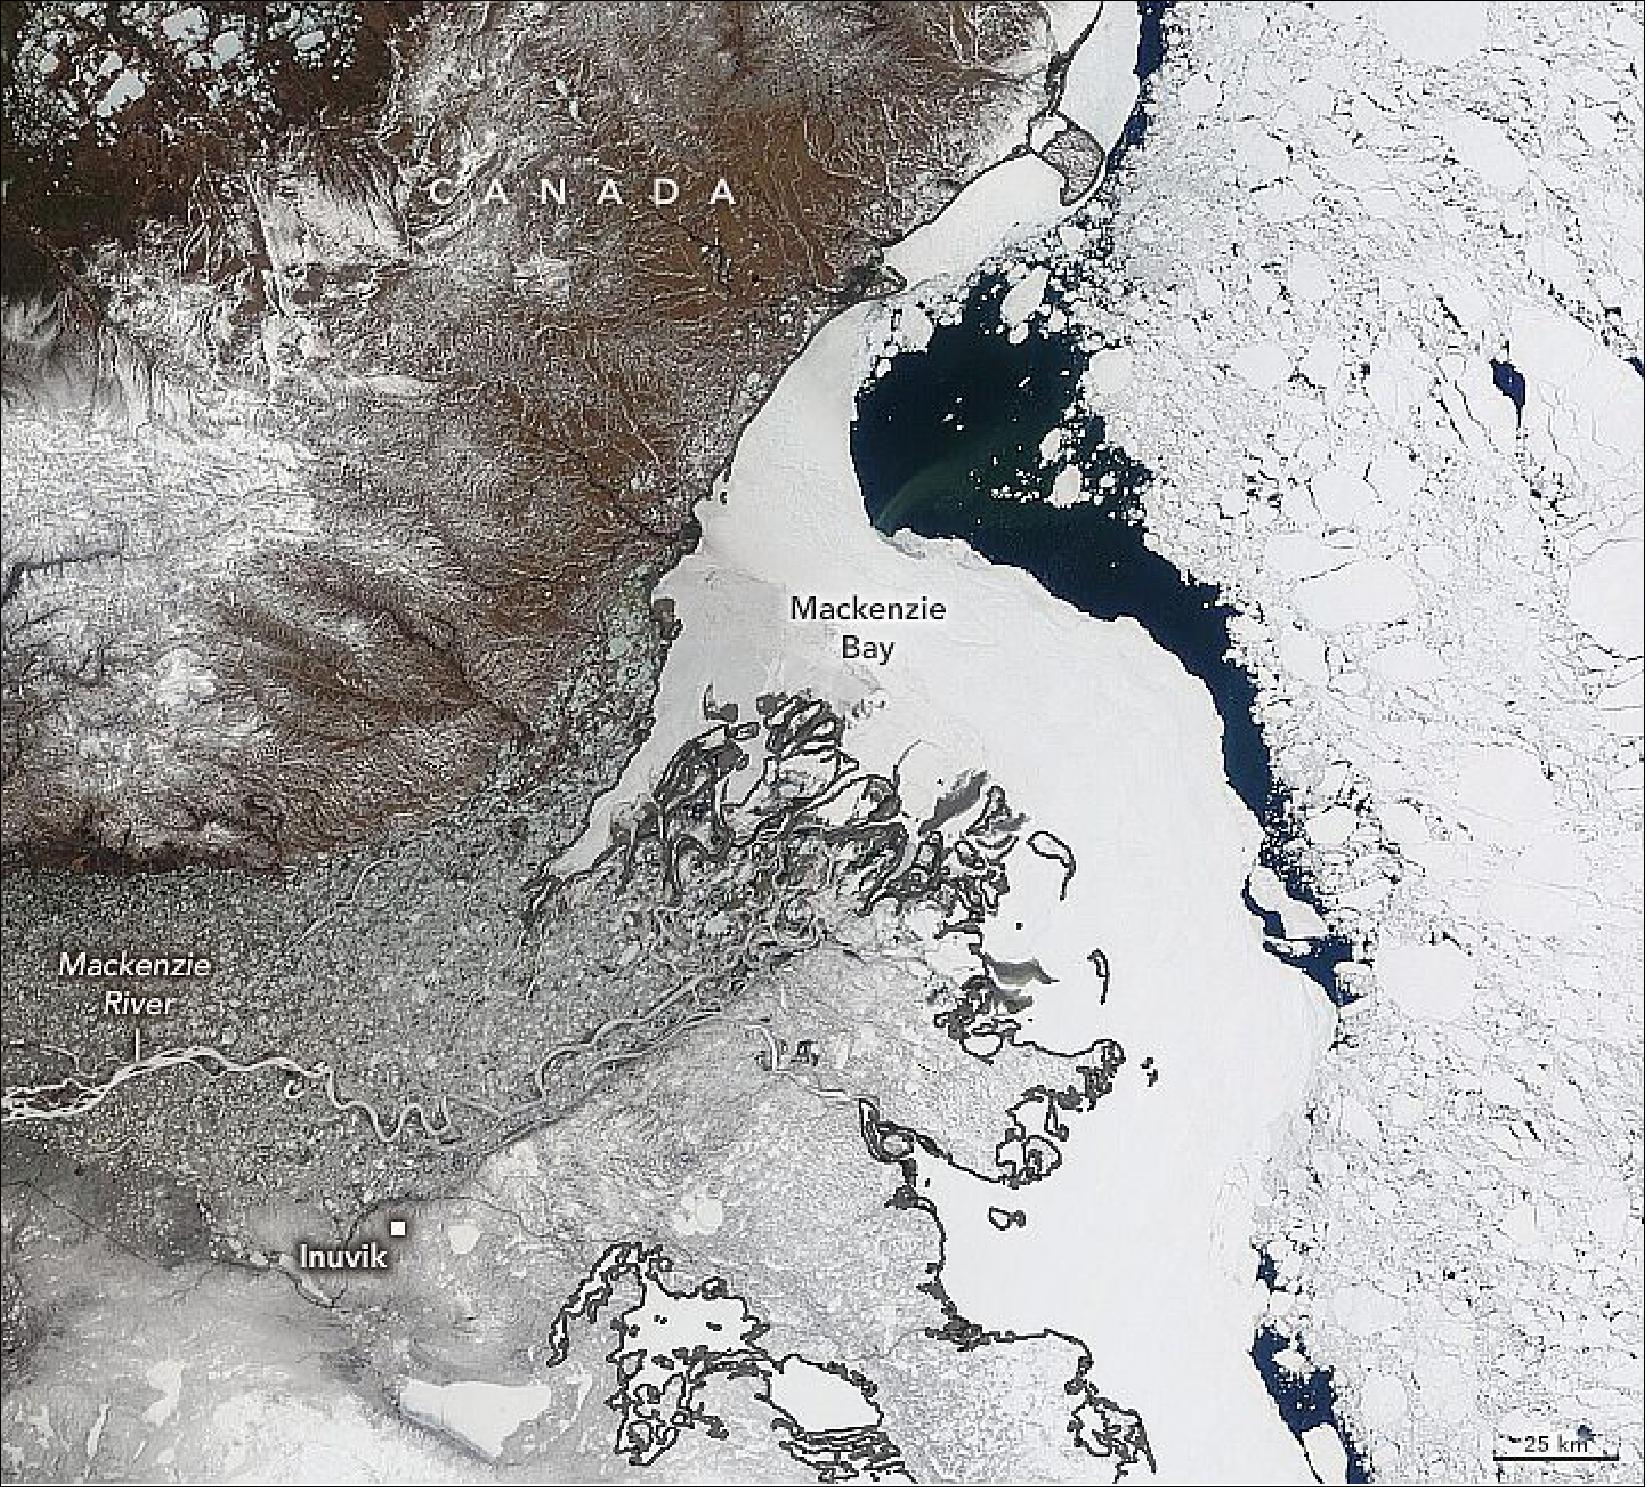
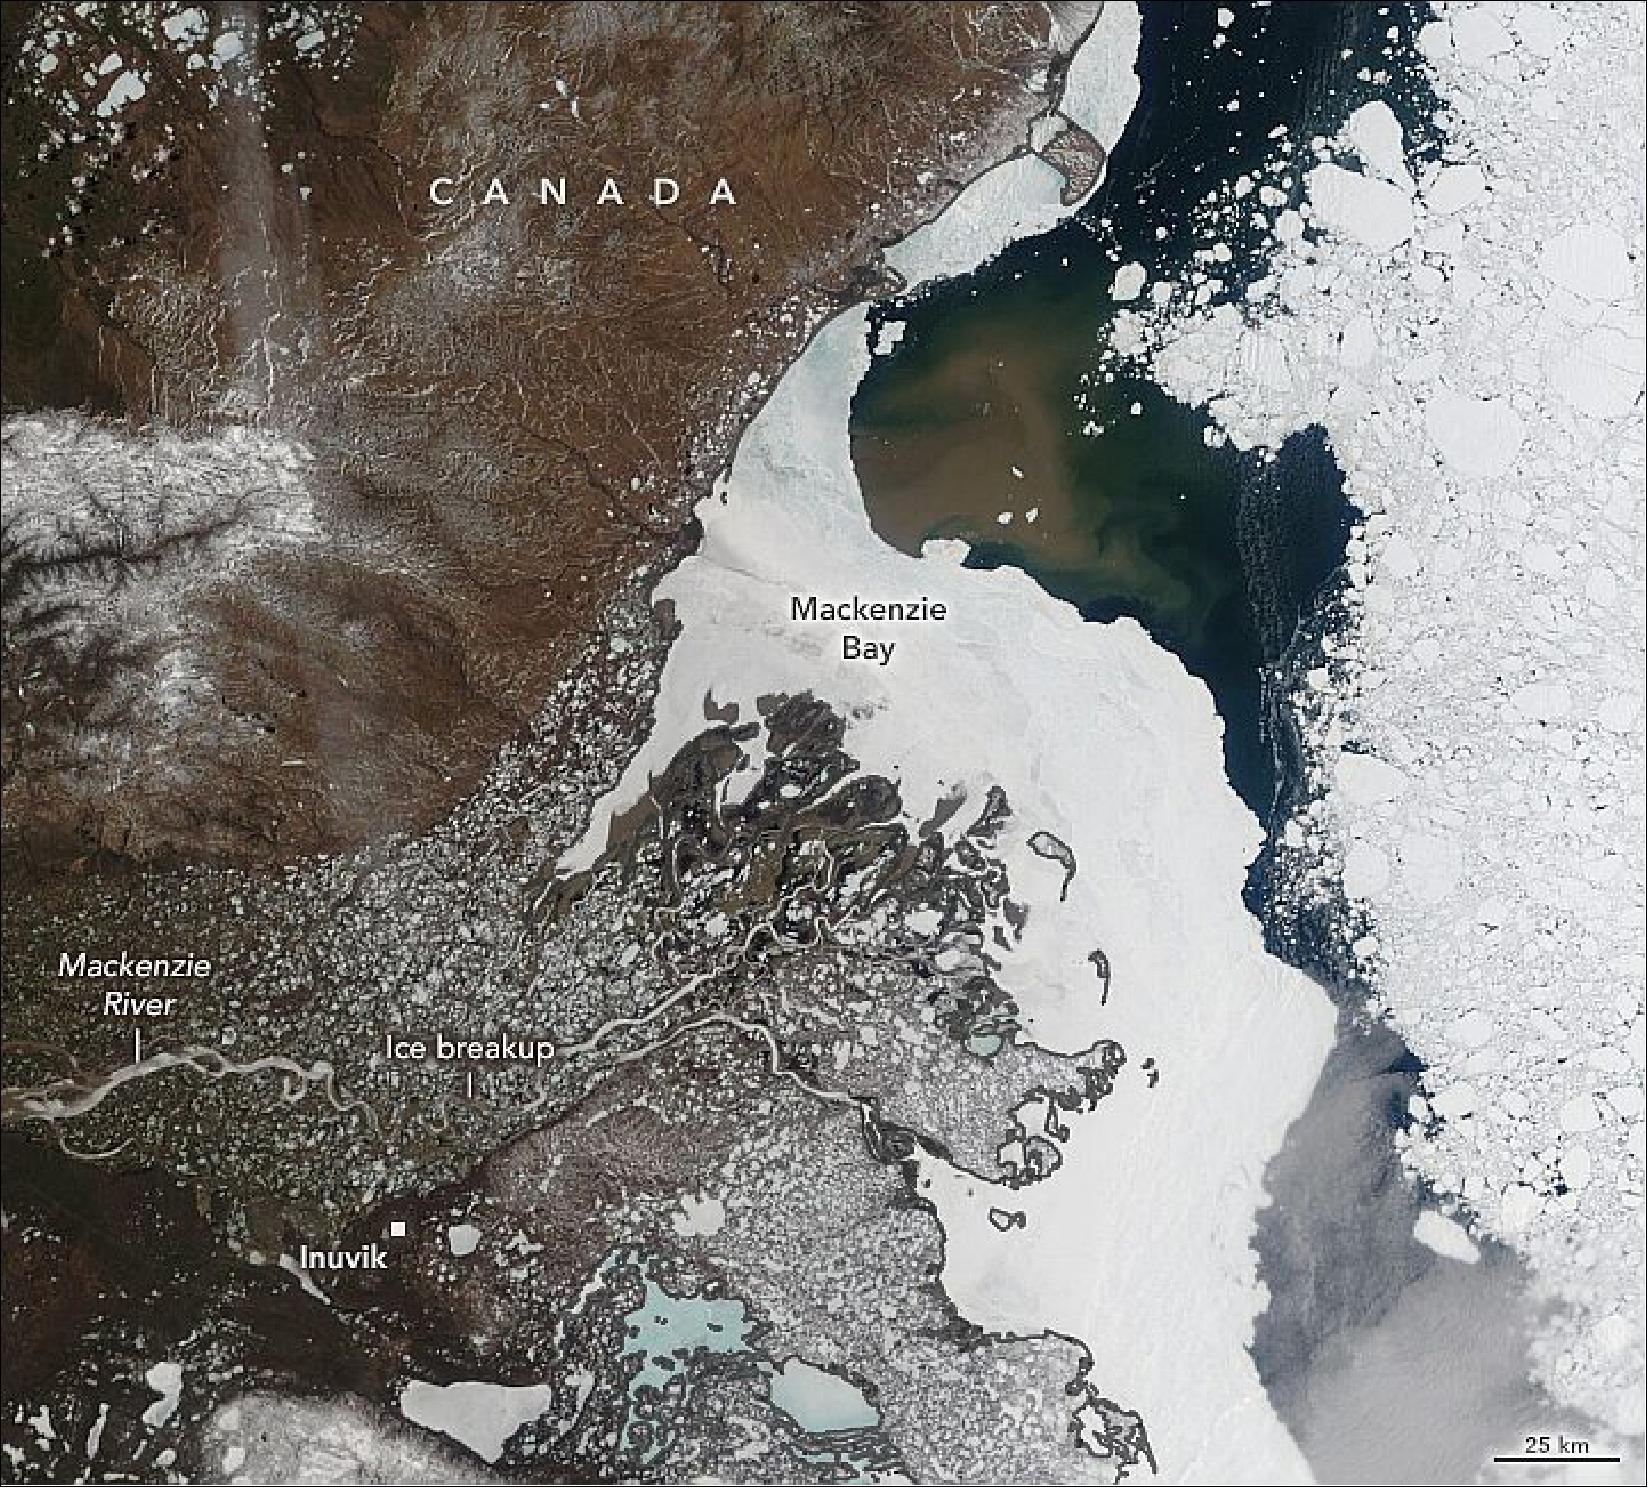
• June 3, 2020: A structure in the Nares Strait known as an "ice arch" was still intact in late May 2020 when the MODIS instrument on NASA's Terra satellite acquired this natural-color image. But check it out while you still can. This natural gatekeeper—which prevents sea ice from exiting the Arctic Ocean and drifting southward into Baffin Bay—typically breaks up each year by June or July. 55)
- The Arctic Ocean is considered a semi-enclosed ocean, as it is surrounded almost entirely by land. The northern coastlines of these land masses—Eurasia, North America, Greenland—and some scattered islands keep most of the sea ice penned up, making it less mobile than sea ice that forms around Antarctica.
- There are a few passageways, however, that allow ice to escape in spring and summer. The main passage is through the Fram Strait between northeast Greenland and Svalbard. Another is through the Nares Strait between northwest Greenland and Ellesmere Island. Nares Strait is relatively narrow, but a southward flowing current ensures plenty of Arctic sea ice is lost there each year.
- How much ice is lost via the Nares Strait depends in part on how soon the ice arch breaks up each year. In 2019 the ice arch collapsed early, crumbling in mid-April and allowing ice to flow freely by May. Early breakups also occurred in 2017, 2010, and 2008. In 2007, the arch failed to form at all.
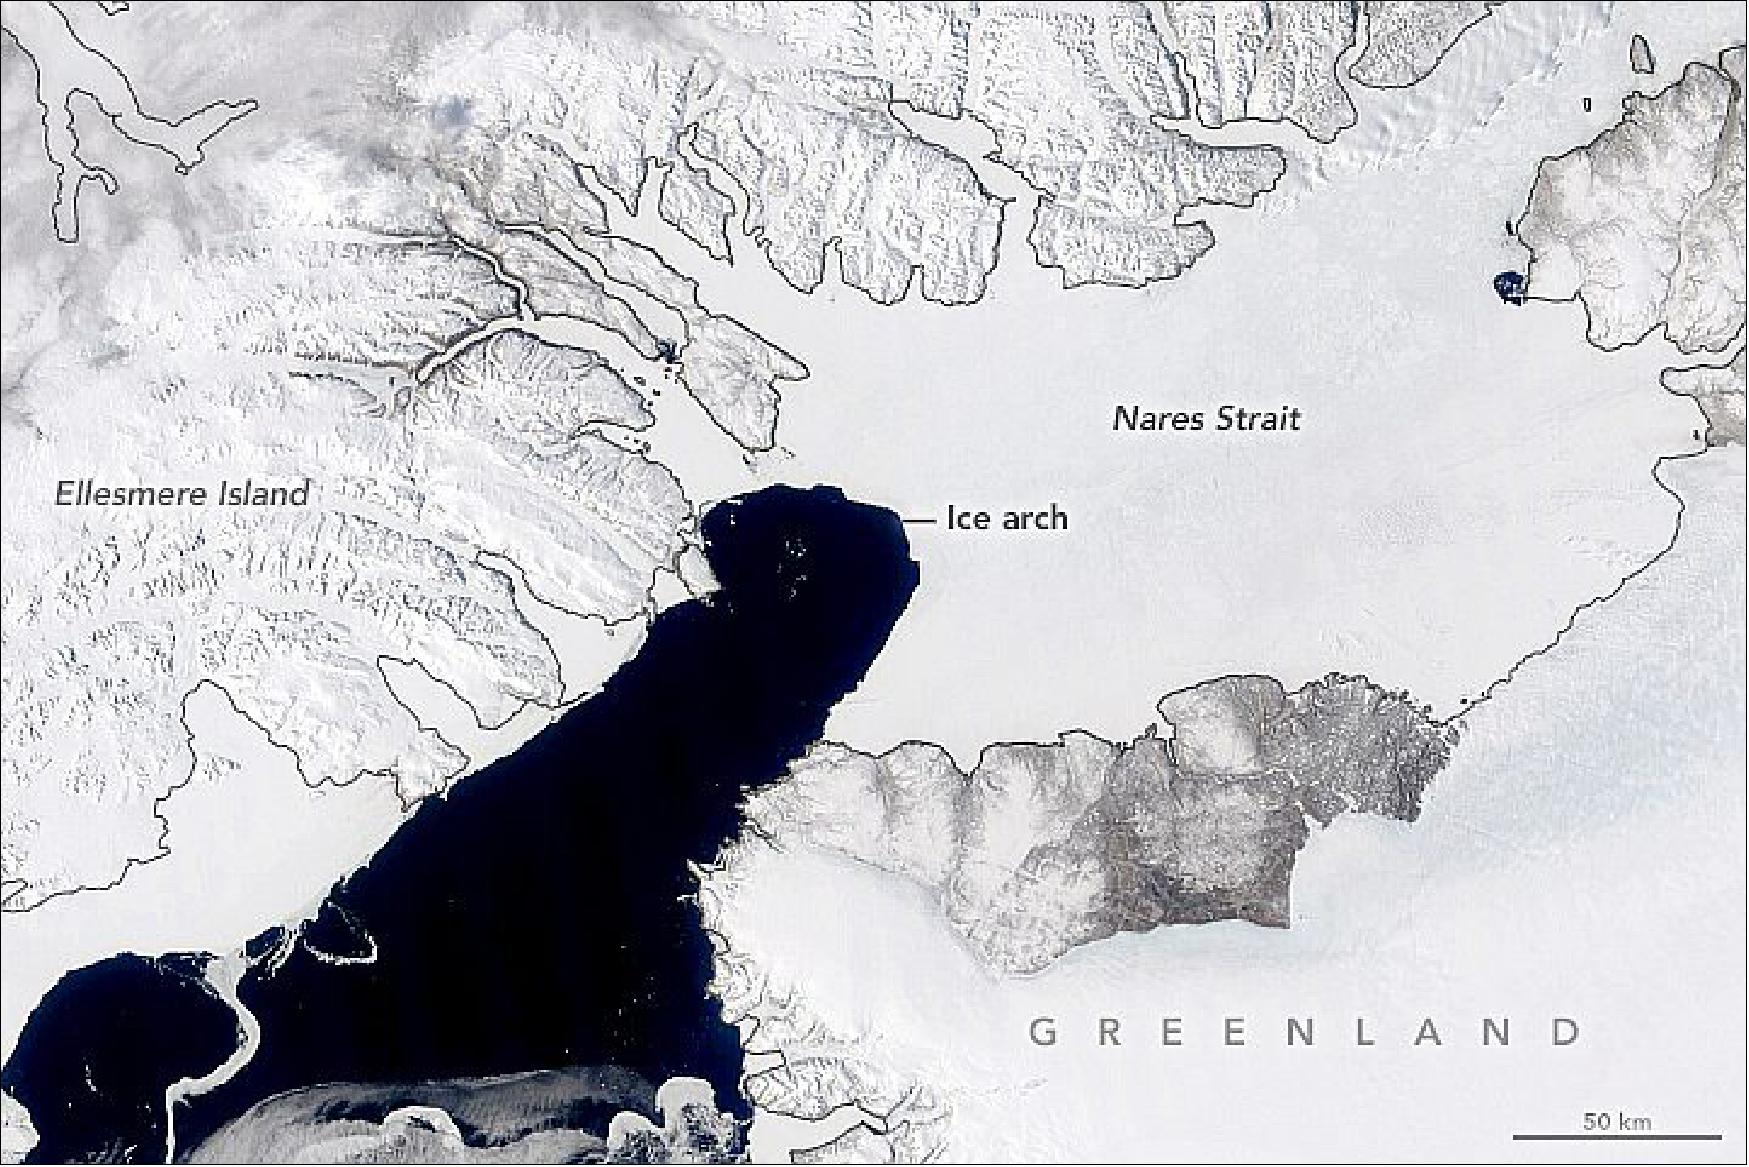
- According to Walt Meier, a sea ice researcher at the National Snow and Ice Data Center, the timing of the breakup depends on factors including ice thickness, air temperature, and wind direction. Thick ice is more stable and tends to break-up later than thin ice. In the strait, thick ice can build up during winters with cold air temperatures; it can also accumulate from thick, multi-year ice that drifts in from the north and gets "wedged" in the strait.
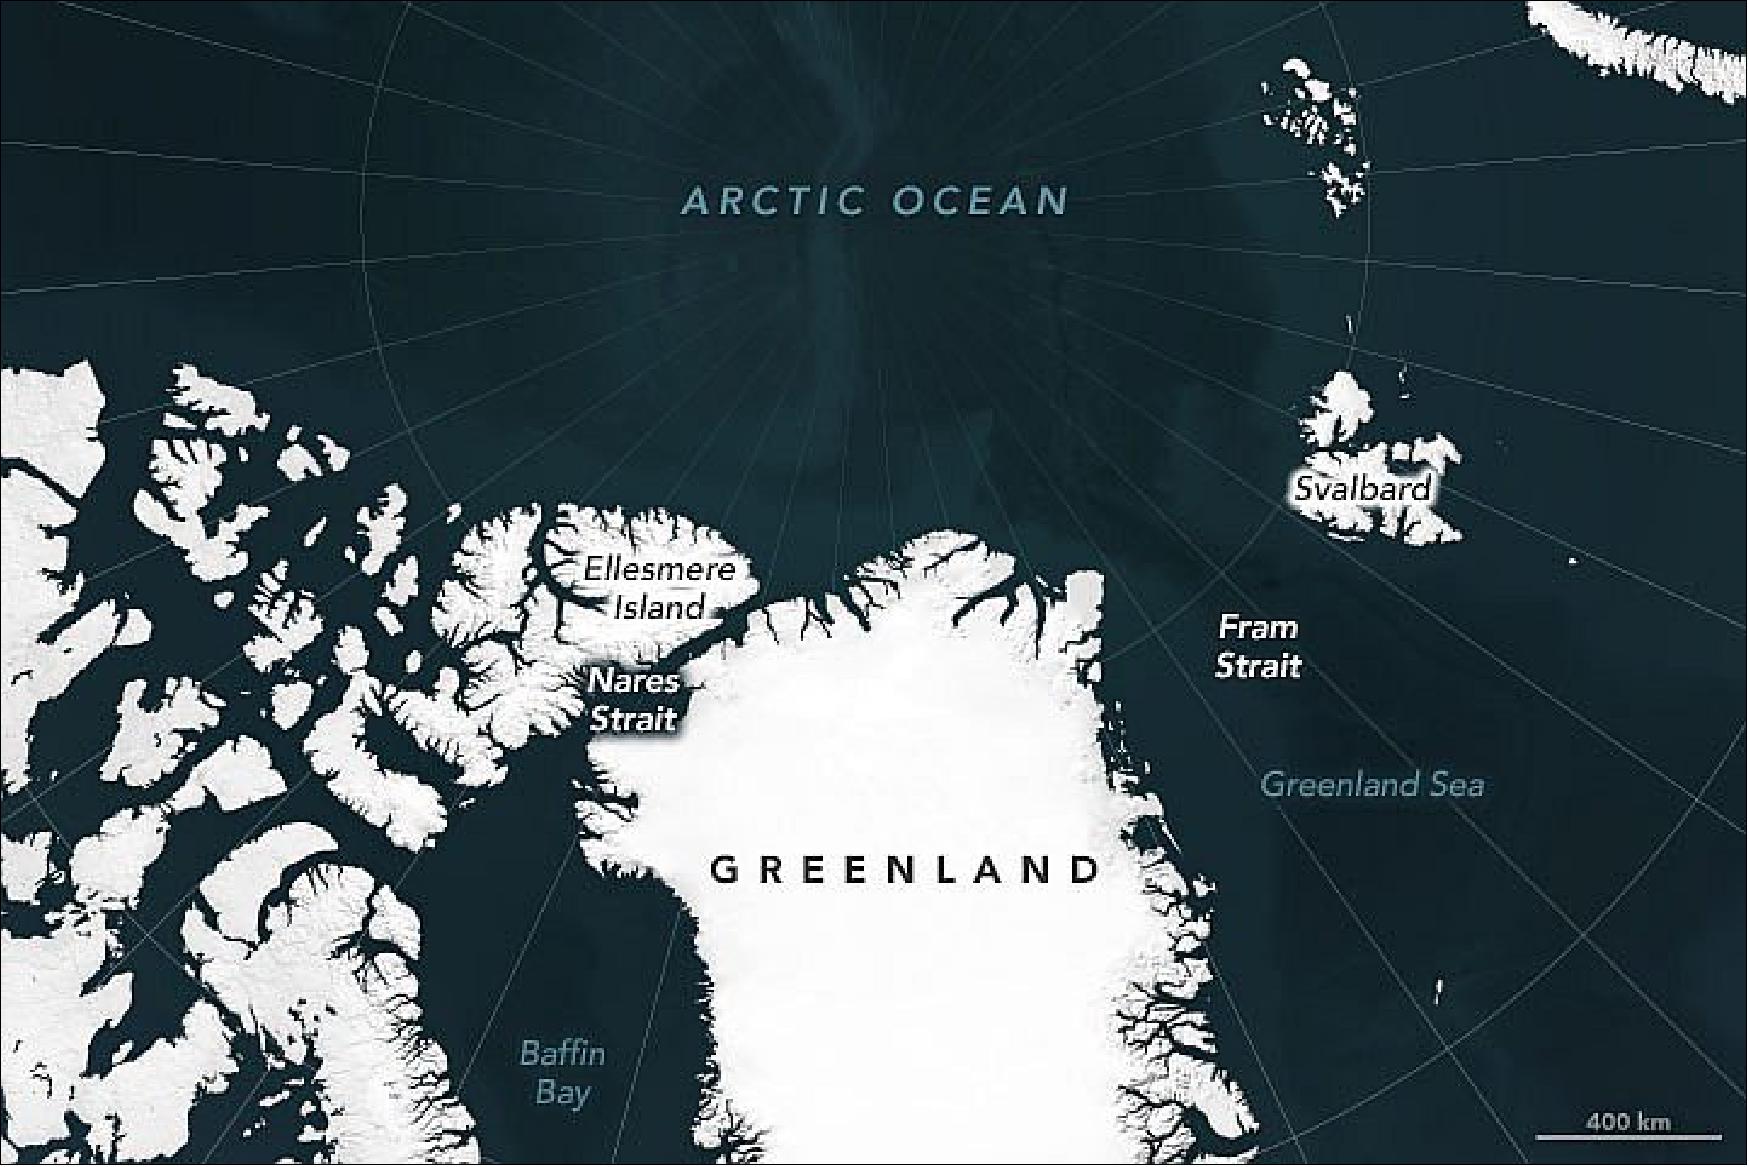
- But you need more than thin ice and warm temperatures to destroy the ice arch. "Warmer temperatures in the spring don't necessarily indicate an early break-up," Meier said. "The ice needs to be weak enough to break up, but then the winds blowing in the right direction give it a ‘final kick' for the arch to collapse."
- The "right direction" refers to winds blowing parallel to the strait, forcing ice southward. Meier noted that over the past few months, a low-pressure circulation pattern in the central Arctic has resulted in winds blowing perpendicular to Nares Strait. "These are not winds that would tend to initiate the break-up," he said.
- Meier speculated that this same wind pattern could be responsible for churning up the sea ice and causing tough conditions for the Polarstern—an icebreaker currently drifting in Arctic sea ice for the MOSAiC science expedition. "So, that large-scale circulation may have contributed to both ridging and thicker ice along Polarstern's route," Meier said, "as well as winds that are favorable to preserving the arch."
• May 20, 2020: The Gran Chaco is not the most well-known forest in South America. It is second in size and biodiversity to the neighboring Amazon rainforest. Unlike the moist Amazon, the Gran Chaco is located in a semi-arid climate; its vegetation is less colorful. But like the Amazon, the Gran Chaco has been facing rapid deforestation over recent years. 56)
- The Gran Chaco spans about 650,000 km2 (250,000 square miles) in Argentina, Paraguay, Bolivia, and Brazil—making it the largest dry forest in South America. It largely consists of shrubs and hardwood trees that provide habitat for thousands of plant species and hundreds of animal species. The native Wichí people have hunted and gathered on this land for decades.
- But observations by Landsat satellites indicate that roughly 20 percent—142,000 km2 (55,000 square miles)—of the forest was converted into farmland or grazing land from 1985-2013. From 2010 to 2018, more than 29,000 km2 (11,000 square miles) of the Gran Chaco was cleared for farms and ranches, according to the non-profit Guyra Paraguay. Much of the clearing took place in Argentina.
- The images of Figures 92 and 93, acquired with MODIS on NASA's Terra satellite, show the deforestation over a span of two decades around the Salta Province of northern Argentina. Much of the cleared land has been converted to farmland for growing soybeans and raising livestock. Argentina is the third-largest soybean producer in the world. Research shows that soybean production was a direct driver of deforestation in the forest in the 2000s. As soybean producers felt more pressure to keep up with global demand, they needed to find untapped land and began clearing forests and arid regions. Advances in technology made it easier to grow crops on these marginal lands, which were previously difficult to cultivate.
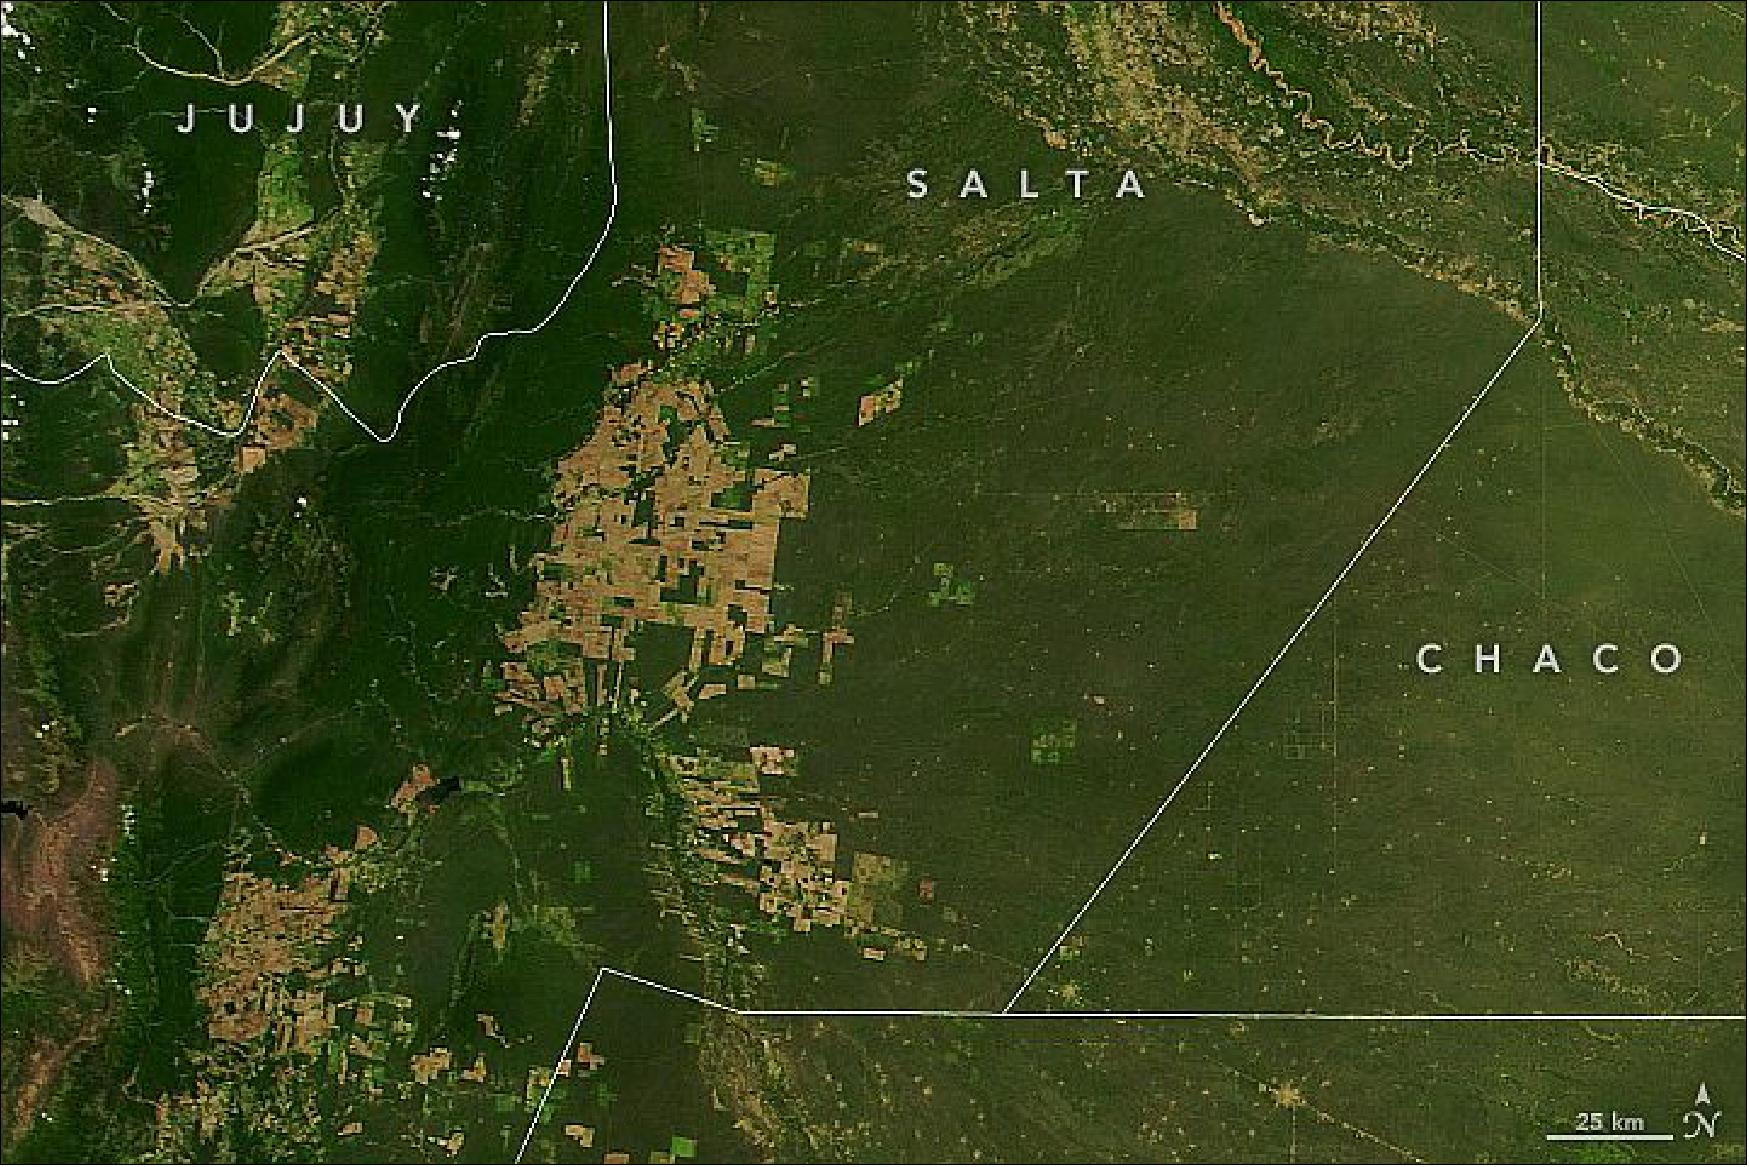
- Controlling deforestation in Gran Chaco has been challenging. In 2007, Argentina enacted a national "forest law" mandating that local governments regulate the expansion of large-scale farming and establish practices to protect native forests. However, research shows that local governments were unable to enforce the law in certain protected zones, some of which actually experienced an increase in deforestation after the law was passed.
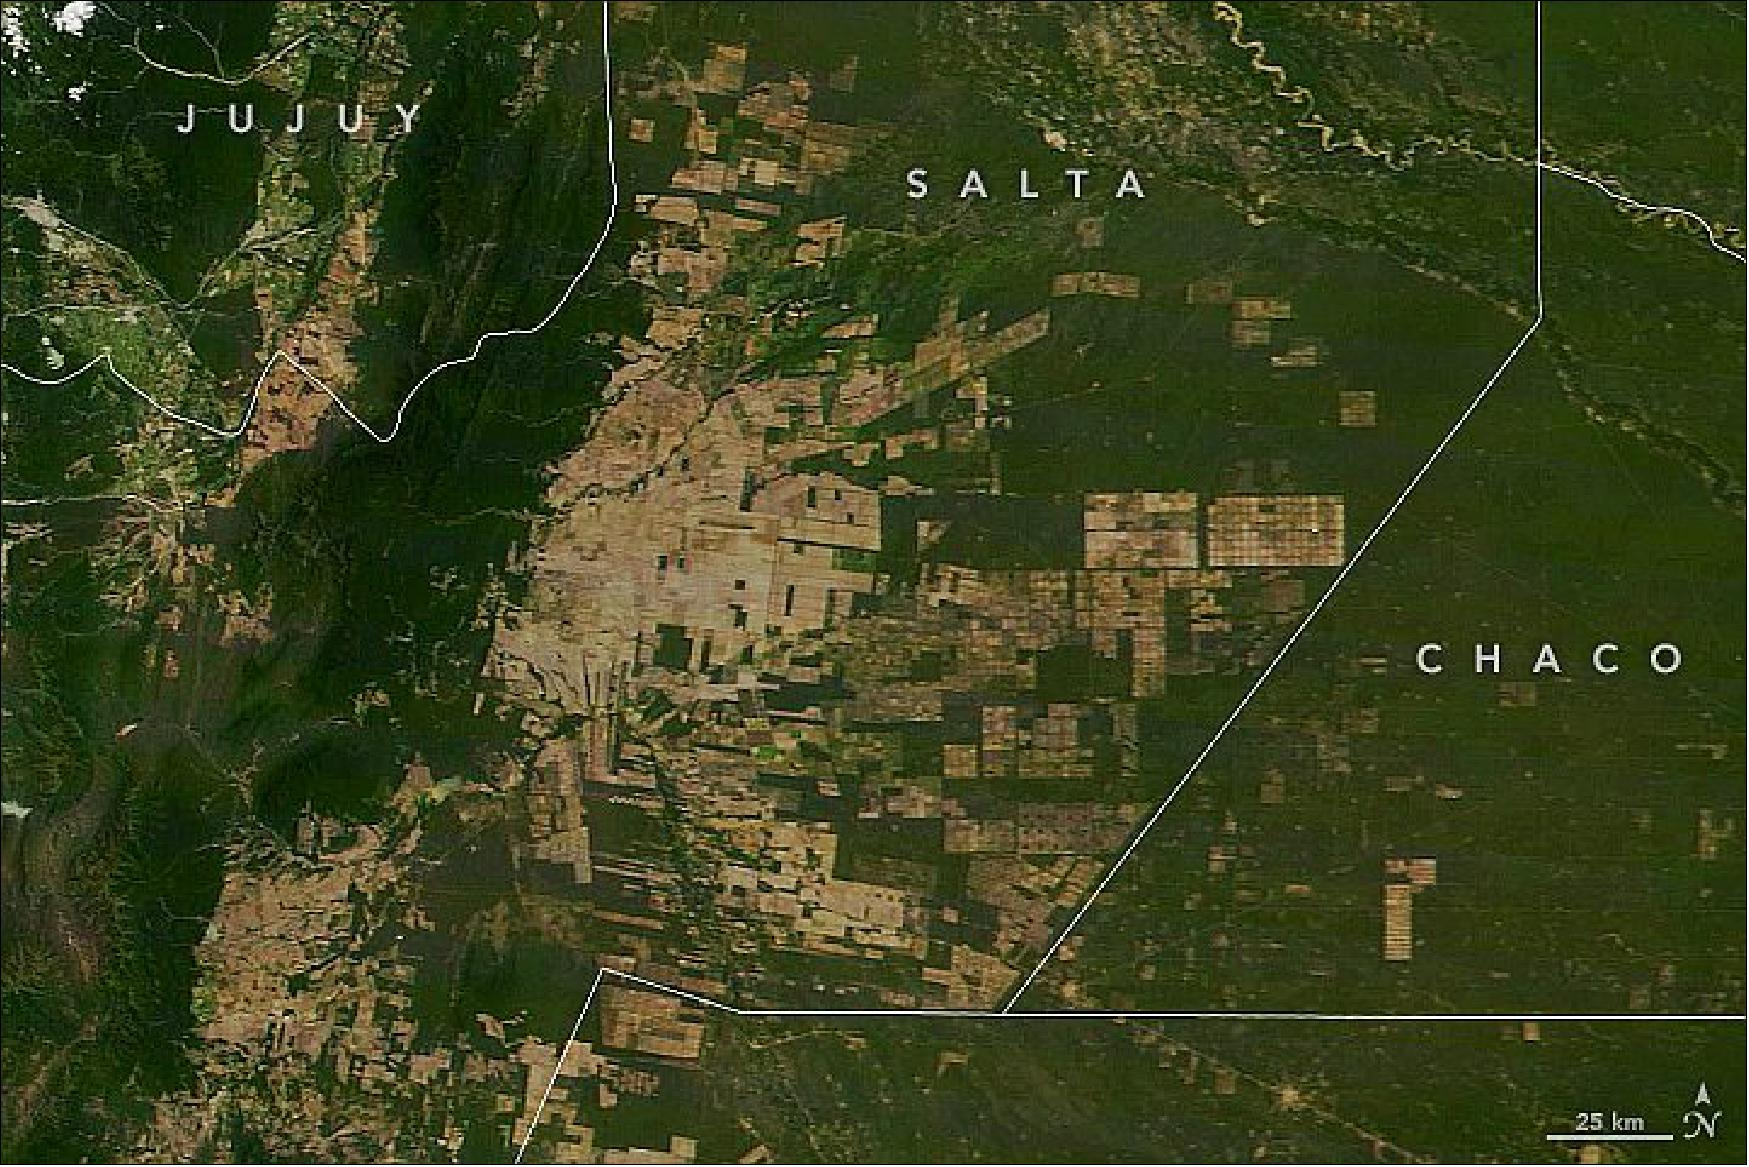
• April 21, 2020: On March 25, 2020, the Indian government placed its 1.3 billion citizens under a strict lockdown to reduce the spread of the COVID-19 coronavirus. The country-wide mandate decreased activity at factories and severely reduced car, bus, truck, and airplane traffic. After just a week of reduced human activities, NASA satellite sensors observed aerosol levels at a 20-year low for this time of year in northern India. 57)
- Every year, aerosols from anthropogenic (human-made) sources contribute to unhealthy levels of air pollution in many Indian cities. Aerosols are tiny solid and liquid particles suspended in the air that reduce visibility and can damage the human lungs and heart. Some aerosols have natural sources, such as dust storms, volcanic eruptions, and forest fires. Others come from human activities, such as the burning of fossil fuels and croplands. Human-made aerosols tend to contribute most of the smaller particles that have greater potential for damaging human health.
- "We knew we would see changes in atmospheric composition in many places during the lockdown," said Pawan Gupta, a Universities Space Research Association (USRA) scientist at NASA's Marshall Space Flight Center. "But I have never seen aerosol values so low in the Indo-Gangetic Plain at this time of year."
- In a typical early spring in the Ganges Valley of northern India, human activities generate the majority of aerosols. Motor vehicles, coal-fired power plants, and other industrial sources around urban areas produce nitrates and sulfates; coal combustion also produces soot and other carbon-rich particles. Rural areas add smoke—rich in black carbon and organic carbon—from cooking and heating stoves and from prescribed burns on farms (though farming fires more often occur at other times of year). By all accounts, the 2020 lockdown reduced those human-made emission sources.
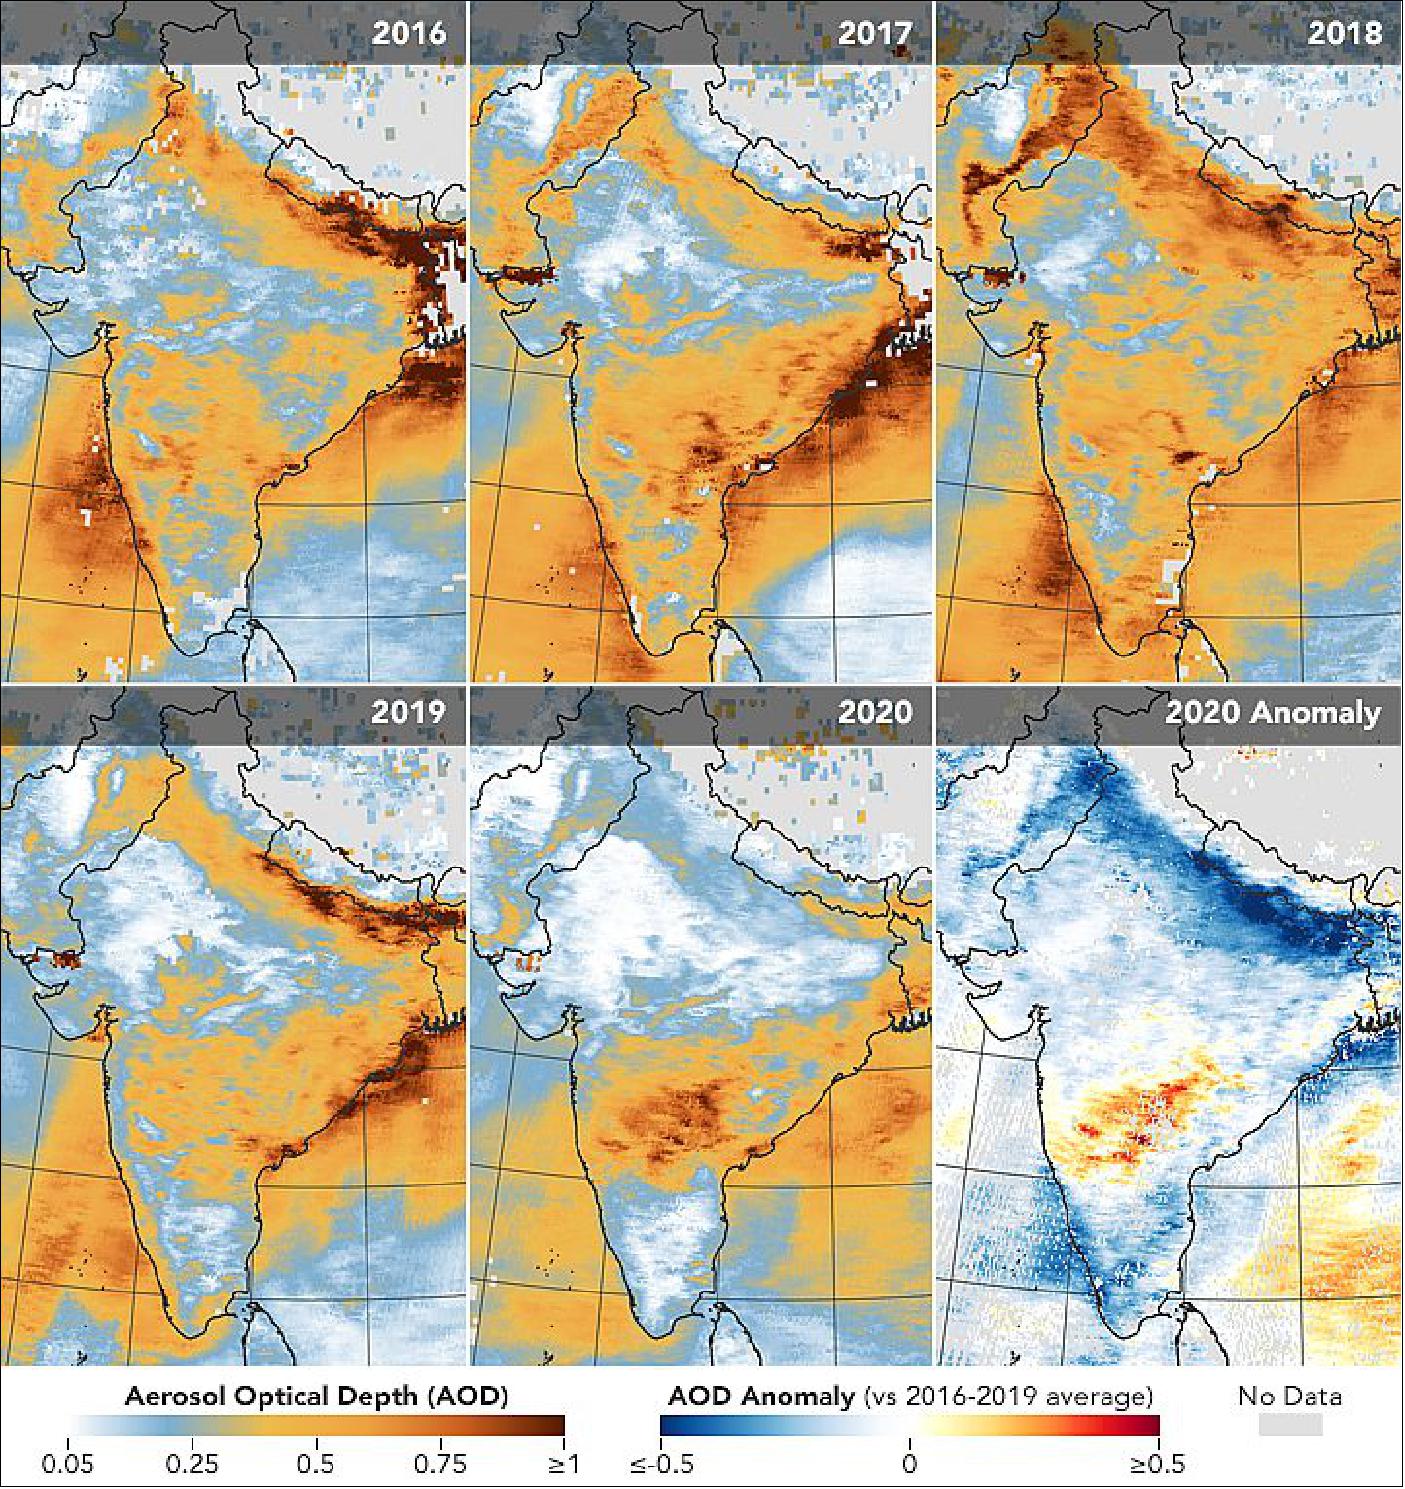
- Scientists expect aerosol levels to increase slightly in upcoming weeks in parts of India as seasonal dust storms begin. Dust concentrations are typically low in March and early April, before temperatures rise and strong westerly winds blow sand in from the Thar Desert and Arabian Peninsula. The question is whether overall AOD will remain below normal.
- "The hard part with understanding aerosols is that particles can move based on wind patterns and other meteorology," said Robert Levy, program leader for NASA's MODIS aerosol products. "You have to disentangle what is caused by the human fingerprint versus a meteorological factor."
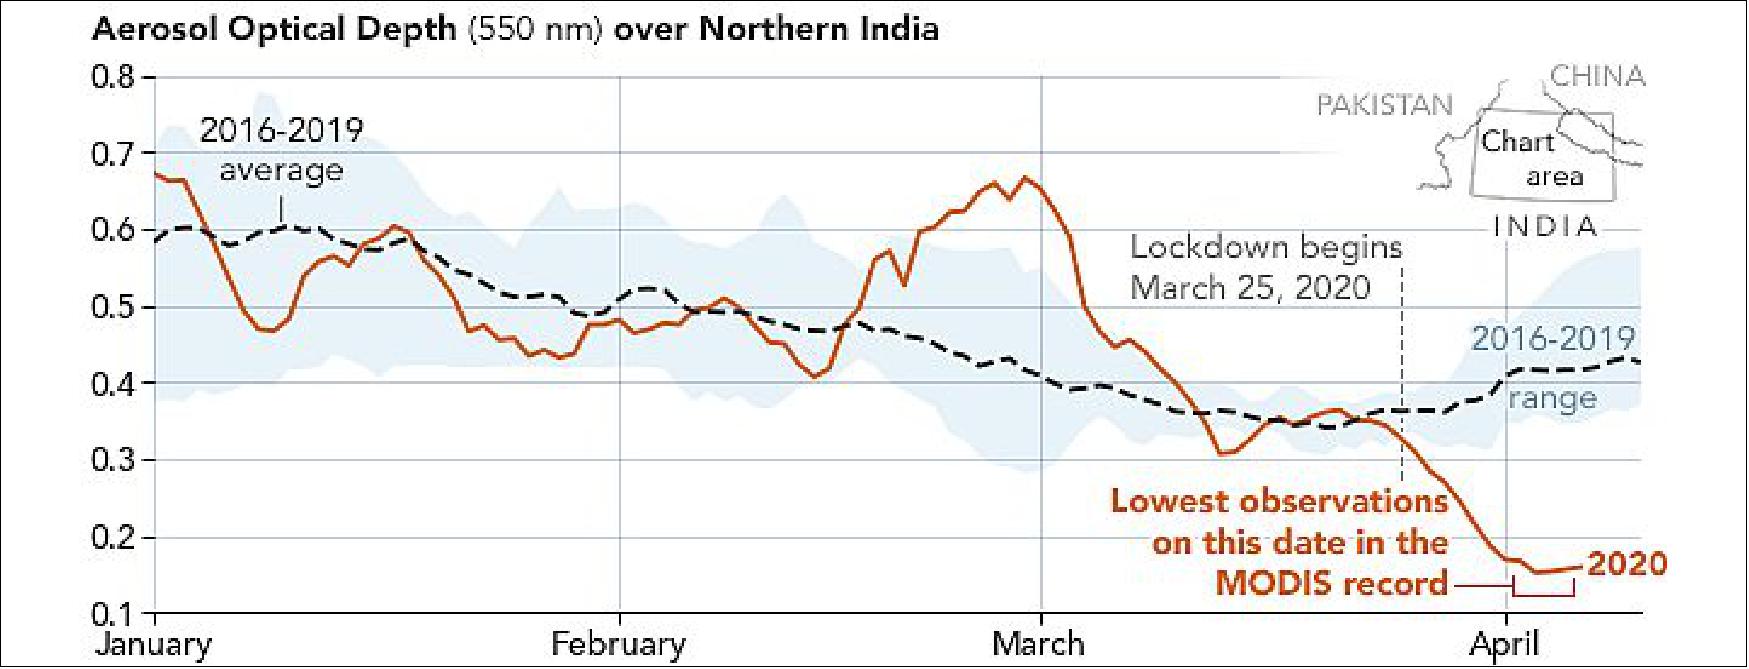
- In the first few days of the lockdown, it was difficult to observe a change in the pollution signature. "We saw an aerosol decrease in the first week of the shutdown, but that was due to a combination of rain and the lockdown," said Gupta. Around March 27, heavy rain poured over vast areas of northern India and helped clear the air of aerosols. Aerosol concentrations usually increase again after such heavy precipitation.
- "After the rainfall, I was really impressed that aerosol levels didn't go up and return to normal," Gupta added. "We saw a gradual decrease, and things have been staying at the level we might expect without anthropogenic emissions."
- According to Gupta, AOD levels in northern India at the beginning of April were significantly below the norm for this time of year and the lowest in 20 years of MODIS observations. Ground observation stations in India have also reported a decrease in particle pollution in the region. Anecdotally, people in the northern state of Punjab have reported seeing the Himalayas for the first time in decades.
- In southern India though, the story is a little hazier. Satellite data show aerosol levels have not yet decreased to the same extent; in fact, levels seem to be slightly higher than in the past four years. The reasons are unclear, but could be related to recent weather patterns, agricultural fires, winds, or other factors.
- This a model scientific experiment," said Levy about the lockdown and its effects on pollution. "We have a unique opportunity to learn how the atmosphere reacts to sharp and sudden reductions in emissions from certain sectors. This can help us separate how natural and human sources of aerosols affect the atmosphere."
• April 20, 2020: Some Antarctic icebergs can persist for many years. A newborn child could go off to school, learn to drive, and become an adult all within the span of time it takes some of the largest icebergs to break up and melt away. Iceberg A-68A—now just a few months shy of its third birthday—is a youngster compared to some. But the mammoth berg has already had an impressive journey. 58)
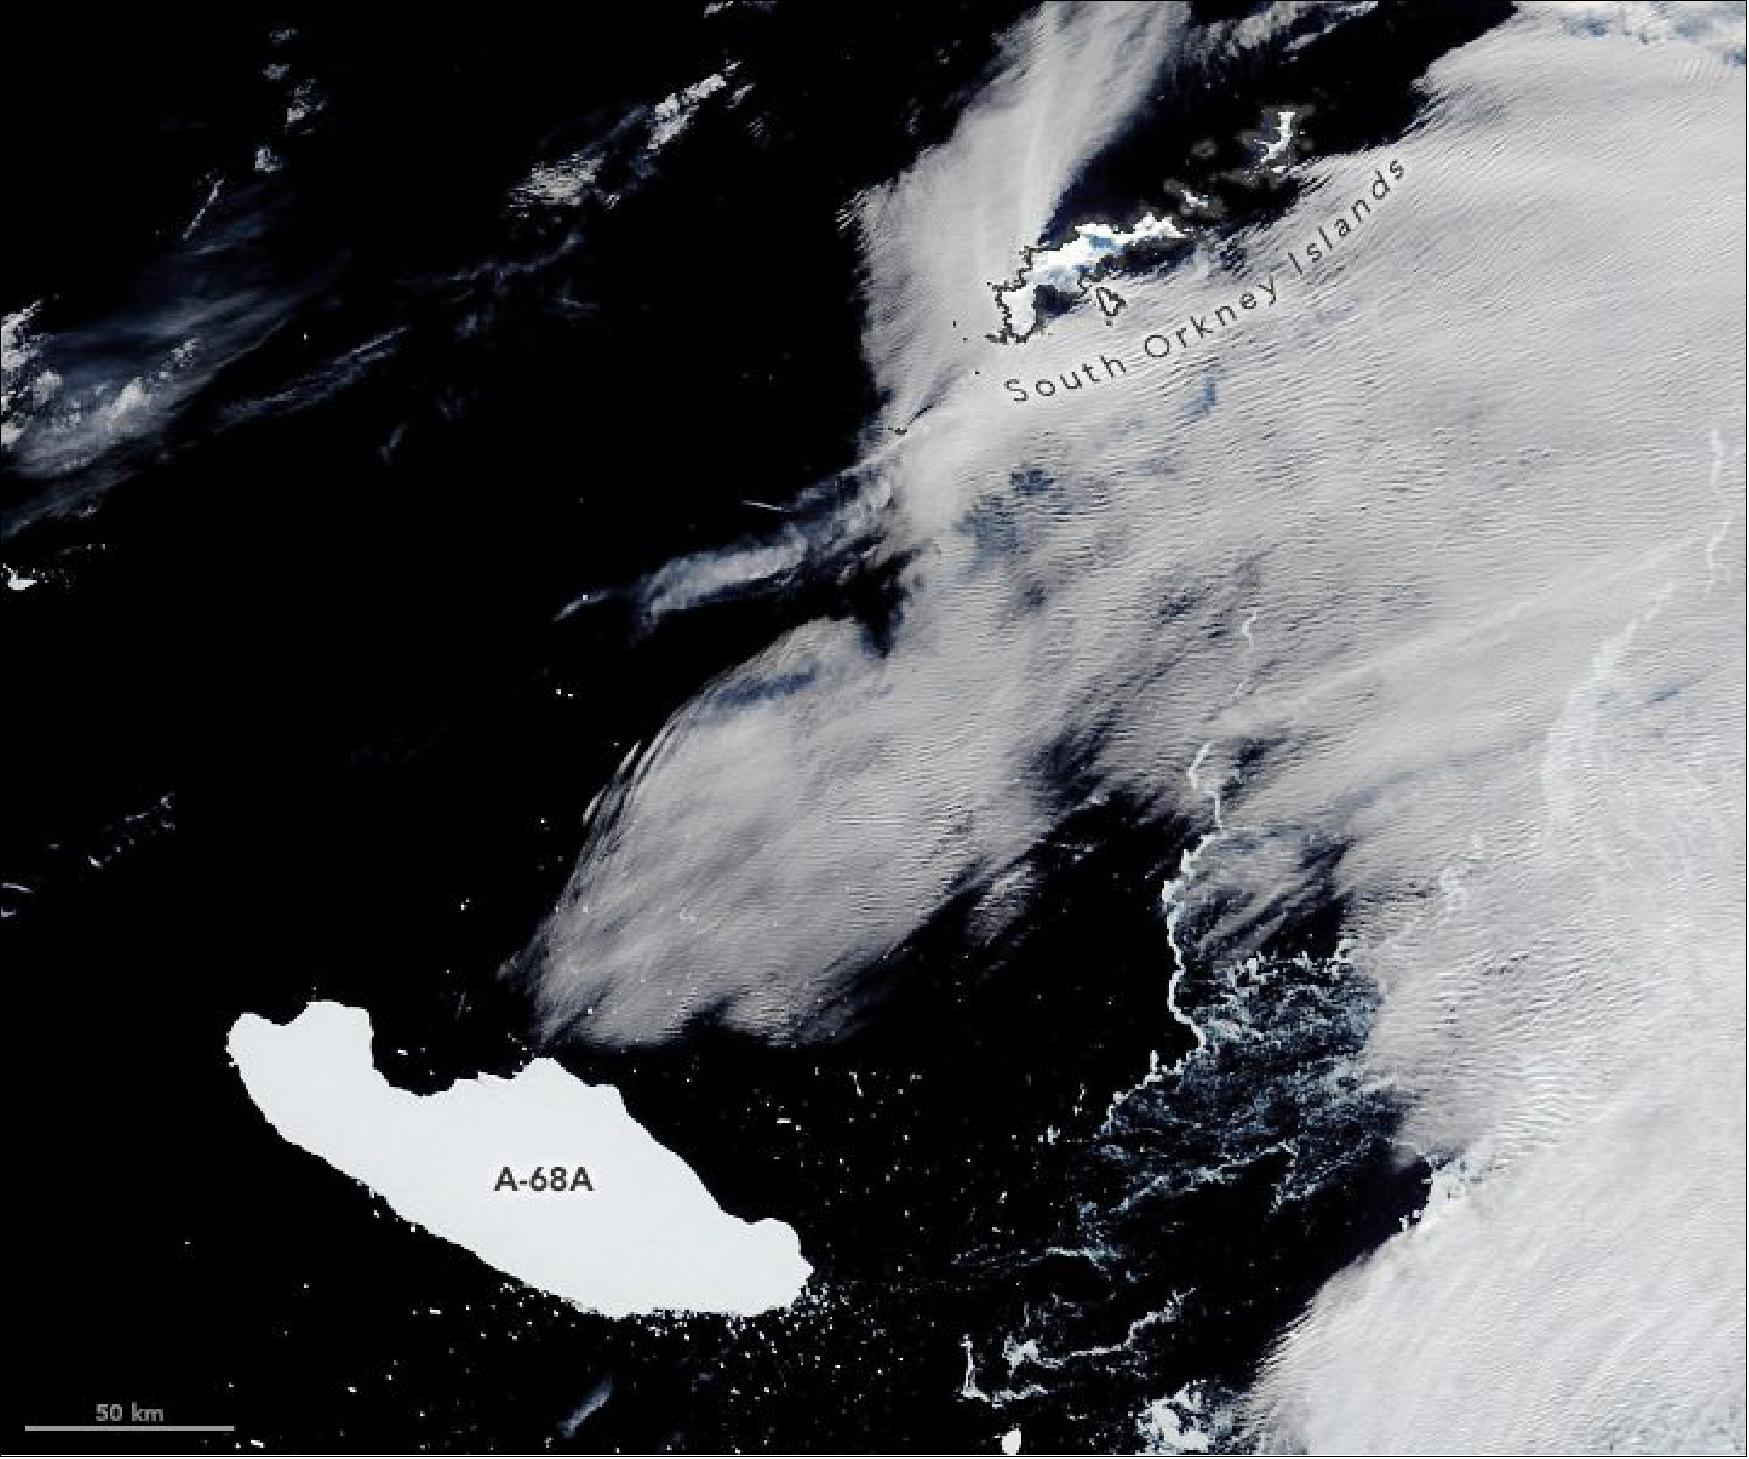
- In this image, A-68A is about 500 miles from where it broke away from the Larsen C Ice Shelf in July 2017. The journey, however, was not exactly direct. In its first year, the iceberg moved just 45 km (28 miles) as tides shuffled the Delaware-sized block of ice back and forth, occasionally smashing it against a rocky outcrop on the Antarctic Peninsula. The region's powerful currents eventually won, and the iceberg has since been winding its way north through the Southern Ocean.
- A-68A seems to have hit the brakes in recent weeks, rotating in place without moving far. NASA/UMBC glaciologist Christopher Shuman thinks the berg could be caught up in a circulating mass of water, or "gyre." Christopher Readinger, a scientist at the U.S. National Ice Center (NIC), agrees that a gyre or smaller-scale eddy could explain the berg's motion. "This is behavior we've seen many times before with other bergs downstream of the peninsula," Readinger said. "They just start circling for no apparent reason."
- Icebergs passing through this area eventually get kicked to the east when they encounter the powerful Antarctic Circumpolar Current, which funnels through the Drake Passage. From that point, the ice can whip north into the warmer waters of the South Atlantic—a region where icebergs melt, break down, and ultimately die. That has been the fate of many fragments of another iceberg, B-15. The Connecticut-sized berg was the largest ever measured by satellites, but 20 years after breaking from the Ross Ice Shelf, only one piece is still large enough to be tracked by the NIC.
- A-68A is not quite at that point. "I'm surprised at how well it's sticking together," Readinger said. "It's been in warmer water for a few months now and it's not exactly a very thick berg, so I expect it will break up sometime soon, but it's showing no signs of that yet."
• April 4, 2020: Russia's Lake Beloye holds just over 6 km3 of fresh water; drops in a bucket compared to the 24,000 km3 in Lake Baikal, the world's largest freshwater lake by volume. Yet Beloye still manages to make a stately appearance in satellite imagery.
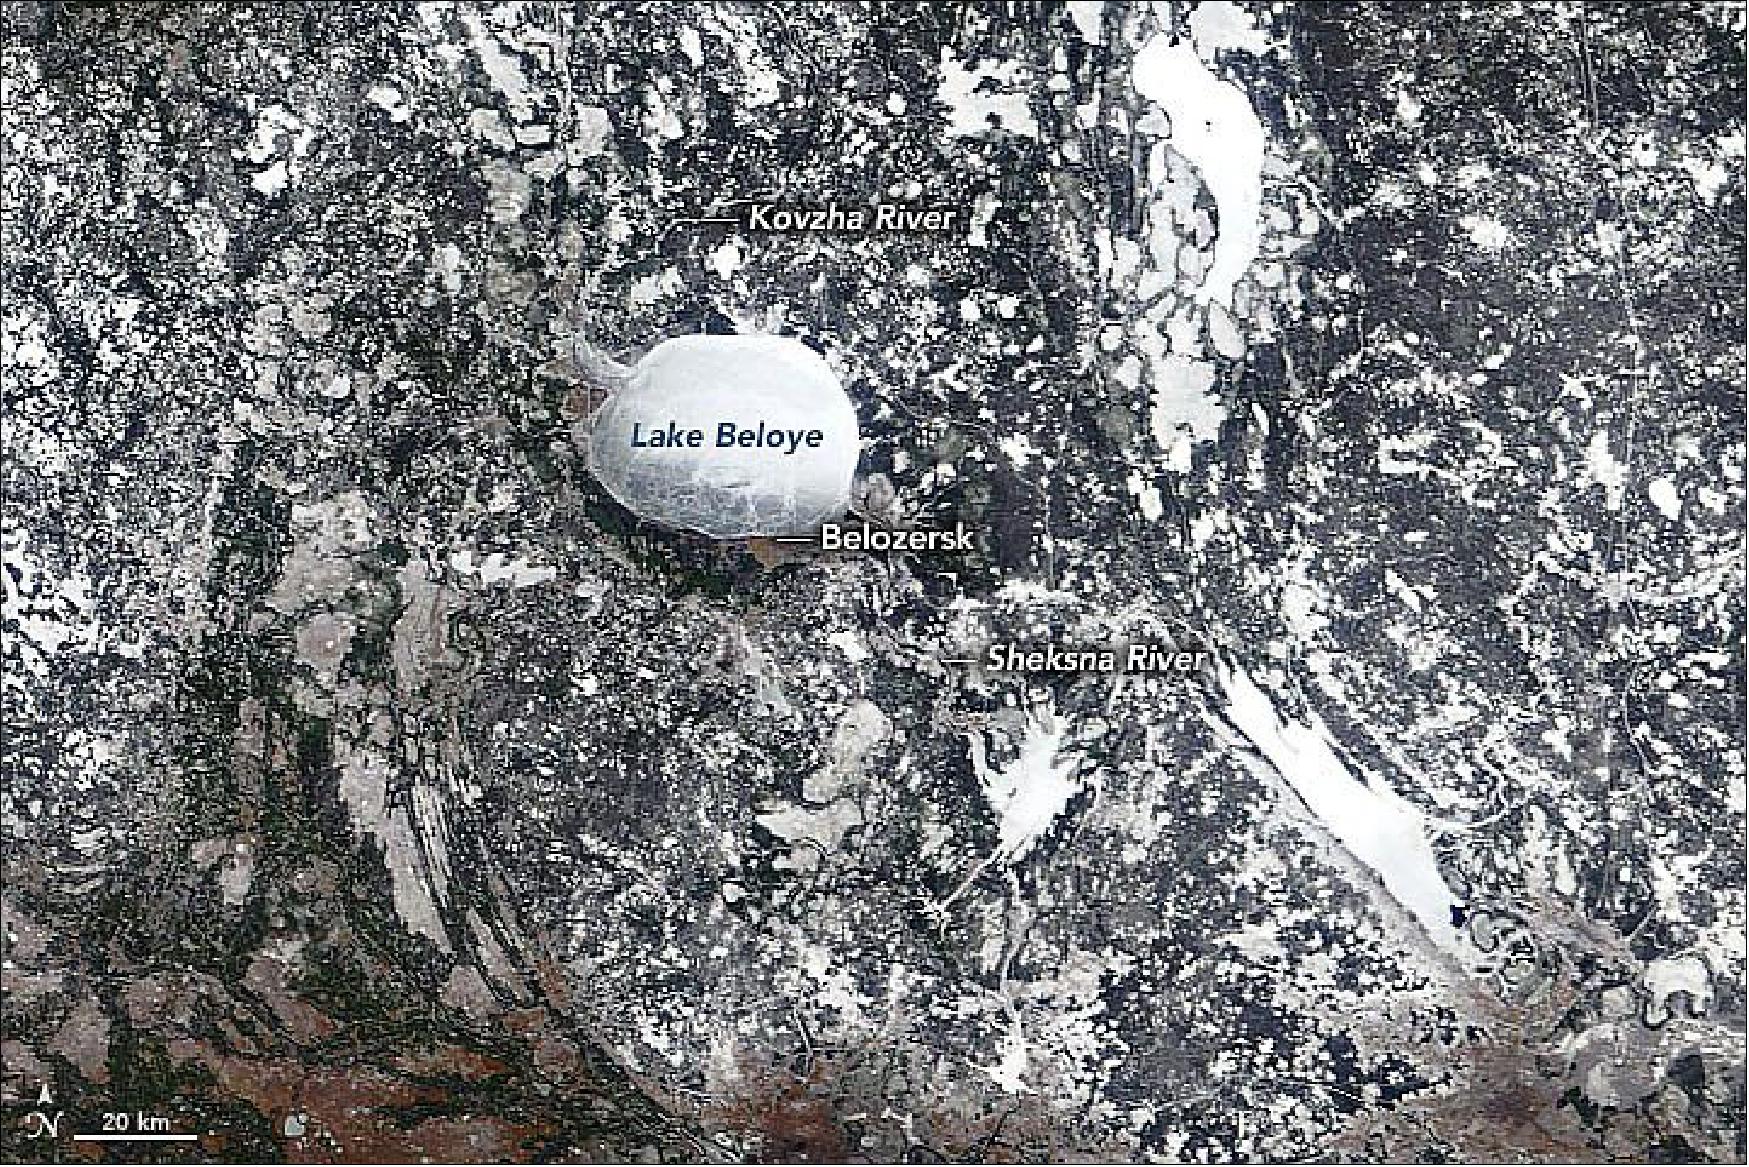
- It also stands out because of the stark contrast of lake ice—some of it is likely snow-covered—with the surrounding landscape. The lake usually freezes over in early November and breaks up in late April. Thawing already appeared to be underway when this image was acquired, with thin gray ice along the southern coast near the historic town of Belozersk. If you click on this time series of raw images, small areas of open water were visible by March 30, before fresh snow appeared to cover the ice again on April 1.
- The shape of the lake is strikingly round. Many of the lakes in this region fill valleys and depressions left behind at the end of the last Ice Age when the enormous ice sheets retreated. That could be the case here or, as another source points out, the water could be filling a 100-million-year-old impact crater.
- While this image makes the lake appear isolated in the landscape, it's actually connected to a series of rivers and canals that form the Volga-Baltic Waterway. In the area visible in this image, the waterway includes the Kovzha River, Lake Beloye, the Belozersky Canal (constructed along the lake's southern side as a bypass), and the Sheksna River. This waterway, in turn, is connected to an even larger system of inland waterways known as the Unified Deep Water System of European Russia.
• March 30, 2020: Could Satellites Help Head Off a Locust Invasion? Researchers are using satellite data to understand where locusts may spread during the largest infestation in eastern Africa in decades.— A single desert locust (Schistocerca gregaria) can consume its body weight in vegetation in one day. That may not sound like much for one 2.5-gram locust, but when 40 million of them gather—considered a small swarm—they can devour as much food as 35,000 people. In one day, a small swarm can jeopardize a farmer's livelihood. 59)
- Since December 2019, croplands in Kenya have been inundated by the voracious insects. By January 2020, at least 70,000 hectares (173,000 acres) of land were infested—Kenya's worst locust event in 70 years. In February, the swarms spread to ten countries in eastern Africa, threatening food supplies for millions of people. Ethiopia and Somalia have seen their worst locust infestations in 25 years. The United Nations (UN) has warned that the upcoming rainy season may make things worse.
- NASA-funded scientists are partnering with the UN and relief organizations to better understand where locusts are likely to swarm. Using remote sensing observations of soil moisture and vegetation, researchers are tracking how environmental conditions influence locust life cycles and hoping to stop outbreaks before they spread.
- "The approach that helps prevent large-scale infestations is to catch the locusts very early in their life stages and get rid of their nesting grounds," said Lee Ellenburg, the food security and agriculture lead for SERVIR at NASA's Marshall Space Flight Center. The joint program between NASA and the U.S. Agency for International Development (USAID) uses satellite data to improve environmental decision-making in developing nations. The team also partnered with staff at the Desert Locust Information System of the UN Food and Agriculture Organization (FAO) to learn more about locust behavior.
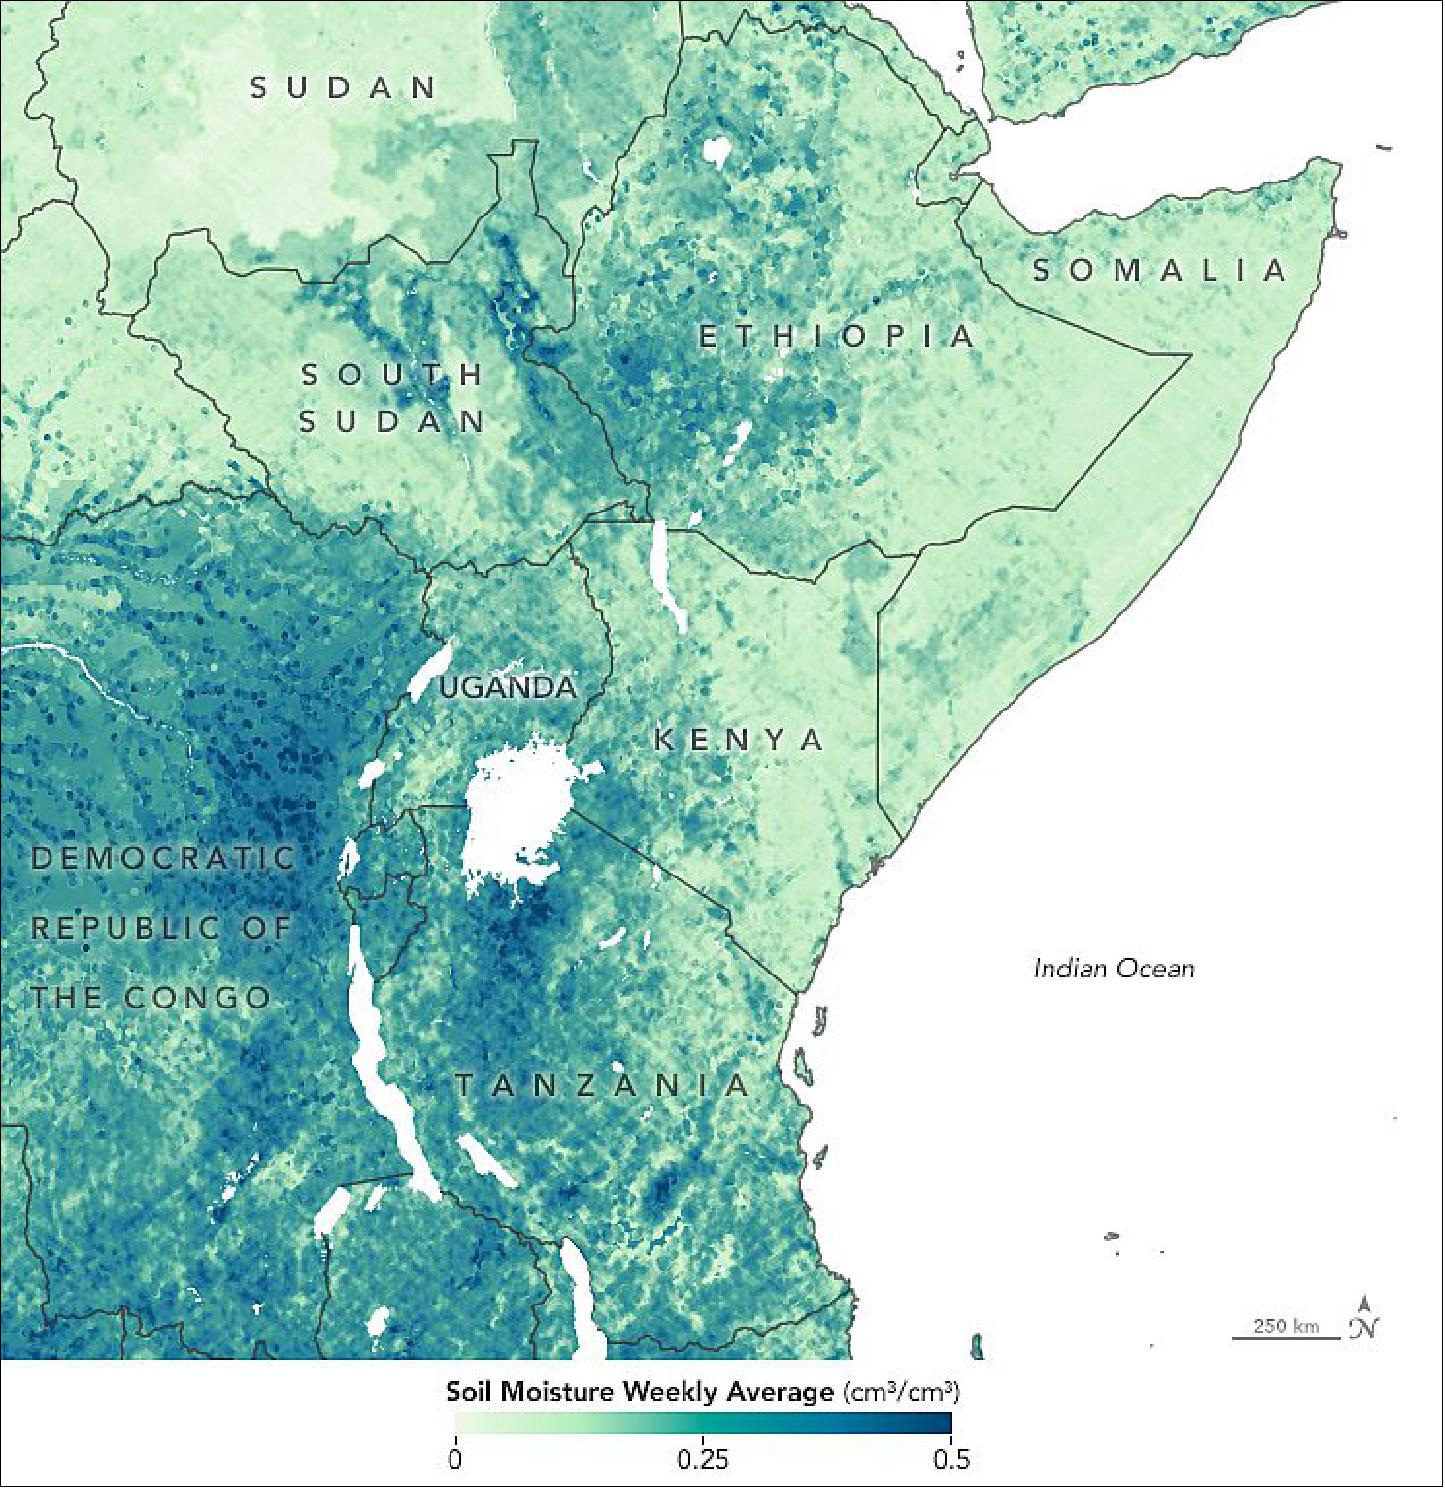
- The two maps (Figures 98 and 99) show two important environmental parameters for locust development: soil moisture and vegetation. Soil moisture is important because females almost always lay their eggs in wet, warm, sandy soil. In general, they do not lay their eggs unless the soil is moist down to 5-10 cm (2-4 inches) below the surface. After eggs hatch, the abundance of nearby vegetation becomes the important parameter because it provides sustenance for maturing locusts and guides migration patterns.
- Desert locusts have three main life stages: egg, hopper, and adult. Once they are mature adults, locusts are difficult to find on the ground and eradicate because they can fly 50 to 150 kilometers (30 to 90 miles) per day, especially if winds are strong. However, eggs and hoppers (when they're still developing wings) have limited mobility and are easier to target.
- "The data we have so far show a strong correlation between the location of sandy, moist soils and locust activity," said Ashutosh Limaye, NASA's chief scientist for SERVIR. "Wherever there are moist, sandy locations, there are locusts banding or breeding." Desert locusts rapidly reproduce, so SERVIR researchers are working with FAO to pinpoint potential breeding locations and suggest targeted areas for pesticide sprays.
- "Our goal is to learn from FAO how to find out where the breeding grounds are," Ellenburg added. "If the prevailing conditions indicate that locusts will hatch and be taking off, the goal is to go early and destroy their nesting grounds."
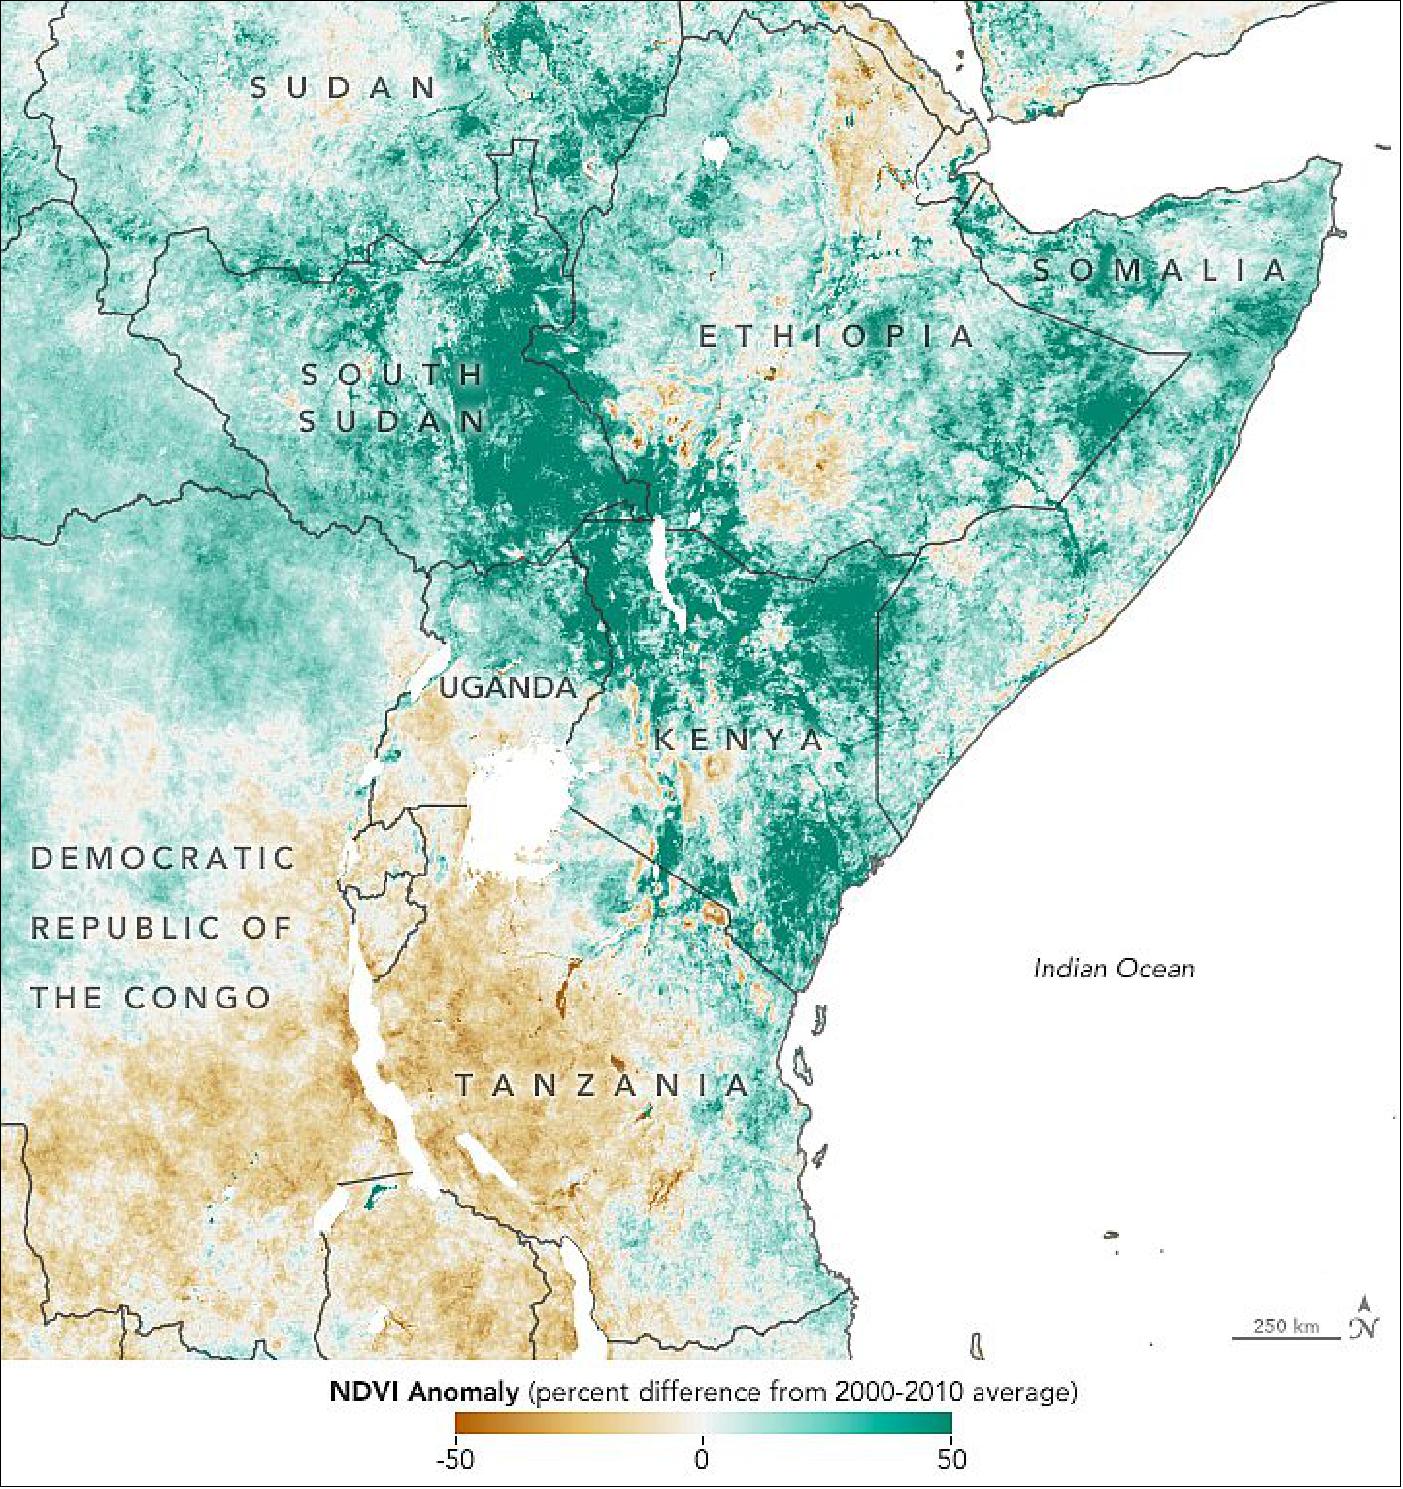
- "Once locusts lay the eggs and hatch, they start looking for vegetation to feed on," said Catherine Nakalembe, a food security researcher with SERVIR and NASA Harvest. "They start migrating, looking for more to eat, and then keep multiplying."
- Nakalembe says vegetation across the region is much greener than average years—in fact, the greenest vegetation observed by satellite since 2000 for the December to March time period. Between October and December 2019, the Horn of Africa received up to four times more rainfall than average, making it one of the wettest "short rain seasons" in four decades. The extra rain made for robust plant growth and bountiful conditions for locusts.
- With the upcoming "long rain season" (March through May) in east Africa, conditions could be ripe for more infestations, Nakalembe notes. The NASA team is refining several satellite datasets to assess the damage already caused and to create forecasts of where and how much longer locust outbreaks might occur.
- "We work in close coordination with national ministries through our regional partners, and we hope the outcomes from our ongoing work can ultimately support those who are in the front line of managing the current outbreak," said Nakalembe.
- The NASA SERVIR and Harvest programs are working closely with Global and Regional FAO offices, USAID, World Food Program (WFP), the SERVIR Hub in East and Southern Africa at the Regional Center of Resources for Mapping Development (RCMRD) in Nairobi, Kenya, the SERVIR Hub in West Africa at the AGRHYMET based in Niamey, Niger, the Greater Horn of Africa IGAD Climate Prediction and Applications Center, NASA Short-term Prediction Research and Transition Center (SPoRT) NASA Earth Science Disasters Program, and several satellite missions to provide information and direction on where resources should be directed to mitigate locust outbreaks.
• March 24, 2020: Winter is loosening its grip on the Northern Hemisphere, and greens and browns are replacing white on the landscape. But the seasonal change in March 2020 in Northern Europe is less dramatic than most years. 60)
- While snow covered much of Norway and the northern parts of Sweden and Finland, the southern end of each country appeared snow-free—including the capital cities of Oslo, Stockholm, and Helsinki. (For a seasonal comparison, see this image from March 2018.) The cities were virtually snow-free for much of winter 2019-20. For example, Helsinki saw no new snowfall in January or February, according to news reports. Numerous ski resorts across Europe had to rely on imported and artificial snow.
- Warm winter temperatures were one reason for the sparse snowfall. According to NOAA, the December 2019 to February 2020 period was the warmest on record in Europe, and the January-February period was the warmest on record for the Northern Hemisphere. "The strong polar vortex has kept much of the frigid air in the Arctic, leaving the mid-latitudes warmer and generally less snowy than normal," said Jennifer Francis, a scientist at Woods Hole Research Center.
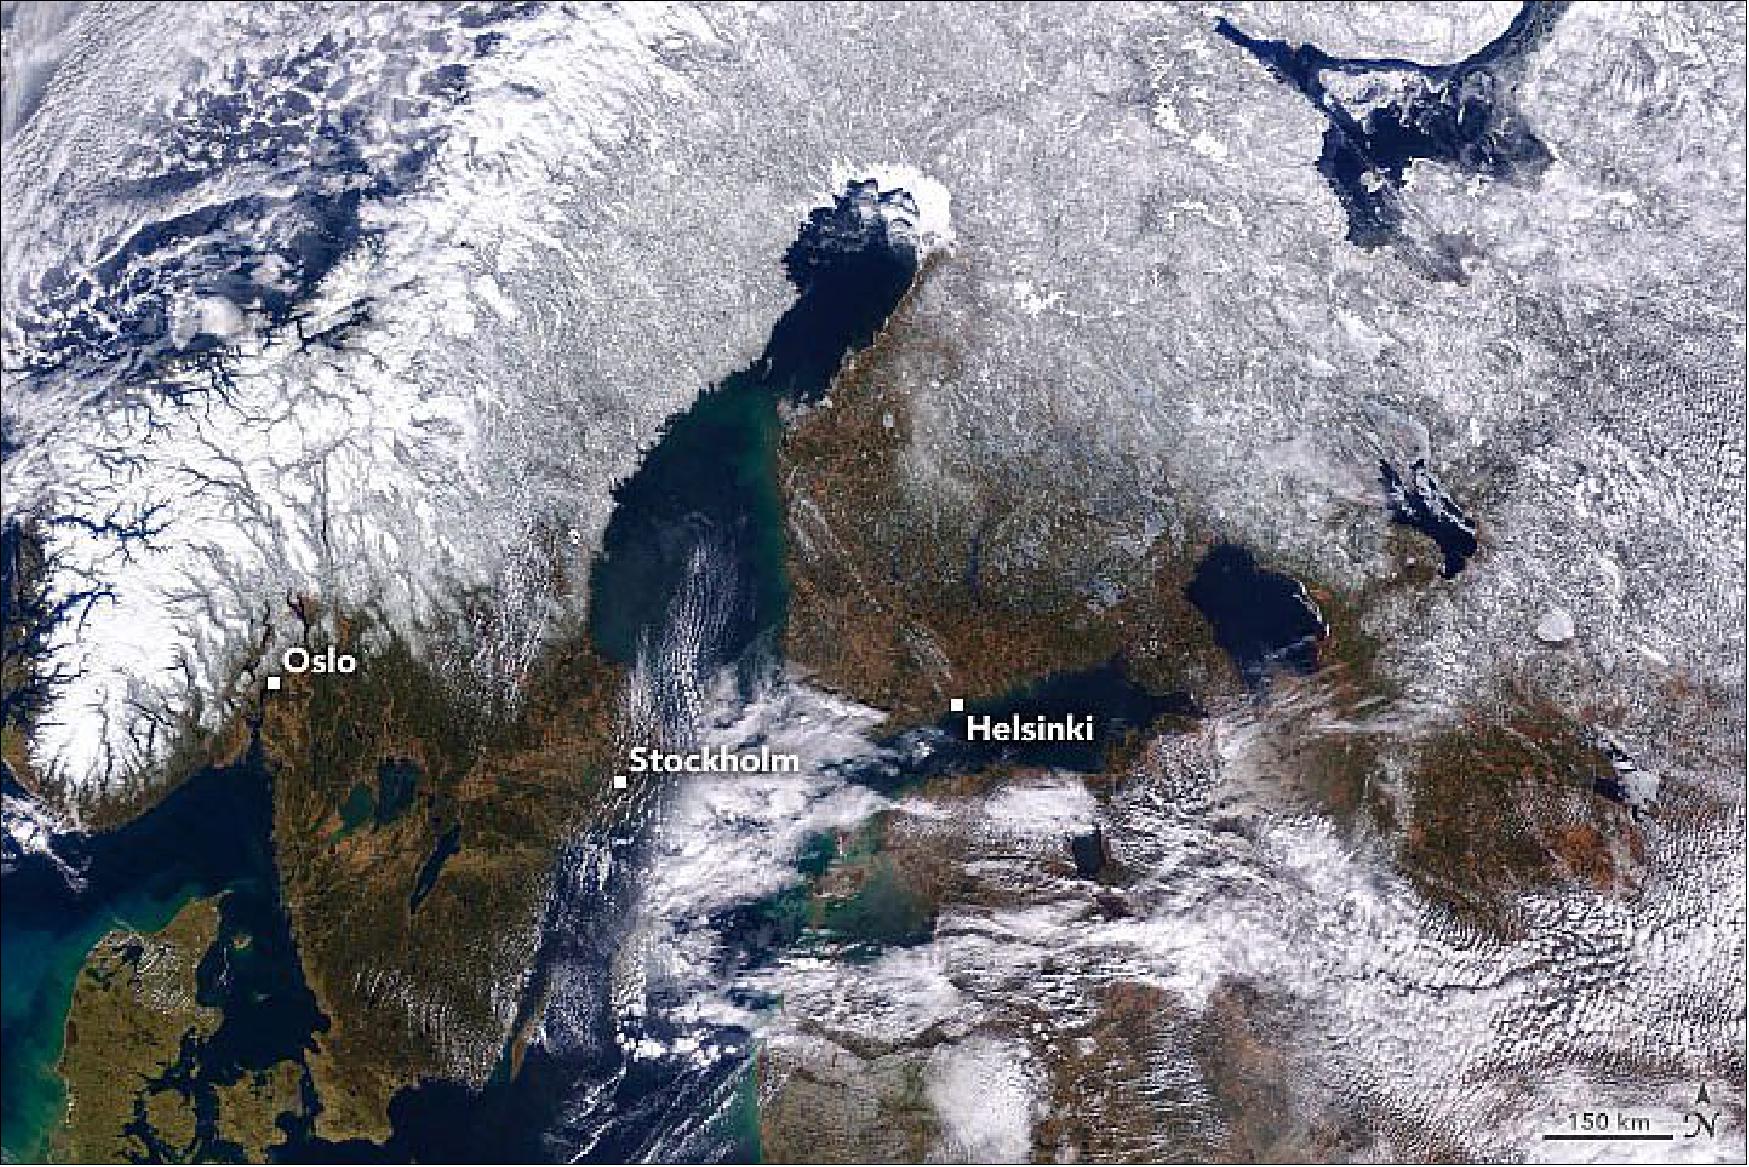
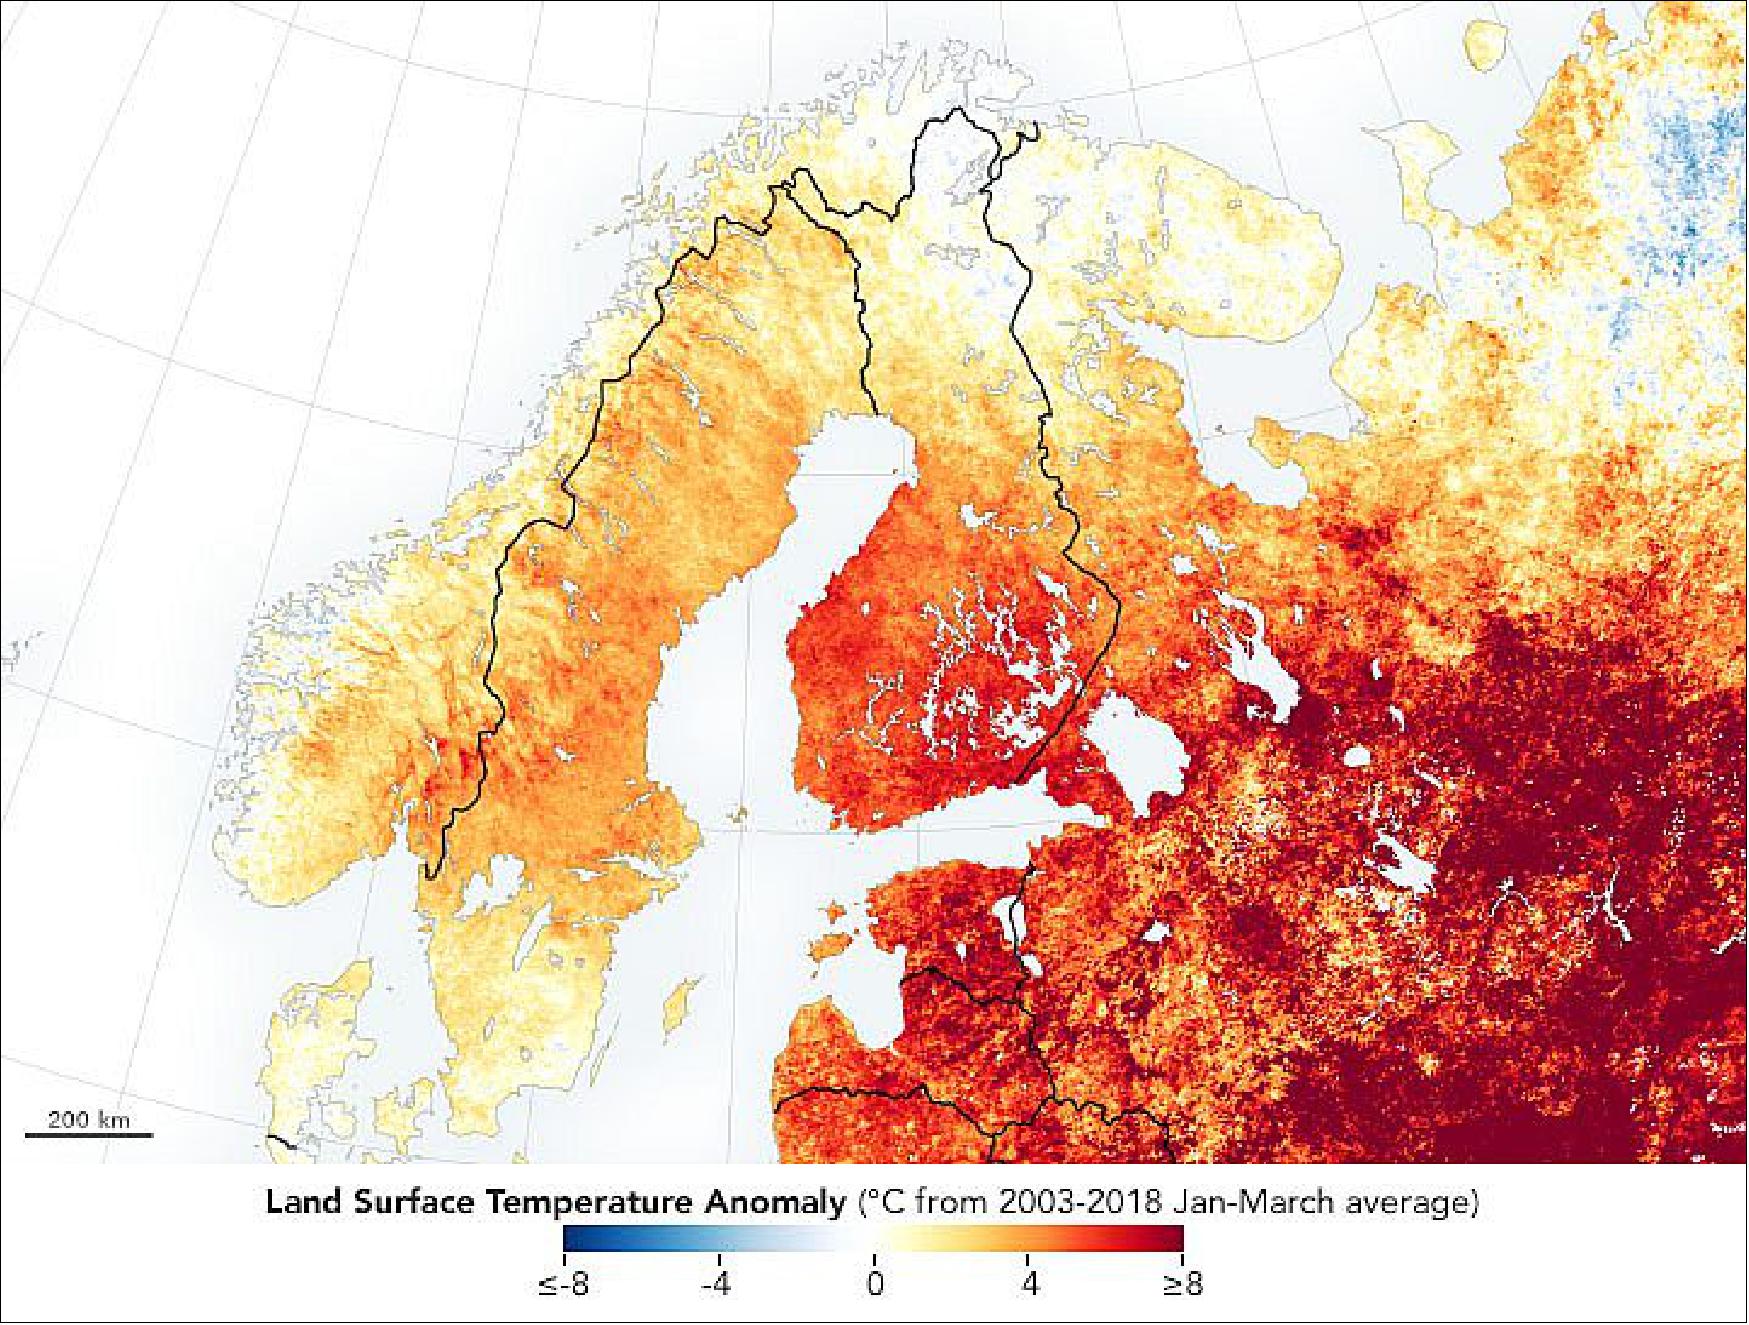
- As a consequence of a strong polar vortex, the polar jet stream—westerly winds in the lower atmosphere that help move weather systems around the planet—stayed farther north than normal this winter. As a result, Francis noted, Pacific storms hit places like Washington and British Columbia while depriving the Sierras of snowfall. Atlantic storms, meanwhile, pummeled the United Kingdom and northwest Europe, but avoided parts of Central and Northern Europe.
• March4, 2020: In August 2019, fires in the Amazon dominated the news, inspiring concern from presidents and prime ministers to pop stars to the Pope. As smoke darkened South American skies, people wondered: What caused the fires? Were they unusual? What did they mean for the rainforest? 61)
- Editor's Note: This story is part of a series. Please read part 1, part 2, and part 3 for a more complete picture of Amazon deforestation.
- Scientists at NASA and other international agencies worked overtime to answer such questions, using the satellite and ground-based information available in real-time. But the reality of science, statistics, and satellite observations is that understanding the causes and effects of a fire season takes time. Six months later, some of the answers are coming into clearer focus.
- "There is no question the 2019 Amazon fires were unusual, but they were unusual in specific areas and ways," said Douglas Morton, chief of the Biospheric Sciences Laboratory at NASA's Goddard Space Flight Center. "Fortunately, we did not see forest fires burning uncontrolled through the rainforest like we have during past drought years. What we did see was a worrisome increase in deforestation fires in certain parts of Brazil."
- Despite the nasty start to the 2019 fire season, year-end tallies of fire hot spot detections and burned area did not break all-time records. "The real nightmare scenario would have been deforestation fires at the level we had in 2019 during a drought year," said Alberto Setzer, a senior scientist at Brazil's National Institute for Space Research (INPE). "You would have seen fires spreading into the rainforest and burning unchecked for months."
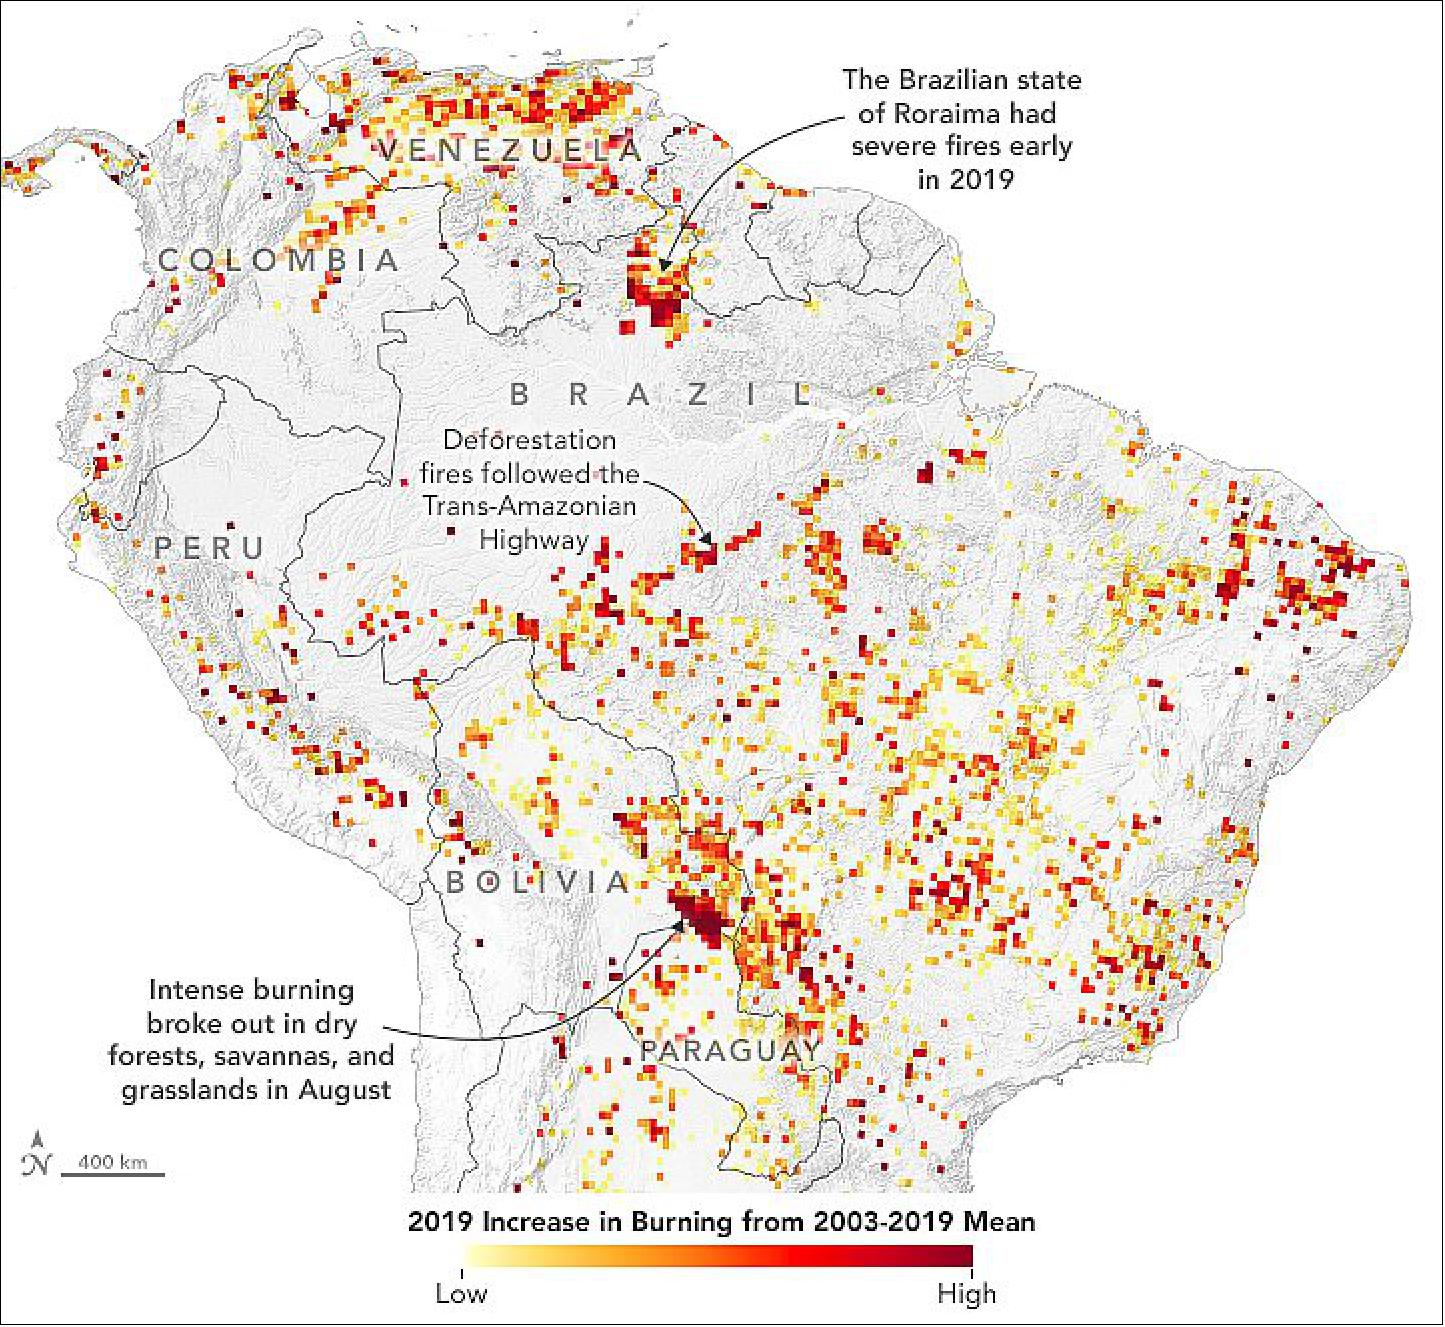
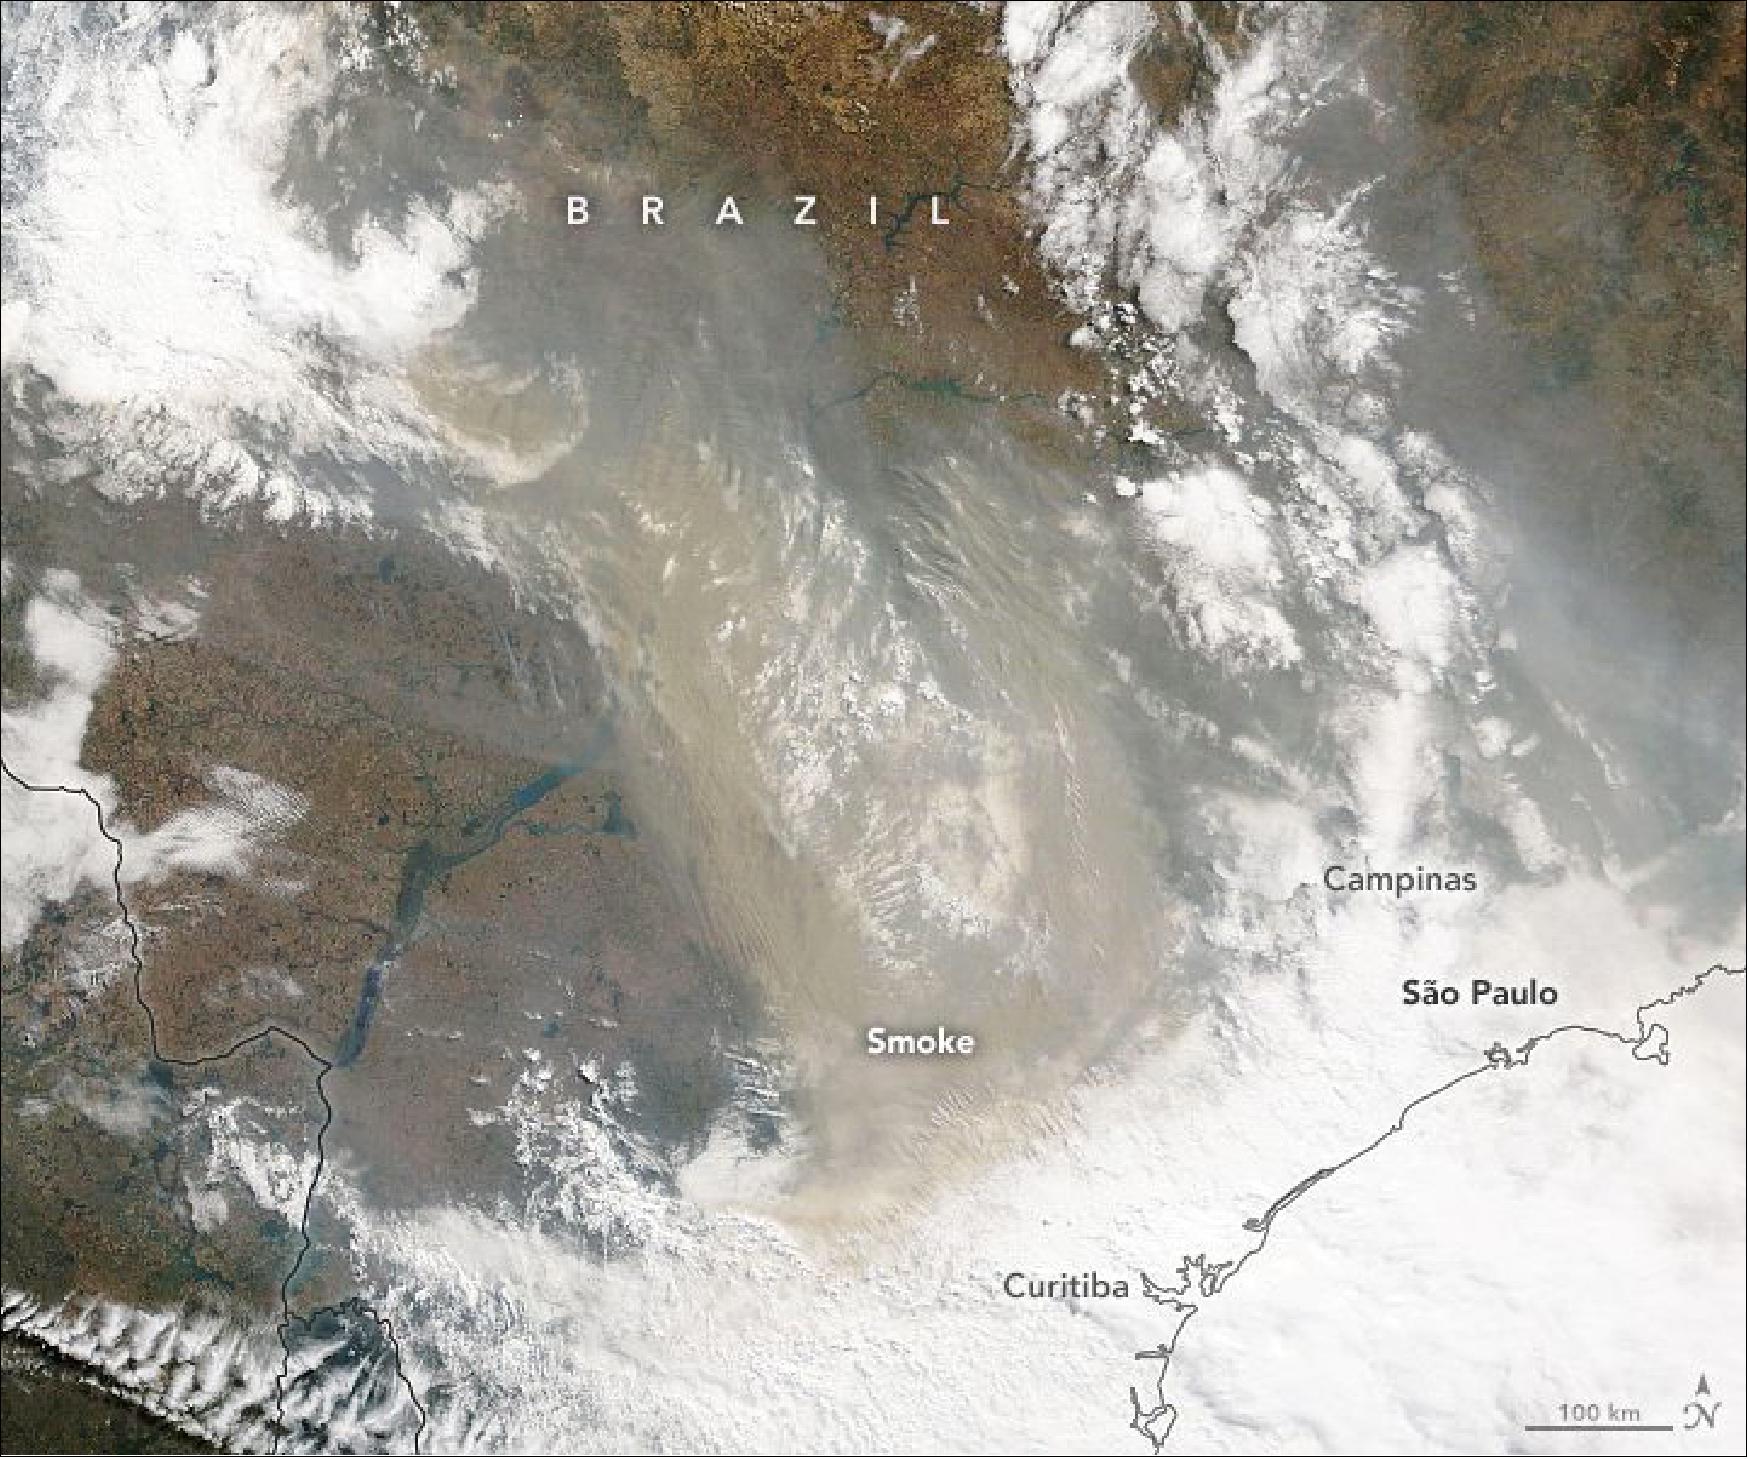
- When fire outbreaks occur, it can be hard to assess their extent or severity from the ground, but satellites can help. The Moderate Resolution Imaging Spectroradiometer (MODIS) and the Visible Infrared Imaging Radiometer Suite (VIIRS) instruments on NASA and NOAA satellites detect hot spots associated with fires on a daily basis.
- "These ‘active fire' data are one of the first things people look at," said Giglio. "But it can be difficult to interpret what all those red spots on a map mean in real time, especially if you're not an expert in remote sensing. It can be tough even if you are an expert in remote sensing."
- One of the key things to remember about active fire maps such as the one maintained by NASA's Fire Information for Resource Management System (FIRMS) is how different the fires can be, cautioned Giglio. In tropical South America, red dots may represent small seasonal agricultural fires burning in pastures or between fields; the same dots can also represent big piles of dried wood being torched after rainforest clearcutting; some may represent a fast-spreading grass fire or brush fire in dried-out wetlands or shrubby savannas; and still others may be knee-high fires creeping through the understory of rainforests.
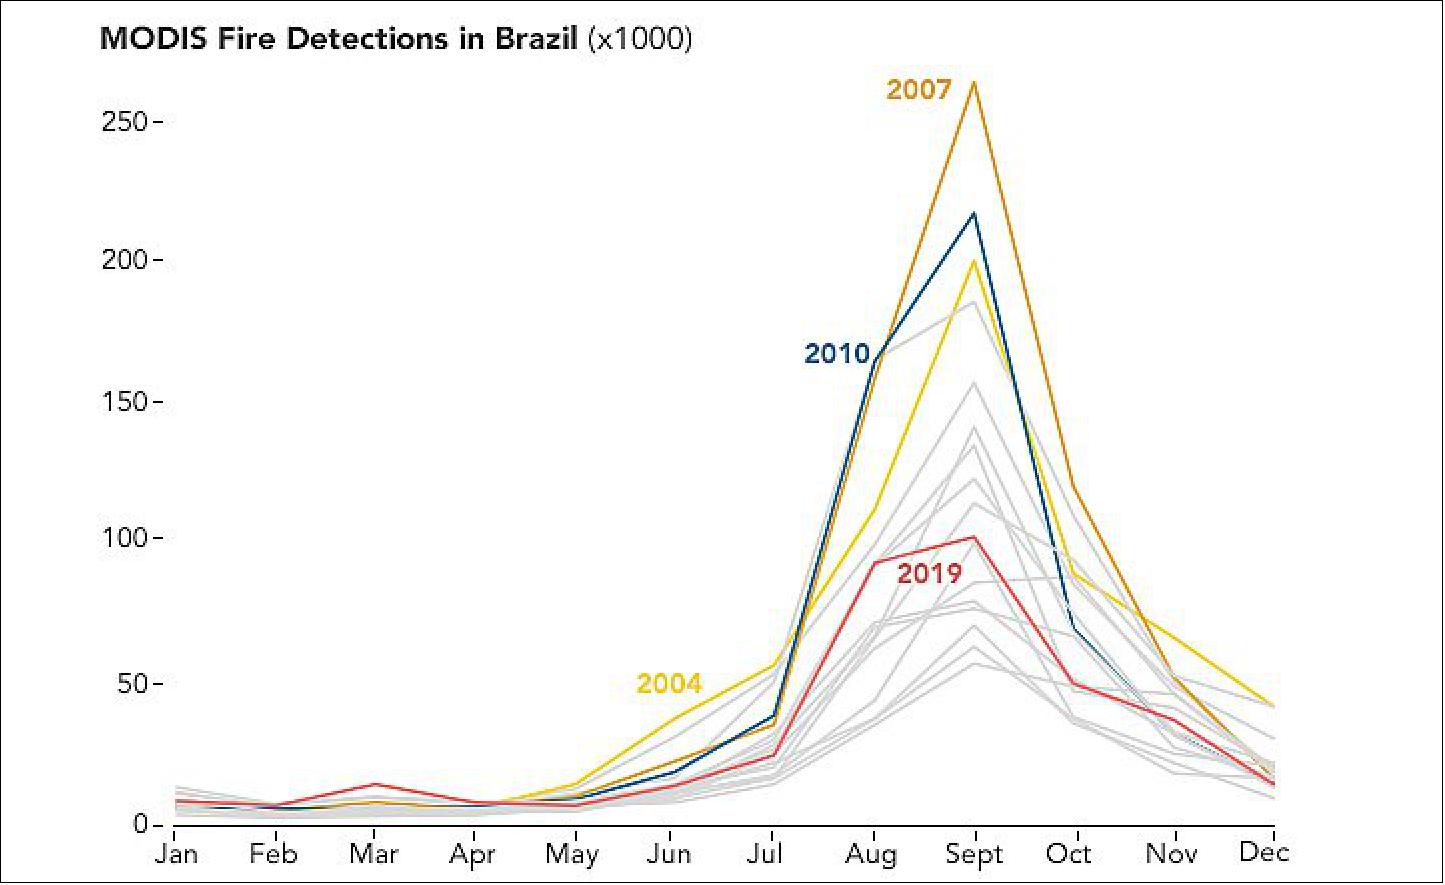
- If you look at the total number of hotspots or square kilometers of burned area that satellites detected across South America, just in Brazil, or in certain Brazilian states in 2019, the raw numbers from FIRMS and INPE's fire monitoring system do not stand out. The line chart above shows the total fire counts as observed in Brazil over nearly two decades of MODIS data.
- "If you are comparing fire detections or burned area from 2019 to the full MODIS record," said Morton, "realize that you are comparing a year without extreme drought or uncontrolled forest fires to years such as 2005, 2007, and 2010 when there were." Also, fire activity was extremely high in the early years (2001-2004) of MODIS observations because it was not until 2004 that Brazil enacted a series of environmental regulations that reduced fires and the rate of deforestation.
- During the past few years, there has been less emphasis on environmental enforcement and fire prevention, so deforestation has been increasing. "One of the ways some people have tried to game the system in recent years is by clearing land in a way that is difficult for satellites to detect—by clearing thin strips along the edge of the rainforest, for instance," said Morton. "In 2019, deforestation fires started earlier in the dry season, and people burned large clearings. It was similar to fire activity in years with limited environmental enforcement and high deforestation, such as 2003-2004."
- There is another reason the 2019 fire counts and burned area did not end up at the top of the long-term fire records. As public outrage peaked in August and September, the Brazilian government deployed tens of thousands of soldiers to the rainforest to fight fires. Then heavy rains dampened fire activity across much of Amazonia. By October, fire counts and burned area tallies had fallen to nearly record-low levels in many areas.
- "If the military hadn't intervened and the rains hadn't picked up, there is no doubt that the totals for the year would have been much higher," said Setzer.
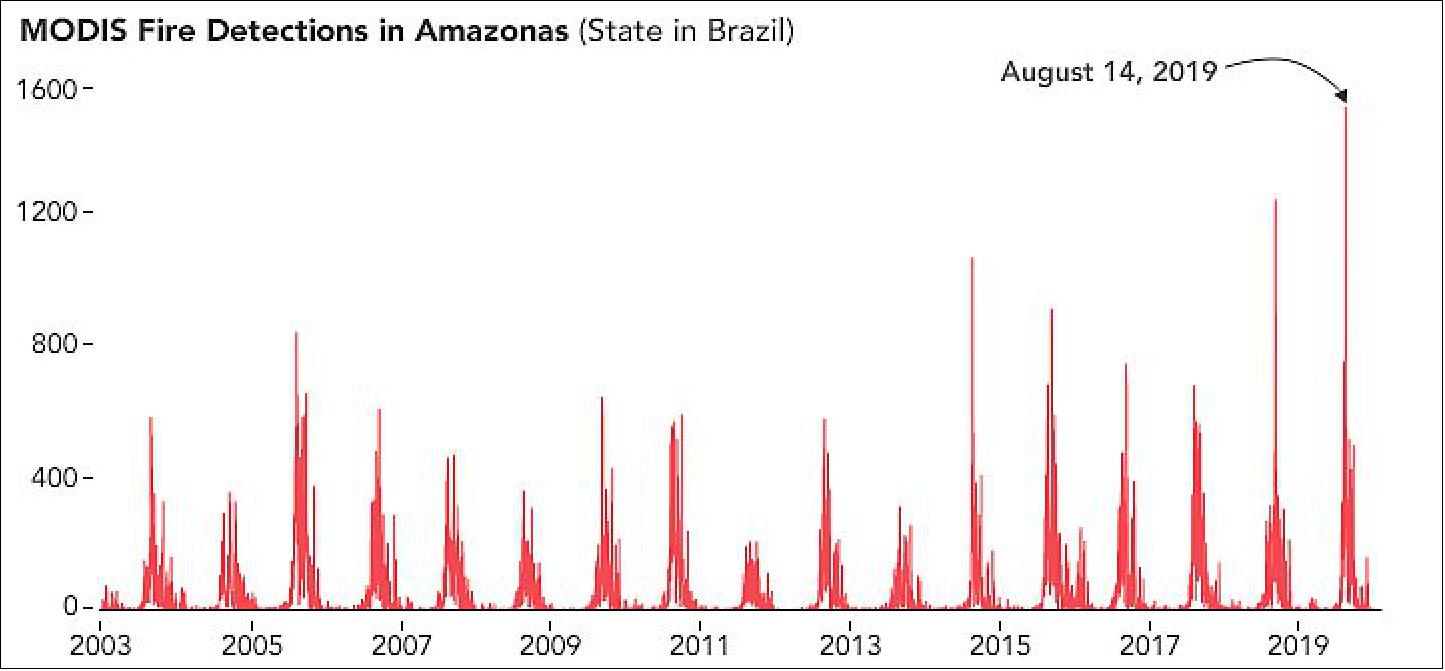
- "Tallying active fire detections for a given area is a reasonable first step if you're trying to quickly assess or characterize a fire season or fire outbreak. But it's only that — a first step," explained Niels Andela, one of Morton's colleagues at NASA. "By looking at other measures like the intensity, location, and duration of fires, it became clear that 2019 was a departure from the norm."
- One important point to understand: not all of the red spots on fire activity maps in 2019 were deforestation fires in the rainforest. "A closer look at land cover maps and high-resolution satellite imagery shows that many of the fire detections in 2019 were located in shrublands, grasslands, and savannas that people wouldn't recognize as rainforest," explained Giglio. According to INPE data, 34 percent of the total fire hot spots detected in Brazil in 2019 were in Amazonia, the rainforest. In contrast, 50 percent were in the Cerrado, a savanna region with spotty tree cover, plenty of pastures and farms, and large numbers of fires every year. Five percent or less burned in the Brazilian Pantanal—a grassy wetland region in southwestern Brazil—or other biomes.
- But in certain areas, the story looks different. Fires were especially common along the Trans-Amazonian highway in Brazil's far western state of Amazonas. According to Giglio, MODIS made 11,516 fire detections in Amazonas in August, the second most the sensor has ever observed for the state in that month. As shown by the burned area map at the top of the page, severe fires also occurred along key highways in Parã, Mato Grosso, and Rondônia where new deforestation of rainforest is common.

- While fire activity declined sharply in September across the Brazilian rainforest, fire detections continued to rise in the Cerrado in September. And the Pantanal in Brazil received little relief from either the military or the weather. Intense fires—many of them uncontrolled pasture fires and some ignited by lightning—raced through dried grasslands there, as well as through nearby dry forests in Paraguay and Bolivia (most notably the Gran Chaco and Chiquitano forests) from August until November. The fires in this region jump out as an area of particularly anomalous burning in the burned area map at the top of the page. But if you look at the number of fire detections for Brazil, Paraguay, or Bolivia or for certain ecoregions, the numbers do not necessarily stand out because the fire detections get divided between three countries and multiple ecoregions.
- "One of the things I was reminded of during the 2019 Amazon fires—and after many big fire events around the world—is that you have to be really aware of how people are defining boundaries when you are interpreting statistics," said Giglio. "If you aren't careful, it is easy for important stories or anomalies to get lost or under- or over-represented."
- For Setzer, 2019 was a potent reminder of the value of remote sensing. "In Brazil, we had people taking extreme views on both sides of this debate," he said. "In August, we had people saying nothing of note was happening. You had others saying the entire rainforest had burned down. What actually happened was somewhere in the middle."
- "We had a lot of scrutiny from politicians, from other scientists, from the media, even from common people who compared the satellite data on the Internet to what they were seeing on the ground. Virtually everybody came to the same conclusion: the satellite data was correct. And based on the satellite monitoring, control measures were taken," said Setzer.
- For Morton and Andela, the 2019 fires underscored how much technology has improved and how much research is left to do. "There is a lot more we can glean from the data that satellites are already collecting—especially a measure of intensity called fire radiative power—and from nighttime observations of fires from VIIRS," said Andela, who is currently working on a study about the 2019 fire season and a project with a NASA/USAID SERVIR Amazonia team to track understory fires with VIIRS. "Since VIIRS is extremely sensitive to fires and now there are two copies of VIIRS in orbit, our ability to detect and track small fires—even those burning underneath the canopy—has increased dramatically."
- "But we also need new platforms for tracking fires because MODIS and VIIRS only take data during just a few short time windows each day," said Morton, who is in the process of developing plans for a mission that would make measurements several times each day. "That leaves us guessing about what fires are doing the rest of the day."
• February 28, 2020: The South Sandwich Islands are a string of small volcanic peaks in a remote part of the South Atlantic Ocean near Antarctica and South America. The three tallest islands—Saunders, Montagu, and Bristol—approach at least 1000 meters (3,300 feet) above sea level. 62)
- "Imagine being on a motor boat looking back at triangular, banded patterns forming behind you as wake waves ripple through the water," said NASA research meteorologist Galina Wind. "This is the same effect, except the mountains are stationary and the surrounding air is rushing by at a good clip. The moving air hits the still mountain in the same way the prow of a moving boat hits still water."
- As air funneled around the islands in February, its temperature and humidity was just right for the crests of the lee waves to rise and cool the air and form clouds. "At the wave crest, you get clouds. At the wave dip, no clouds," said Wind. "Who knew mountains in the middle of the ocean and motor boats on a lake had so much in common?"
- Wave clouds would have formed on the leeward side all of the islands in the image, even though the patterns were not easily visible behind all of them. "For the three northern islands, the wakes are there, but there is another cloud layer on top, partially ruining the view," said Wind. "Clouds have a habit of being multi-layered."
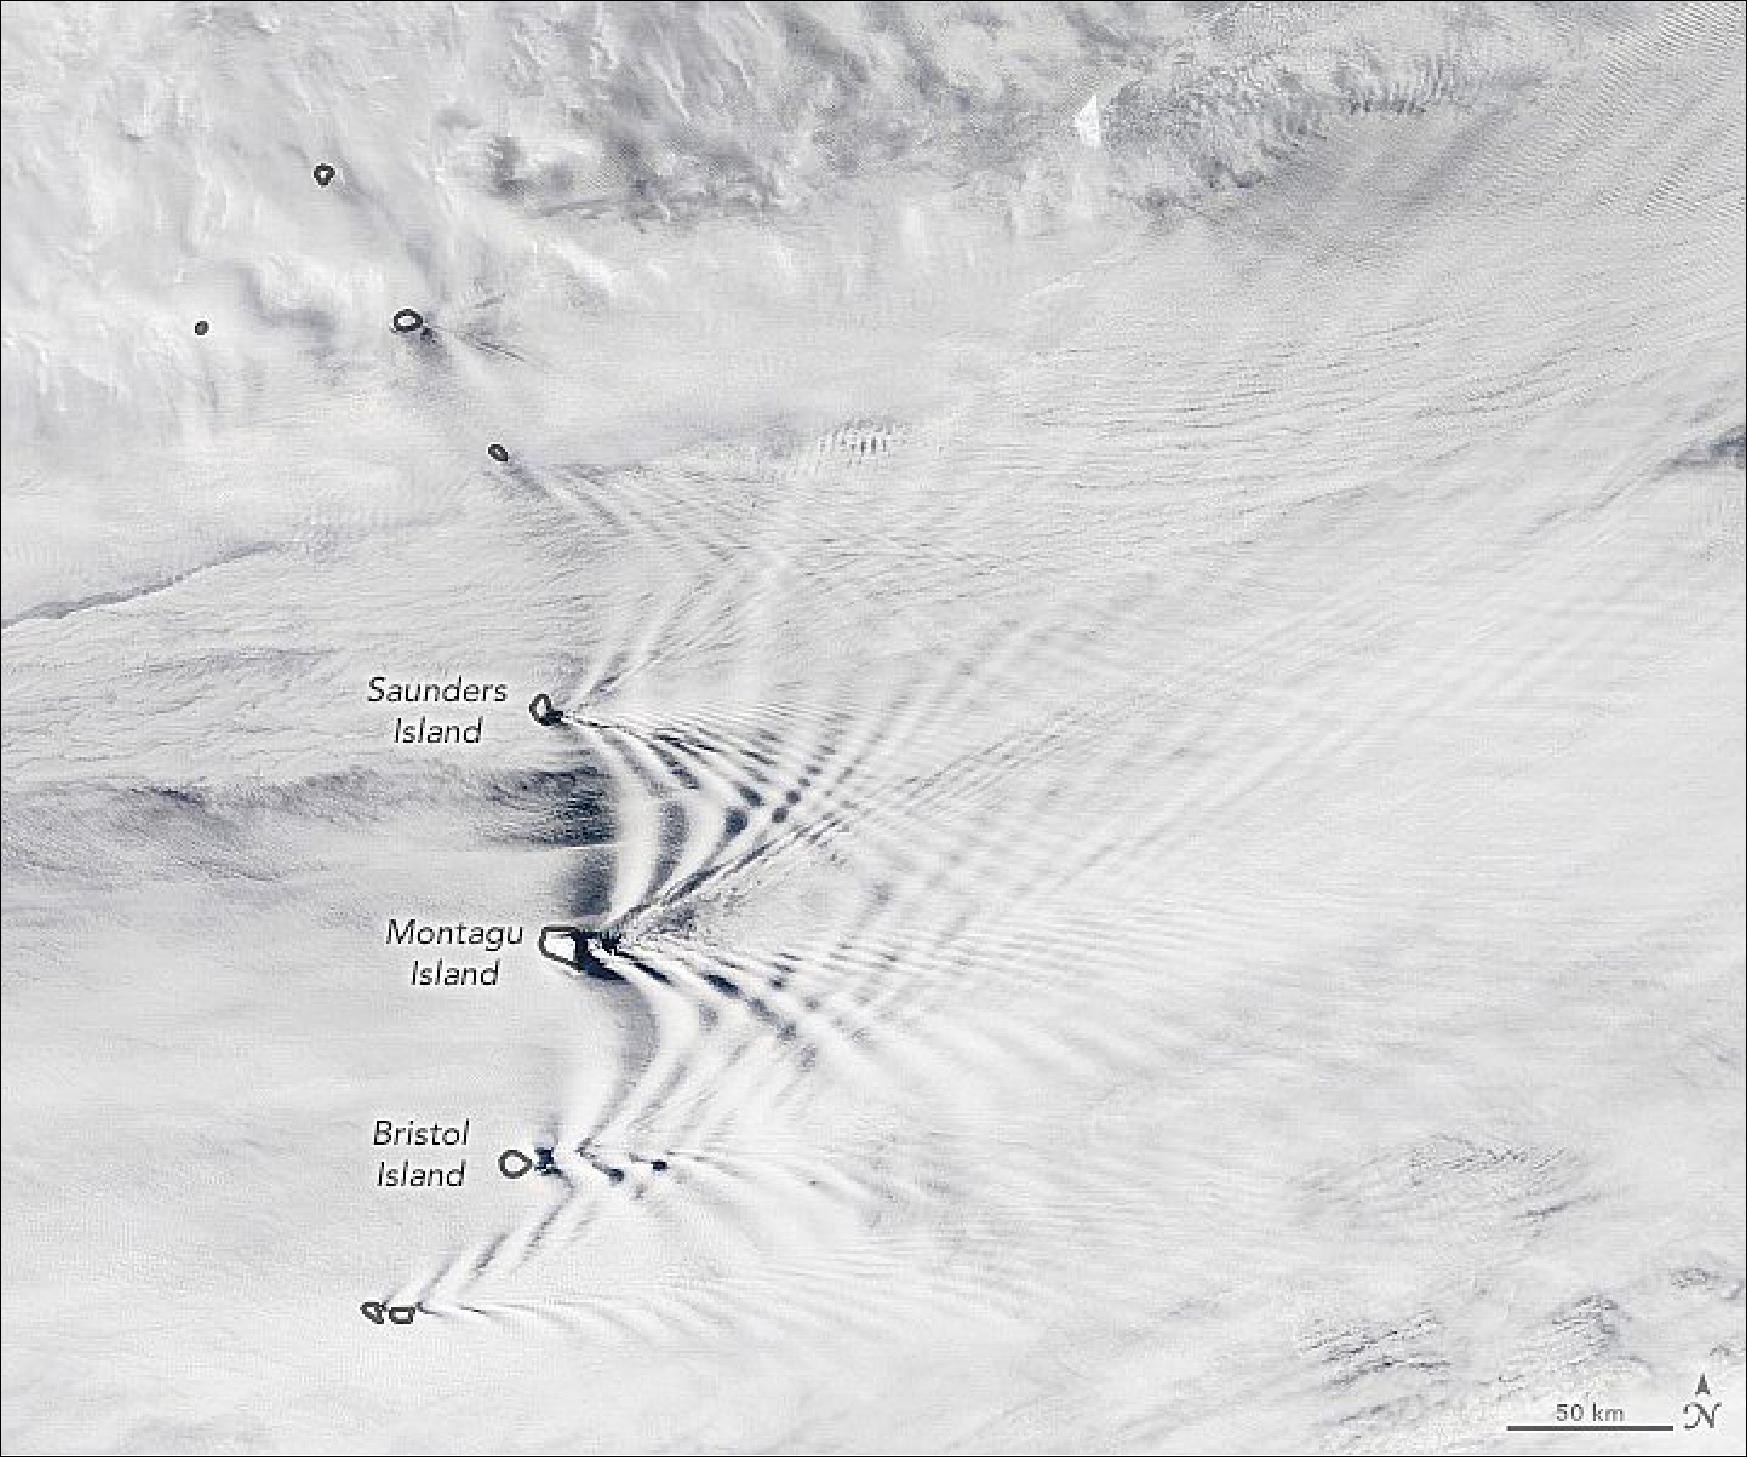
• February 25, 2020: In late February 2020, strong Saharan winds picked up dust from Africa and carried it over the Canary Islands, severely reducing visibility and disrupting travel by land and air. Some public officials described it as the worst sandstorm in decades. 63)
- Such dust events, known to islanders as "La Calima," typically last several days. They are provoked by hot, dry southeasterly or easterly winds blowing out from Morocco and Western Sahara, and they are sometimes associated with the Saharan air layer. Calima storms turn the skies orange or red over the island chain.
- Due to strong winds—with gusts up to 120 kilometers (75 miles) per hour—and poor visibility, all airports across the Canary Islands were closed on February 22 and most stayed closed until February 24. Close to 800 flights were cancelled or re-routed. Some roads were also shut down due to limited visibility.
- Schools and universities were closed on February 24, and people were advised to keep their windows shut and to stay indoors due to poor air quality. Some Carnival events were postponed or curtailed due to the dusty conditions. Strong winds also whipped the flames from several wildfires on Tenerife and Gran Canaria, forcing the evacuation of 2,000 people.
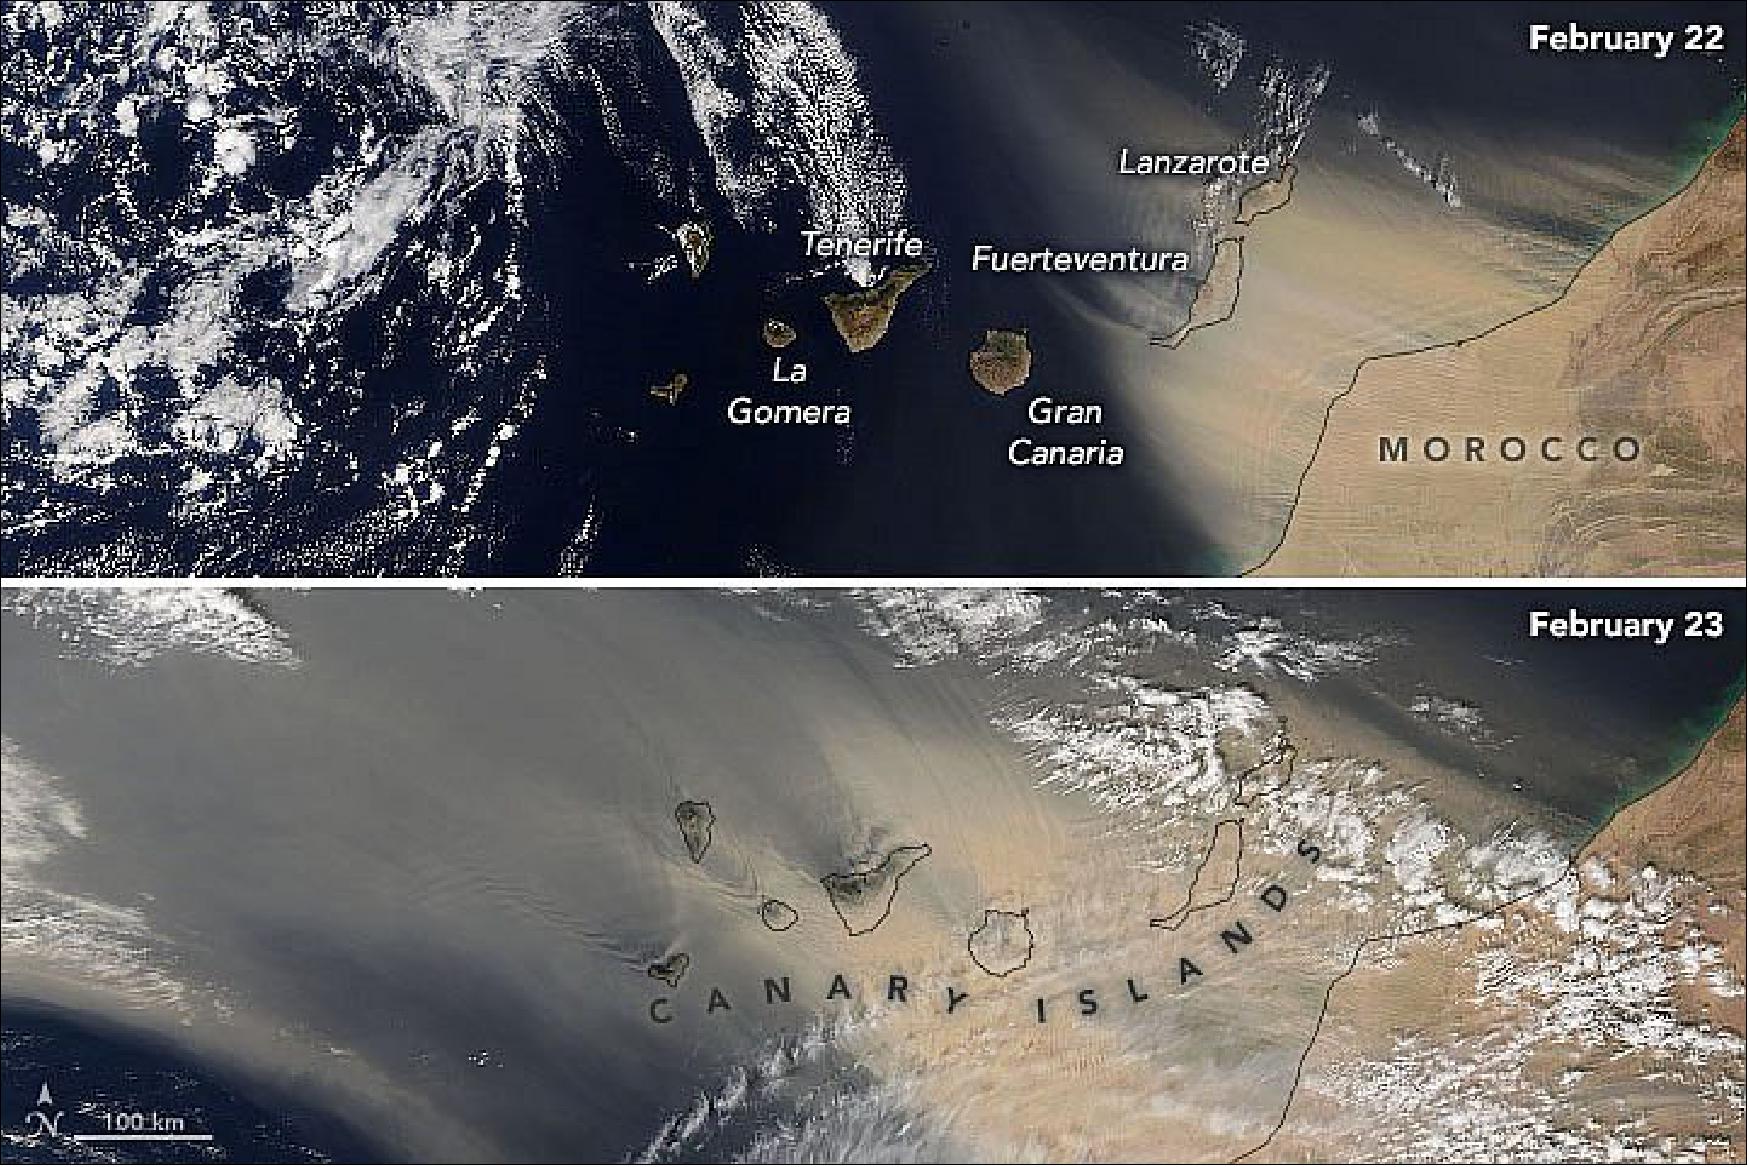
• February 5, 2020: Persistent heavy rains across the Mississippi River watershed swelled the river to its banks, occasionally causing water to spill onto floodplains in late January 2020. By early February, the river was near or above flood stage in parts of Arkansas, Tennessee, Mississippi, and Louisiana, though high water has already crested in most places. 64)
- As of February 4, the NOAA Advanced Hydrological Prediction Service reported 3 river gauges with moderate flooding, 12 with minor flooding, and 17 near flood stage along the Lower Mississippi. The river crested in Natchez, Mississippi, on January 30, and approached major flood stage near Baton Rouge, Louisiana, on February 1. On the morning of February 4, the National Weather Service (NWS) was still issuing flood warnings for the river near Baton Rouge, Donaldsonville, and Red River Landing.
- NWS scientists noted that soils were nearly saturated across large sections of the Upper Mississippi watershed, leaving little capacity to soak up new rainfall. Much of the rainfall this winter has ended up flowing down the river. The Lower Mississippi usually sees its highest waters in April.
- In 2019, the Mississippi River was at or above flood stage for most of January through early August. Much of the region is still trying to rebuild and repair infrastructure as the 2020 spring flood season looms.
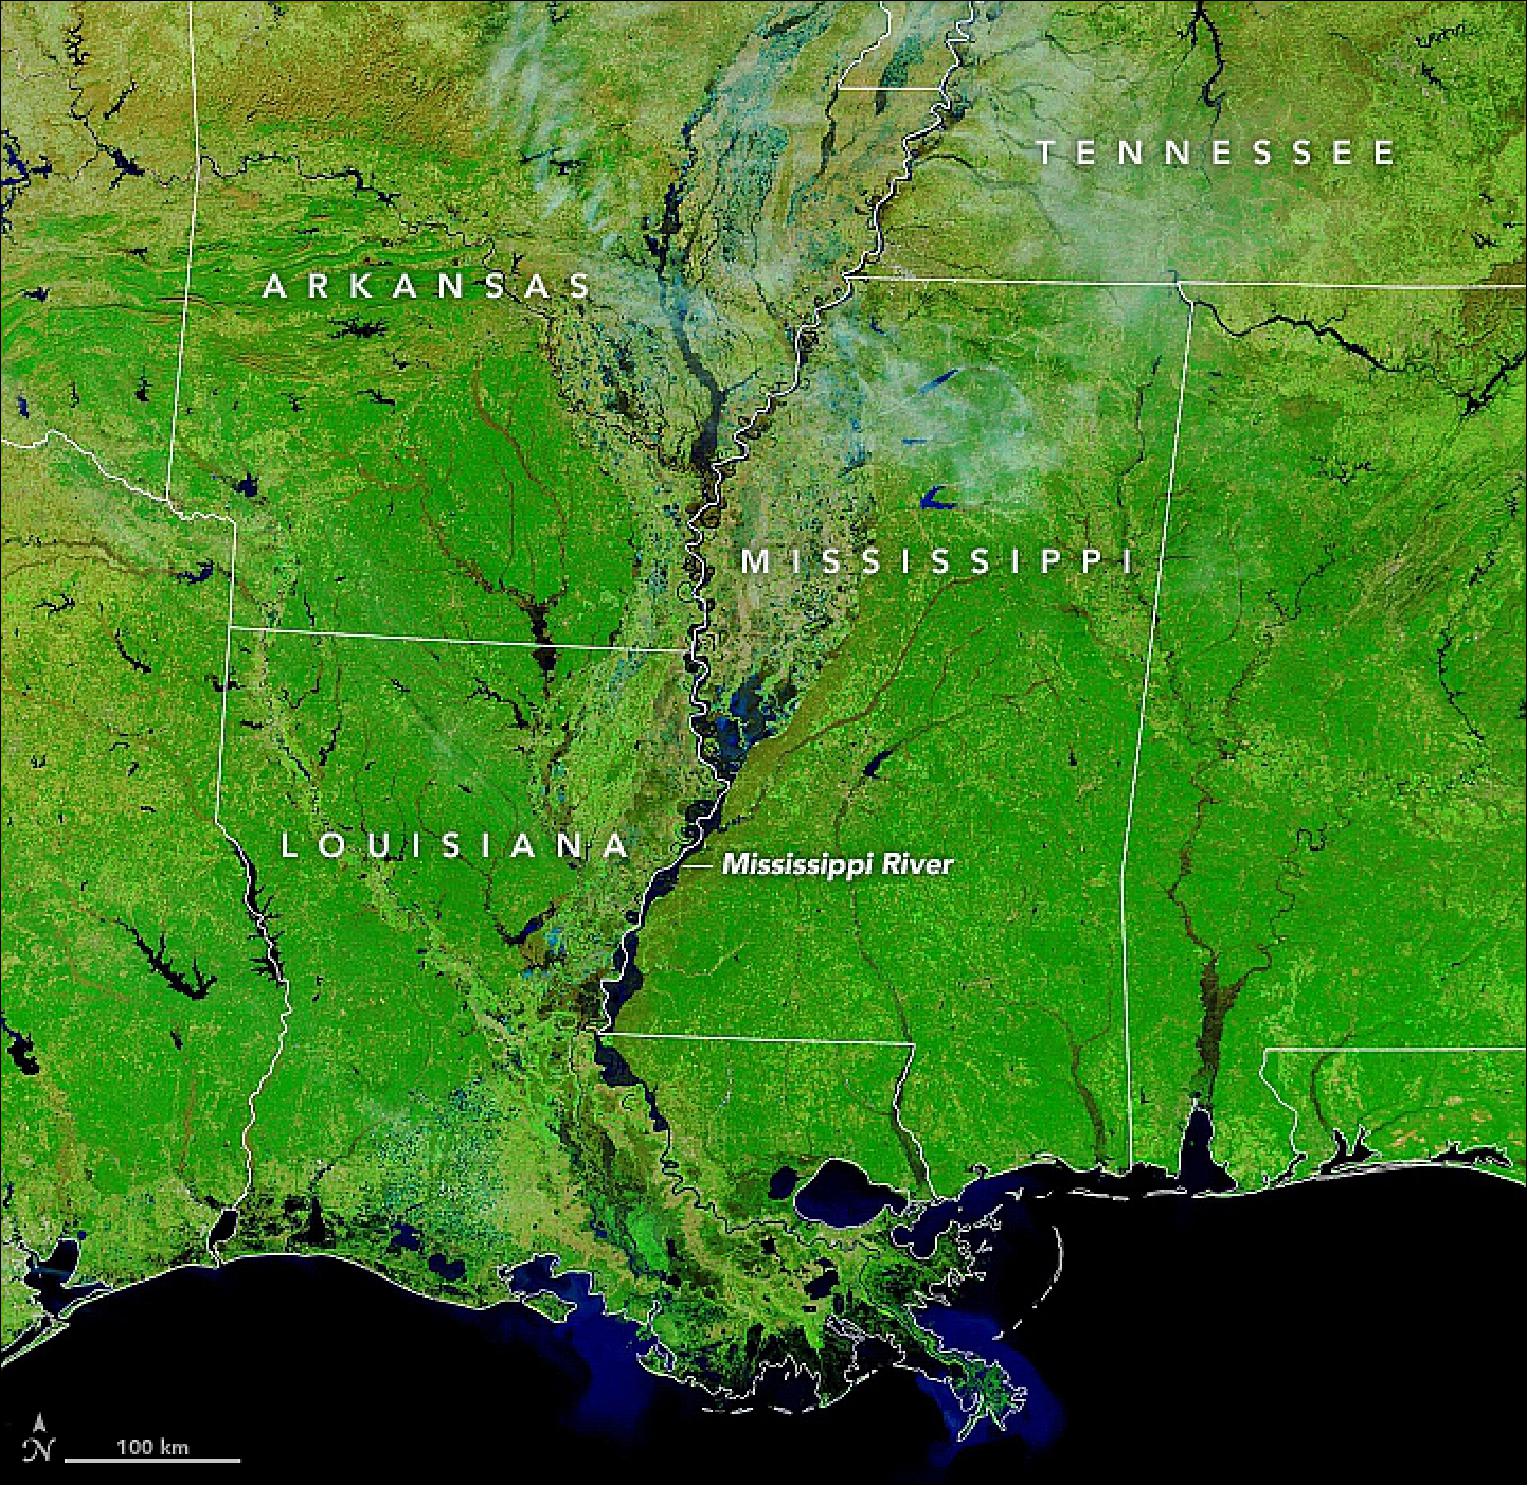
1) "Reindeer as Ecosystem Engineers?," NASA Earth Observatory, Image of the Day for23 December 2021, URL: https://earthobservatory.nasa.gov/images/149246/reindeer-as-ecosystem-engineers
2) "Turkey's Cotton Castle," NASA Earth Observatory, Image of the Day for 24 November 2021, URL: https://earthobservatory.nasa.gov/images/149127/turkeys-cotton-castle
3) "Sediment Swirls Off the Yucatán," NASA Earth Observatory, Image of the Day for 22 November 2021, URL: https://earthobservatory.nasa.gov/images/149114/sediment-swirls-off-the-yucatan
4) "Dust Blankets Tashkent," NASA Earth Observatory, Image of the Day for 12 November 2021, URL: https://earthobservatory.nasa.gov/images/149067/dust-blankets-tashkent
5) "Falling For Corn," NASA Earth Observatory, Image of the Day for 4 November 2021, URL: https://earthobservatory.nasa.gov/images/149035/falling-for-corn
6) "Terra Orbit Drift Visualization," USGS News, 3 November 2021, URL: https://lpdaac.usgs.gov/news/terra-orbit-drift-visualization/
7) "Terra Orbit Drift," NASA, 24 September 2021, URL: https://svs.gsfc.nasa.gov/4938
8) "Thailand Swamped by Monsoon Flooding," NASA Earth Observatory, Image of the Day for 23 October 2021, URL: https://earthobservatory.nasa.gov/images/148983/thailand-swamped-by-monsoon-flooding
9) "Ash and Cloud Rings Over La Palma," NASA Earth Observatory, Image of the Day for 6 October 2021, URL: https://earthobservatory.nasa.gov/images/148924/ash-and-cloud-rings-over-la-palma
10) "In a Warming World, Storms May Be Fewer but Stronger," NASA Earth Observatory, Image of the Day for 10 September 2021, URL: https://earthobservatory.nasa.gov/images/148814/rapid-intensification-for-typhoon-chanthu
11) "NASA's MISR Instrument Sees California Wildfire Smoke Plumes From Space," NASA/JPL, 24 August 2021, URL: https://www.jpl.nasa.gov/news/nasas-misr-instrument-sees-california-wildfire-smoke-plumes-from-space
12) "Drought in Madagascar," NASA Earth Observatory, Image of the Day for 2 August 2021, URL: https://earthobservatory.nasa.gov/images/148636/drought-in-madagascar
13) "Sierra Snowbank Short on Funds," NASA Earth Observatory, Image of the Day for 15 July 2021, URL: https://earthobservatory.nasa.gov/images/148565/sierra-snowbank-short-on-funds
14) "Venezuela's Flat-Topped Mountains," NASA Earth Observatory, Image of the Day for 13 July 2021, URL: https://earthobservatory.nasa.gov/images/148520/venezuelas-flat-topped-mountains
15) "Smoky Summer in the Pacific Northwest," NASA Earth Observatory, Image of the Day for 10 July 2021, URL: https://earthobservatory.nasa.gov/images/148555/smoky-summer-in-the-pacific-northwest
16) "Mapping the Spread of Lyme Disease," NASA Earth Observatory, Image of the Day for 25 June 2021, URL: https://earthobservatory.nasa.gov/images/148482/mapping-the-spread-of-lyme-disease
17) Serge Olivier Kotchi, Catherine Bouchard, Stéphanie Brazeau, and Nicholas H. Ogden, "Earth Observation-Informed Risk Maps of the Lyme Disease Vector Ixodes scapularis in Central and Eastern Canada," Remote Sensing, Vol. 13, Published: 2 February 2021, https://doi.org/10.3390/rs13030524
18) "Russia's Crater of Diamonds," NASA Earth Observatory, Image of the Day for 7 June 2021, " URL: https://earthobservatory.nasa.gov/images/148403/russias-crater-of-diamonds
19) "The Blooming Mid-Atlantic," NASA Earth Observatory, Image of the Day for 22 May 2021, URL: https://earthobservatory.nasa.gov/images/148333/the-blooming-mid-atlantic
20) "Kutch's Coral Reefs," NASA Earth Observatory, Image of the Day for 8 May 2021, URL: https://earthobservatory.nasa.gov/images/148286/kutchs-coral-reefs
21) Esprit Smith, "NASA Satellites Detect Signs of Volcanic Unrest Years Before Eruptions," NASA/JPL News Release 2021-081, 13 April 2021, URL: https://www.jpl.nasa.gov/news/nasa-satellites-detect-signs-of-volcanic-unrest-years-before-eruptions
22) Társilo Girona, Vincent Realmuto & Paul Lundgren, "Large-scale thermal unrest of volcanoes for years prior to eruption," Nature Geoscience, Volume 14, pp: 238-241, Published: 11 March 2021, https://doi.org/10.1038/s41561-021-00705-4
23) "Zambia's Kafue Flats," NASA Earth Observatory, Image of the Day for 8 April 2021, URL: https://earthobservatory.nasa.gov/images/148154/zambias-kafue-flats
24) Fritz Kleinschroth, R. Scott Winton, Elisa Calamita, Fabian Niggemann, Martina Botter, Bernhard Wehrli & Jaboury Ghazoul, "Living with floating vegetation invasions," Ambio, Volume 50, pp. 125-137, Published: 28 July 2020, https://doi.org/10.1007/s13280-020-01360-6, URL: https://link.springer.com/content/pdf/10.1007/s13280-020-01360-6.pdf
25) R. Scott Winton, Fritz Kleinschroth, Elisa Calamita, Martina Botter, Cristian R. Teodoru, Imasiku Nyambe & Bernhard Wehrli, "Potential of aquatic weeds to improve water quality in natural waterways of the Zambezi catchment," Scientific Reports, Volume 10, Article number: 15467, Published: 22 September 2020, https://doi.org/10.1038/s41598-020-72499-1
26) "Ten Years After the Tsunami," NASA Earth Observatory, Image of the Day for 12 March 2021, URL: https://earthobservatory.nasa.gov/images/148036/ten-years-after-the-tsunami
27) "Greening Landscape Changes Air Flow," NASA Earth Observatory, Image of the Day for 10 March 2021, URL: https://earthobservatory.nasa.gov/images/148026/greening-landscape-changes-air-flow
28) "Abundant Rain Turns Namibia Green," NASA Earth Observatory, Image of the Day for 16 February 2021, URL: https://earthobservatory.nasa.gov/images/147924/abundant-rain-turns-namibia-green
29) "Falling for Fallstreaks," NASA Earth Observatory, Image of the Day for 8 February 2021, URL: https://earthobservatory.nasa.gov/images/147886/falling-for-fallstreaks?src=eoa-iotd
30) "Snowmelt Timing Near the Great Salt Lake," NASA Earth Observatory, Image of the Day for 4 February 2021, URL: https://earthobservatory.nasa.gov/images/147877/snowmelt-timing-near-the-great-salt-lake
31) "Cloudy Ridges in Yunnan," NASA Earth Observatory, Image of the Day for 27 January 2021, URL: https://earthobservatory.nasa.gov/images/147836/cloudy-ridges-in-yunnan
32) "NASA Data Aid Food Security Assessments in Kenya," NASA Earth Observatory, Image of the Day for 25 January 2021, URL: https://earthobservatory.nasa.gov/images/147831/nasa-data-aid-food-security-assessments-in-kenya
33) "Phytoplankton Factory in the Argentine Sea," NASA Earth Observatory, Image of the Day for 8 January 2021, URL: https://earthobservatory.nasa.gov/images/147753/phytoplankton-factory-in-the-argentine-sea?src=eoa-iotd
34) "The Stability of von Kármán's Vortices," NASA Earth Observatory, Image of the Day for 5 January 2021, URL: https://earthobservatory.nasa.gov/images/147743/the-stability-of-von-karmans-vortices
35) "Aral Sea in Winter," NASA Earth Observatory, Image of the Day for 3 January 2021, URL: https://earthobservatory.nasa.gov/images/147735/aral-sea-in-winter
36) "An Inland Delta Flooded," NASA Earth Observatory, Image of the Day for 21 December 2020, URL: https://earthobservatory.nasa.gov/images/147692/an-inland-delta-flooded
37) "Foggy Mountain Breakdown," NASA Earth Observatory," Image of the Day for 12 December 2020, URL: https://earthobservatory.nasa.gov/images/147651/foggy-mountain-breakdown
38) "Early Melting Along the Antarctic Peninsula," NASA Earth Observatory, Image of the Day for 3 December 2020, URL: https://earthobservatory.nasa.gov/images/147608/early-melting-along-the-antarctic-peninsula
39) "Iceberg A-68A Nears South Georgia," NASA Earth Observatory, Image of the Day for 16 November 2020, URL: https://earthobservatory.nasa.gov/images/147535/iceberg-a-68a-nears-south-georgia
40) "Hurricane Zeta Arrives on the Gulf Coast," NASA Earth Observatory, Image of the Day for 29 October 2020, URL: https://earthobservatory.nasa.gov/images/147462/hurricane-zeta-arrives-on-the-gulf-coast
41) "Snowy and Icy Peaks with Very Different Origins," NASA Earth Observatory, Image of the Day for 25 October 2020, URL: https://earthobservatory.nasa.gov/images/147424/snowy-and-icy-peaks-with-very-different-origins
42) "Mining for Iron at Mount Whaleback," NASA Earth Observatory, Image of the Day for 17 October 2020, URL: https://earthobservatory.nasa.gov/images/147416/mining-for-iron-at-mount-whaleback
43) "The Undulations of Wave Clouds," NASA Earth Observatory, Image of the Day for 12 October 2020, URL: https://earthobservatory.nasa.gov/images/147380/the-undulations-of-wave-clouds
44) "Mud from the Andes Carried by the Amazon," NASA Earth Observatory, Image of the Day for 2 October 2020, URL: https://earthobservatory.nasa.gov/images/147327/mud-from-the-andes-carried-by-the-amazon
45) "Persistent Phytoplankton," NASA Earth Observatory, Image of the Day for 22 September 2020, URL: https://earthobservatory.nasa.gov/images/147299/persistent-phytoplankton
46) "Cycles of Wet and Dry in Etosha Pan," NASA Earth Observatory, Image of the Day for 14 September 2020, URL: https://earthobservatory.nasa.gov/images/147221/cycles-of-wet-and-dry-in-etosha-pan
47) "A Wall of Smoke on the U.S. West Coast," NASA Earth Observatory, 9 September 2020, URL: https://earthobservatory.nasa.gov/images/147261/a-wall-of-smoke-on-the-us-west-coast
48) "A Dangerous Storm Nears the Gulf Coast," NASA Earth Observatory, Image of the Day for 27 August 2020, URL: https://earthobservatory.nasa.gov/images/147169/a-dangerous-storm-nears-the-gulf-coast
49) "Poyang Lake Extremes," NASA Earth Observatory, Image of the Day for 17 July 2020, URL: https://earthobservatory.nasa.gov/images/146987/poyang-lake-extremes
50) "Canary Curls," NASA Earth Observatory, 11 July 2020, URL: https://earthobservatory.nasa.gov/images/146971/canary-curls
51) "Shifting Seasons on the Steppe," NASA Earth Observatory, Image of the Day for 5 July 2020, URL: https://earthobservatory.nasa.gov/images/146921/shifting-seasons-on-the-steppe?utm_source=carousel&utm_campaign=home
52) "Volcanic Emissions Can Change Clouds," NASA Earth Observatory, Image of the Day for 23 June 2020, URL: https://earthobservatory.nasa.gov/images/146856/volcanic-emissions-can-change-clouds
53) "Norwegian Fjord Turns Turquoise," NASA Earth Observatory, Image of the Day for 12 June 2020, URL: https://earthobservatory.nasa.gov/images/146843/norwegian-fjord-turns-turquoise
54) "Breakup Along the Mackenzie River," NASA Earth Observatory, Image of the Day for 8 June 2020, URL: https://earthobservatory.nasa.gov/images/146813/breakup-along-the-mackenzie-river
55) "Ice Arch Persists Despite Warm Arctic," NASA Earth Observatory, Image of the Day for 3 June 2020, URL: https://earthobservatory.nasa.gov/images/146791/ice-arch-persists-despite-warm-arctic
56) "Deforestation in Argentina's Gran Chaco," NASA Earth Observatory, Image of the Day for 20 May 2020, URL: https://earthobservatory.nasa.gov/images/146731/deforestation-in-argentinas-gran-chaco
57) "Airborne Particle Levels Plummet in Northern India," NASA Earth Observatory, Image of the Day for 21 April 2020, URL: https://earthobservatory.nasa.gov/images/146596/airborne-particle-levels-plummet-in-northern-india?utm_source=carousel&utm_campaign=home
58) "A-68A Holding it Together," NASA Earth Observatory, 20 April 2020, URL: https://earthobservatory.nasa.gov/images/146603/a-68a-holding-it-together
59) "Could Satellites Help Head Off a Locust Invasion?," NASA Earth Observatory, Image of the Day for 30 March 2020, URL: https://earthobservatory.nasa.gov/images/146495/could-satellites-help-head-off-a-locust-invasion
60) "Snow-Parched Scandinavia," NASA Earth Observatory, Image of the Day for 24 March 2020, URL: https://earthobservatory.nasa.gov/images/146475/snow-parched-scandinavia?utm=carousel
61) "Reflecting on a Tumultuous Amazon Fire Season," NASA Earth Observatory, Image of the Day for4 March 2020, URL: https://earthobservatory.nasa.gov/images/146355/reflecting-on-a-tumultuous-amazon-fire-season?utm=carousel
62) "Sandwiched Wave Clouds," NASA Earth Observatory, Image of the Day for 28 February 2020, URL: https://earthobservatory.nasa.gov/images/146366/sandwiched-wave-clouds
63) "Dust Blankets the Canary Islands," NASA Earth Observatory, Image of the Day for 25 February 2020, URL: https://earthobservatory.nasa.gov/images/146337/dust-blankets-the-canary-islands
64) "Winter Flooding on the Mississippi," NASA Earth Observatory, Image of the Day for 5 February 2020, URL: https://earthobservatory.nasa.gov/images/146251/winter-flooding-on-the-mississippi
The information compiled and edited in this article was provided by Herbert J. Kramer from his documentation of: "Observation of the Earth and Its Environment: Survey of Missions and Sensors" (Springer Verlag) as well as many other sources after the publication of the 4th edition in 2002. - Comments and corrections to this article are always welcome for further updates (herb.kramer@gmx.net).
References Back to top