HyTES (Hyperspectral Thermal Emission Spectrometer)
Airborne Sensors
HyTES (Hyperspectral Thermal Emission Spectrometer)
HyTES Instrument Flight Campaigns References
HyTES is an airborne pushbroom imaging spectrometer developed at NASA/JPL (Jet Propulsion Laboratory) and funded by the NASA Instrument Incubator Program (IIP). The HyTES instrument will be used in support of the HyspIRI (Hyperspectral Infrared Imager) mission which was recommended by the NRC (National Research Council) in their Decadal Survey in 2007. 1)
The LWIR (Long Wave Infrared) is typically expressed as the wavelength range between 7 and 14 µm. The airborne instrument under development will operate from 7.5 µm to 12 µm. Spectral information from this wavelength range is extremely valuable for Earth Science research. The LWIR component of the HyspIRI mission will address science questions in five main science themes:
• Volcanos: What are the changes in the behavior of active volcanoes? Can we quantify the trace gases (CO2) released into the atmosphere by volcanoes and estimate its impact on Earth's climate? How can we help predict and mitigate volcanic hazards?
• Wildfires: What is the impact of global biomass burning on the terrestrial biosphere and atmosphere, and how is this impact changing over time? A LWIR sensor will allow us to measure temperature, emissivity, radiative flux, burn products, hot spots, etc.
• Water use and availability: As global freshwater supplies become increasingly limited, how can we better characterize trends in local and regional water use and moisture availability to help conserve this critical resource?
• Urbanization: How does urbanization affect the local, regional and global environment? Can we characterize this effect to help mitigate its impact on human health and welfare?
• Land surface composition and change: What is the composition and temperature of the exposed surface of the Earth? How do these factors change over time and affect land use and habitability?
Thermal spectroscopy acquires both the emission from the target source object as well as reflected and/or transmitted emission from surrounding and/or foreground objects.

Objectives 2)
• Develop a calibrated, airborne imaging spectrometer operating between 7.5 and 12 µm with 256 spectral channels
• Develop an initial overall system design
- Optical design
- Thermal/mechanical design
- Data acquisition and recording system
• Evaluate key design elements using the existing JPL QWEST (Quantum Well Earth Science Testbed), in particular 7.5-12 µm QWIP FPA (Focal Plane Array)
• Design and fabricate: Overall system, optics, detectors, grating, mechanical, thermal, data recording and storage
• Assemble, test and calibrate in the laboratory
• Complete aircraft-integration
• Deploy from an airborne platform over test sites in the western USA
• Provide data to the HyspIRI Study Group.
QWEST, the precursor instrumentation of HyTES, is an end-to-end laboratory demonstration of both the thermal Dyson spectrometer as well as of the quantum well infrared focal plane technology. The QWEST testbed is providing enabling technology for the development of a fully operational airborne platform suitable for Earth science studies. It will have sufficient spatial and spectral resolution to allow scientists to acquire the necessary data to aid in the planning of future spaceborne missions. 3) 4) 5) 6)
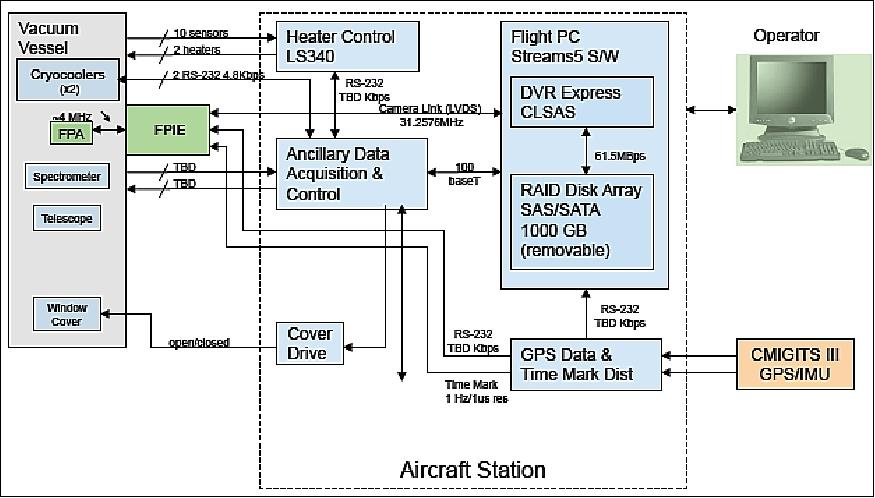
HyTES Instrument
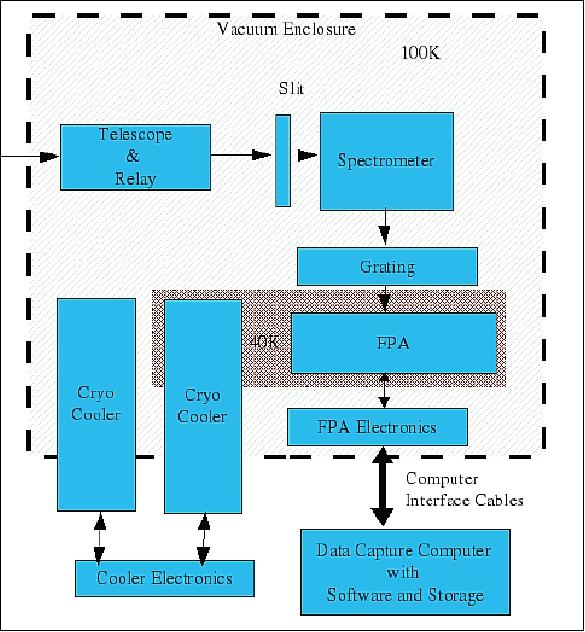
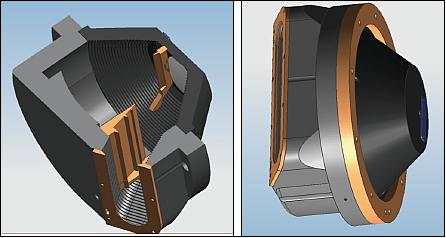
The HyTES airborne instrument is a hyperspectral grating spectrometer in combination with a QWIP (Quantum Well Infrared Photodetector) and grating based spectrometer. The basic specifications of QWEST and HyTES are provided in Table 1 and an illustration is shown in Figure 2. Both systems will use large format detectors and have large spatial swath widths. The current optical design and grating works for the entire 7.5 - 12 µm spectral range but the existing QWIP FPA which is being used for preliminary testing in QWEST is only sensitive from 7.5-9.5 µm.
Instrument parameter | QWEST | HyTES |
No of pixels in cross-track | 320 | 512 (spatial elements in cross-track) |
No of spectral bands (sampling) | 256 | 256 (17.6 nm) |
Spectral range | 8-12 µm | 7.5-12 µm |
Integration time (1 scanline) | 30 ms | 30 ms |
TFOV (Total Field of View) | 40º | 50º |
IFOV (Instantaneous Field of View) | 1.44 mrad | 1.44 mrad |
Calibration (preflight) | Full aperture blackbody | Full aperture blackbody |
QWIP array size | 640 x 512 | 1024 x 512 |
QWIP pitch | 25 µm | 19.5 µm |
QWIP FPA temperature | ≤ 40 K | ≤ 40 K |
Spectrometer (Dyson) temperature | 40 K | 40 K |
Slit width | 50 µm | 39 µm |
Pixel size at 2000 m flight altitude | 4.5 m | 3.64 m |
Pixel size at 20,000 m flight altitude | 45 m | 36.4 m |
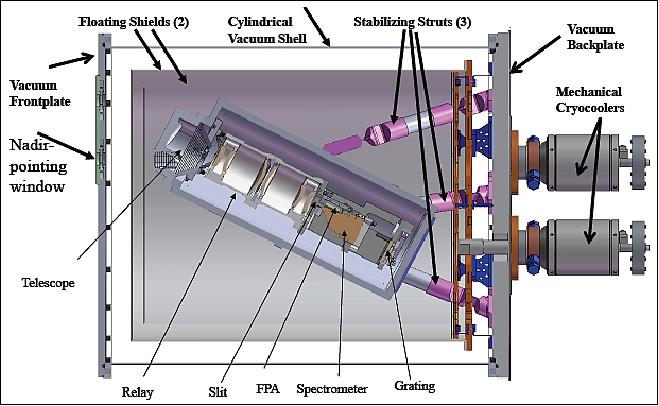
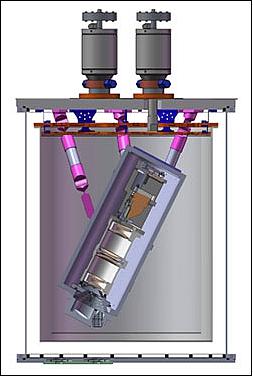
The system uses a mechanically cooled system consisting of a vacuum chamber, cryocoolers, thermal radiation shields, telescope/relay, and a spectrometer.
The HyTES instrument assembly is scheduled for completion in 2011.

Optical Design
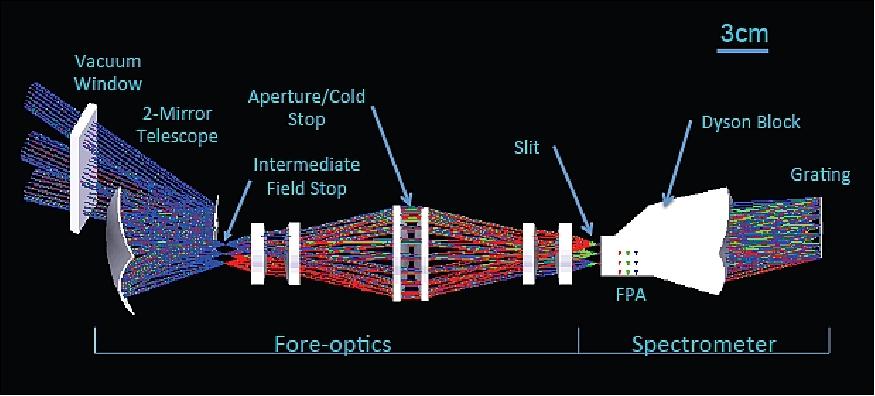
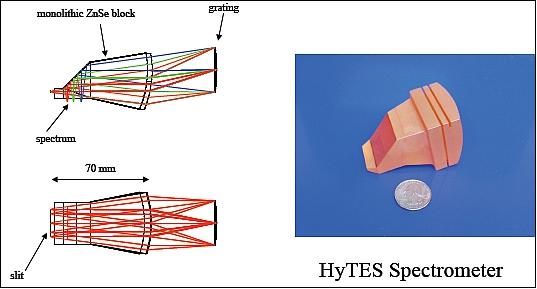
HyTES is a pushbroom imaging spectrometer based on the Dyson optical configuration. The Dyson design allows for a very compact and optically fast system (f/1.6).
A single monolithic block is used in double pass where light from the slit enters at a narrow optical passageway and is transmitted through the rear power surface, diffracts off the grating and re-enters the block to totally internally reflect off the back surface which guides the spectrally dispersed radiation to focus at the QWIP location. This design minimizes the travel and form factor of the system. The actual block fabricated is shown in Figure 6. Broadband area coatings are used on all applicable light transmitting surfaces. The coatings allow 99.5% or better EOTIR (Earth Observing Thermal Infrared) light to transmit.
The block was fabricated from ZnSe, a robust material with a transparent wavelength region from 0.4 ~ 23 µm and an absorption coefficient between 10-3 and 10-4 cm-1. The ZnSe slab is produced by chemical vapor deposition.
The telescope is an all-aluminum, diamond-turned, athermal. “snap-together” design featuring several accessories like: aperture baffle, 2 internal baffles, real slot baffle, and a precision made large shim.
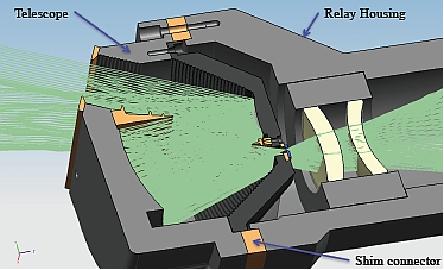
As shown in Figure 9, a single monolithic block is used in double pass where light from the slit enters at a narrow optical passageway and is transmitted through the rear power surface, diffracts off the grating and re-enters the block to totally internally reflect off the back surface which guides the spectrally dispersed radiation to focus at the QWIP location. This design minimizes the travel and form factor of the system.
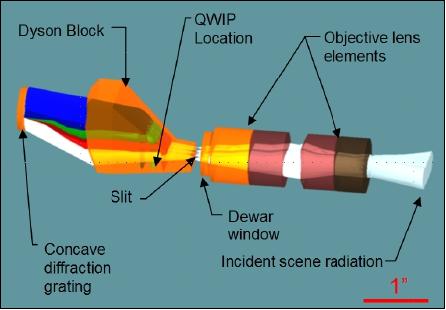
The slit was made using RIE (Reactive Ion Etching) of silicon nitride (Si3N4) films formed by LPCVD (Low Pressure Chemical Vapor Deposition).
QWIP Array
The QWIP technology utilizes the photoexcitation of electrons between the ground state and the first excited state in the conduction band QW (Quantum Well). QWIPs have been successfully integrated into commercial handheld field units for more than a decade. This is the first integration of the QWIP with a spectrometer system for earth science studies requiring accurately calibrated data.
The detector pixel pitch of the FPA is 25 µm and the actual pixel area is 23 x 23 µm. Indium bumps were evaporated on top of the detectors for hybridization with a silicon ROIC (Readout Integrated Circuit). These QWIP FPAs were hybridized (via indium bump-bonding process) to a 640 x 512 pixel CMOS (Complementary Metal-Oxide Semiconductor) ROIC and biased at VB = –1.25 V. At temperatures below 72 K, the SNR (Signal-to-Noise Ratio) of the system is limited by array nonuniformity, readout multiplexer (i.e., ROIC) noise, and photocurrent (photon flux) noise. At temperatures above 72 K, the temporal noise due to the dark current becomes the limitation.
The project is currently running the system at 40 K to obtain a SNR advantage. The QWIP is known for its high spatial uniformity (<0.51%). This is a clear advantage over other detector technologies such as HgCdTe and InSb. A custom made LCC (Leadless Chip Carrier ) and titanium FPA clamp was designed to accommodate the close proximity of the FPA with the ZnSe block.
FPA (Focal Plane Array) fabrication:
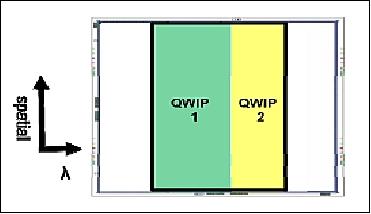
• A cross section of the two-band QWIP (Quantum Well Infrared Photodetector) is used as the detector material is shown in Figure 11.
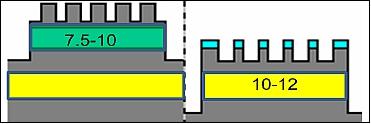
• Roughly half of the array will respond in the 7.5-10 µm range, and the other half will cover the 10-12 µm range.
Diffraction Grating
The diffraction grating design and fabrication is a key enabling technology for these spectrometers. JPL has developed electron-beam lithography techniques that allow fabrication of precisely blazed gratings on curved substrates having several millimeters of height variation. Gratings fabricated in this manner provide high efficiency combined with low scatter. The blazed grating for this LWIR Dyson spectrometer was fabricated in a thin layer of PMMA (Polymethyl Methacrylate) electron-beam resist coated on a diamond-turned concave ZnSe substrate. After exposure and development to the desired blaze angle, the resist was overcoated with gold for maximum infrared reflectance. A photograph of the grating and the simulated efficiency of the fabricated grating are shown in Figure 13, respectively. The design was optimized for maximum efficiency in the -1 order, and the other orders remain relatively weak across the band.
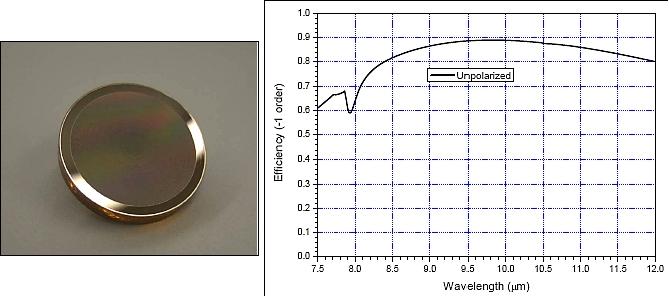
Legend to Figure 13: On the left side is the photograph of the fabricated grating (annular E-beam focus zones are visible due to slight variation in scattering; unexposed rectangular areas near edge are due to the E-beam mount), the right side shows the simulated efficiency (calculated using PCGrate 6.1 software).
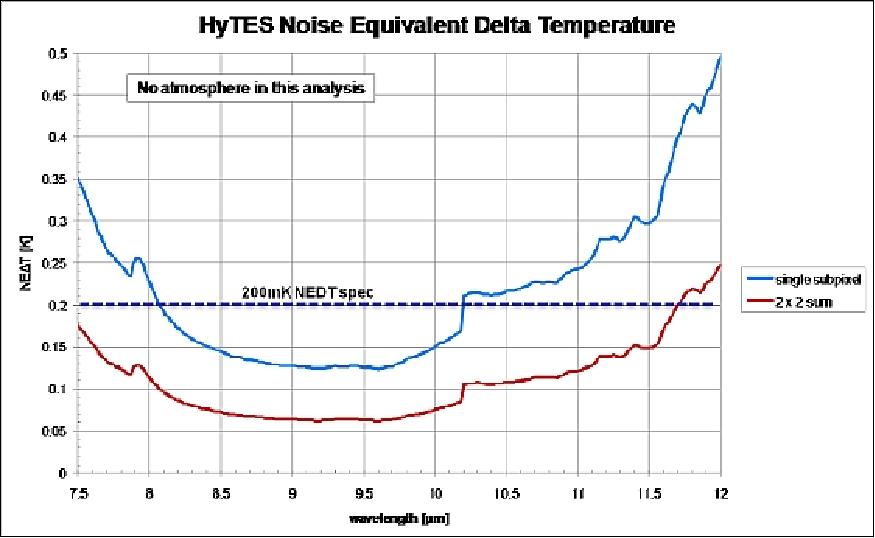
The HyTES predicted NEDT (Noise Equivalent Delta Temperature) is shown in Figure 14. A spectral calibration was performed using narrowband interference filters. This is an easy way to determine the position of the spectral bands and verify the full width at half maximum. For radiometric performance, a NIST (National Institute of Standards and Technology) traceable transfer calibration is performed on our electro-optic blackbody to verify its performance between the two end bracket temperatures of 4ºC and 40ºC. JPL has multiple NIST traceable blackbodies with a stability at 25ºC of ± 0.0007ºC and a thermistor standard probe with an accuracy of0.0015ºC over 0-60ºC and stability/yr of 0.005.
The data of Figure 14 shows that QWEST has very good linearity with many temperature measurements showing absolute errors below 0.1ºC. The NEDT for spectral channels at blackbody temperatures between 5ºC and 30ºC is measured as predicted. This implies that for a given temperature between this range QWEST has a mean NEDT of 124.7 mK.
Mass (scanhead, does not include 1 rack of electronics to operate instruments) | 12 kg |
Power | 400 W |
Instrument volume | 1 m x 0.5 m (cylinder) |
Number of pixels in cross-track | 512 |
Number of spectral bands | 256 |
Spectral range | 7.5-12 µm |
Frame speed | 35 or 22 fps |
Integration time (1 scanline) | 28 or 45 ms |
TFOV (Total Field of View) | 50º |
Calibration (preflight) | Full aperture blackbody |
Detector temperature | 40 K |
Spectrometer temperature | 100 K |
Slit length and width | 20 mm x 39 µm |
IFOV | 1.7066 |
Pixel size/swath at 2000 m flight altitude (includes ~27 calibration pixels) | 3.41 m / 1868.33 m |
Pixel size/swath at 20,000 m flight altitude (includes ~27 calibration pixels) | 34.13 m / 18683.31 m |
Data Products
• Raw data from FPA with interleaved GPS and engineering data (L0)
• Geo-located radiance at sensor (L1)
• Future derived products:
- Surface radiance
- Surface emissivity
- Surface temperature.
Flight Campaigns
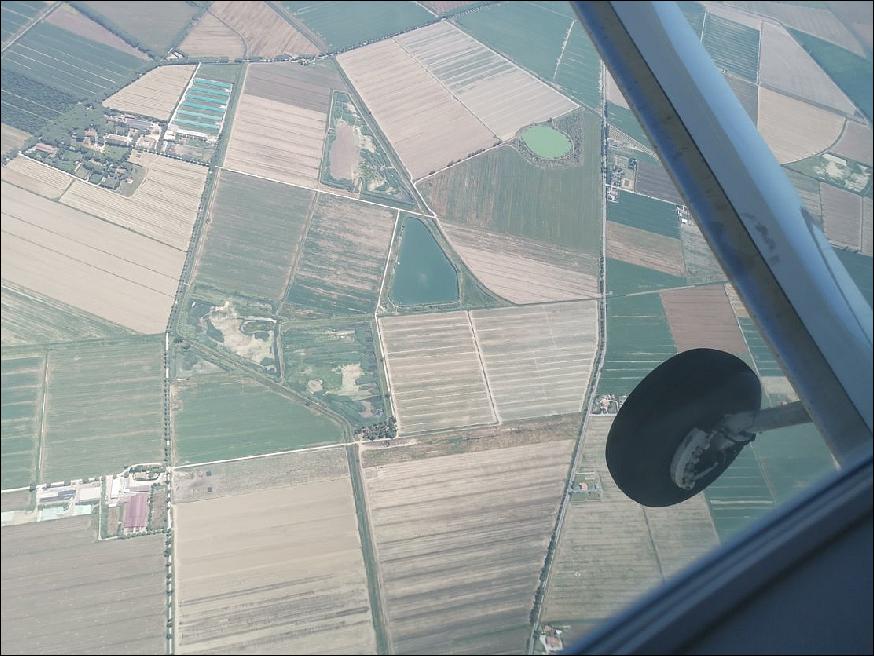
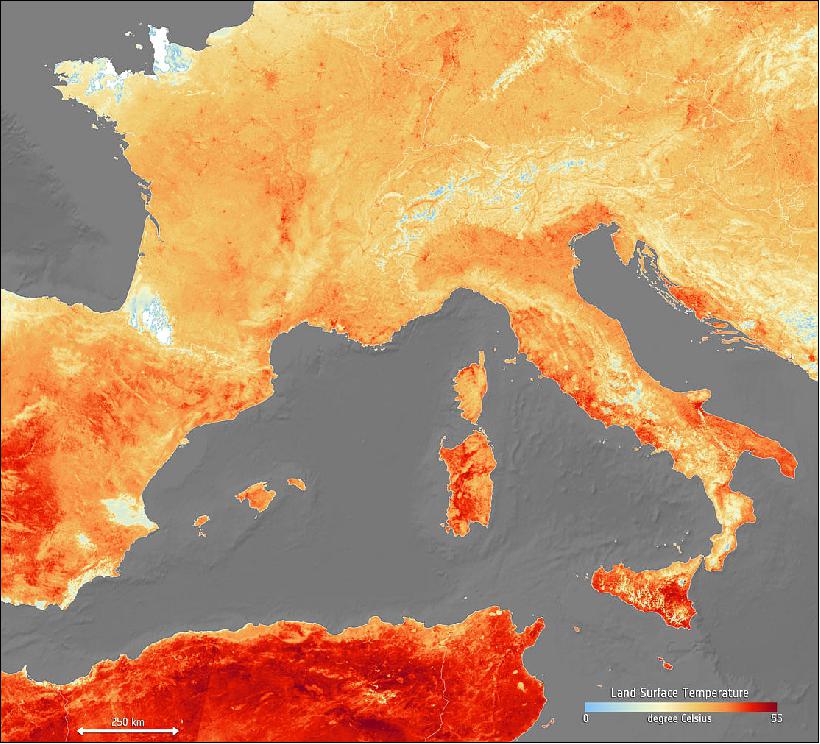
• July 22, 2019: A bright red twin-engined aircraft, equipped with ultra-high-resolution thermal imaging technology has been scouring the agricultural heartlands of Europe this summer. It was no search and rescue exercise, but an initial step towards building a proposed new satellite system capable of recording the temperature of Earth’s skin in intricate detail. 7)
- The objective is to work towards increasing the resilience of agriculture to future water scarcity and variability, but it will also deepen our understanding of Earth’s climate system.
- The instrument on board, called HyTES, is an advanced thermal imager built by NASA’s Jet Propulsion Laboratory. It has been surveying agricultural and urban areas in the UK and Italy as part of a joint airborne campaign between ESA and NASA.
- The results will help provide test data to support the development of the proposed LSTM (Land Surface Temperature Monitoring) mission, which is one of six new missions being considered for Europe’s Copernicus program. As with the Copernicus Sentinel missions, these new missions are being developed by ESA.
- The campaign also supports the development of ESA’s Earth Explorer FLEX mission, which will improve our understanding of the way carbon moves between plants and the atmosphere and how photosynthesis affects the carbon and water cycles.
- The test flights are helping to specify the best spectral band positions to be adopted by the mission,” said Dr Darren Ghent, of the University of Leicester and a member of the LSTM Mission Advisory Group. He noted the test data will help his team develop the algorithms for producing accurate thermal maps of the land surface.
- From a low-Earth, polar orbit, the proposed Copernicus LSTM mission would map both land-surface temperature and rates of evapotranspiration, comprising the water vapor emitted by plants as they grow, in unprecedented field-scale detail. It would deliver information at 50 m resolution – 400 times finer than is currently acquired operationally from spaceborne thermal instruments such as the sea and land surface temperature radiometer on Copernicus Sentinel-3.
- Dr Ghent continued, “In an urban context, this will help to understand and model thermal activity and ventilation in and around individual cities and inform planning and ‘climate-adaptive’ building design to deal with heatwaves such as those experience in western Europe during June.
- “The data, however, will be equally, if not more relevant, in a rural setting, with major benefits relating to food production and sustainable water use. At the expected resolution it will be possible to monitor the temperature of individual fields, enabling growers to tailor irrigation regimes to specific crops and locations.”
- Under water stress, plants reduce or cease the rate of water loss from their leaves reducing the productivity of the crop. This is closely related to the land-surface temperature, which can be detected from space before visible symptoms appear in crops.
- The population of Earth is expected to surpass nine billion by 2050, a 30% increase from today, and will place pressure on finite water resources in the future.
- Dr Ghent added, “Agriculture already accounts for the use of 70% of global freshwater. Increased water withdrawals to keep up with future food demands combined with water scarcity and variability issues due to the effects of climate change will be challenging.
- “The field-level temperature information from LSTM will increase the efficiency of individual farms in a changed environment.”
- Land-surface temperature is also an essential climate variable so data from the mission will form a key component in future climate data records, giving researchers the ability to resolve more local scale climate effects.
- Accurate knowledge of Earth’s skin temperature using satellite-derived information helps to explain the physics at the land-surface, and how energy and moisture are exchanged between Earth’s surface and the air above. This exchange is important for monitoring drought, changes in vegetation and the stability and extent of permafrost.
- As part of ESA’s Climate Change Initiative, a research team, led by the University of Leicester, is already working to develop and extend the existing data records of land-surface temperature by merging datasets from a variety of satellites, including ones no longer in operation.
- The current data record stretches from 1992 to 2017, but will be extended to 2020 by merging data from the radiometer instrument on Copernicus Sentinel-3 with supplementary data from polar and geostationary satellites to characterize diurnal variation.
- Increasing the length and accuracy of climate data records is vital for climate researchers, allowing them to detect small changes in climate with greater confidence.
- By running campaigns from a plane, ESA and the European Commission are starting their journey to develop an Earth observation mission that support efforts to increase resilience to future climate change at a resolution that will not only help to understand the role played by the temperature of the Earth’s skin, but also to act to mitigate the increasing water scarcity caused by climate change.
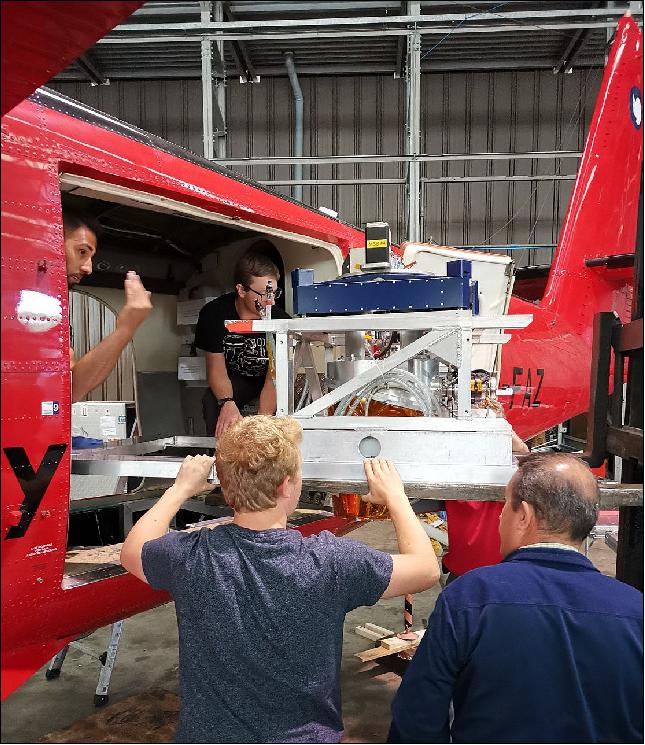
• First flight of HyTES instrument in July 2012 (Ref. 6). HyTES successfully completed its first test flights on board a Twin Otter aircraft flown between Grand Junction, Colorado and Burbank, California in the week of July 16, 2012. Initial engineering data were acquired near Grand Junction. Based on an evaluation of those datasets, science datasets were acquired between Grand Junction and Burbank. They include acquisitions over different surface types and gas emissions (sulfur dioxide, methane, ammonia) to determine whether HyTES can be used for gas studies. 8)
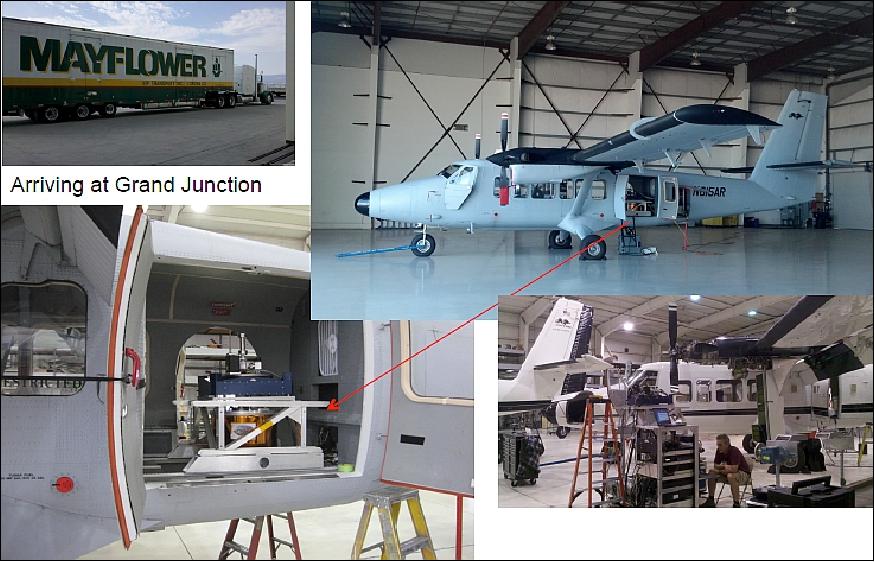
Platform: Twin Otter (Ref. 6)
- Flight altitude range: 2000 - 4000 m
- Frame rate: variable 15 to 30 fps
- Swath width: 1.8 km - 3.6 km
- Pixel size: 2.9 - 5.8 m
Operator has console to monitor instrument status, change frame rate, start and stop acquisition. Data are stored on removable hard drives.
References
1) William R. Johnson, Simon J. Hook, Pantazis Mouroulis, Daniel W. Wilson, Sarath D. Gunapala, Vincent Realmuto, Andy Lamborn, Chris Paine, Jason M. Mumolo, Bjorn T. Eng, “HyTES: Thermal Imaging Spectrometer Development,” 2011 IEEE Aerospace Conference, Big Sky, MT, USA, March 5-12, 2011, URL: http://trs-new.jpl.nasa.gov/dspace/bitstream/2014/42293/1/11-0765.pdf
2) Simon J. Hook, Bjorn T. Eng, Sarath D. Gunapala, Cory J. Hill, William R. Johnson, Andrew U. Lamborn, Pantazis Mouroulis, Jason M. Mumolo, Christopher G. Paine, Vincent J. Realmuto, Daniel W. Wilson, “QWEST and HyTES: Two New Hyperspectral Thermal Infrared Imaging Spectrometers for Earth Science,” ESTF (Earth Science Technology Forum) 2010, Arlington, Va, USA, June 22-24, 2010, URL of presentation: http://esto.nasa.gov/conferences/estf2010/presentations/Eng_Hook_ESTF2010_B4P2.pdf, URL of paper: http://esto.nasa.gov/conferences/estf2010/papers/Eng_for_Hook_Simon_ESTF2010.pdf
3) William R. Johnson, Simon J. Hook, Pantazis Mouroulis, Daniel W. Wilson, Sarath D. Gunapala, Cory J. Hill, Jason M. Mumolo, Bjorn T. Eng, “Quantum well earth science testbed,” Infrared Physics & Technology, Volume 52, Issue 6, Nov. 2009, pp. 430-433
4) William R. Johnson, Simon J. Hook, Pantazis Mouroulis, Daniel W. Wilson, Sarath D. Gunapala, Cory J. Hill, Jason M. Mumolo, Vincent Realmuto, Bjorn T. Eng, “Towards HyTES: an airborne thermal imaging spectroscopy instrument,” Proceedings of SPIE, 'Imaging Spectrometry XIV,' Sylvia S. Shen; Paul E. Lewis, Editors, Vol. 7457, August 2009
5) Simon Hook, William R. Johnson, Bjorn T. Eng, Sarath D. Gunapala, Andrew U. Lamborn, Pantazis Z. Mouroulis, Christopher G. Paine, Alexander Soibel, Daniel W. Wilson, “The Hyperspectral Thermal Emission Spectrometer (HyTES): preliminary results,” 2011, URL: http://esto.nasa.gov/conferences/estf2011/papers/hook_hytes_estf2011.pdf
6) Simon Hook & The HyspIRI/HyTES/PHyTIR Team, “First flight of the Hyperspectral Thermal Emission Spectrometer (HyTES) airborne instrument,” 2012 HyspIRI Science Workshop, NASA Decadal Survey Mission, Washington, DC, USA, Oct. 16-18, 2012, URL: http://hyspiri.jpl.nasa.gov/downloads/2012_Workshop/day3/15_Hook-2012-10-17-HyTES.pdf
7) ”Monitoring Earth’s skin heat for crops and climate,” ESA, 22 July 2019, URL: http://m.esa.int/Our_Activities/Observing_the_Earth
/Monitoring_Earth_s_skin_heat_for_crops_and_climate
8) Andrea Martin, “HyTES Successfully Completes First Test Flights,” NASA ESTO, July 2012, URL: https://web.archive.org/web/20170513074901/https://esto.nasa.gov/news/news_Hytes_7_2012.html
The information compiled and edited in this article was provided by Herbert J. Kramer from his documentation of: ”Observation of the Earth and Its Environment: Survey of Missions and Sensors” (Springer Verlag) as well as many other sources after the publication of the 4th edition in 2002. - Comments and corrections to this article are always welcome for further updates (eoportal@symbios.space).