Copernicus: Sentinel-2 - 2021
Sentinel-2 imagery in the period 2021
References
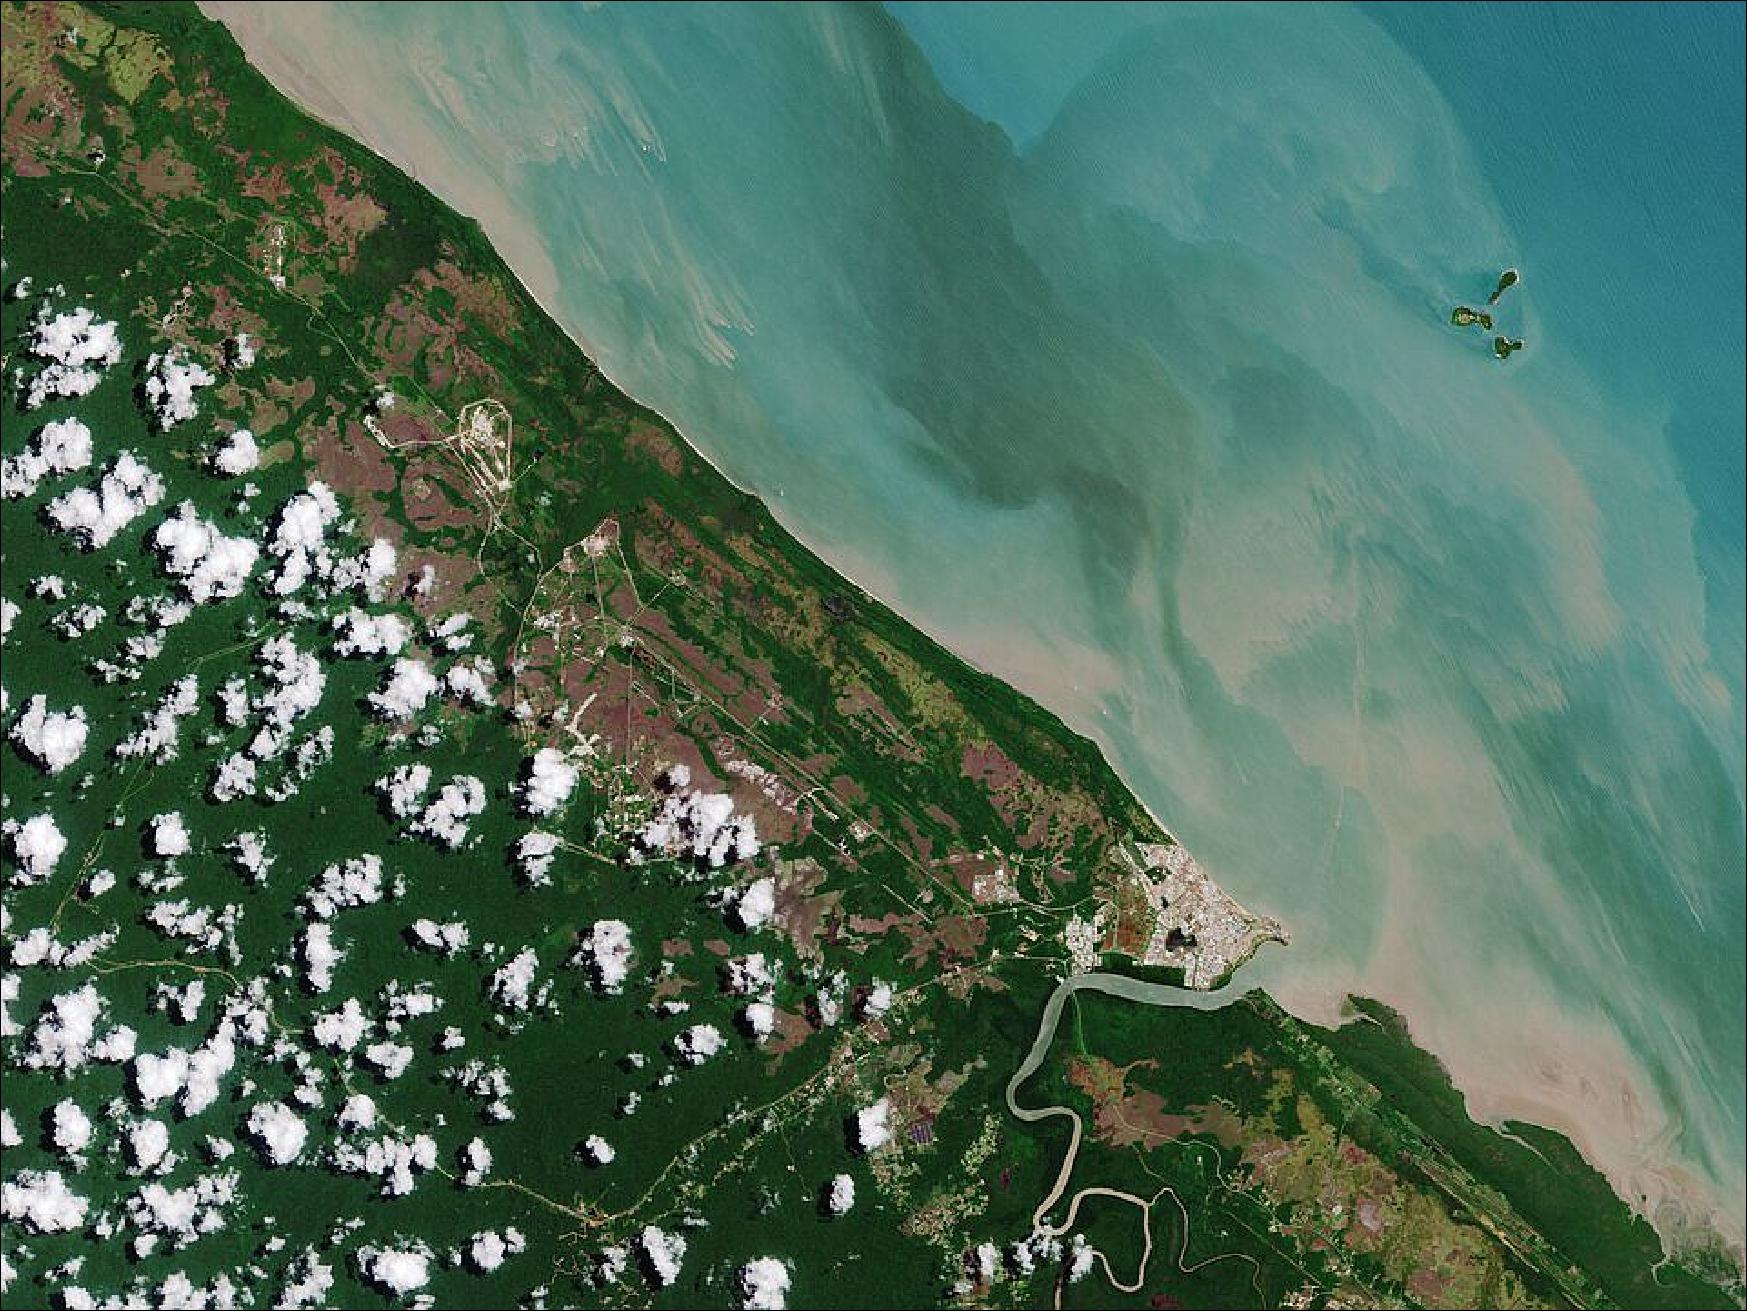
• December 17, 2021: Ahead of the upcoming Ariane 5 launch of the James Webb Space Telescope, the Copernicus Sentinel-2 mission takes us over Kourou – home to Europe’s Spaceport in French Guiana, an overseas department of France. 1)
- Long, white sandy beaches line the town’s ocean coast, while the riverbank and inland area consists mostly of mangrove and dense tropical rainforest. The surrounding area’s economy is largely agricultural, with coffee, cacao and tropical fruits being grown.
- Just northwest of Kourou lies Europe’s Spaceport – chosen as a base from which to launch satellites in 1964 by the French Government, and currently home to ESA-developed rocket families Ariane and Vega.
- As Kourou lies just 500 km north of the equator, it makes it ideally placed for launches into orbit as the rockets gain extra performance thanks to a ‘slingshot effect’ from the speed of Earth’s rotation. In addition, there is no risk of cyclones or earthquakes. This launch base and the jungle that surrounds it covers 690 km2 and protects an abundance of wildlife and plants.
- From here, the largest and most powerful telescope ever launched into space – the James Webb Space Telescope – is scheduled for launch. After liftoff, it will embark on a month-long journey to its destination, around one and a half million kilometers from Earth.
- Following the footsteps of the Hubble Space Telescope, Webb is designed to answer questions about the Universe and to make breakthrough discoveries in all fields of astronomy. The telescope will be able to detect infrared light generated by galaxies as they formed more than 13.5 billion years ago, in the aftermath of the Big Bang. Webb will see farther into our origins – from the Universe's first galaxies, to the birth of stars and planets, to exoplanets.
- In the first month after launch, Webb will unfold its sunshield, which is around the size of a tennis court, and deploy its 6.5-meter primary mirror. This will be used to detect the faint light of distant stars and galaxies with a sensitivity of a hundred times greater than that of Hubble.
- Webb is a joint project between NASA, ESA and the Canadian Space Agency (CSA). Find out more about Webb in ESA’s launch kit and interactive brochure.
• December 10, 2021: The city of Fairbanks, the largest city in the Interior region of Alaska, and its surroundings, are featured in this Copernicus Sentinel-2 image. 2)

- The river flows in a northwest direction along the base of the Alaska Range (visible in the bottom of the image) before joining the Yukon River near the village of Tanana. The river drains the north slopes of the high Alaska Range and is fed by several glaciers. The sediment-laden Tanana is rich in minerals, which gives it its milky color.
- South of the Tanana River lies the Tanana Flats, an area of marsh and bog that stretches for more than 160 km until it rises into the Alaska Range. One of the components of the Alaskan mountains, the Alaska Range extends for around 650 km in a generally east-west arc from the Aleutian Range to the boundary of Yukon. The mountain range can sometimes be seen from Fairbanks on clear days. The highest mountain in North America, the Denali, lies in the Alaska Range and reaches an elevation of over 6000 m (not visible).
- Around 20 km from Fairbanks lies the city of North Pole. Despite its name, the city is around 2700 km south of Earth’s geographic North Pole and around 200 km south of the Arctic Circle.
- Light green colors in the image indicate deciduous forest, while dark green represents evergreen forests.
• December 03, 2021: White Nile is one of the 18 states of Sudan. Covering an area of around 40,000 km2, the state is divided into four districts: Ad Douiem, Al Gutaina, Kosti and Al Jabalian. The area pictured here is located just north of Kosti, also spelled Kūstī, which lies on the west bank of the White Nile River (not visible). 3)
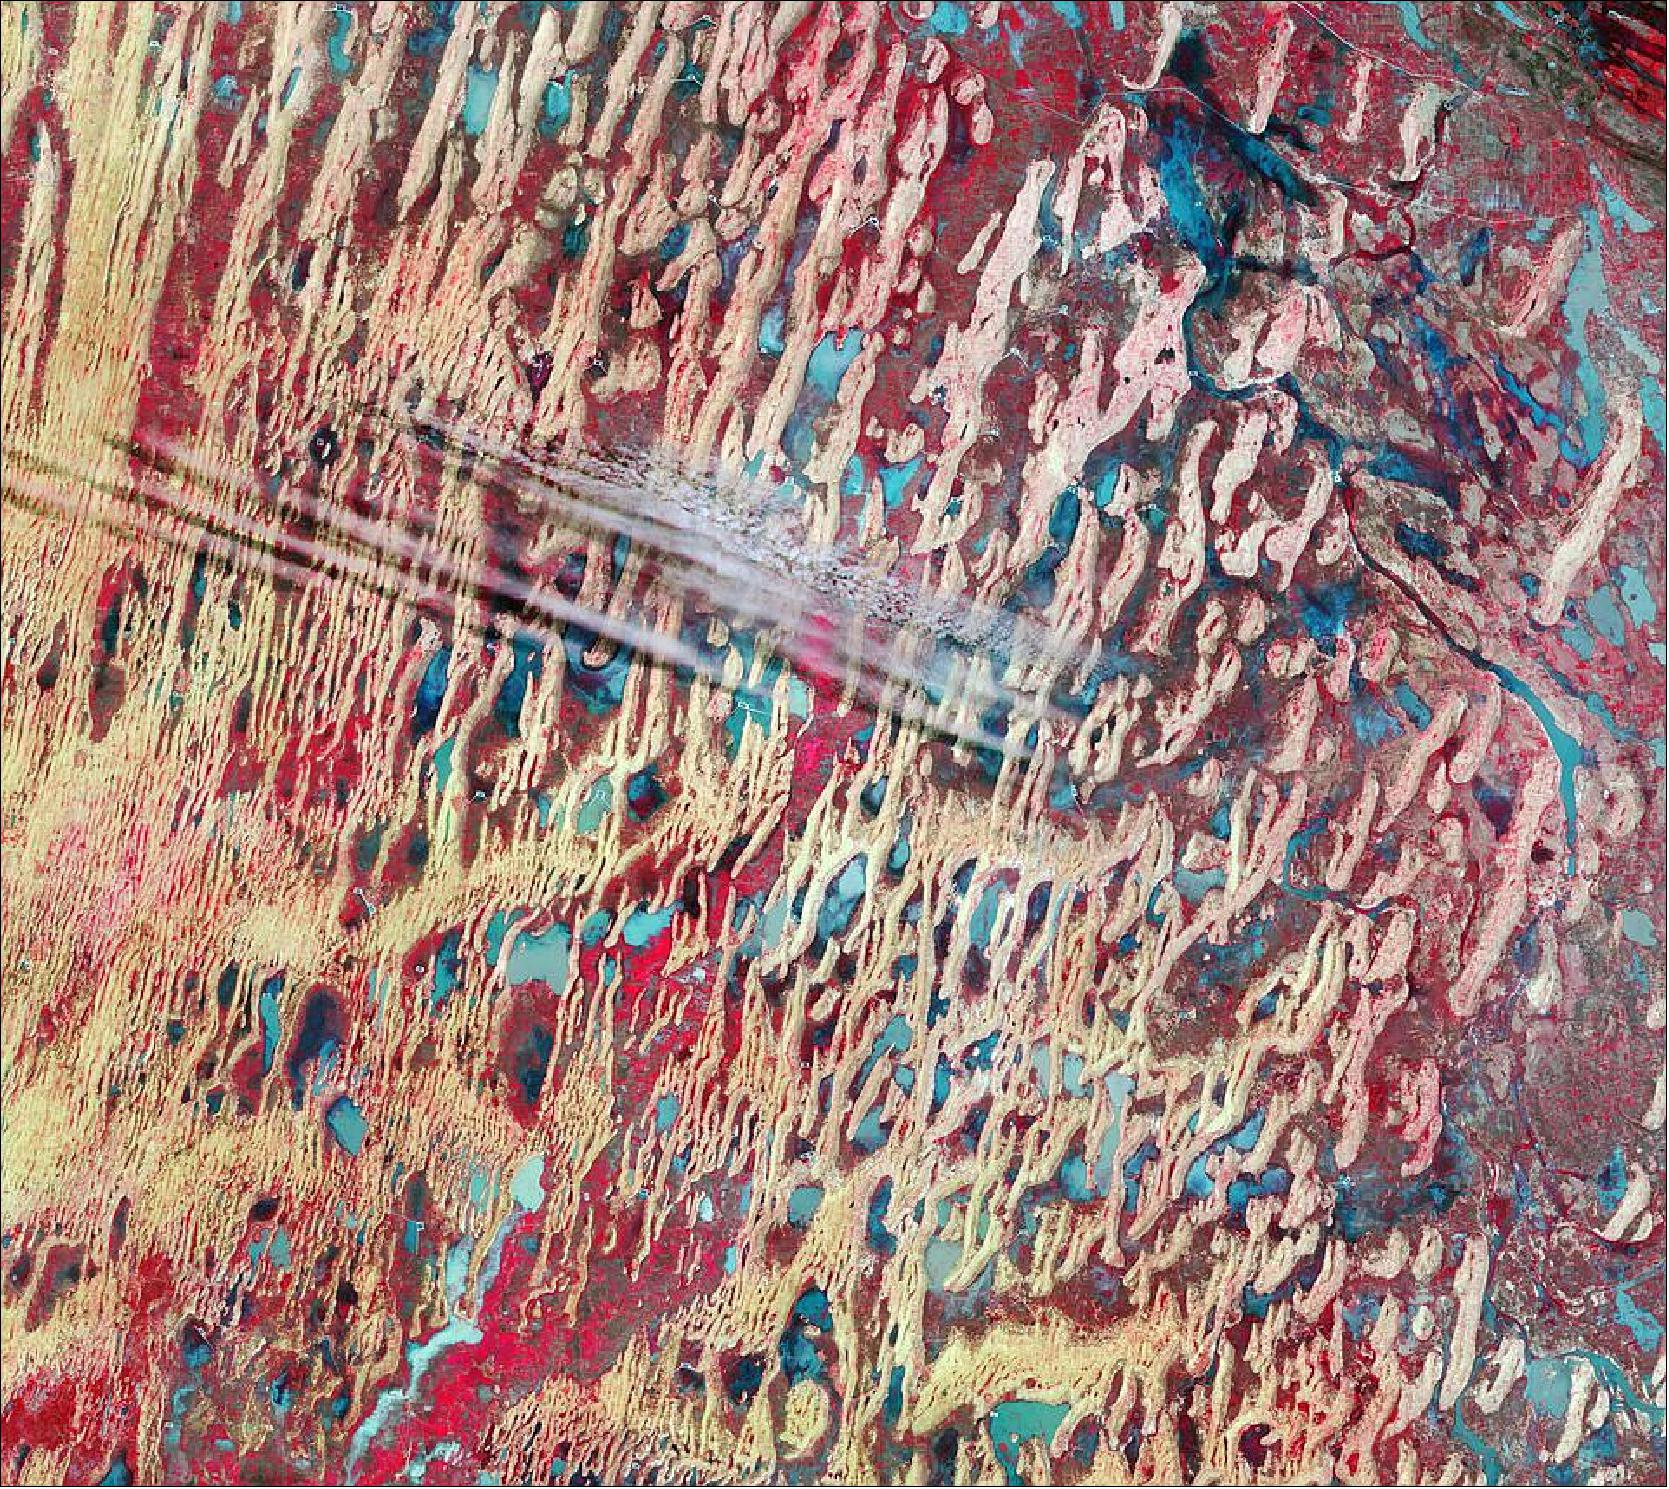
- Many agricultural plots can also be seen in red, particularly in the far-right and far-bottom of the image. Agriculture plays an important role in Sudan’s economy. The country’s main crops include cotton, peanuts, sesame and sugarcane, while the main subsistence crops include wheat, corn, sorghum and millet. Several small villages can also be spotted in the image, with many of them visible near artificial water reservoirs (easily spotted with their rectangular shape) and are most likely utilized during the dry season.
- Owing to seasonal rainfall, many ephemeral bodies of water can be spotted in shades of turquoise and blue in the image.
- Flooding is common in Sudan in August and September. During these months each year, monsoon rains pour into the Ethiopian Highlands and flow down to the Blue and White Nile and can often lead to floodwaters swamping nearby communities. Starting in August 2021, a series of torrential downpours overwhelmed streams and rivers and unleashed floods in the area, with the White Nile being one of the hardest hit areas.
- Copernicus Sentinel-2 has two satellites, each carrying a high-resolution camera that images Earth’s surface in 13 spectral bands. The type of band combination from Copernicus Sentinel-2 used to process this image is commonly utilized to assess plant density and health, as plants reflect near-infrared and green light, while absorbing red. Since they reflect more near-infrared than green, dense, plant-covered land appears in bright red.
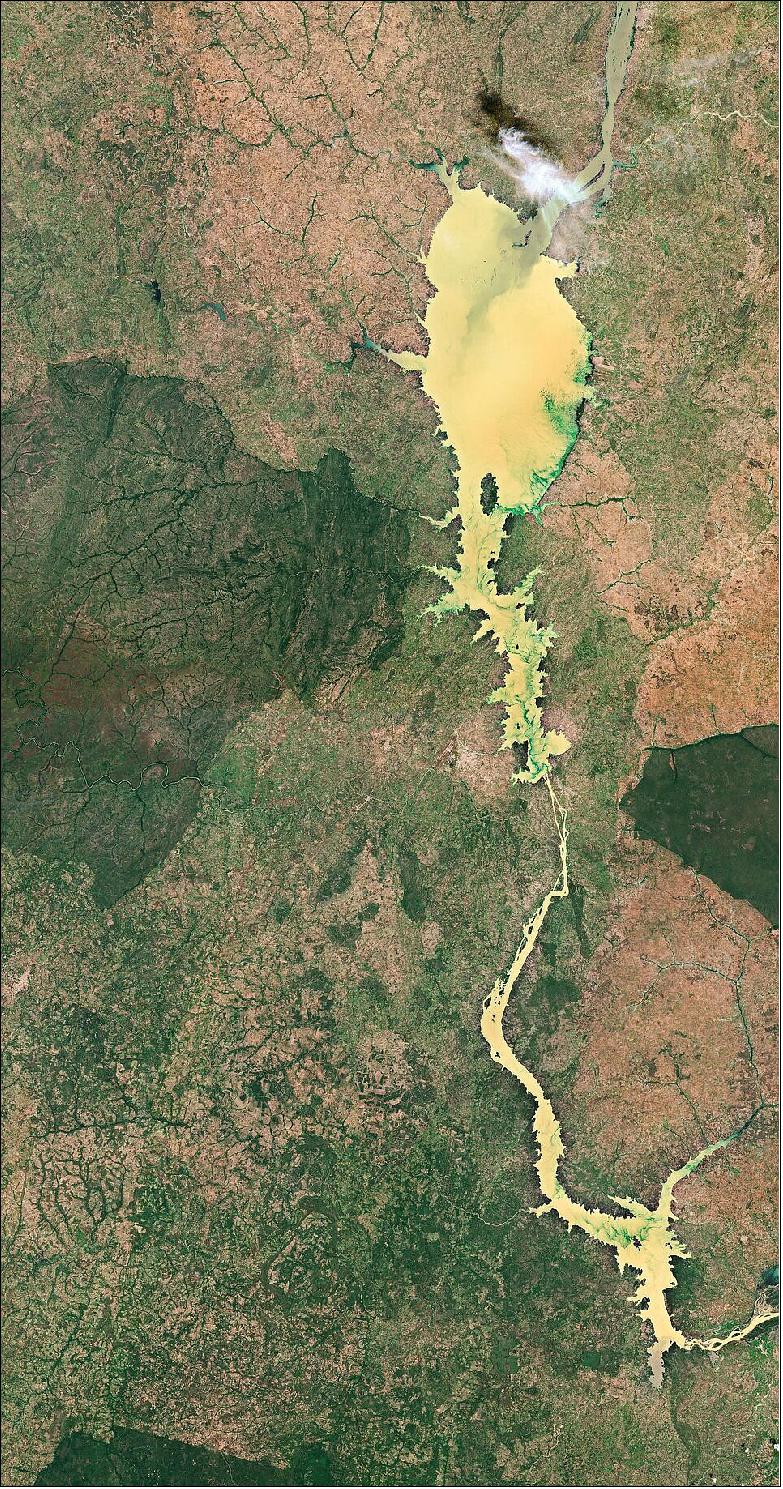
• November 26, 2021: Kainji Lake, a reservoir on the Niger River in western Nigeria, is featured in this true-color image captured by the Copernicus Sentinel-2 mission. 4)
- The creation of the lake submerged Foge Island, the town of Bussa and permanently flooded other riverine settlements – leaving around 50 000 people displaced. Foge Island can be seen dividing the river into two channels at the northern end, and the channels merge again north of Old Bussa. During low water tides, large parts of Foge Island rise above and are temporarily inhabited by migrating fishermen.
- Kainji Dam, located in the center of the image, produces electricity for most of Nigeria’s cities. The dam is the largest of the dams on the Niger, over 66 m high and 550 m across. The dam provides electrical power, improved river navigation, water control of the Niger, as well as waters for irrigation and fishing.
- Kainji Lake National Park, visible as a dark green patch of land in the left of the image, is Nigeria’s oldest national park. Covering an area of around 5300 km2, the park contains three distinct areas: a part of the Kainji Lake, the Borgu Game Reserve to the west of the lake, and the Zugurma Game Reserve to the southeast. Around 65 mammal species, 350 species of birds and 30 species of reptiles and amphibians have been recorded in the park.
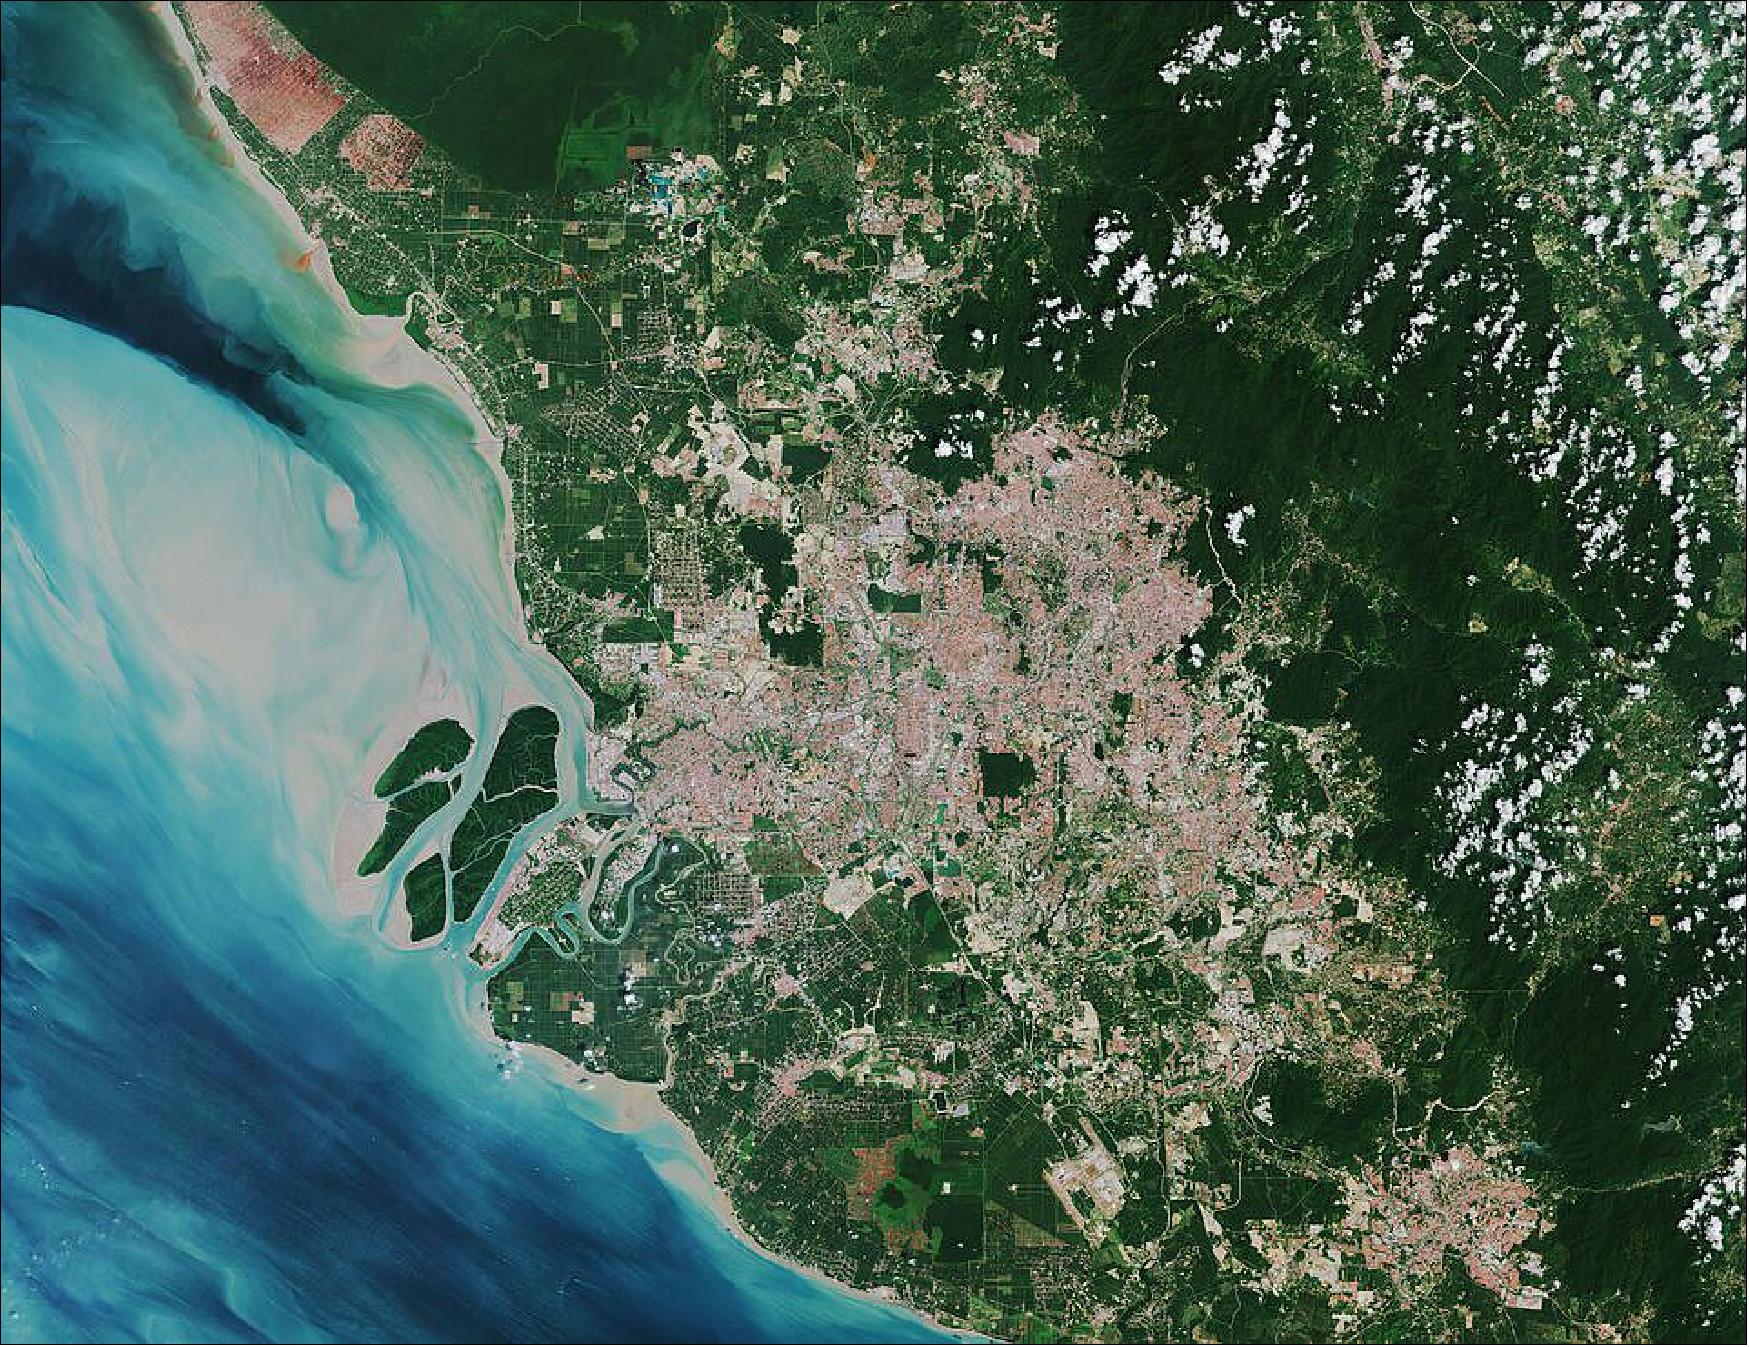
• November 19, 2021: Located in west-central Malaysia, Kuala Lumpur is the country’s largest urban area and its cultural, commercial and transportation center. The city lies in the hilly countryside of the Klang Valley and lies astride the confluence of the Kelang and Gombak rivers. Its name in Malay means ‘muddy estuary.’ 5)
- The city’s commercial quarter, known as the Golden Triangle, is the site of the Petronas Twin Towers, the tallest twin towers (452 m) in the world. Kuala Lumpur International Airport, one of the busiest airports in Asia, can be seen in the bottom of the image.
- The Klang Valley is bordered by the Titiwangsa Mountains to the east, some minor ranges in the north and the Strait of Malacca in the west. Visible in the far left of the image, the Strait of Malacca is a narrow stretch of water between the Malay Peninsula and the Indonesian island of Sumatra. A main shipping channel between the Indian and Pacific oceans, it is one of the most important shipping lanes in the world. Port Klang, is the main gateway by sea into Malaysia and lies around 40 km southwest of Kuala Lumpur.
- The Greater Kuala Lumpur area is around 2,700 km2 and is an urban agglomeration of over seven million people – making it one of the fastest growing metropolitan regions in Southeast Asia. Like many other growing cities and areas in the world, the region is facing the daunting challenge of urban sprawl. This puts pressure on urban land in the city, but also on agricultural land in the periphery, as well as on other natural resources.
- Urban areas are already home to 55% of the world’s population and that figure is expected to grow to 68% by 2050. In order to gain a better understanding of current trends in global urbanization, ESA and the German Aerospace Center (DLR), in collaboration with the Google Earth Engine team, have jointly developed the World Settlement Footprint (WSF) – the world’s most comprehensive dataset on human settlement.
- The World Settlement Footprint Evolution has been generated by processing seven million images from the US Landsat satellite collected between 1985 and 2015. The animation in Figure 6 illustrates the growth of Kuala Lumpur on a year-by-year basis, from 1985 to 2015.
- This unprecedented collection of information on human settlement will not only advance our understanding of urbanization on a global scale but will also become an asset for national statistical offices, local authorities, civil society and international organizations.
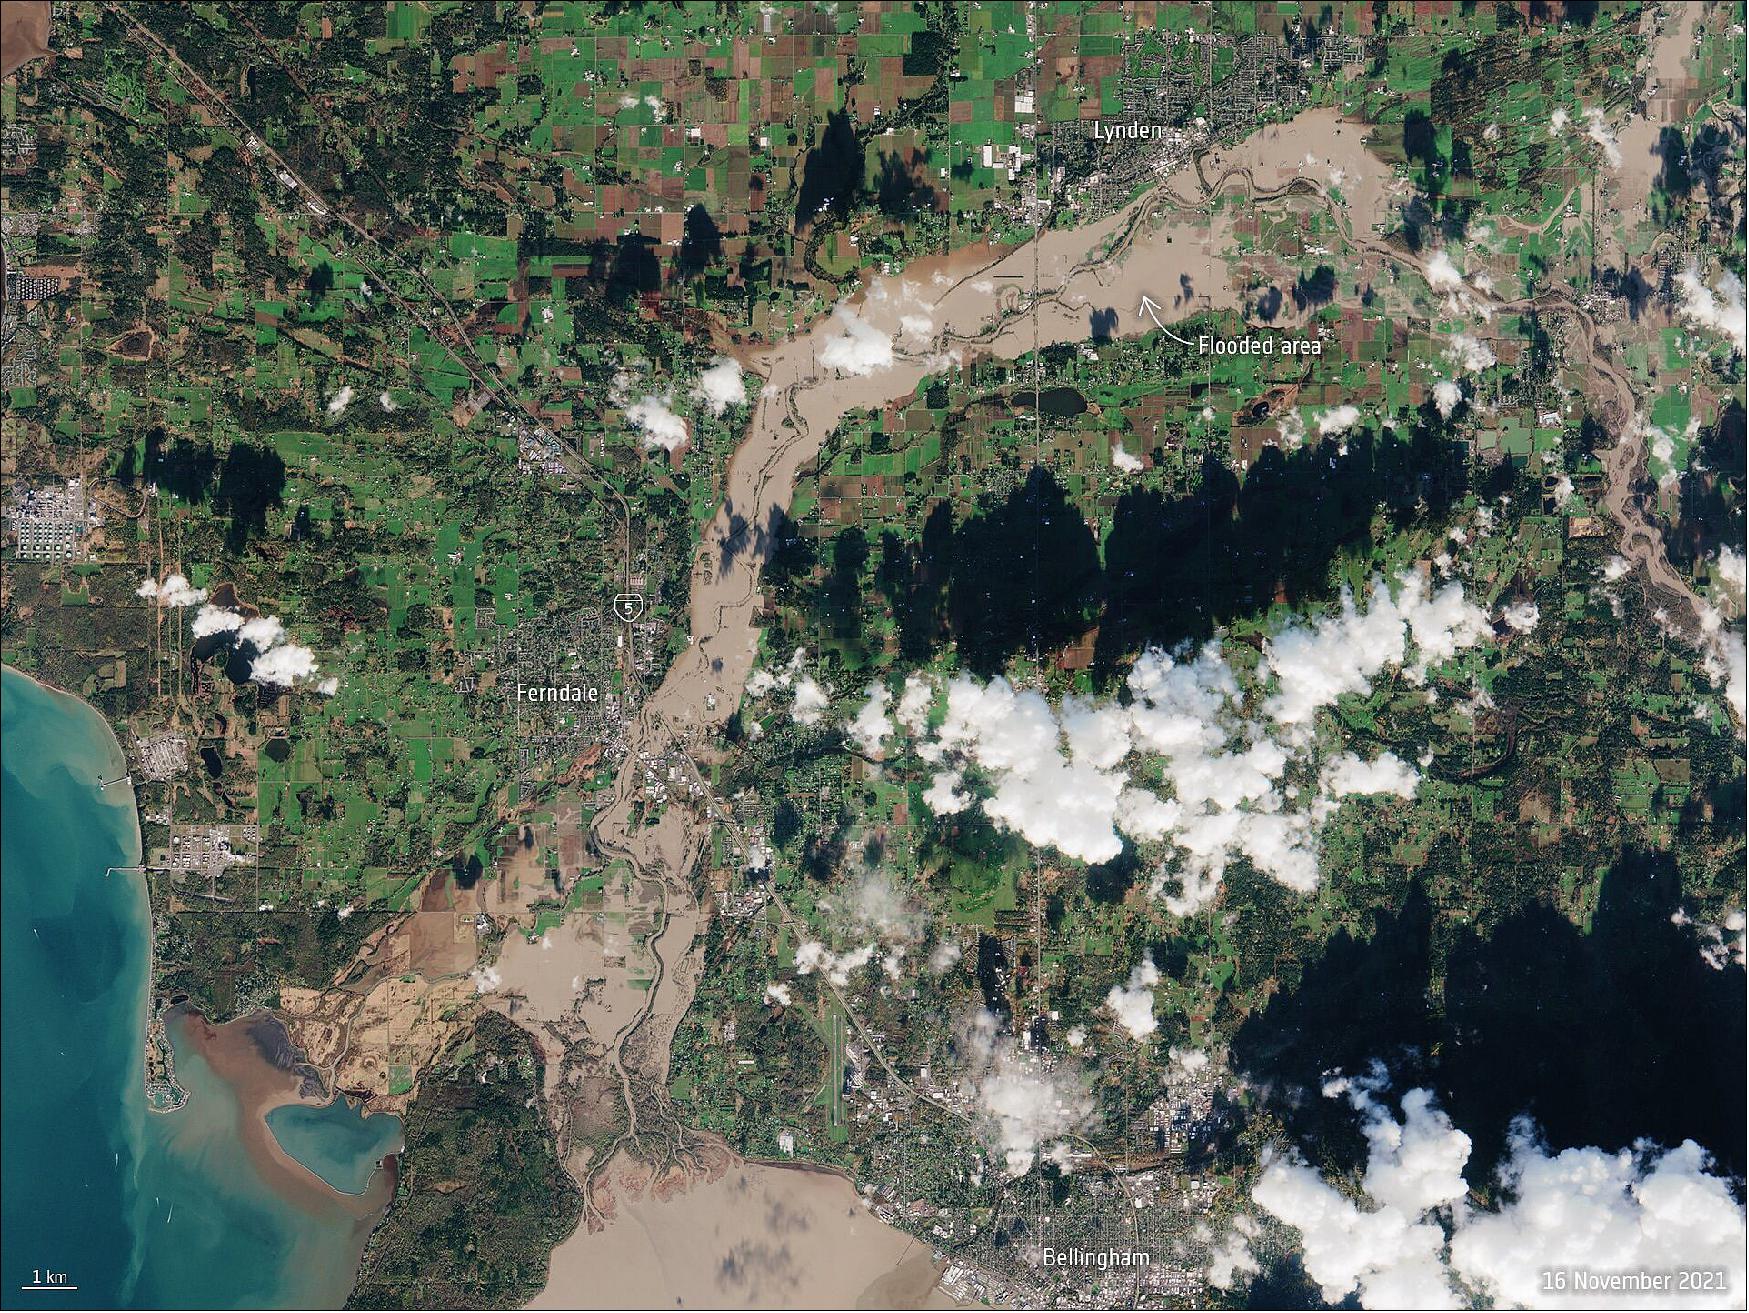
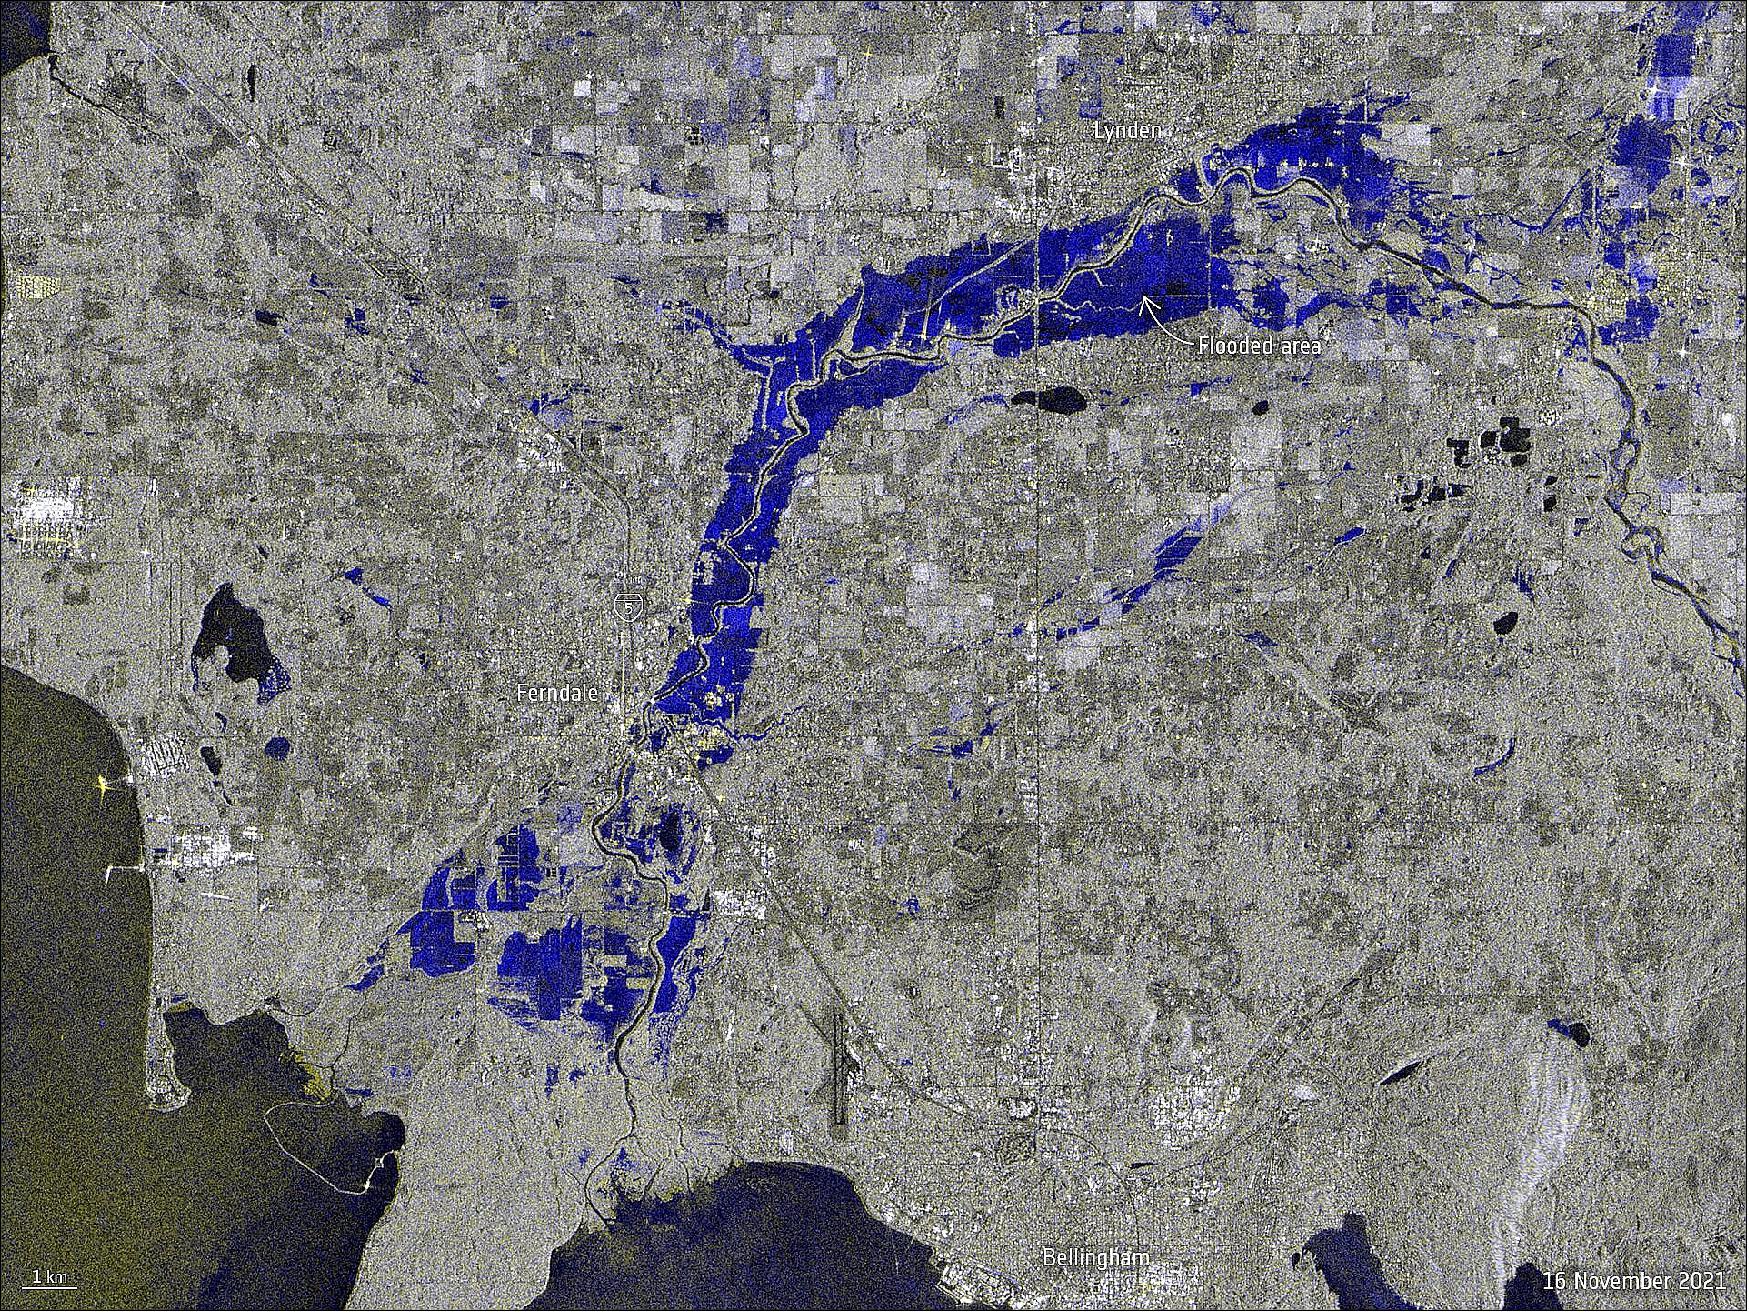
• November 18, 2021: The US State of Washington is under a state of emergency following days of severe wind and rain leading to extensive flooding in parts of the state. The extreme weather was caused by an atmospheric river, a huge plume of moisture extending over the Pacific and into Washington. Different satellites in orbit carry different instruments that can provide us with a wealth of complementary information to understand and to respond to flooding disasters. 6)
- More than 158,000 people were affected by power outages and disruptions to other services. The conditions triggered mudslides in the region, prompting the closure of the Interstate 5, but it has since reopened.
- Optical satellite instruments such as the Copernicus Sentinel-2 satellites cannot see through clouds, which is why radar missions like Sentinel-1 are particularly useful. Radar images acquired before and after flooding events offer immediate information on the extent of inundation, thanks to Sentinel-1’s ability to ‘see’ through clouds and rain.
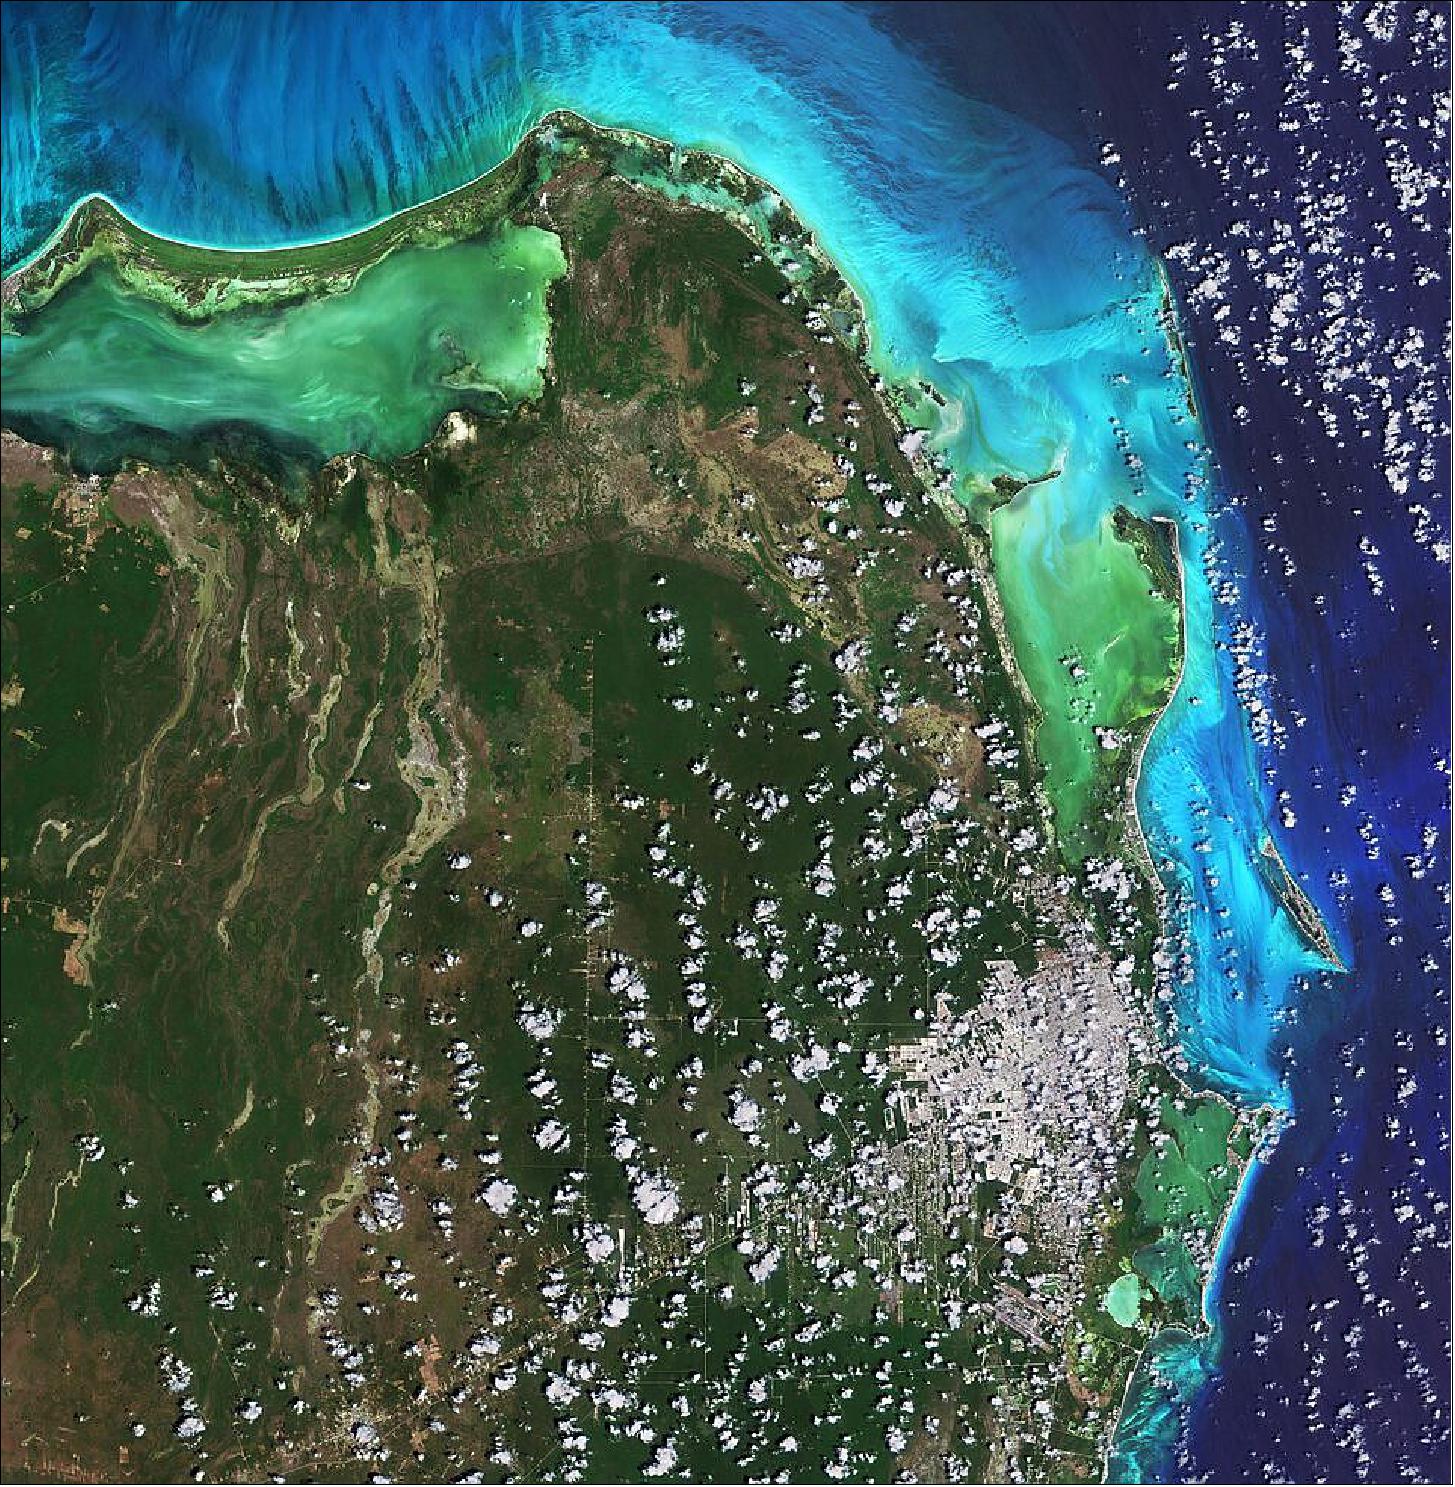
• November 12, 2021: Cancún, situated in Quintana Roo on the northeast coast of Mexico’s Yucatán Peninsula, is featured in this image captured by the Copernicus Sentinel-2 mission. 7)
- Cancún’s location on the Caribbean Sea, tropical climate and string of beaches have made the city and the Riviera Maya to the south of Cancún one of Mexico’s top tourist destinations. In this image, captured on 16 April 2021, the city can be seen in the bottom-right corner, shrouded in clouds. Cancun International Airport, Mexico’s second busiest airport, is located around 20 km south of the city.
- The Cancún Island resort area, visible just off the coast, is shaped like the number seven and is around 22 km in length. The island is separated from the city by the Nichupté Lagoon but is linked by two causeways at each end. Most of the tourist industry is centered on Cancún Island with its Caribbean-facing beaches.
- Isla Mujeres, Spanish for ‘Island of Women,’ is visible just north of Cancún Island and is most famous for its beaches and snorkelling. Isla Contoy, visible in the top-right of the image, is considered one of the most important nesting places for sea birds in the Mexican Caribbean with more than 150 species of birds.
- Quintana Roo covers an area of around 42,000 km2 and is home to several protected areas including the El Eden Ecological Reserve, located 50 km northwest of Cancún, and Yum Balam Flora and Fauna Protected Area, located in the north of the state. Encompassing more than 150,000 hectares, Yum Balam is home to several endangered species including jaguars, crocodiles and monkeys.
- With its 13 spectral channels, Copernicus Sentinel-2’s novel imager can capture water quality parameters such as the surface concentration of chlorophyll, detect harmful algal blooms, and measure turbidity (or water clarity) – giving a clear indication of the health and pollution levels.
• November 5, 2021: Lying roughly 100 km north of the Scottish mainland, the Shetland Islands separate the Atlantic Ocean on the west from the North Sea to the east. The archipelago comprises around 100 islands and islets, with fewer than 20 of them inhabited. The islands cover an area of around 1468 km2 and have a rugged coastline approximately 2700 km long. 8)
- The largest island, known as the Mainland, has an area of around 900 km2, making it the third-largest Scottish island. The next largest are Yell, Unst and Fetlar, which lie in the north, as well as Bressay and Whalsay, which lie to the east. Lerwick, located on Mainland, is the capital and largest settlement of the archipelago.
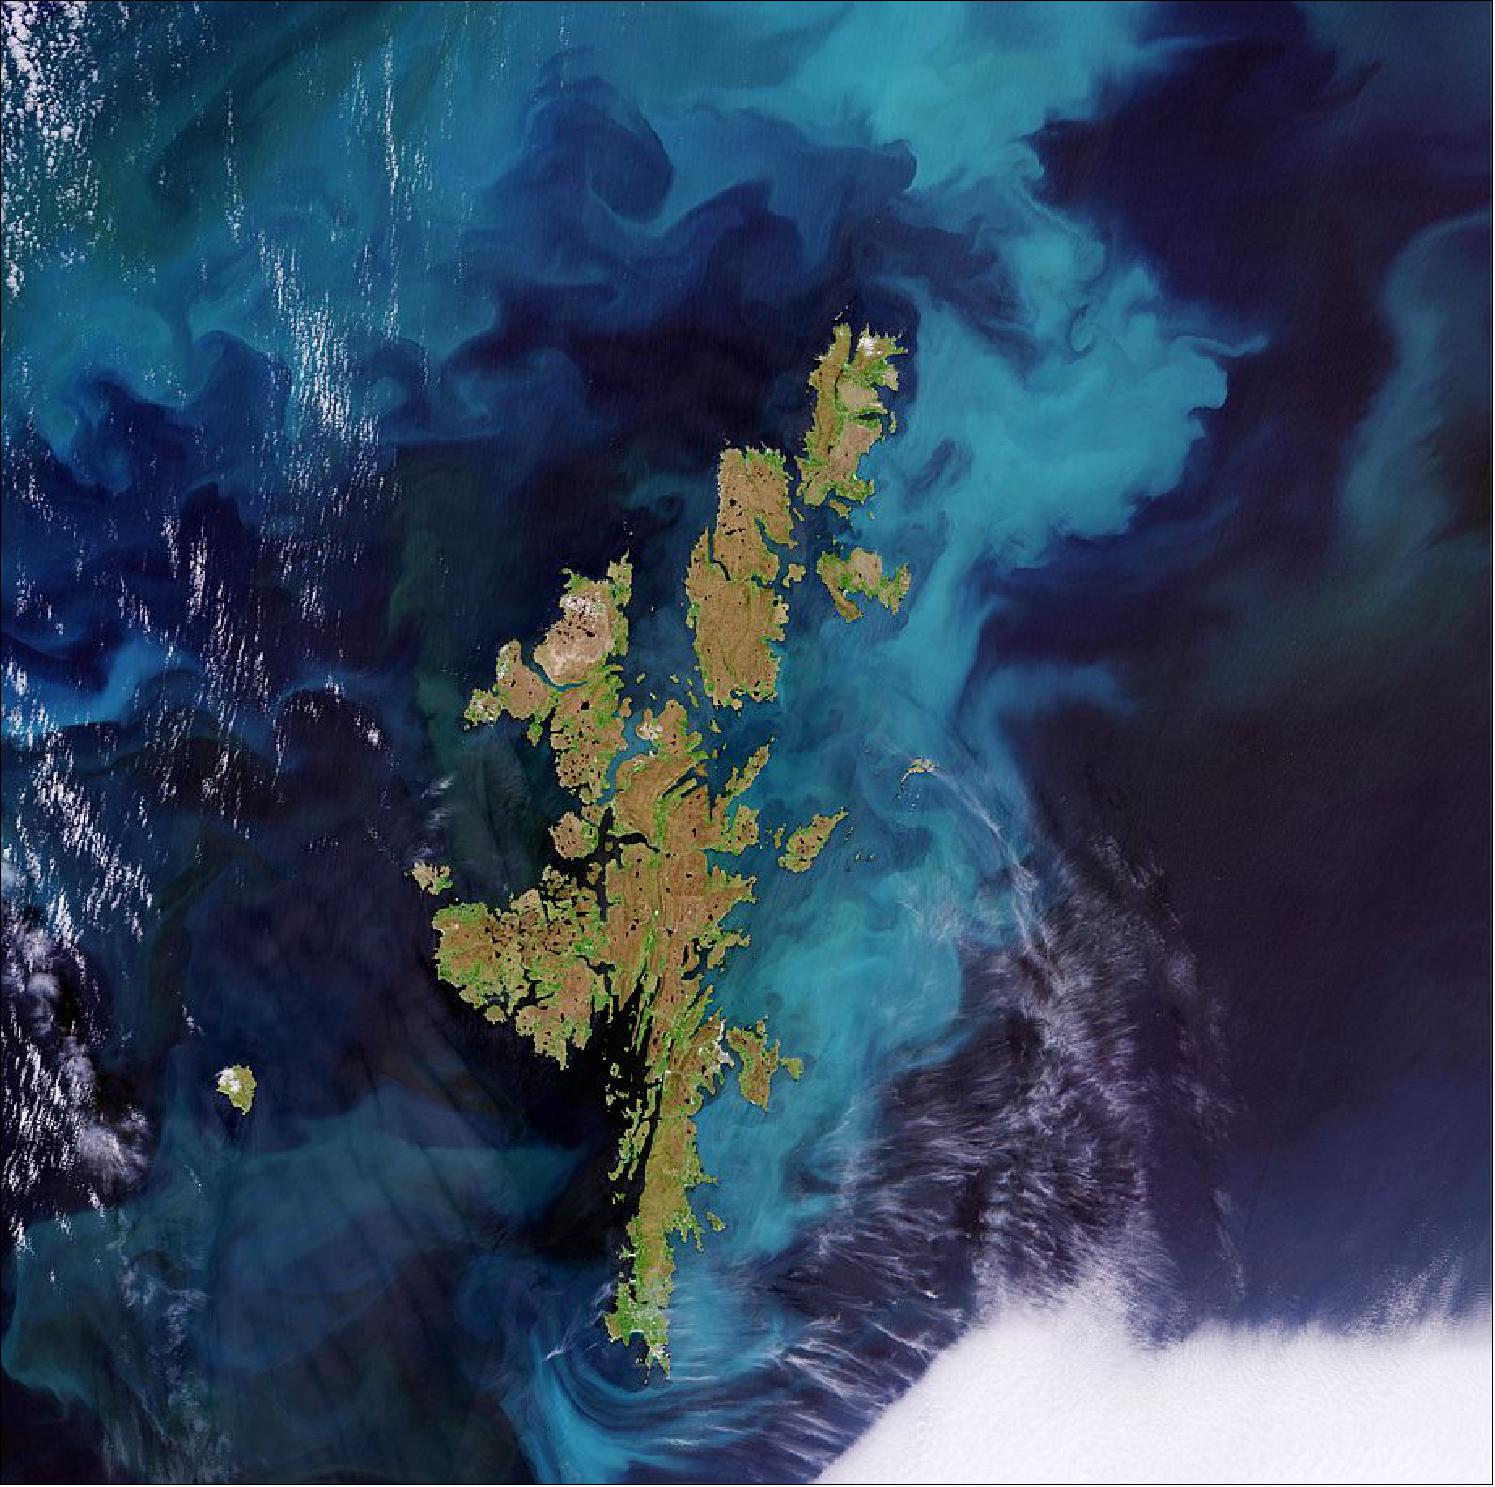
- In the absence of any known samples being analyzed, it is assumed that it is a coccolithophore bloom – a type of microscopic marine algae living in the upper layer of the sea. Like all phytoplankton, coccolithophores contain chlorophyll and have the tendency to multiply rapidly near the surface.
- In large numbers, coccolithophores periodically shed their tiny scales called ‘coccoliths’ into the surrounding waters. These calcium-rich coccoliths turn the normally dark water a bright, milky-turquoise color. Although invisible to the eye, in large quantities, they are easy to spot in satellite imagery. These types of algae play a huge role in the ocean uptake of atmospheric carbon dioxide, as their shells sink to deeper ocean depths after they die, storing carbon in the process.
- This year’s edition of the United Nations climate change conference – COP26 – is taking place in Scotland from 31 October to 12 November. The summit aims to inspire faster and more ambitious action from the international community to achieve the goal of limiting global temperature rise to 1.5°C. As in previous years, ESA has a strong presence at COP26, showcasing how satellite data strengthens our understanding of climate from space. Read more about ESA’s role at COP.
• October 29, 2021: Glasgow, host of the 26th UN Climate Change Conference of Parties (COP26), is featured in this image captured by the Copernicus Sentinel-2 mission. 9)
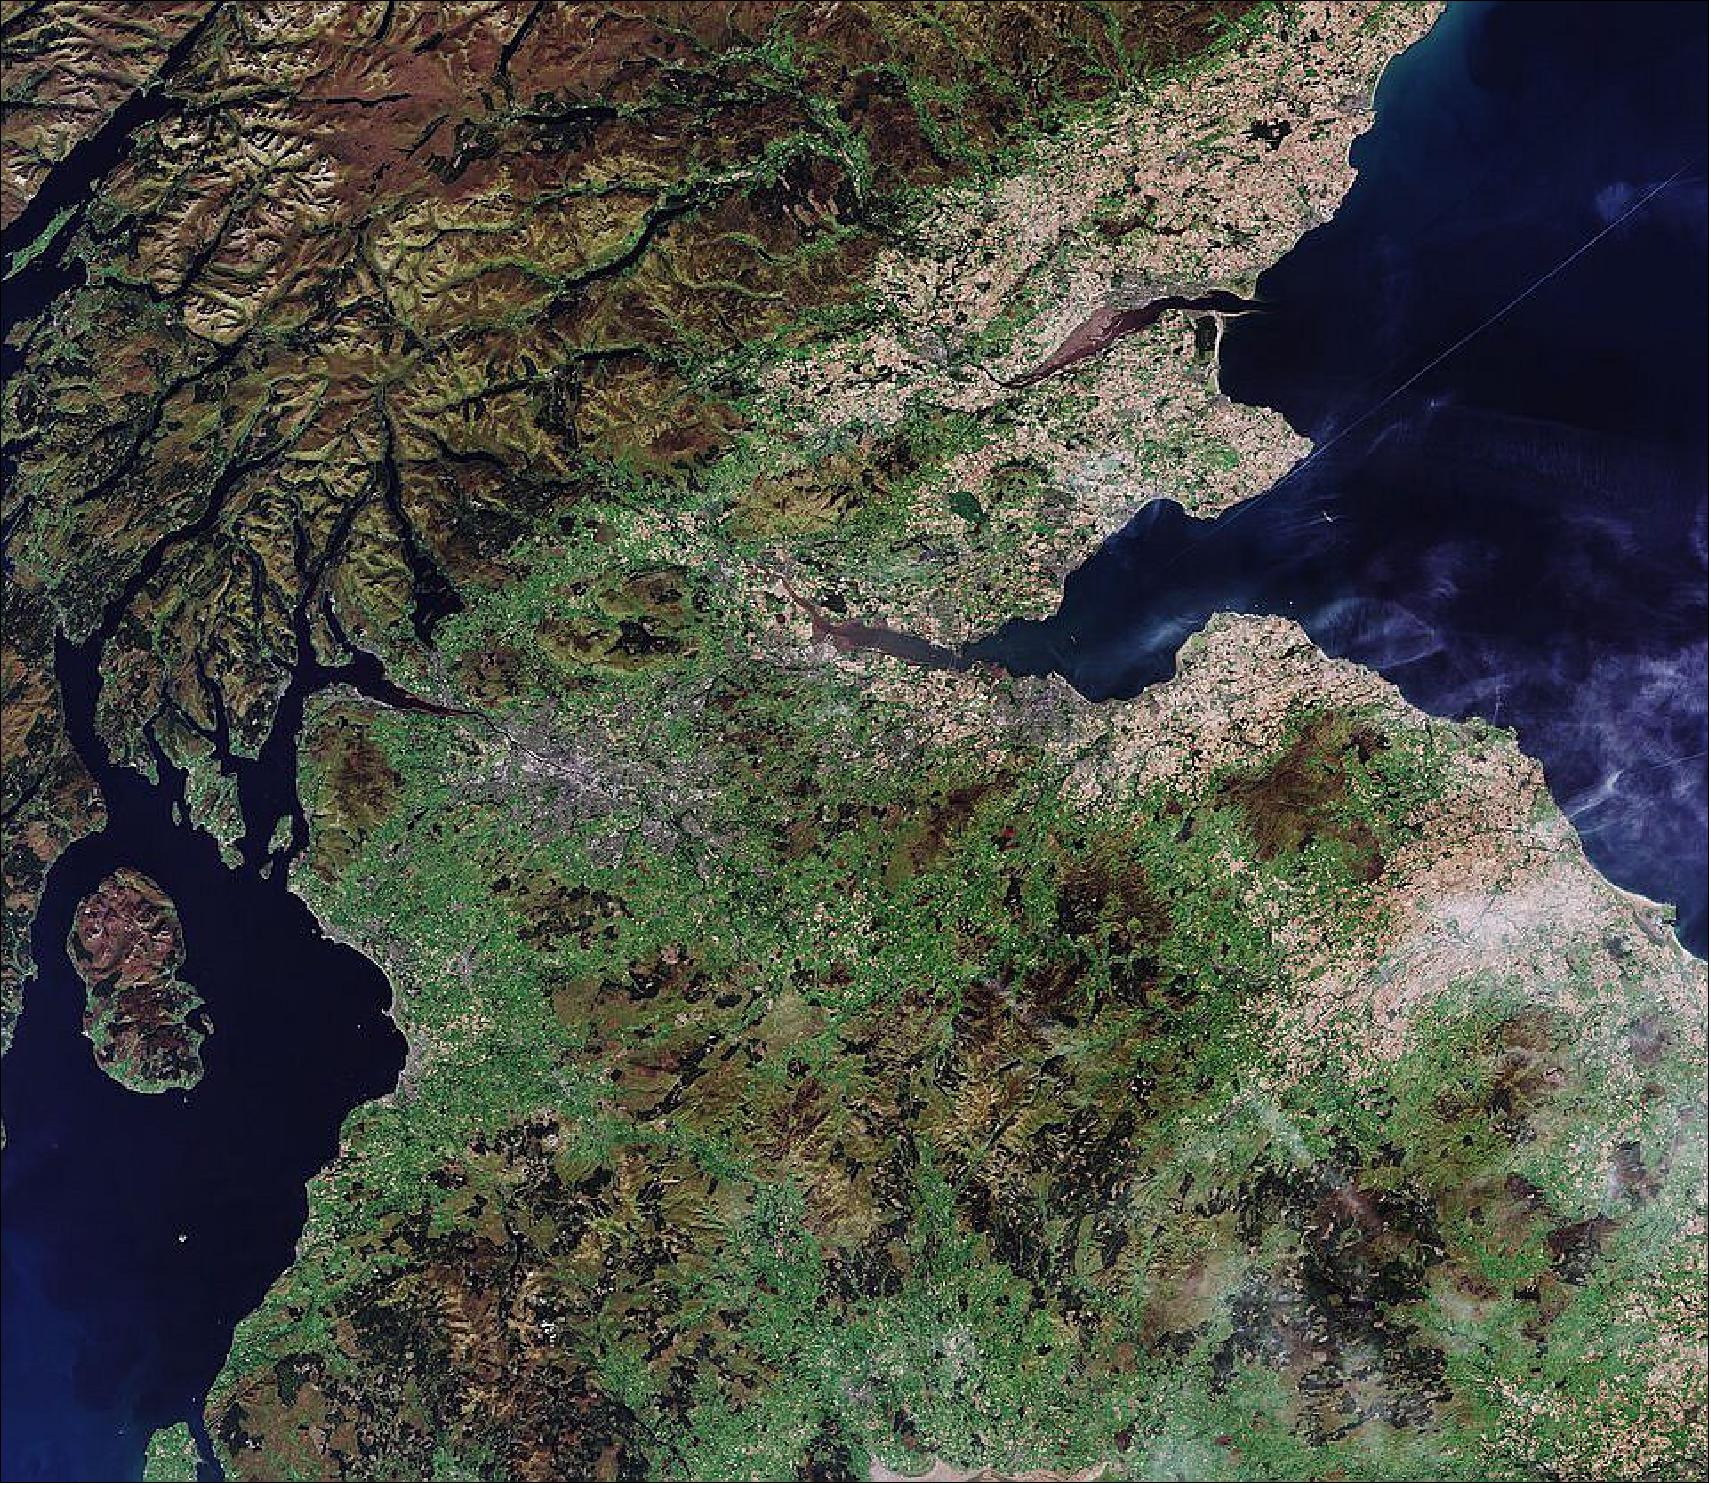
- Edinburgh, Scotland’s capital, can be seen in the center-right of the image, located in Lothian on the southern shore of the Firth of Forth. Both Edinburgh and Glasgow, along with Stirling and Dundee, all lie in the Central Lowlands, where over half of Scotland’s population lives.
- The Highlands, visible in the upper-left of the image, is the largest region in Scotland covering more than 25,600 km 2 of land and is home to stunning scenery. The area is divided in two parts: the Great Glen divides the Grampian Mountains to the southeast from the northwest Highlands. The area is very sparsely populated, with many mountain ranges dominating the region and includes the highest mountain in the British Isles, Ben Nevis, as well as the legendary Loch Ness.
- From 31 October to 12 November, the COP26 summit will take place in Glasgow – bringing together parties to accelerate action towards the goals of the Paris Agreement and the UN Framework Convention on Climate Change (UNFCC).
- As in previous years, ESA will have a strong presence at COP26. ESA’s theme at COP26 will be ‘Taking the pulse of the planet from space and supporting climate action’ which aims to demonstrate the role of ESA’s missions and satellite data to strengthen our understanding of climate from space. This will support policymakers, society, businesses and communities to mitigate and adapt to a changing climate and develop resilience in support of the UNFCC Paris agreement.
- During COP26, the much-anticipated documentary which covers the ESA-led science expedition to the Gorner Glacier in Switzerland will be released for the first time. The documentary follows ESA astronaut Luca Parmitano, along with Susanne Mecklenburg, Head of ESA’s Climate Office, and their scientific team to one of the biggest ice masses in the Alps: the Gorner Glacier. Owing to its dramatic retreat, the glacier is one of the most extensively studies glaciers in the world.
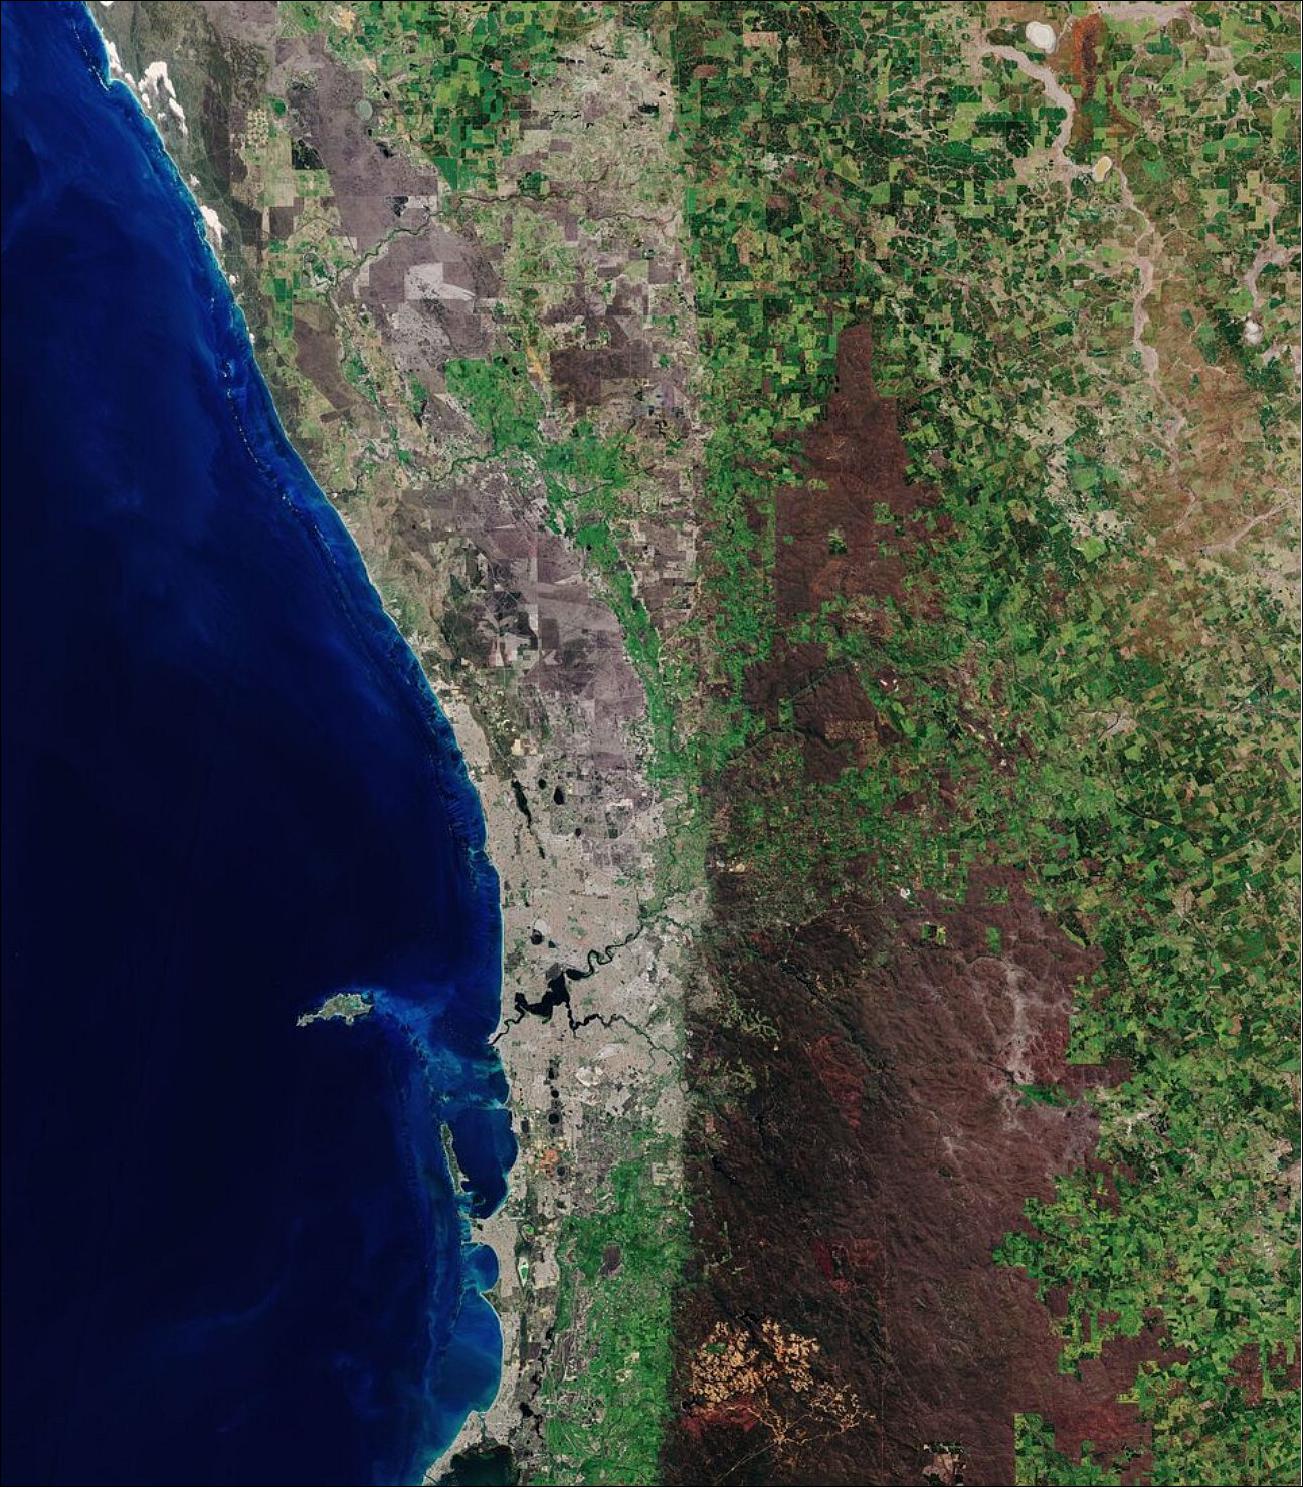
• October 22, 2021: The metropolitan area of Perth is located in the South West Division of Western Australia, between the Indian Ocean and a low coastal escarpment known as the Darling Range. The metropolitan area stretches around 125 km along the coast, from Two Rocks in the north, to Singleton in the south. The central business district and suburbs of Perth, Australia’s fourth-most populous city, are situated on the banks of the Swan River. 10)
- Before European colonization, the area had been inhabited by the Whadjuk Noongar people for over 40,000 years. The area where Perth now stands, was called Boorloo by the Aboriginals living there at the time of their first contact with Europeans in 1827.
- Perth is one of the most isolated cities on Earth, with its nearest city, Brisbane, located around 2000 km away. Perth is closer to Bali in Indonesia than Australia’s capital, Canberra. Despite its isolation, Perth is one of the fastest-growing cities of Australia. Its airport is visible just south of Swan River.
- Rottnest Island, known as Wadjemup to the Noongar people, is located 19 km off the coast of Perth. This 19 sq km, sandy island is known for its population of quokkas, one of the smallest wallaby species in Australia. Several ferries can be seen journeying to and from Rottnest Island and Fremantle Harbor, Western Australia’s largest and busiest general cargo port.
- The most striking feature in this week’s image is the difference between forested land (visible in dark brown) and agricultural plots and crops (visible in green). Some of the forested land pictured here includes John Forrest National Park and the Mundaring, Jarrahdale and Youraling State Forests.
- The intricate pattern visible in the bottom of the image is the Huntly Bauxite Mine, the world’s second largest bauxite mine. Australia is the world’s largest producer of bauxite – a raw material used primarily in the production of aluminum.
- The image also includes the location of ESA's deep-space ground station at New Norcia, about 120 km northeast of Perth. The station supports missions like ExoMars/TGO, BepiColombo and Solar Orbiter, and a new 35 m-diameter dish antenna is planned for the site.
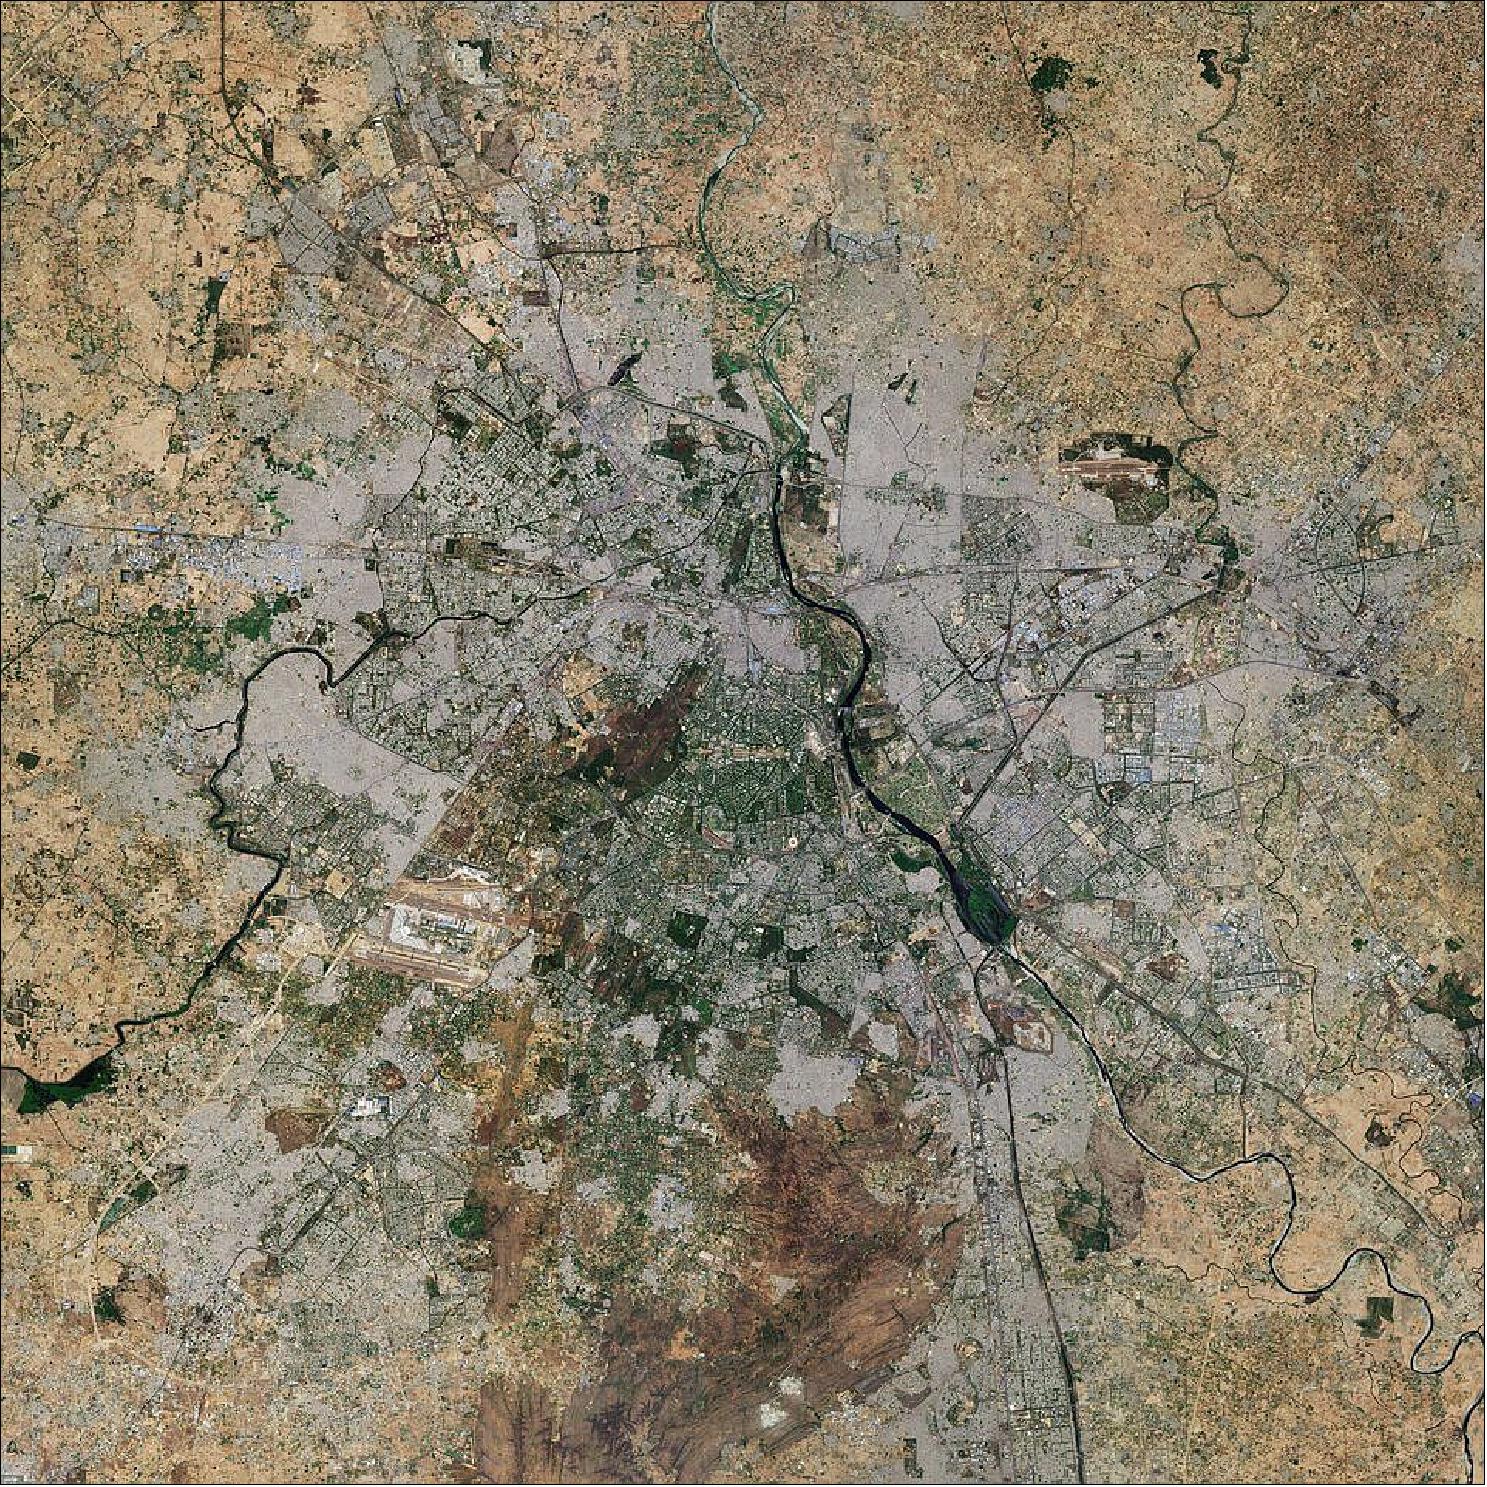
• October 15, 2021: New Delhi, the capital and second-largest city of India, is featured in this image captured by the Copernicus Sentinel-2 mission. 11)
- New Delhi is situated in the north-central part of the country and lies within the massive metropolitan area of Delhi, India’s capital territory. To the east, Delhi is bounded by the state of Uttar Pradesh, and to the north, west and south it is bounded by the state of Haryana.
- Delhi’s urban area consists of the historical city of Old Delhi in the north, New Delhi in the south and now also includes the nearby cities of Ghaziabad, Faridabad, Gurugram and Noida. From space, these cityscapes together appear light grey in tone.
- New Delhi sits, primarily, on the west bank of the Yamuna River, visible in black in the right of the image. One of the country’s most sacred rivers, the Yamuna is a tributary of the Ganges River, located around 160 km south of the Himalayas.
- New Delhi, the government, commercial and financial center of India, is considered one of the fastest growing cities in the country and in the world. The straight and diagonal pattern of the broad, tree-lined avenues in New Delhi, which features extensive green spaces, makes it appear as a darker-toned region and contrasts with the narrower, winding streets of Old Delhi.
- The city is dotted with numerous museums, monuments, botanical gardens, places of worship and cultural buildings including the Hindu Akshardham Temple.
- Other notable features in the image include Indira Gandhi International Airport visible in the left, and Hindon Airport to the right. Some perfectly squared plots of land can be seen in the image, particularly in the west side of the city.
- As well as providing detailed information about Earth’s vegetation, Copernicus Sentinel-2 is designed to play a key role in mapping differences in land cover to understand the landscape, map how it is used and monitor changes over time. As cities continue to expand, Sentinel-2 can also be used to track urban expansion and assist urban planners.
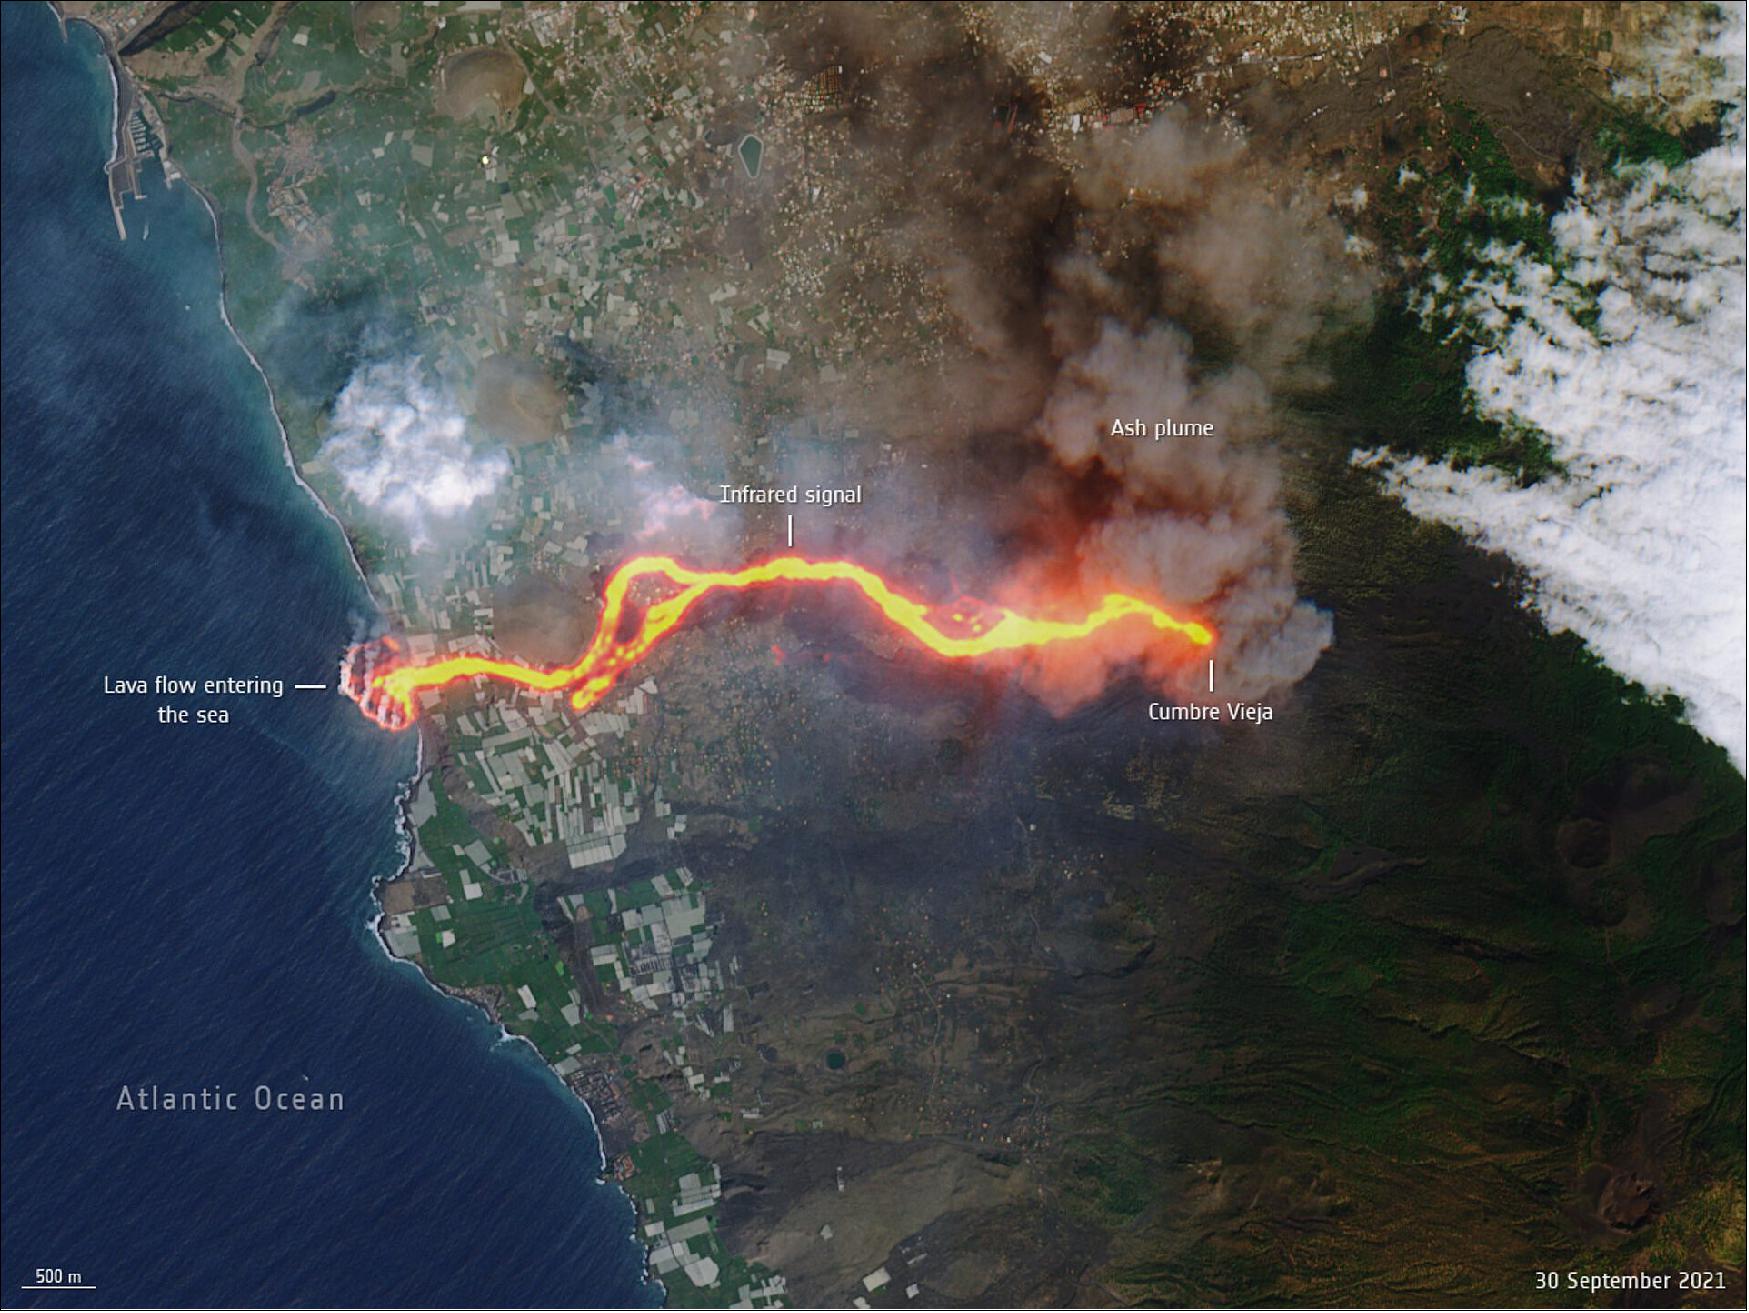
• October 11, 2021: Since the Cumbre Vieja volcano began erupting on 19 September 2021, lava has burned through homes, roads and farmlands causing mass destruction on the west part of the Canary Island of La Palma. Satellite imagery has helped authorities monitor and manage the ongoing crisis. From capturing images of the rivers of lava, to measuring gas emissions and assessing damage, the fleet of Copernicus Sentinel satellites have been providing crucial data for local teams. 12)
- It has been over three weeks of continuous activity at Cumbre Vieja, which means ‘The Old Summit’ in Spanish. On Saturday 9 October, it was reported that parts of the northern face of the volcano’s cone collapsed, leading the lava to overflow in different directions. On Sunday 11 October, 21 seismic movements were detected, with the largest measuring 3.8 on the Richter scale, according to the National Geographic Institute of Spain (IGN).
- A build-up of ash and dust on the runway forced authorities in La Palma to close the island’s airport, according to Spain’s airport authority AENA. It has been the second time the airport has been closed due to ash build-up since the eruption began on 19 September.
- In stunning new images taken on 10 October, the new river of lava belched from the Cumbre Vieja volcano has been captured by the Copernicus Sentinel-2 mission. This Sentinel-2 images have been processed in true color, using the shortwave infrared channel to highlight the new flow of lava.
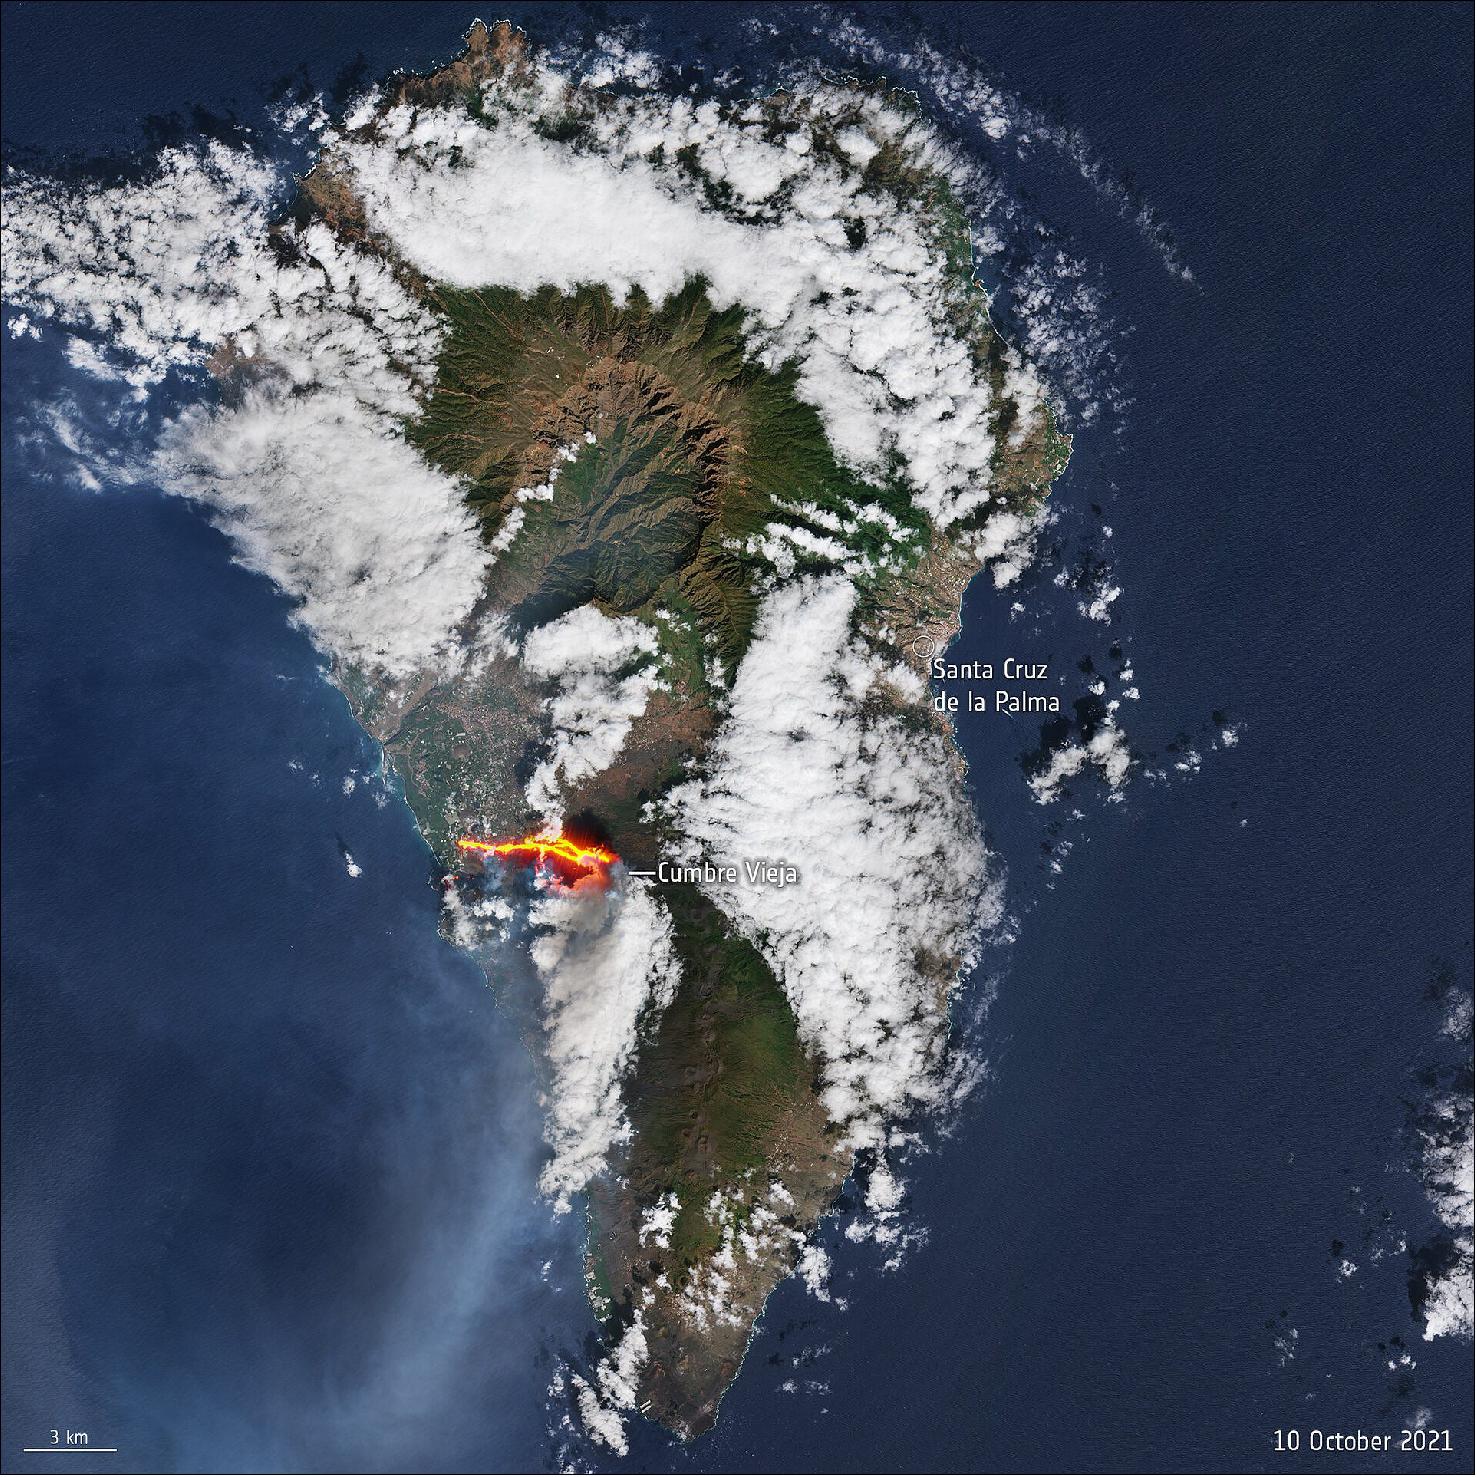
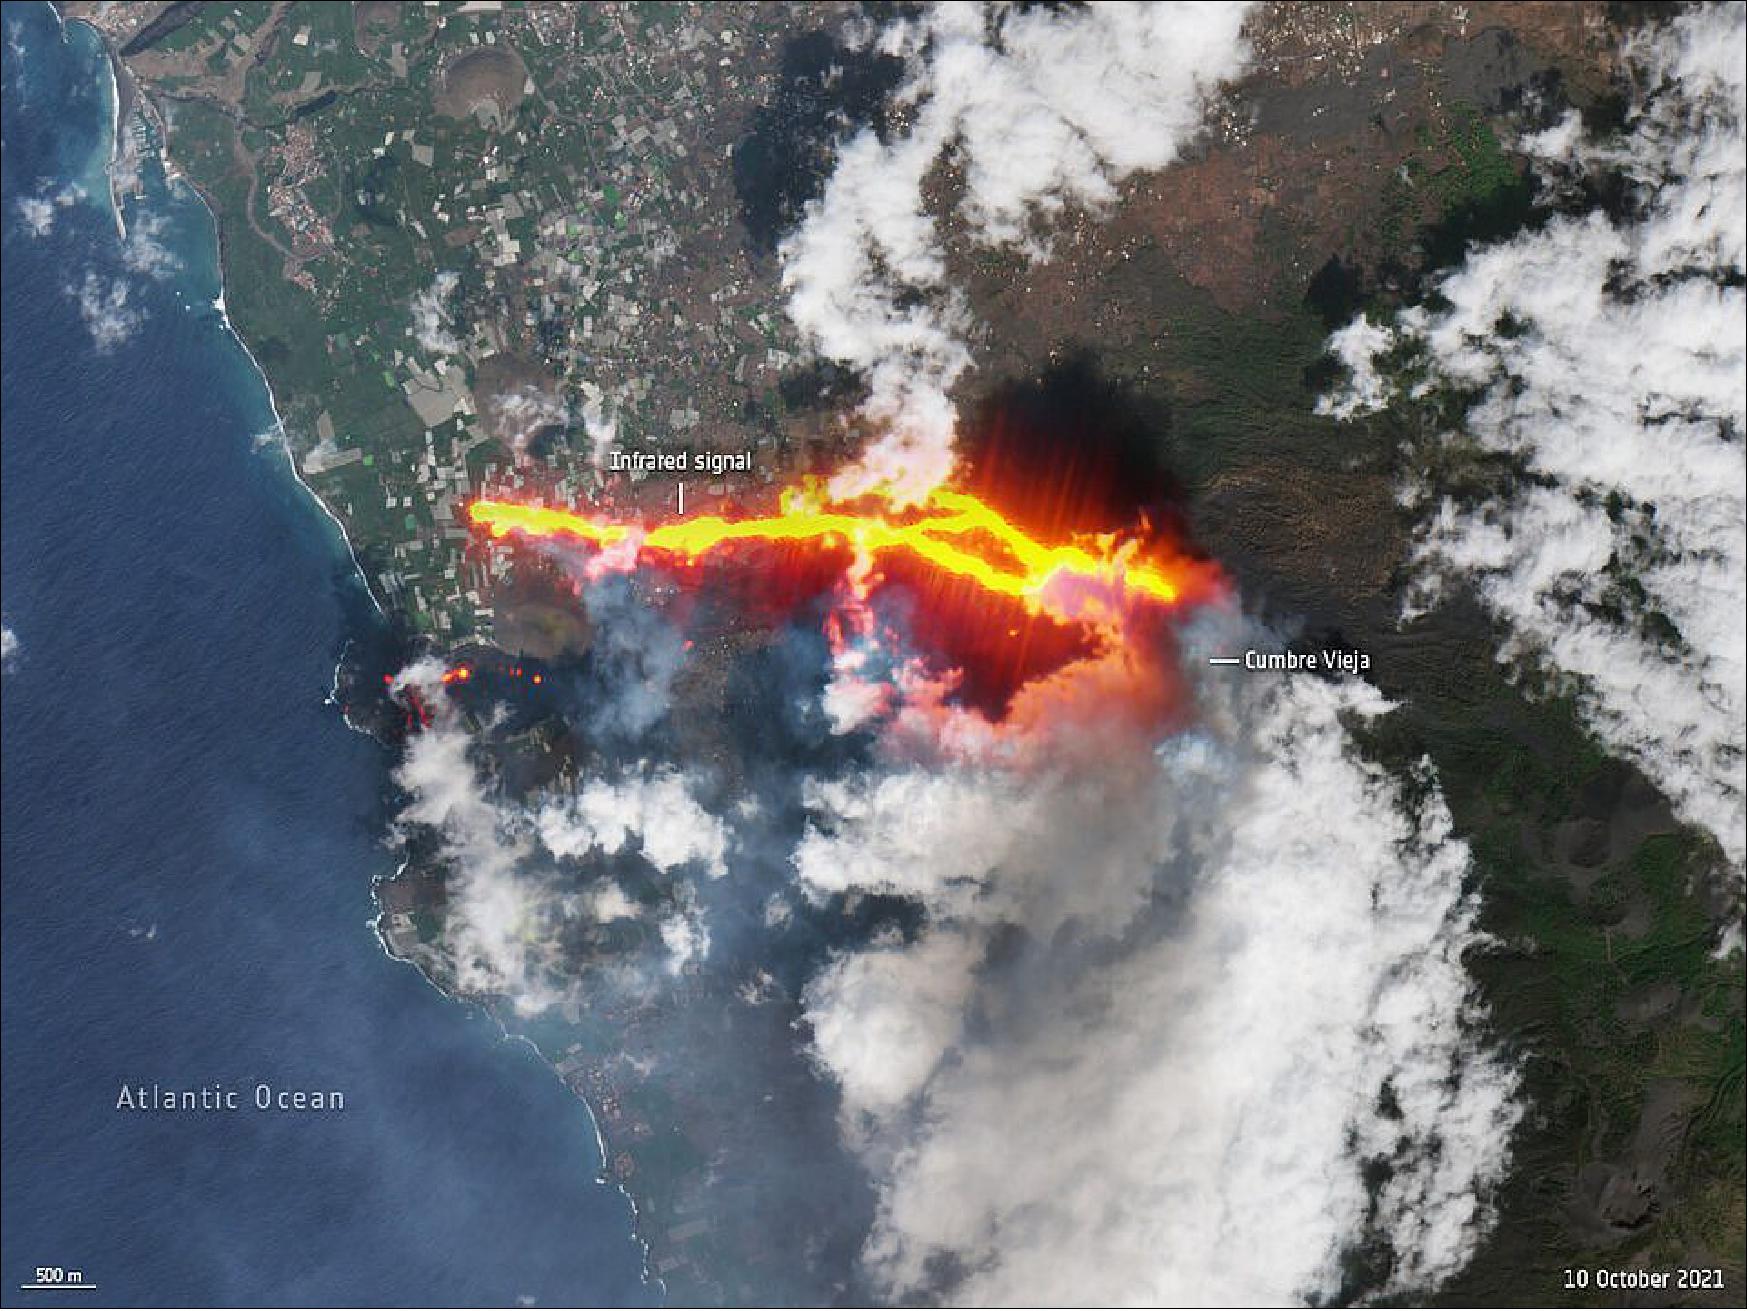
- The Volcanology Institute of the Canary Islands (Involcan) stated that the lava flow, with temperatures up to 1240°C, destroyed the few remaining buildings still standing north of the Todoque neighborhood.
- In response to the ongoing eruption, the Copernicus Emergency Mapping Service was activated. Since its activation, the service has released 17 monitoring mapping products to monitor the lava flow which has affected 497 hectares of land and destroyed over 1100 buildings (as of 8 October).
- Satellites in orbit carry different instruments that provide a wealth of complementary information to better understand volcanic eruptions. Atmospheric sensors can identify the gases and aerosols released by the eruption, as well as quantify their wider environmental impact.
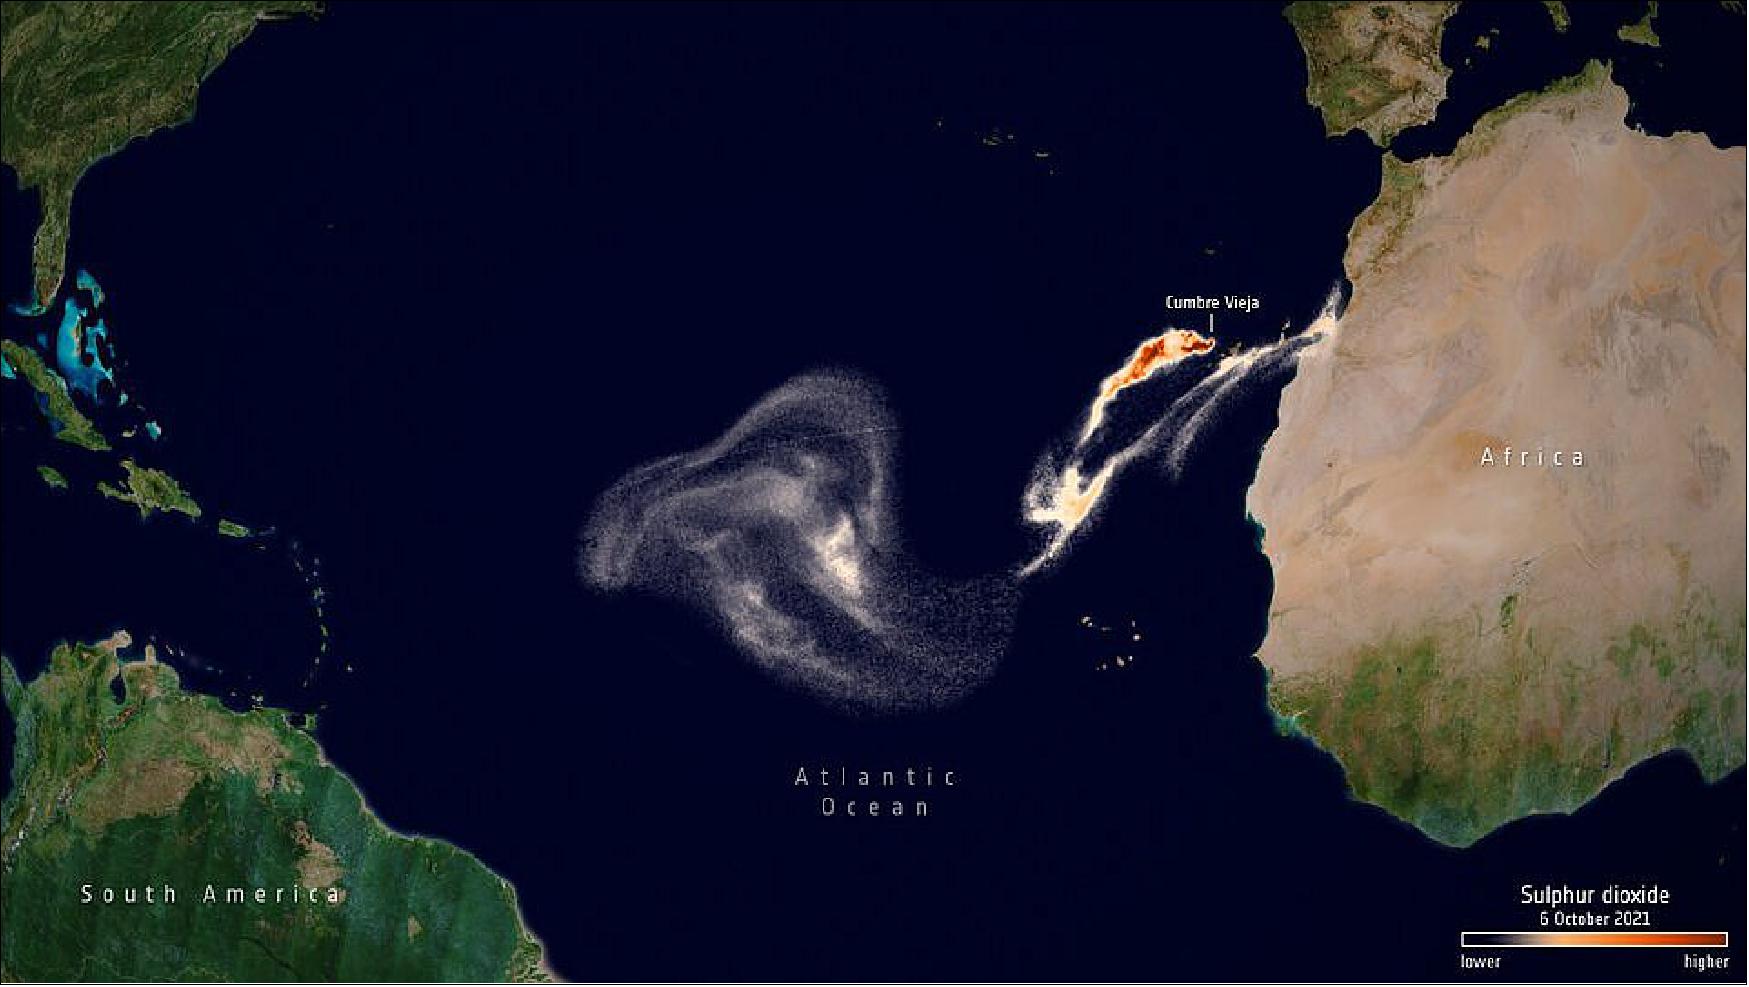
- ESA’s Copernicus Sentinel-5P mission manager, Claus Zehner, comments, “This volcanic eruption demonstrates how Sentinel data can support different operational Copernicus services. Sentinel-5P sulphur dioxide measurements can be used by the Copernicus Atmospheric Monitoring Service to help aviation companies to avoid volcanic ash and sulphur dioxide plume encounters.
- “Sentinel-2 lava flow measurements can support the Copernicus Emergency Management Service in case of natural disasters like a volcanic eruption.”
- Sulphur dioxide concentrations can be monitored using the Copernicus Sentinel-5P Volcanic Sulphur Dioxide online platform. Using data from the Copernicus Sentinel-5P satellite, the platform shows the daily sulphur dioxide concentrations coming primarily from volcanic sources.
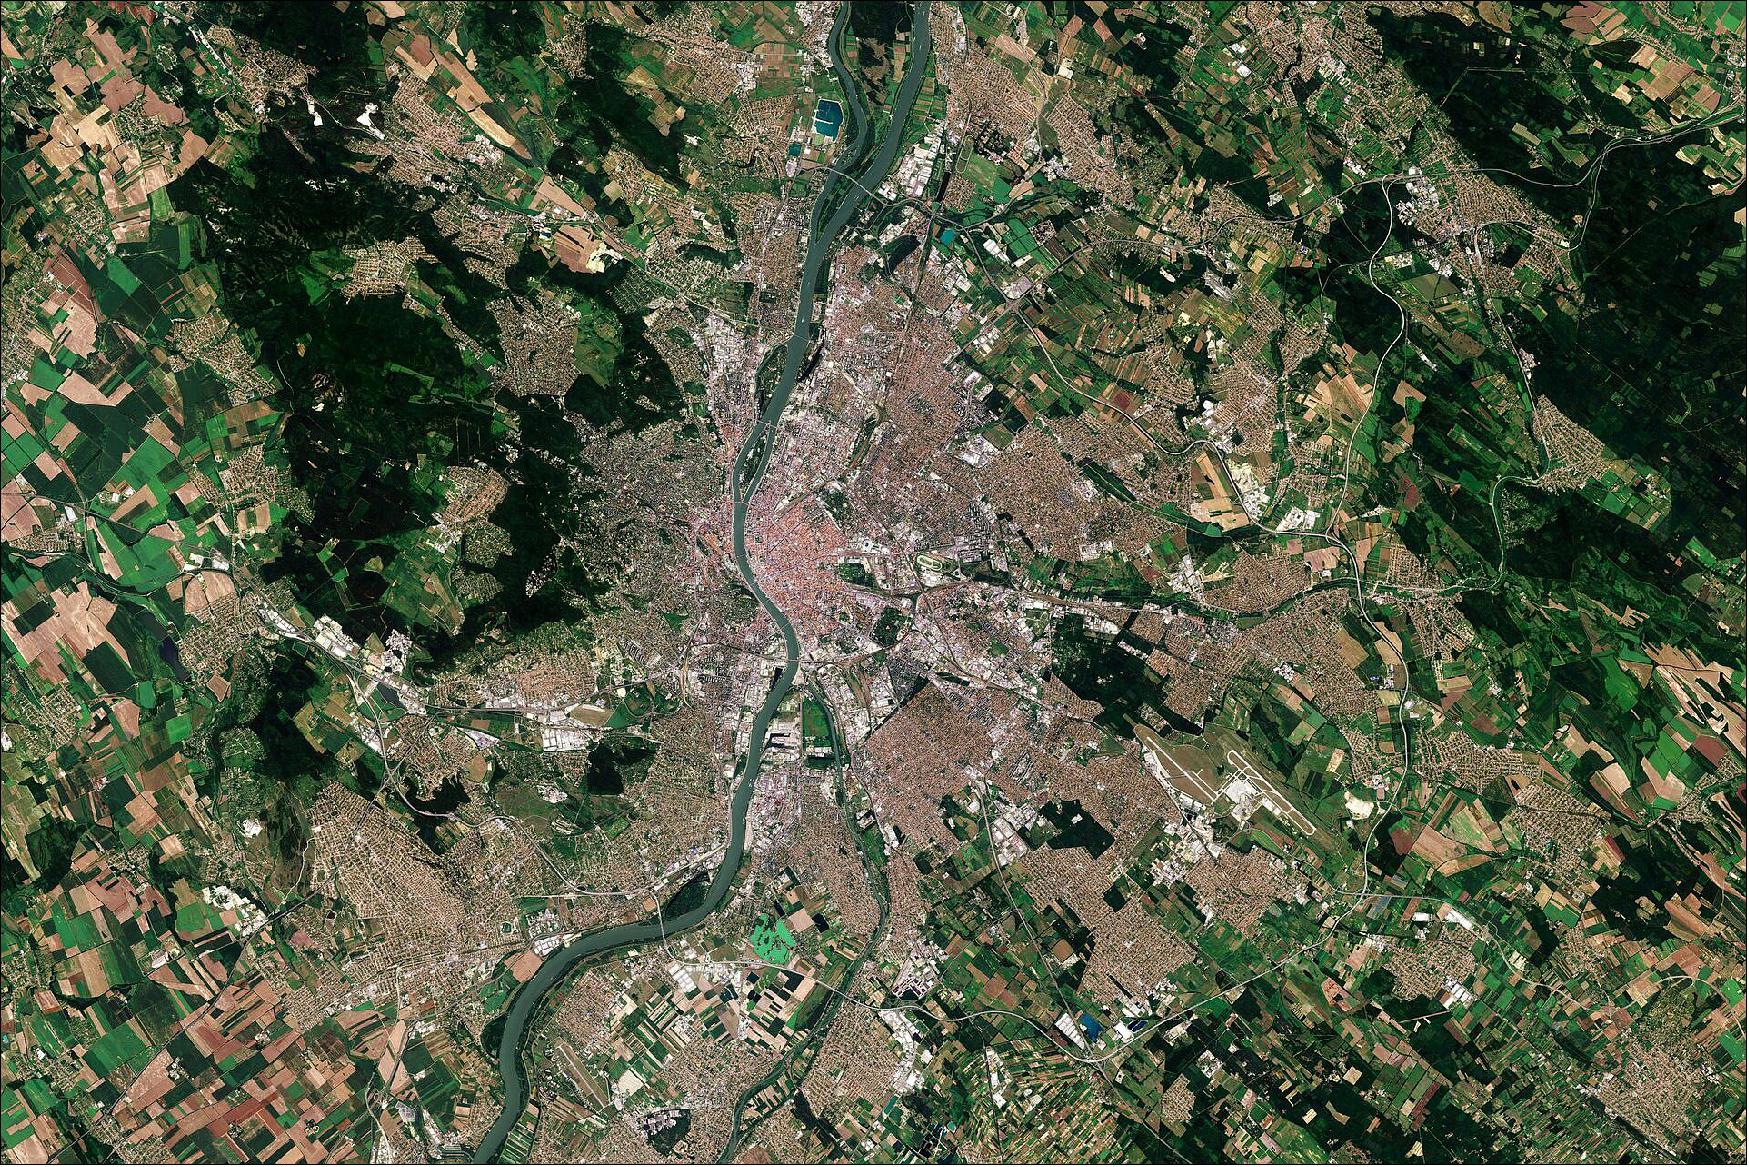
• October 8, 2021: Budapest, the capital and most populous city in Hungary, is visible in this image captured by the Copernicus Sentinel-2 mission. 13)
- Budapest is divided from north to south by the Danube River, the second-longest river in Europe, and it can be seen meandering through the city. The river acts as a natural barrier dividing the city into Buda and Pest, with Buda being on the western, hillier side of the city and Pest on the eastern side.
- Buda and Pest are connected by eight bridges, the oldest and best-known being the Széchenyi Chain Bridge which was built in the 1840s and named after István Széchenyi, a major supporter of its construction.
- In the left of the image, the dark patch of greenery is the Normafa hilltop park mainly known for its panoramic scenery. Agricultural production is important to Hungary’s economy, with around 93,000 km2 of cultivated land covering around 50% of the country’s total area. Hungary’s most important crops include corn, wheat, barley, potatoes and sunflower seeds.
- Copernicus Sentinel-2 is the first optical Earth observation mission of its kind to include three infrared bands in the ‘red edge’ part of the electromagnetic spectrum – which provides a more detailed view of the state of vegetation than what our eyes can see. This allows for Sentinel-2 to provide images that can be used to distinguish between different crop types as well as data on numerous plant indices, such as leaf area index, leaf chlorophyll content and leaf water content – all of which are essential to accurately monitor plant growth.
• October 1, 2021: A crack opened in the Cumbre Vieja volcano on 19 September, throwing plumes of ash and lava into the air. Lava flowed down the mountain and through villages engulfing everything in its path. By 28 September, the 6-km lava flow had reached the ocean on the island’s west coast. Clouds of white steam were reported where the red-hot lava hit the water in the Playa Nueva area. 14)
- This Sentinel-2 image has been processed in true color, using the shortwave infrared channel to highlight the lava flow. The Sentinel-2 mission is based on a constellation of two identical satellites, each carrying an innovative wide swath high-resolution multispectral imager with 13 spectral bands for monitoring changes in Earth’s land and vegetation.
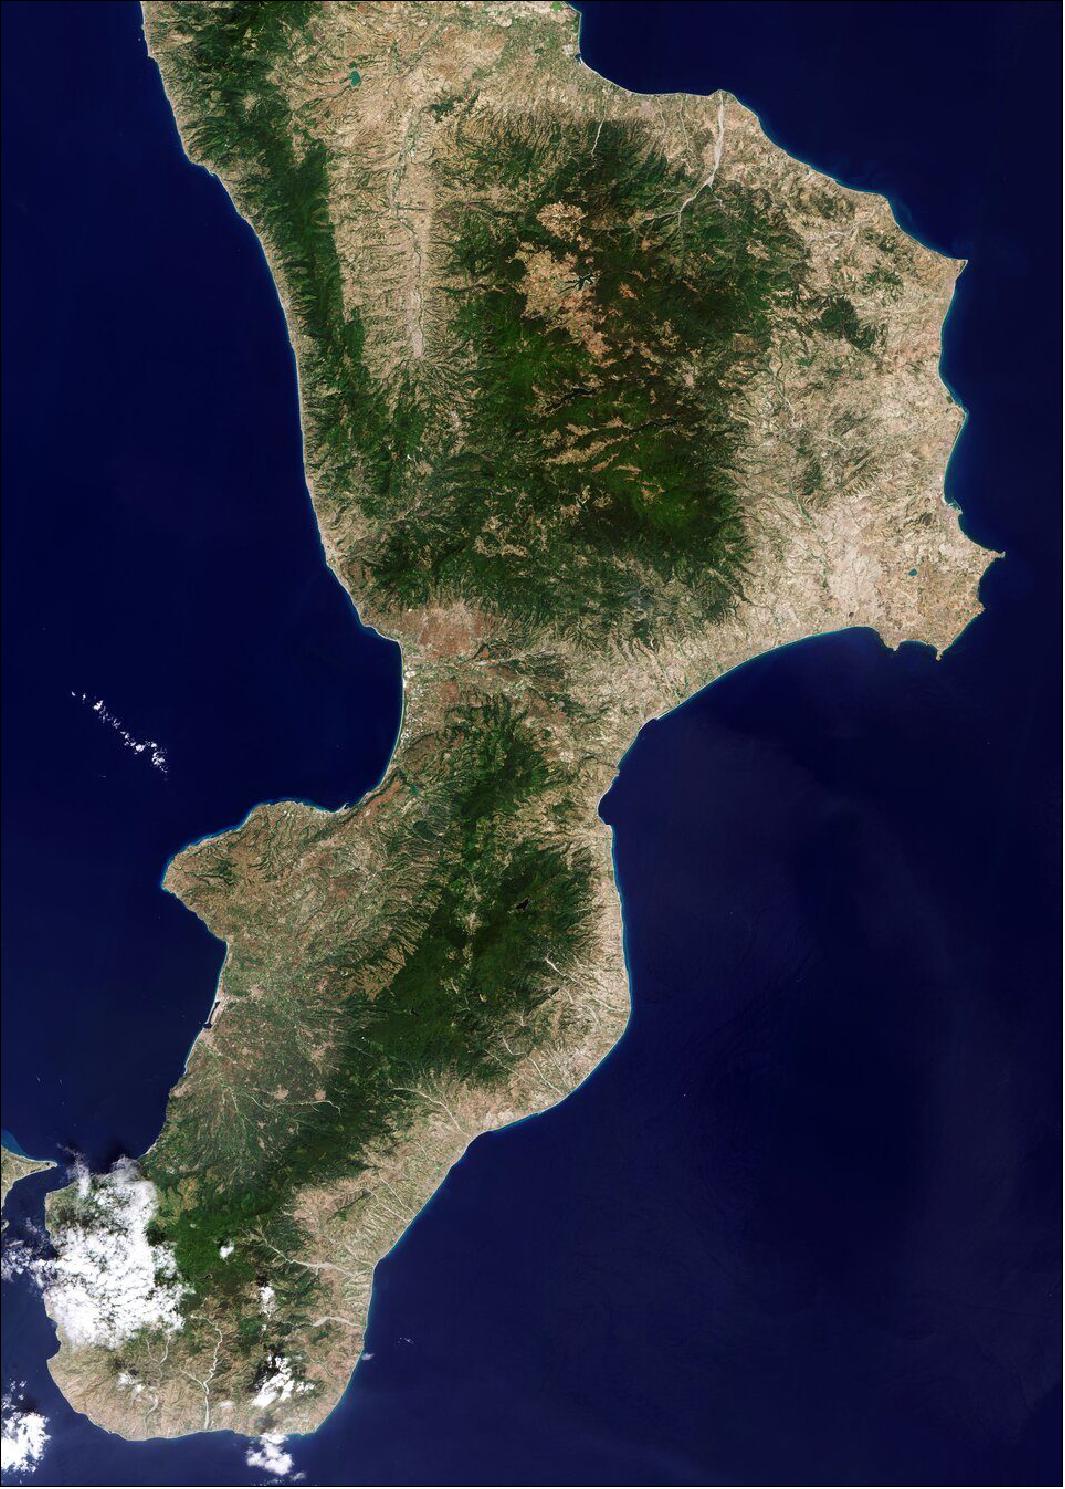
• September 24, 2021: Calabria, often referred to as the ‘boot’ of Italy, is featured in this image captured by the Copernicus Sentinel-2 mission. 15)
- Calabria is a region in southern Italy, famous for its irregular shape that stretches from north to south for around 250 km – separating the Tyrrhenian Sea to the west and the Ionian Sea to the east. The region covers an area of around 15 000 km2 (with over 740 km of coastline) of which agricultural land covers 49%.
- Most of the region is mountainous or hilly with three mountain ranges present: Pollino (not visible), La Sila and Aspromonte.
- La Sila is a vast mountainous plateau around 1200 m above sea level, stretching for nearly 2000 km2 along the central area of Calabria. The highest point is Botte Donato, which reaches around 1928 m. The Aspromonte massif forms the southernmost tip of the Italian peninsula bordered by the sea on three sides. The highest peak is Montalto at 1955 m.
- Calabria is separated from Sicily by the Strait of Messina, visible in the bottom-left, where the narrowest point between Capo Peloro in Sicily and Punta Pezzo in Calabria is only around 3.2 km.
- Almost 2 million people reside in Calabria, with Reggio Calabria being the most populous city in the region (with an estimated population of around 200,000 people). The city lies on the ‘toe’ of the Italian Peninsula, on the slopes of the Aspromonte mountain range.
- Calabria is known for its tourism, with its main attractions being the rugged cliffs and sandy beaches. Some of these main destinations include Tropea, Scilla, Lamezia Terme and Praia a Mare.
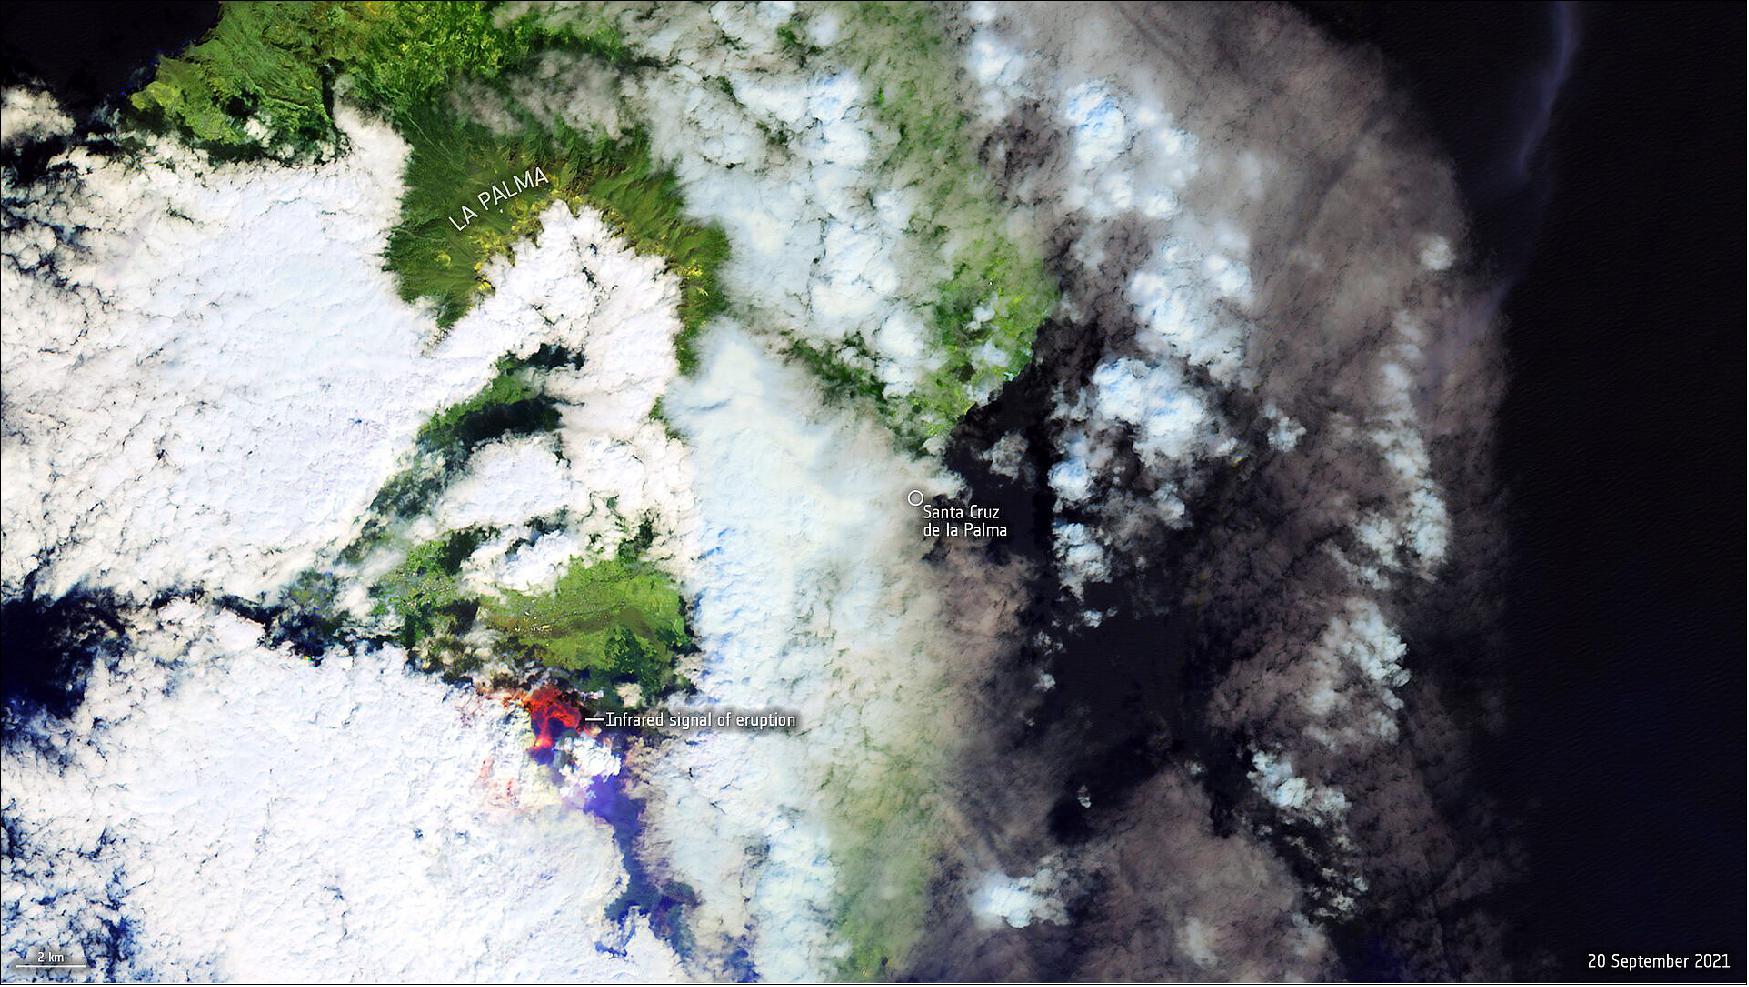
• September 22, 2021: The Copernicus Sentinel-2 mission shows us a cloudy view of the Cumbre Vieja volcano on the Spanish Canary Island of La Palma. The volcano started erupting on 19 September after days of small tremors. 16)
- The Copernicus Emergency Mapping Service has been activated. The service uses satellite observations to help civil protection authorities and, in cases of disaster, the international humanitarian community, respond to emergencies.
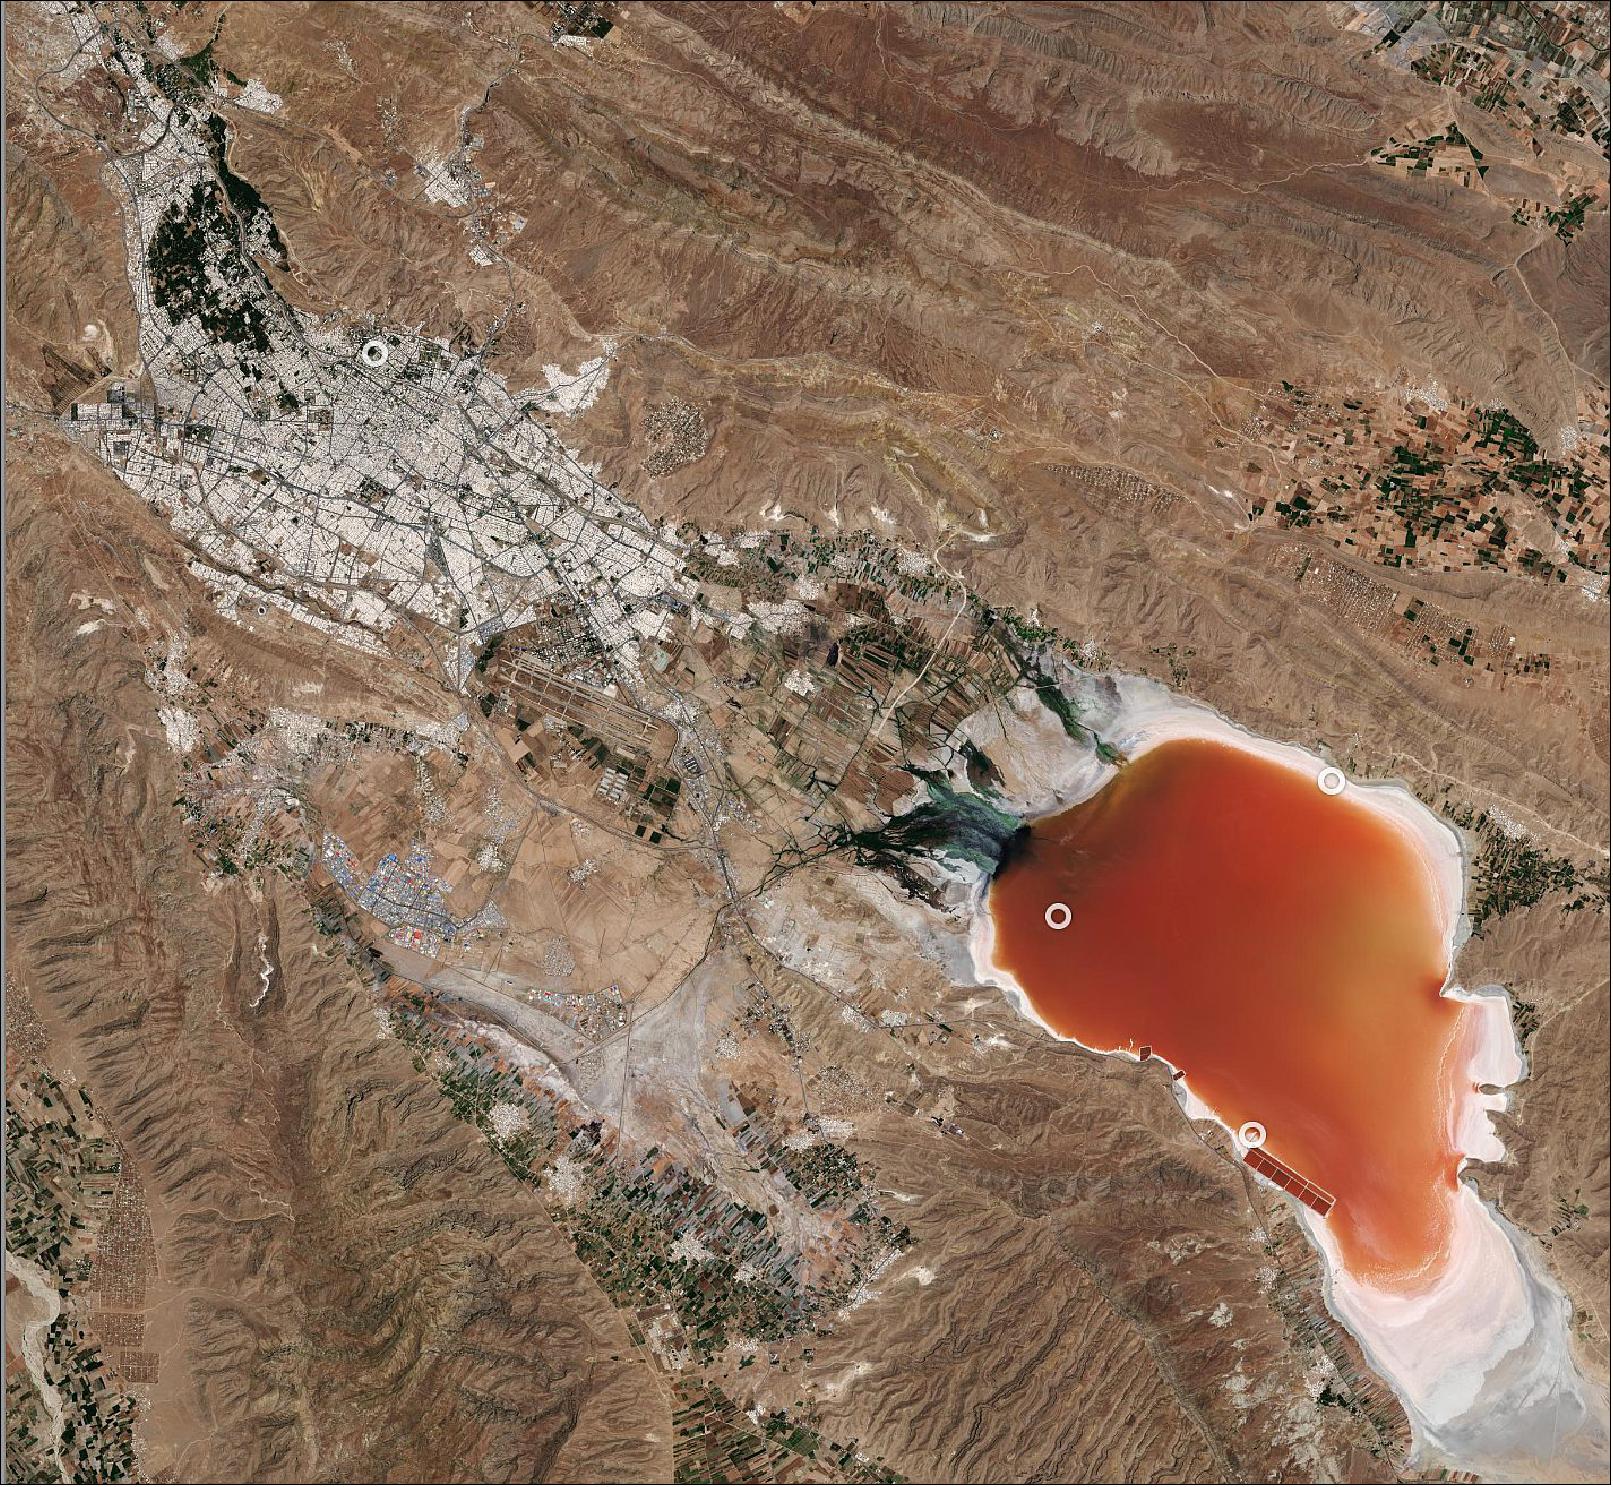
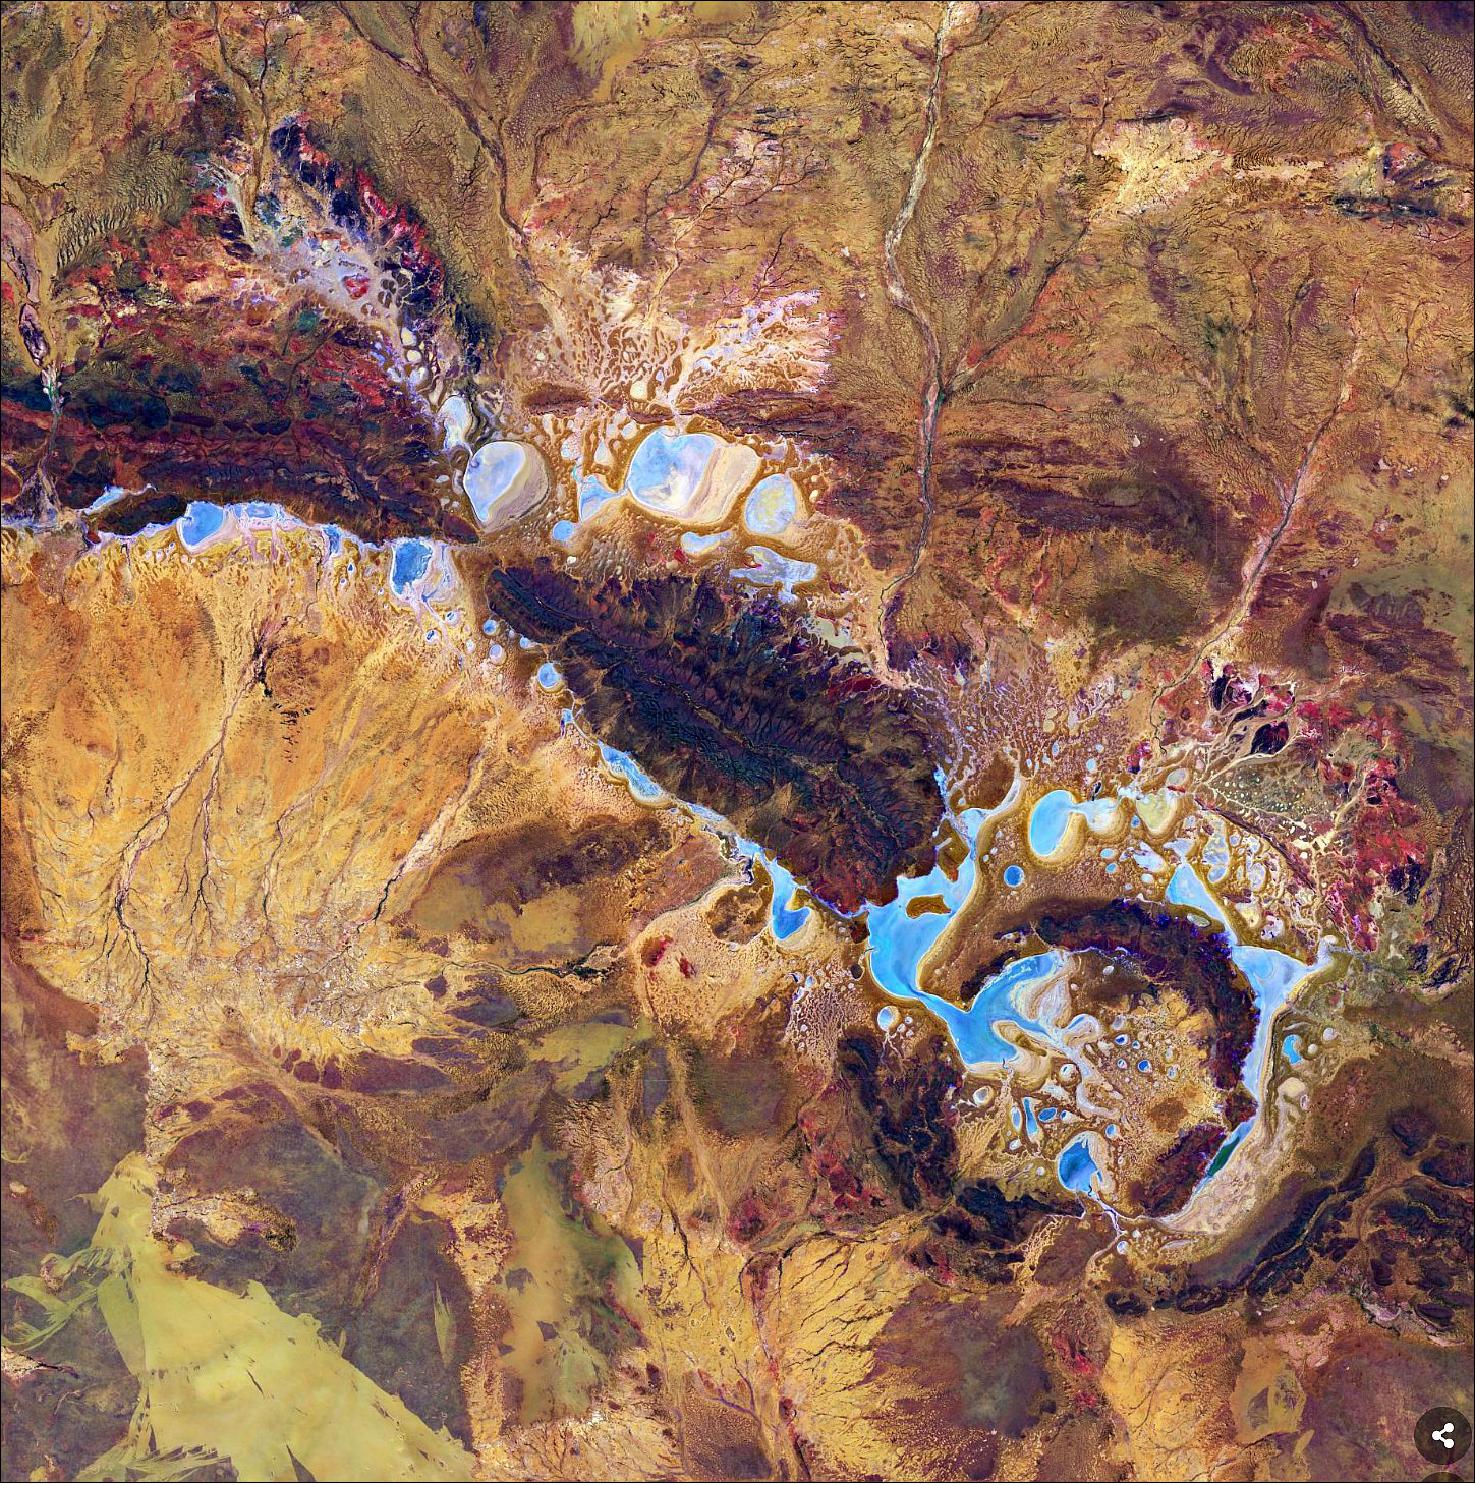
• September 17, 2021: Maharloo Lake, a seasonal salt lake in Iran, is featured in this image captured by the Copernicus Sentinel-2 mission. 17)
- Maharloo sits at an altitude of around 1400 m above sea level and is located around 27 km southeast of Shiraz, in southwest Iran. Yearly evaporation in the desert region is much greater than the yearly rainfall, meaning the lake is often very dry.
- Owing to the high evaporation rate, the lake’s bed has been covered by salt over time. This increased salinity in the lake’s waters has allowed certain algae to thrive and cover the surface. The water includes a variety of organisms that display colors ranging from pink to orange to red, with the strength of the color differing in various periods of the year. Usually, the deeper the lake is, the darker the colors of the water.
- As is the case with many desert lakes, salt washed down from the surrounding mountains accumulates and can be seen in the image as a white crust along the lake’s shores. In some parts of the lake, facilities have been built for salt extraction (visible in this image along the southern shore).
- The lake’s excessive salinity prevents organisms, especially fish, from living in the lake. However, some birds migrate to Maharloo during the summer months, including flamingo. Shiraz, visible in the top-left of the image, is the fourth-most-populous city of Iran. Shiraz International Airport can be seen just south of the city.
- With its 13 spectral channels, the Copernicus Sentinel-2’s novel imager can capture water quality parameters such as the surface concentration of chlorophyll, detect harmful algal blooms, and measure turbidity (or water clarity) – giving a clear indication of the health and pollution levels.
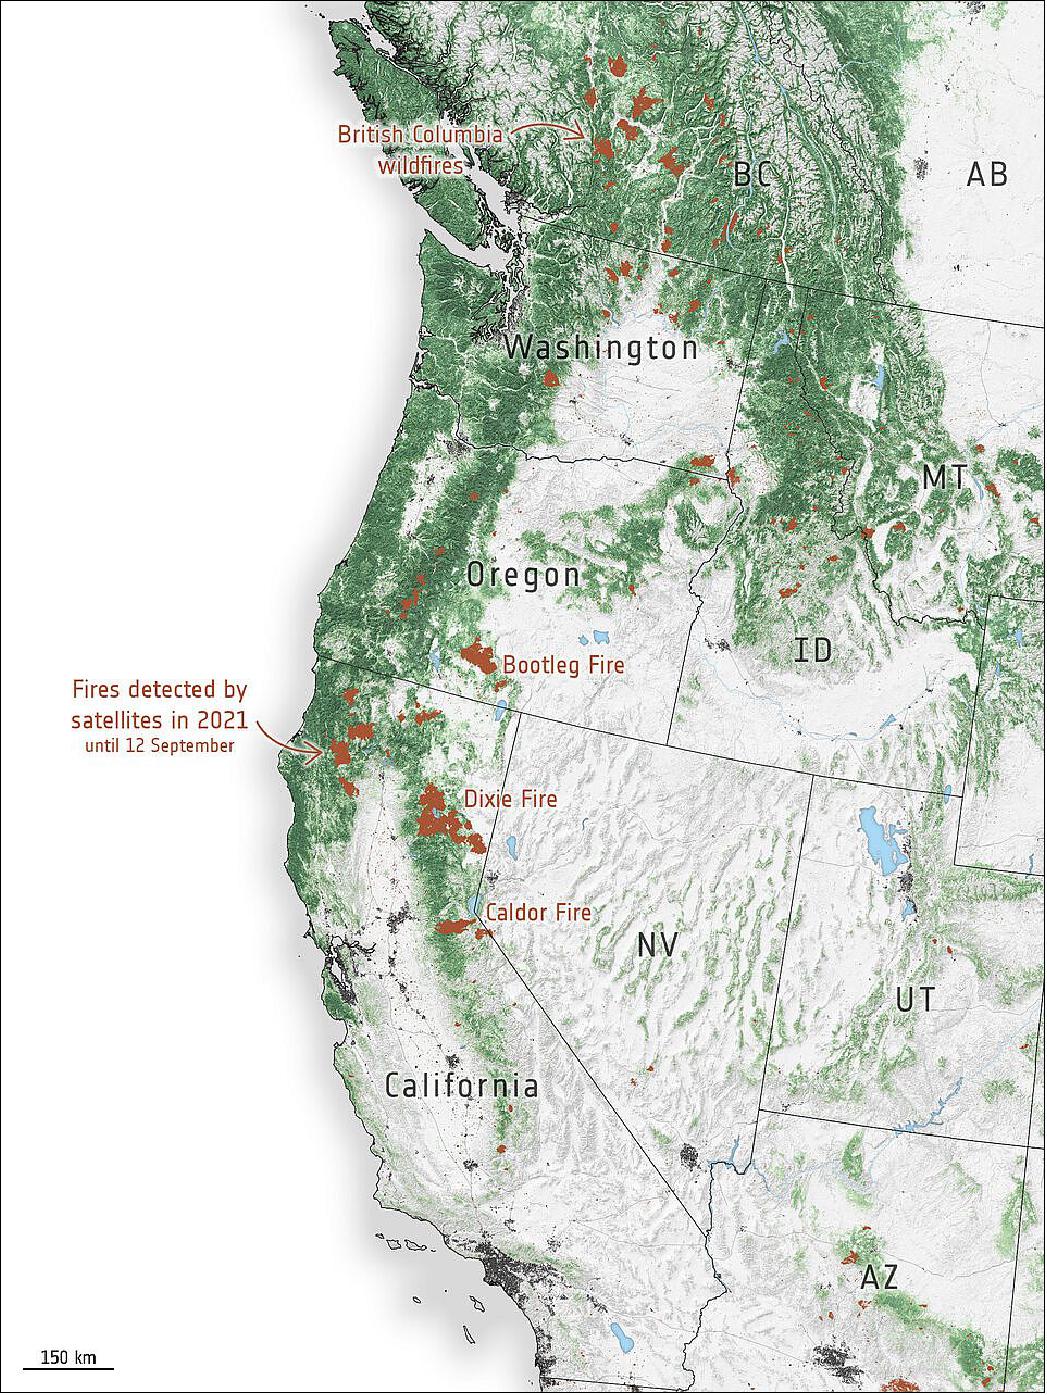
• September 15, 2021: While wildfires are a natural part of California’s landscape, a severe drought, coupled with extreme temperatures, have sustained several major fires for much of August. As of 14 September, more than 7000 wildfires have been recorded, burning over 900,000 hectares across the state. 18)
- The Dixie megablaze, the largest wildfire of the 2021 fire season and the second-largest blaze in recorded state history, has burned more than 388,000 hectares of mainly forested land and has destroyed more than 1200 buildings on its path. The fire, named after the road where it started, began on 13 July in the Feather River Canyon, and as of 14 September, is only 75% contained.
- With thousands of firefighters continuing to battle the blaze, several were diverted to help harness the nearby Caldor Fire which has burned more than 88,700 hectares, threatening communities near Lake Tahoe before crossing the state’s border over to Nevada.
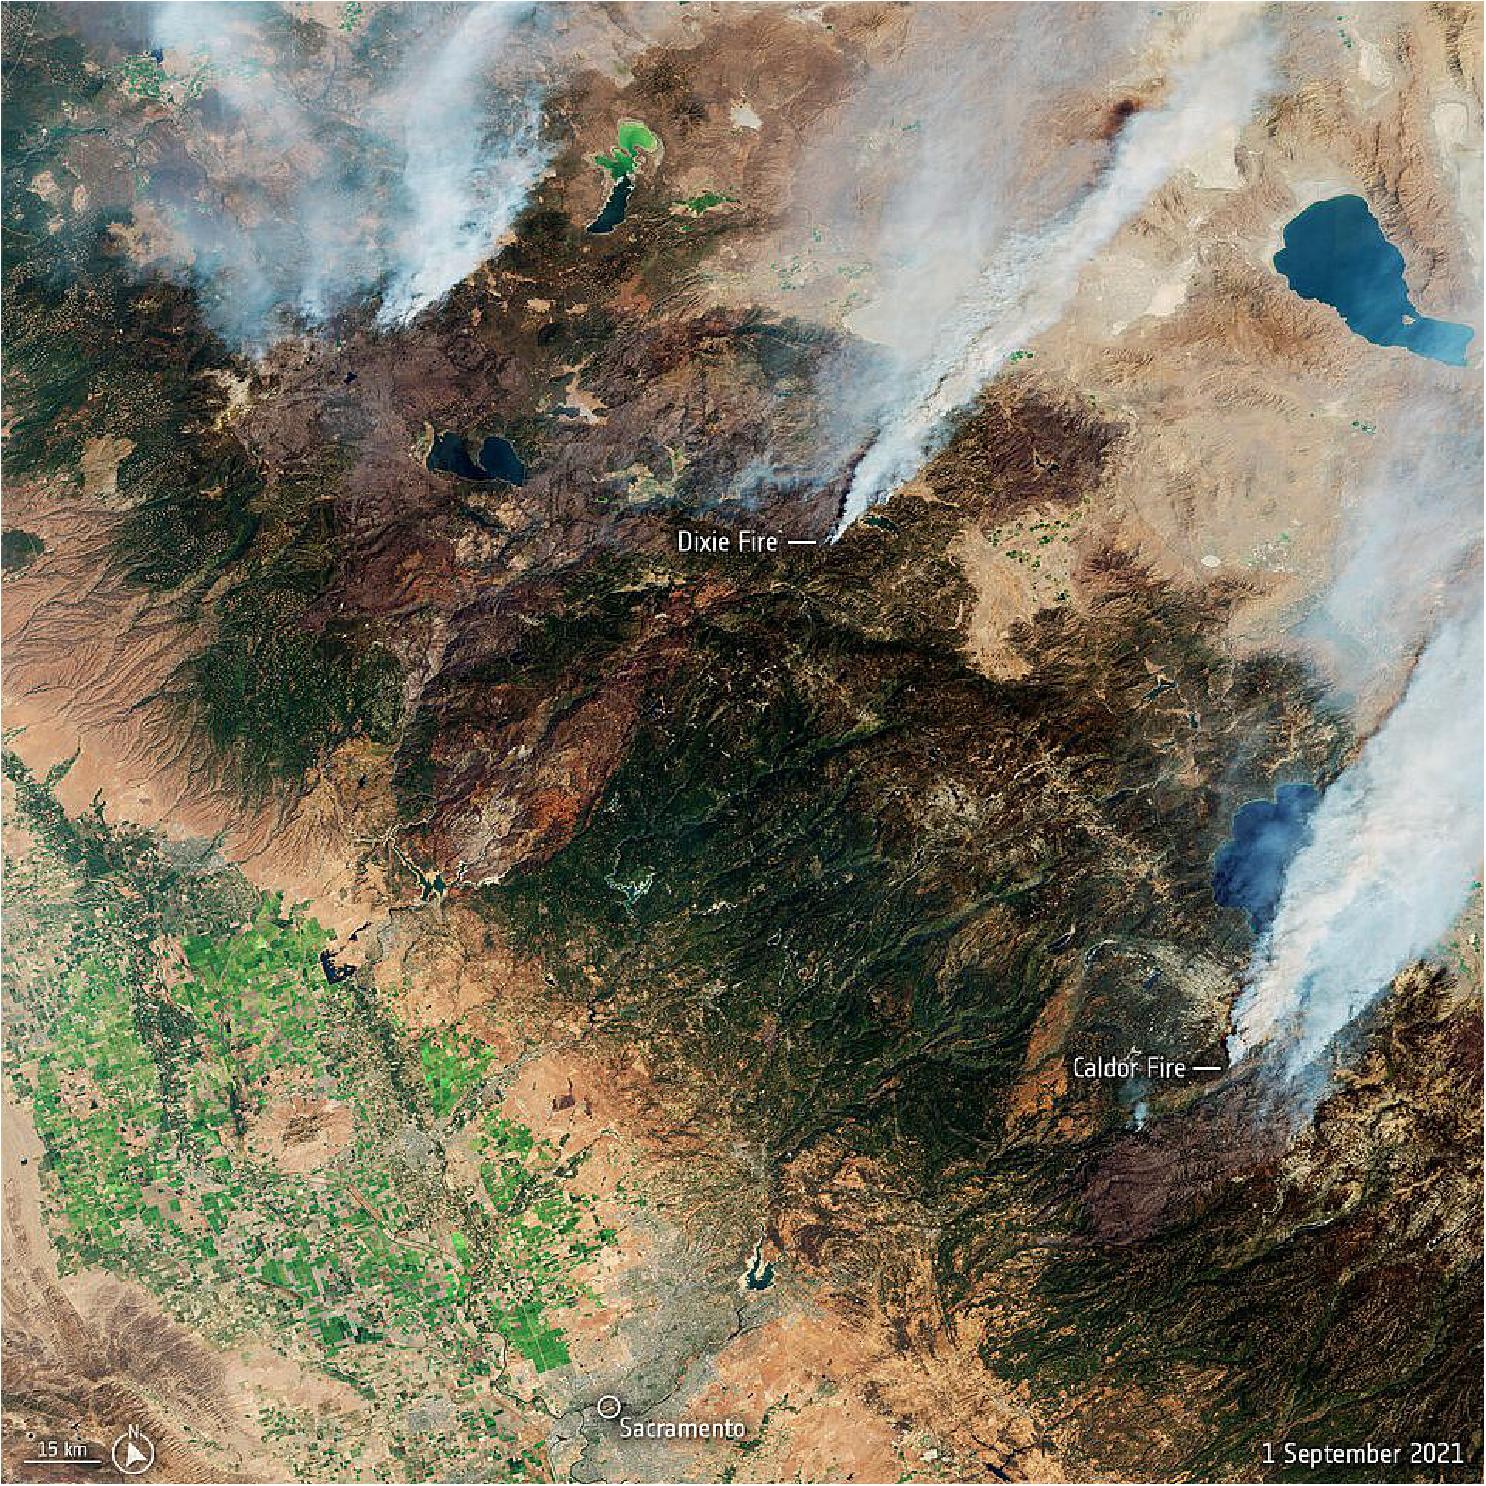
- The Copernicus Sentinel-2 mission has been used to image the fires. The Sentinel-2 satellites each carry just one instrument – a high-resolution multispectral imager with 13 spectral bands. Captured on 1 September, the smoke and burn scars of the Caldor and Dixie Fires are visible in this image.
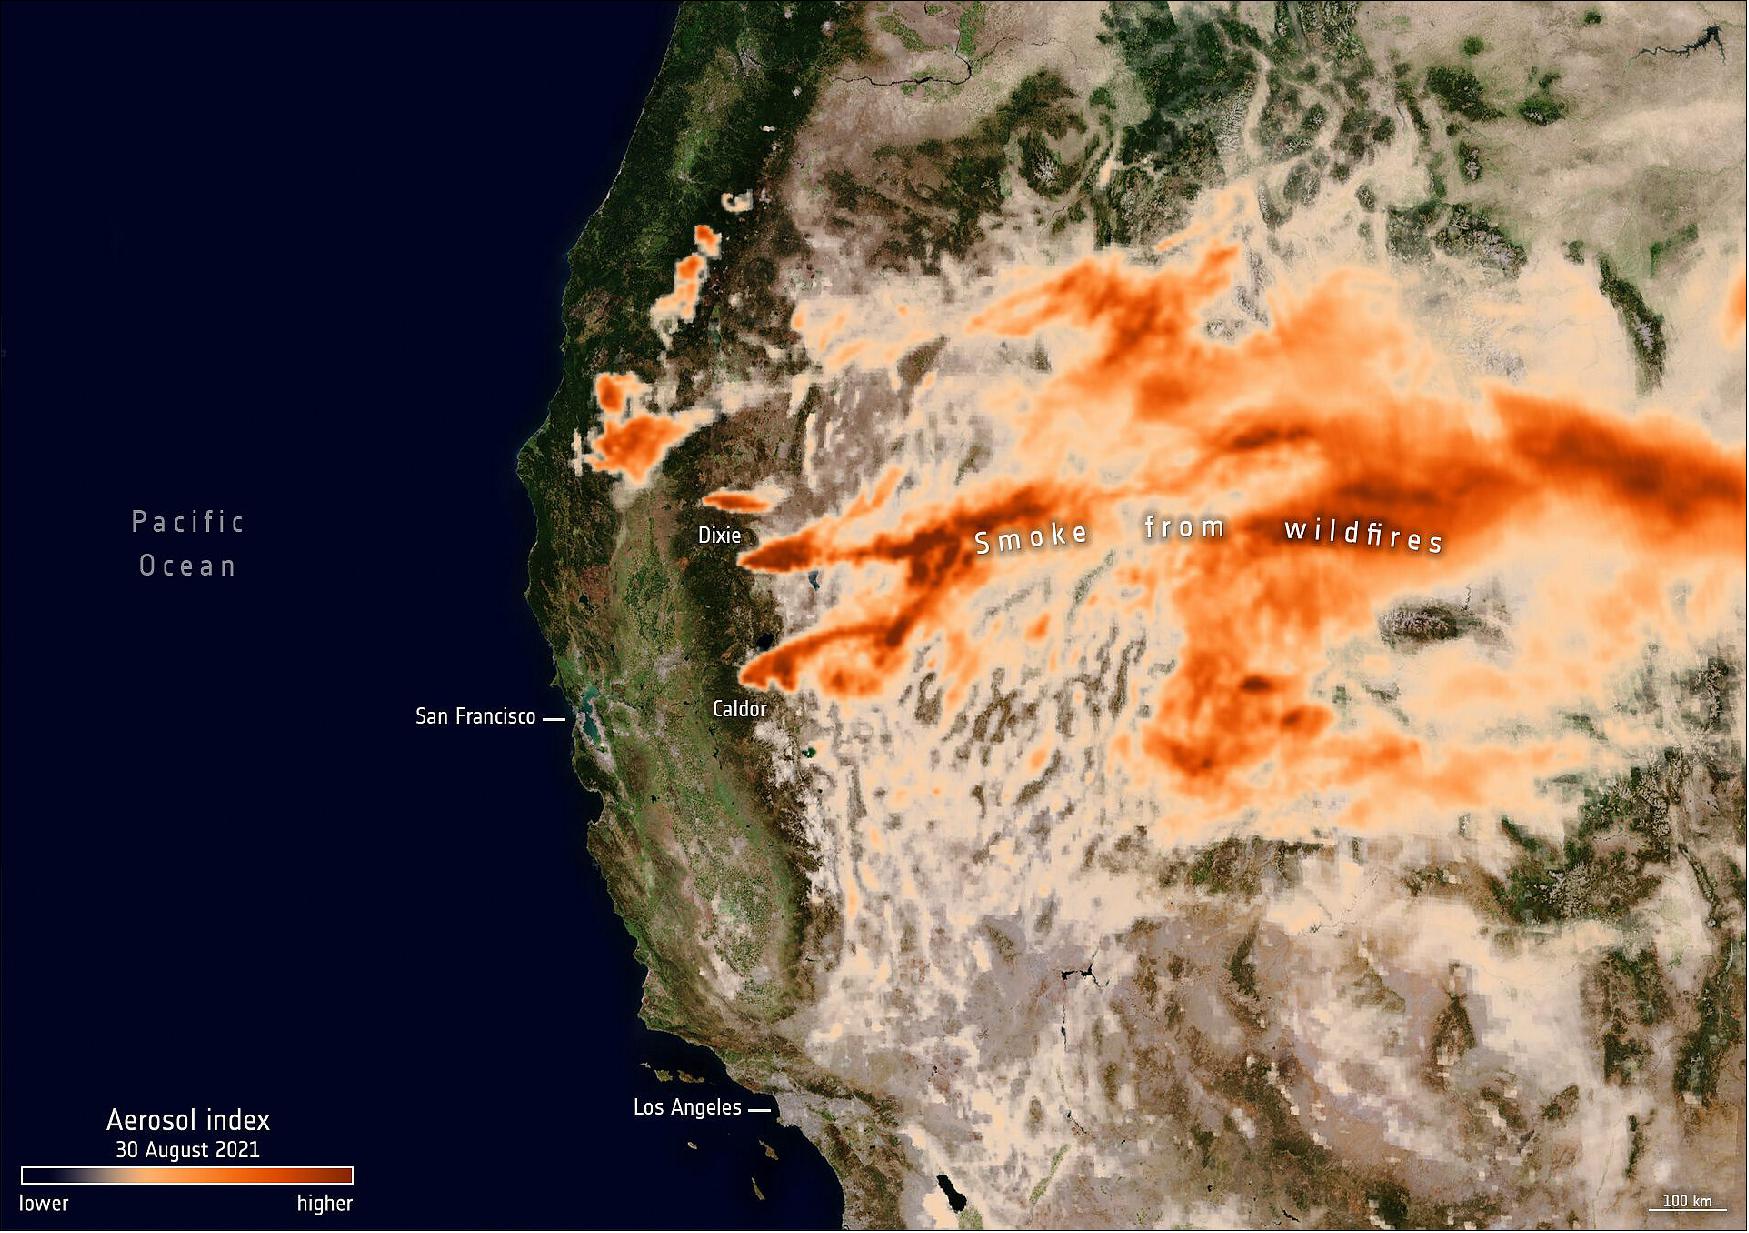
- According to the Copernicus Atmosphere Monitoring Service (CAMS), smoke from the fires in North America has been transported across the continent and out over the Atlantic Ocean towards Europe yet is unlikely to affect Europeans as it is high up in the atmosphere. The smoke has, however, impacted air quality across the US and Canada, where it was much closer to the surface.
- The Copernicus Sentinel-5P satellite is dedicated to monitoring air pollution by measuring a multitude of trace gases that affect the air we breathe. Images captured on 30 August show the presence of aerosols in the atmosphere caused by the fires. The plumes continued their journey eastwards, across the US even reaching Europe.
- Claus Zehner, ESA’s Copernicus Sentinel-5P mission manager, says, “Copernicus satellites like Sentinel-2, Sentinel-3 and Sentinel-5P allow on one hand the point source detection of fires, and on the other hand, to monitor the movement of the emitted air pollutants over different states in the US and even to another continent like Europe.”
![Figure 24: California fire history. The Dixie megablaze, the largest wildfire of the 2021 fire season and the second-largest blaze in recorded state history, has burned more than 388,000 hectares of mainly forested land and has destroyed more than 1200 buildings on its path. The fire, named after the road where is started, began on 13 July in the Feather River Canyon, and as of 14 September, is only 75% contained [image credit: ESA, (Data: CAL FIRE)]](https://eoportal.org/ftp/satellite-missions/c/S2-2021_050422/S2-2021_Auto35.jpeg)
- As the fires continue to burn, hot and dry conditions and forecasted thunderstorms have prompted officials to issue warnings through part of the state’s northwest coast.
- Climate change is considered a key driver of this trend. In a recent report from the Intergovernmental Panel on Climate Change (IPCC), scientists concluded that that there is an unequivocal link between human activity and global warming. The report pointed to observations showing increases in drought and fires in the western United States, expecting this trend to continue in the future.
• September 10, 2021: The Copernicus Sentinel-2 mission takes us over the Danube Delta – the second largest river delta in Europe. 19)
- The Danube Delta is a labyrinth of water and land shared between Romania and Ukraine, made up of countless lakes, channels and islands lying at the end of the 2860 km-long river of the same name. The Danube River rises in the Black Forest mountains in Germany and along its course, passes through 10 countries: Germany, Austria, Slovakia, Hungary, Croatia, Serbia, Bulgaria, Romania, Moldova and Ukraine before emptying into the Black Sea.
- The Danube Delta covers an area of some 4300 km2 and is known for its abundance of birdlife, as it hosts more than 300 species of birds as well as 45 species of freshwater fish in its numerous lakes and marshes. In 1991, the Romanian part of the Danube Delta became part of UNESCO’s list of World Heritage Sites.
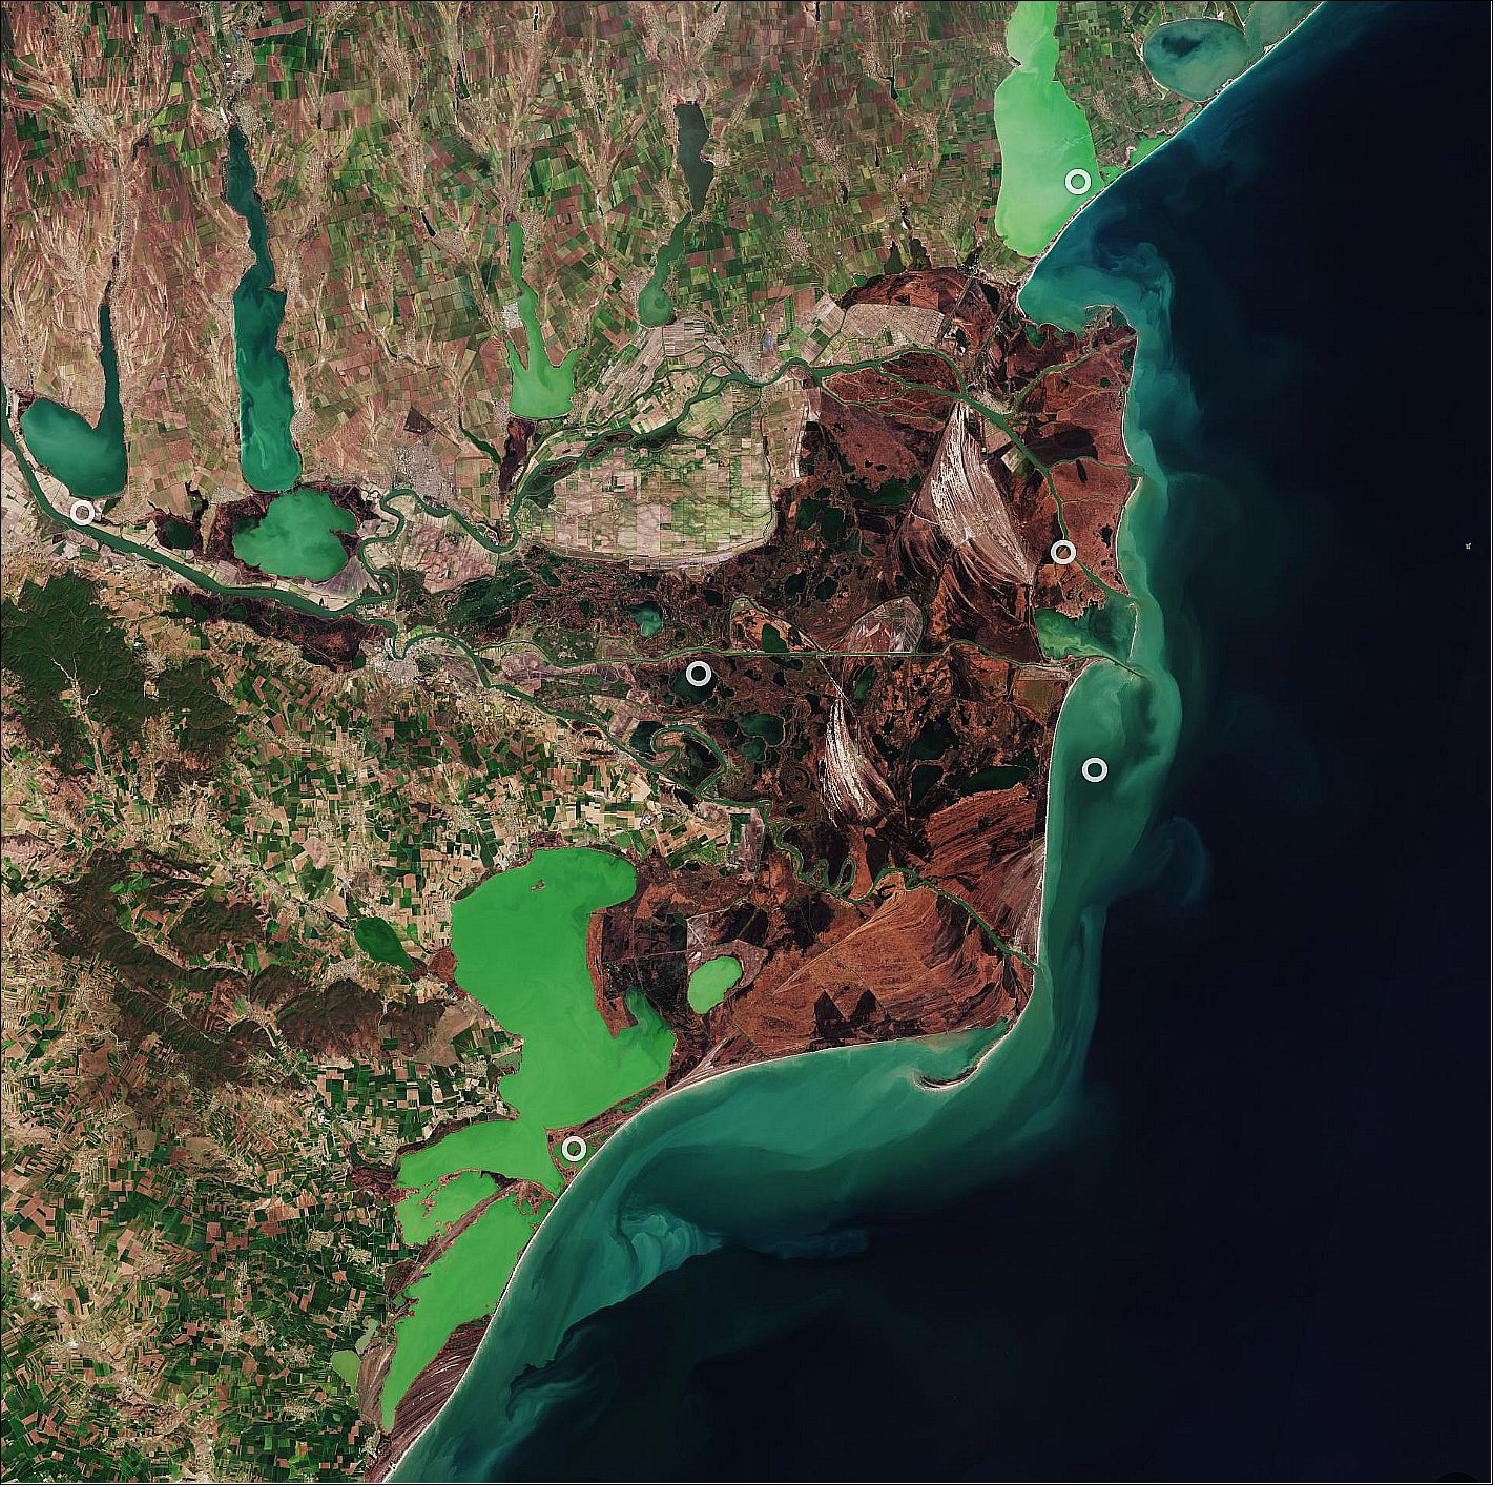
- Just south of the Danube Delta lie the lagoons of Razim (Razelm) and Sinoe, visible in emerald green owing to a high concentration of algae. This lagoon complex was formed with the help of the Danube’s alluvial deposits and the gradual eastward movement of the coastal currents caused by the advancement of the delta.
- In the top-right of the image lies the Sasyk, or Kunduk, Lagoon in southern Ukraine. The site has been designated as Ramsar Wetland Site as it is important for migrating, breeding and moulting waterbirds.
- Data gathered by the Sentinel-2 satellites are used for monitoring land use and changes, land management, agriculture, forestry and natural disasters (floods, forest fires, landslides and erosion). Offering color vision for the Copernicus program, Sentinel-2 delivers optical images from the visible to short-wave infrared range of the electromagnetic spectrum.
• August 18, 2021: The Mediterranean heatwave has seen some countries record their highest temperature in decades. Wildfires have also been raging in other parts of Greece, Italy, Albania and Algeria, prompting activations in the Copernicus Emergency Mapping Service. The mapping service uses data from satellites to aid response to disasters such as wildfires and floods. 20)
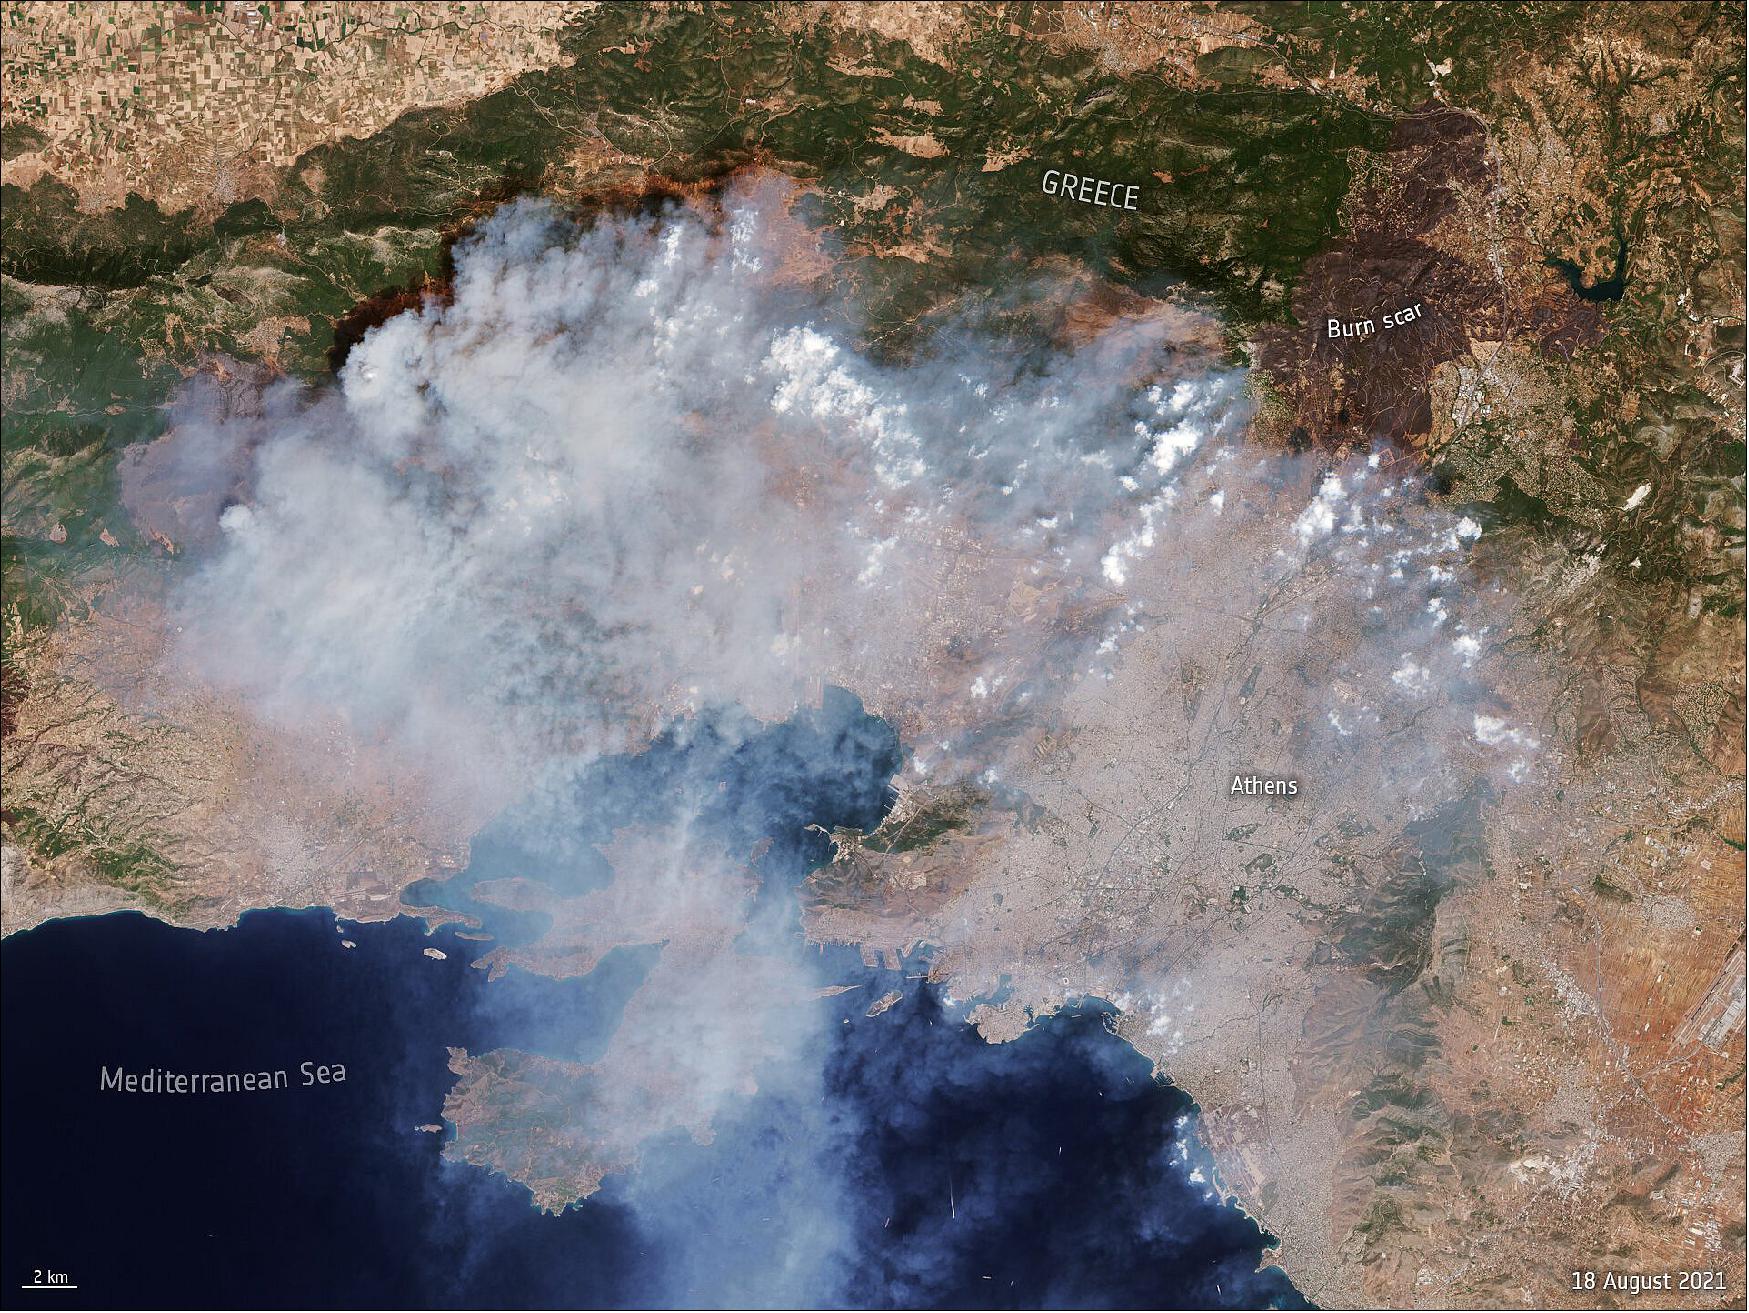
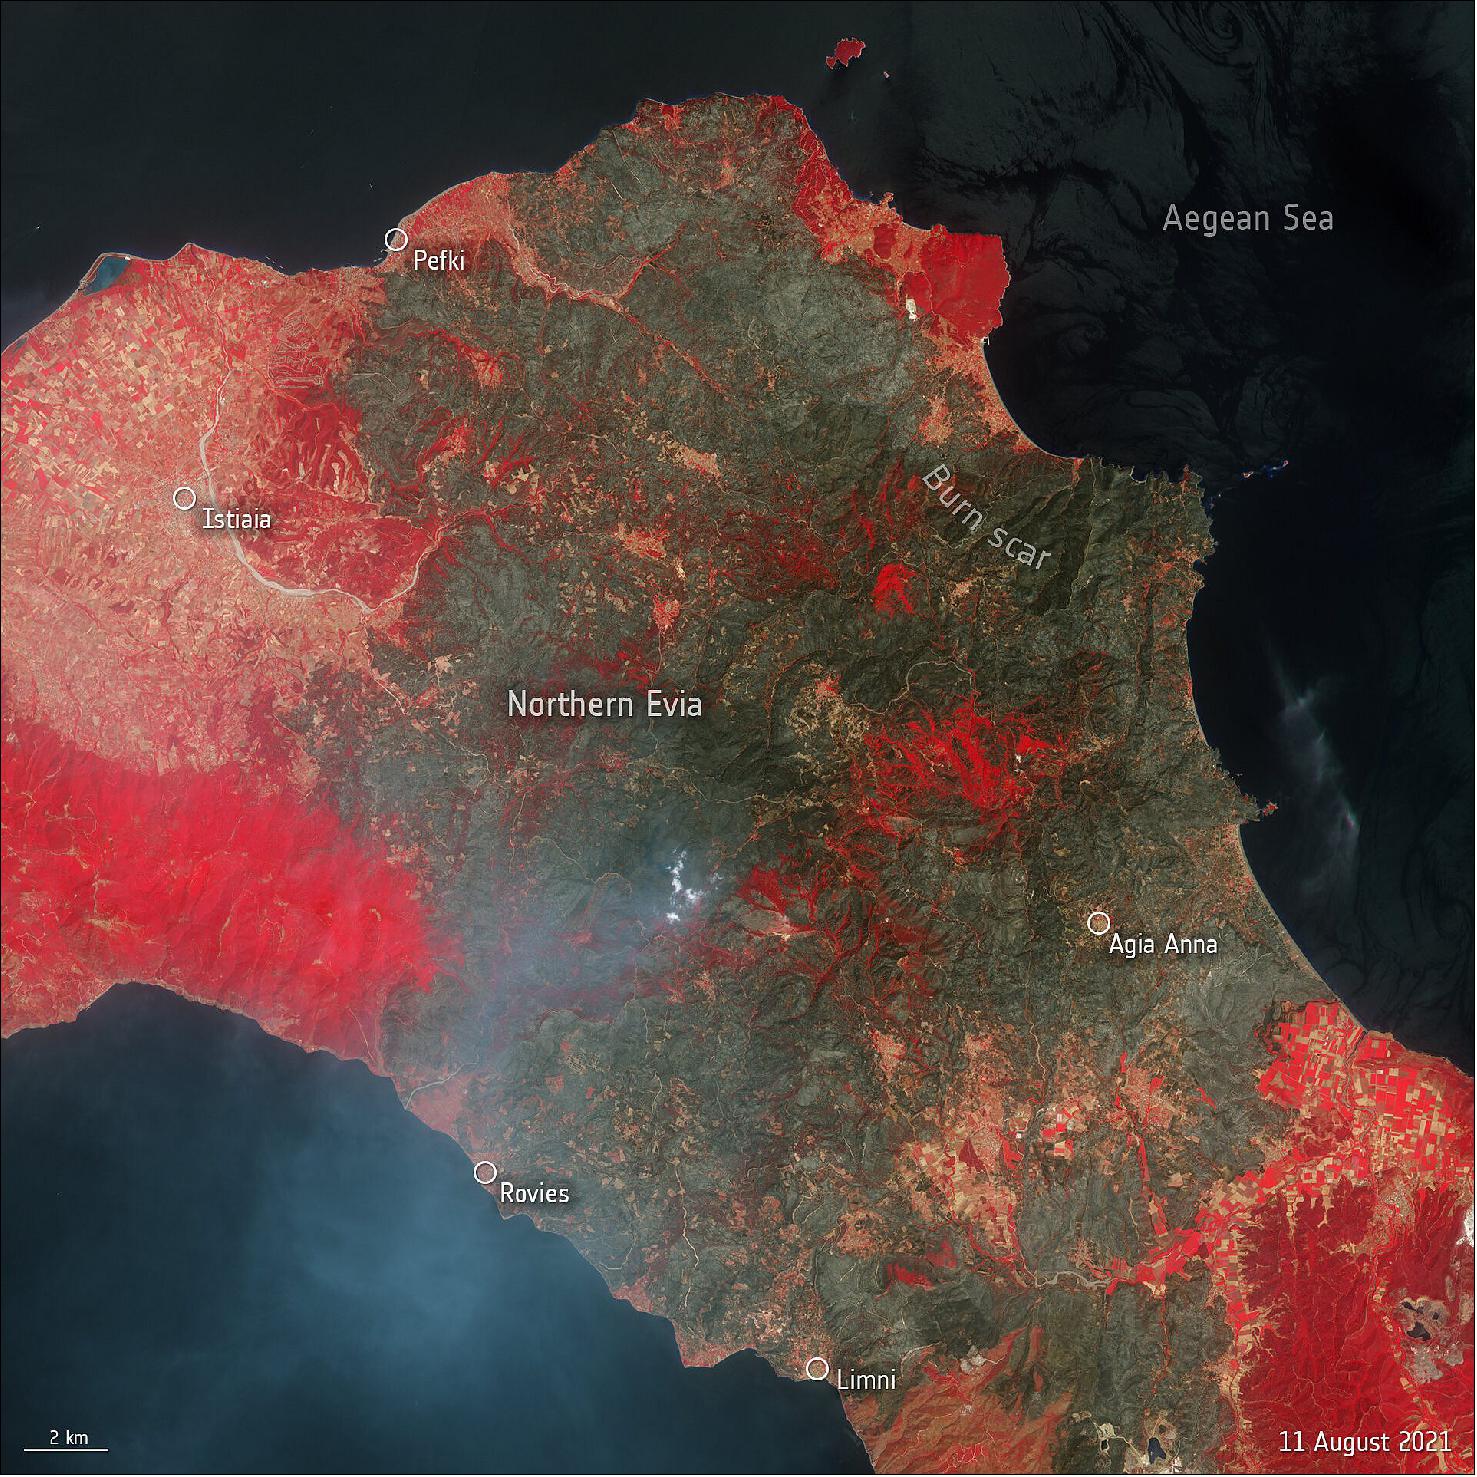
• August 12, 2021: Parts of the Mediterranean and central Europe have experienced extreme temperatures this summer, with wildfires causing devastation in both Turkey and Greece. The blaze on Evia, Greece’s second-largest island, is one of the worst hit with fires having burned down large forested areas, homes and businesses – forcing thousands to evacuate by sea to save their lives. 21)
- The blaze, fuelled by strong winds, began on 3 August and is still ongoing, with hundreds of firefighters currently tackling the flames.
- The heatwave has seen some countries record their highest temperature in decades, with the Italian island of Sicily registering 48.8°C, which may be Europe’s hottest temperature on record. Wildfires have also been raging in other parts of Greece, Italy, Albania and Algeria, prompting activations in the Copernicus Emergency Mapping Service. The mapping service uses data from satellites to aid response to disasters such as wildfires and floods.
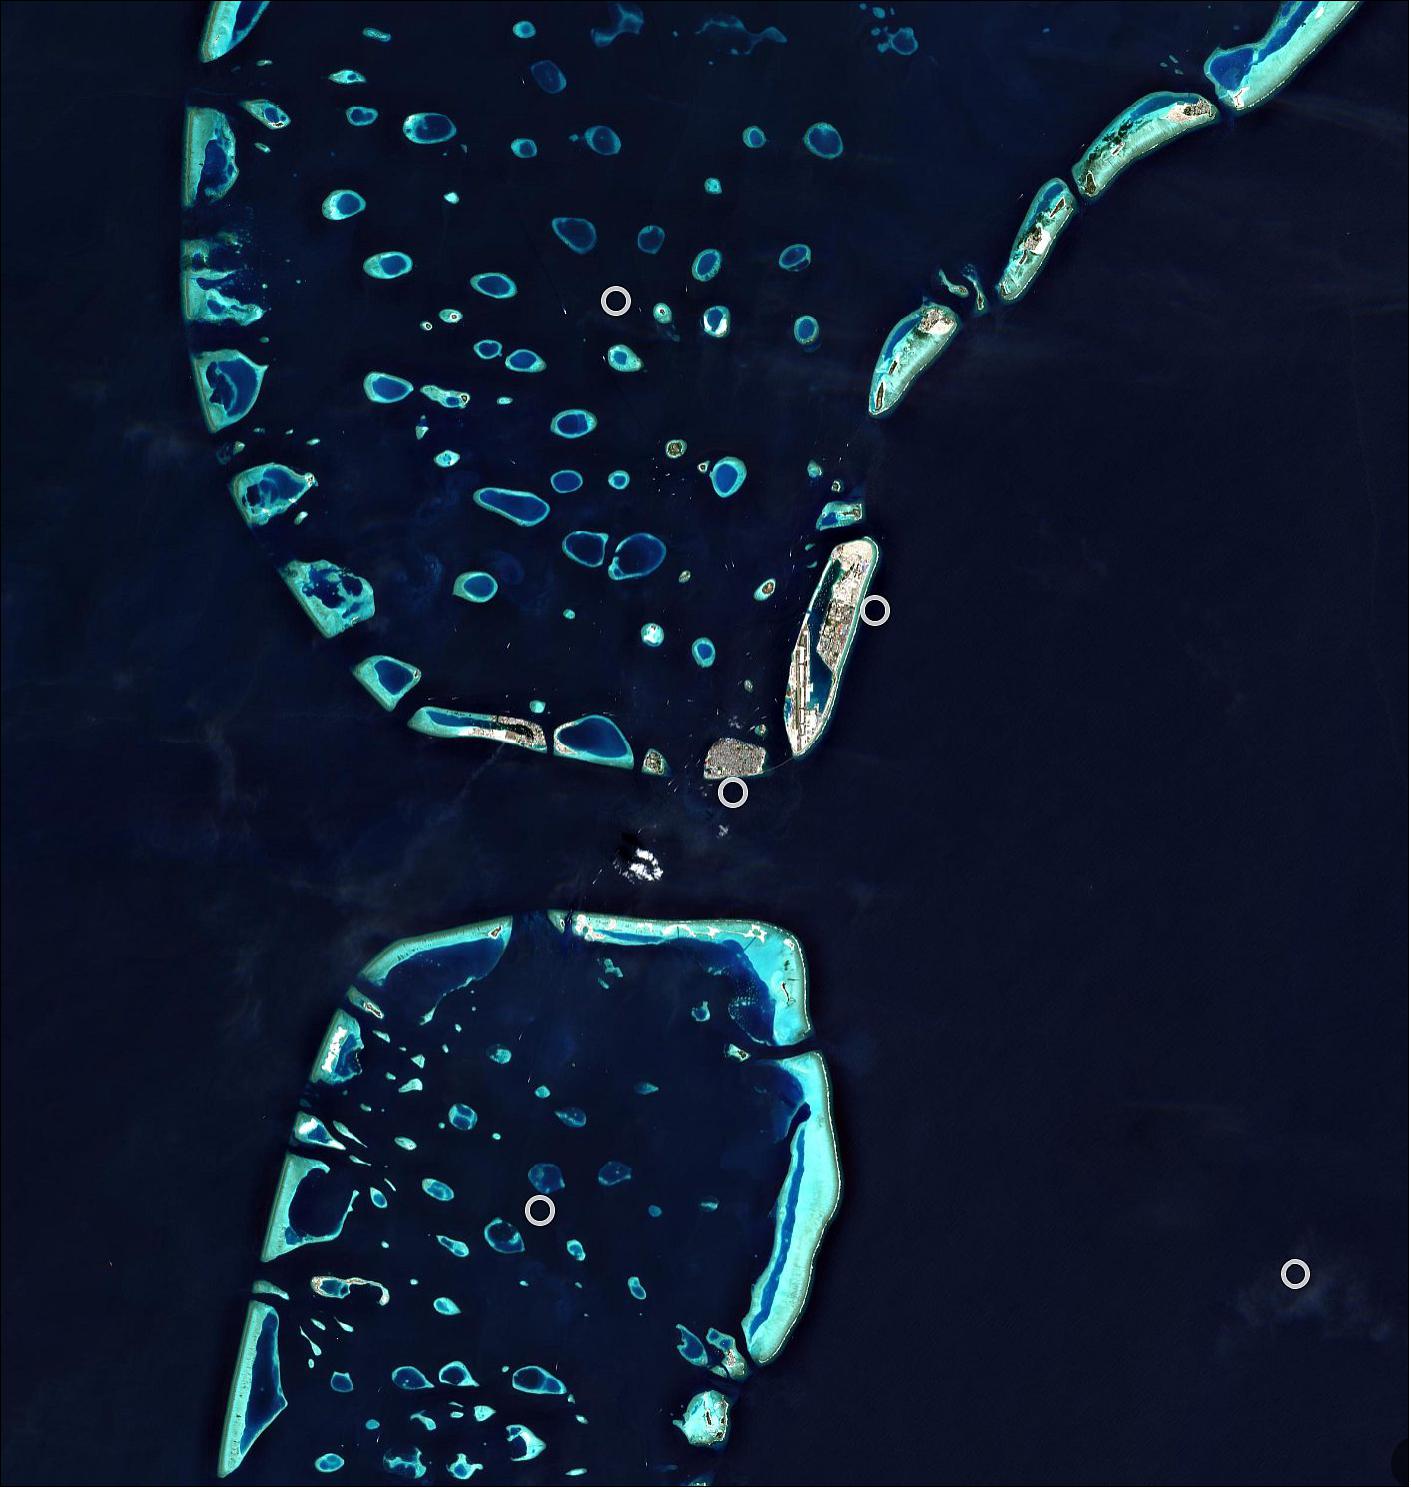
• July 30, 2021: The Copernicus Sentinel-2 mission takes us over Malé – the capital and most populous city in the Republic of Maldives, a small archipelagic state in the Indian Ocean. 22)
- The Republic of Maldives consist of a chain of around 1200 small coral islands that are grouped into clusters of atolls – scattered across 90,000 km2 of ocean. A number of these little islands can be seen in the image, with the turquoise colors depicting clear, shallow waters dotted by coral reefs which contrasts with the dark colors of the Indian Ocean.
- Malé, located at the southern edge of the North Malé Atoll, can be easily spotted in the right of the image. The island is small enough to walk around in approximately one hour, with most sights concentrated on its northern shore. Malé is both a trade and tourist center, connected with Sri Lanka and India by steamship lines, with several vessels visible in the image.
- With a population of more than 200,000 and an area of around 8 km2, Malé is one of the most densely populated cities in the world with the city covering almost the entire island.
- With more than 80% of the Maldives’ land standing less than one meter above average sea level, the Maldives has the lowest terrain of any country in the world. This makes the archipelago particularly vulnerable to sea-level rise.
- In response to this rising threat, the Maldives is working on enhancing the resilience of the country’s islands, which includes constructing the artificial island of Hulhumalé – visible northeast of the airport island of Hulhulé.
- The island has been constructed by pumping sand from the seafloor onto a submerged coral platform, that rises around 2 m above sea level. The reclaimed land provides some much-needed space, and will also help meet the industrial and commercial development of the Malé region.
- Satellite data have shown that the global ocean has risen, on average, 3 mm a year over the last 25 years. Warming ocean waters, melting glaciers and diminishing ice sheets is making rising sea levels a real threat for low-lying islands such as the Maldives.
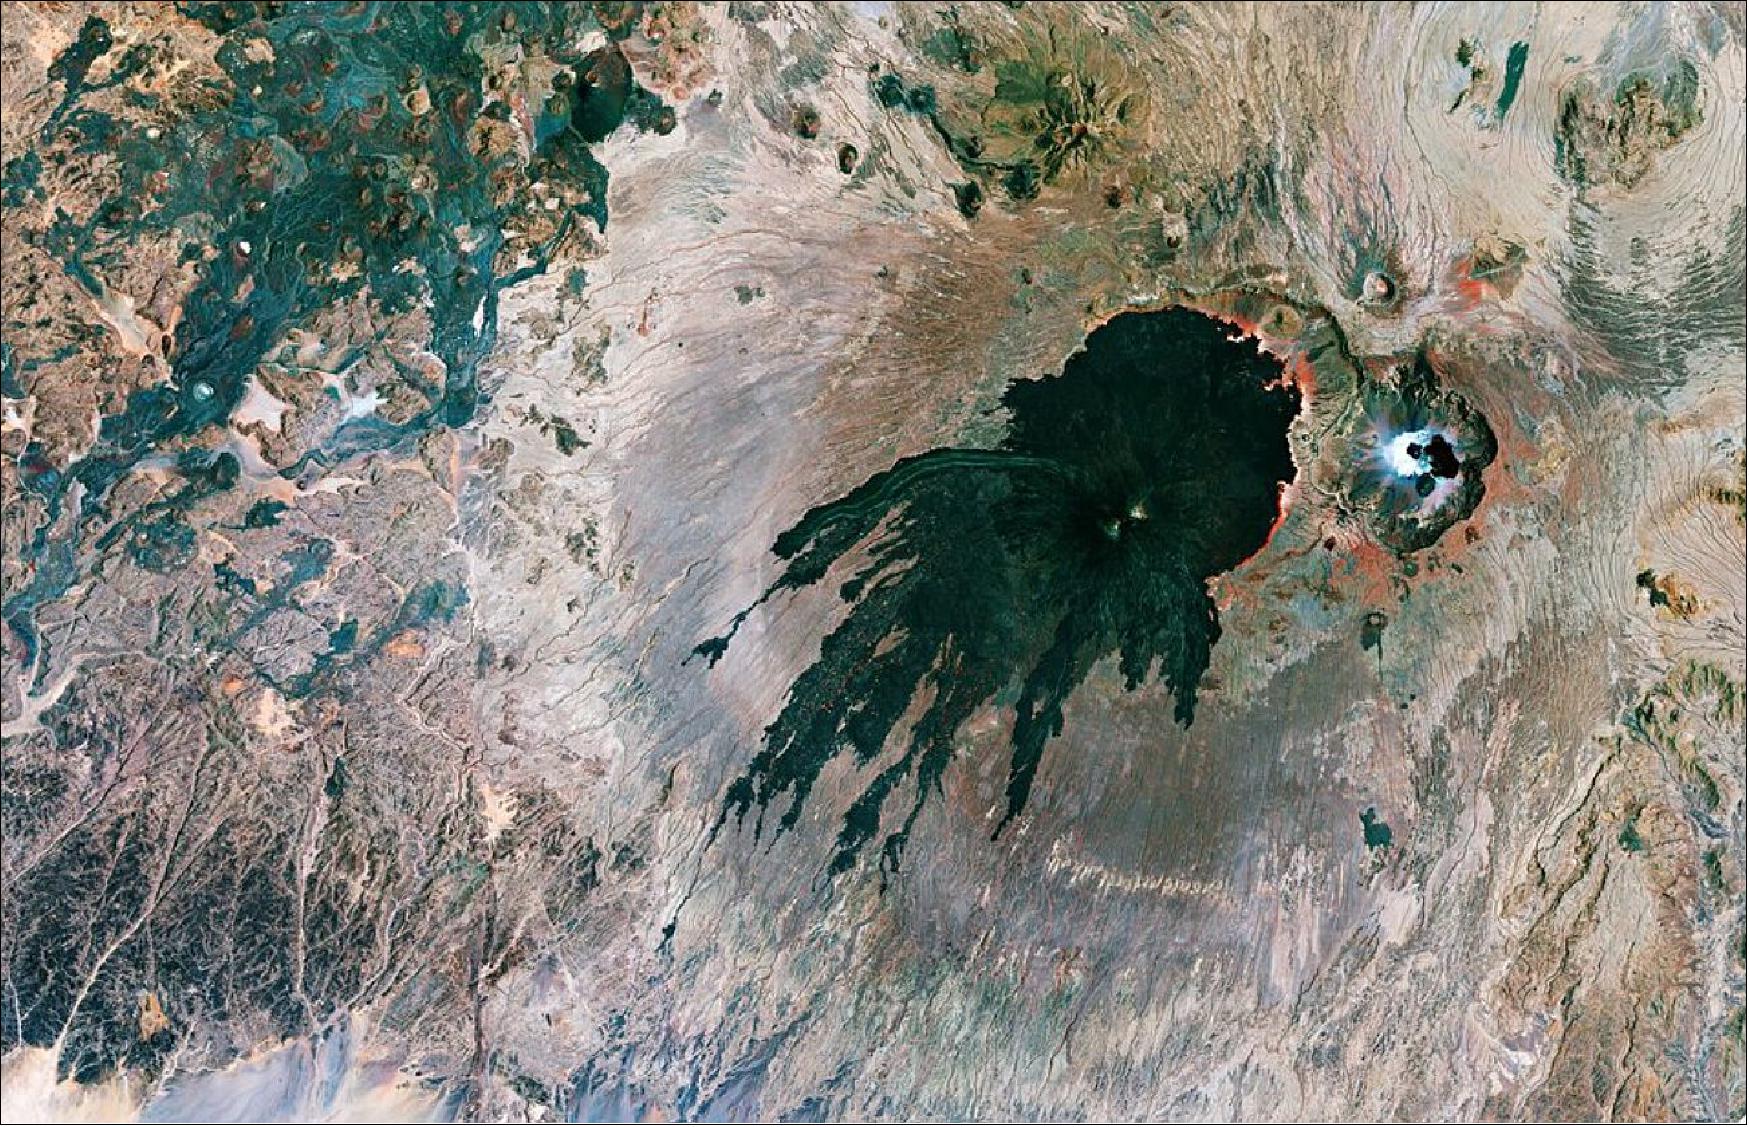
• July 23, 2021: The Tarso Toussidé volcanic massif in Chad is featured in this false-color composite image captured by the Copernicus Sentinel-2 mission. 23)
- Tarso Toussidé, capped by the Toussidé (potentially active) stratovolcano, is located in the western end of the Tibesti Mountains, in Chad. With an elevation of 3265 m above sea level, Toussidé is the second highest peak in Tibesti, after Emi Koussi.
- Toussidé has undergone a number of eruptions and lava flows, with the lava reaching lengths of 25 km and covering an area of 200 km2, appearing to have ‘stained’ the ground in the process. The volcano ejected tephra, fragments of rock and volcano glass, lava and ash. In the middle of the field lies Pic Toussidé, a lava dome which can be seen poking out of the caldera.
- Toussidé is said to be amongst the youngest volcanoes in Tibesti. A large number of fumaroles (openings in or near a volcano through which gases emerge) are active on its summit, exhaling mostly water vapor at temperatures of 40–60 °C – suggesting it is the only active Tibesti volcano.
- Just next to Toussidé, in the far-right of the image, lies the Trou au Natron caldera, which sits at an elevation of around 2450 m. A number of volcanic cones sit on the floor of the caldera, with numerous vents and hot springs on the caldera’s floor emitting hot steam.
- Much of the surface of the caldera is lined with a white crust of salts, including sodium carbonite. These crusts are usually formed when mineral-rich steam is emitted from small vents on the crater’s floor, and when this evaporates in the heat, the minerals are left behind.
- The caldera has an irregular diameter of around 6-8 km and is up to 1000 m deep, and is said to have been filled by a freshwater lake during the last glacial maximum.
- In the left of the image, the red shows sparse vegetation along the ephemeral creeks.
- Satellite imagery is a practical way to study remote areas such as the volcanic regions in the Tibesti Mountain Range. The Copernicus Sentinel-2 mission carries a multispectral imager with 13 spectral bands and has a wide swath coverage, delivering data on Earth’s land every five days.
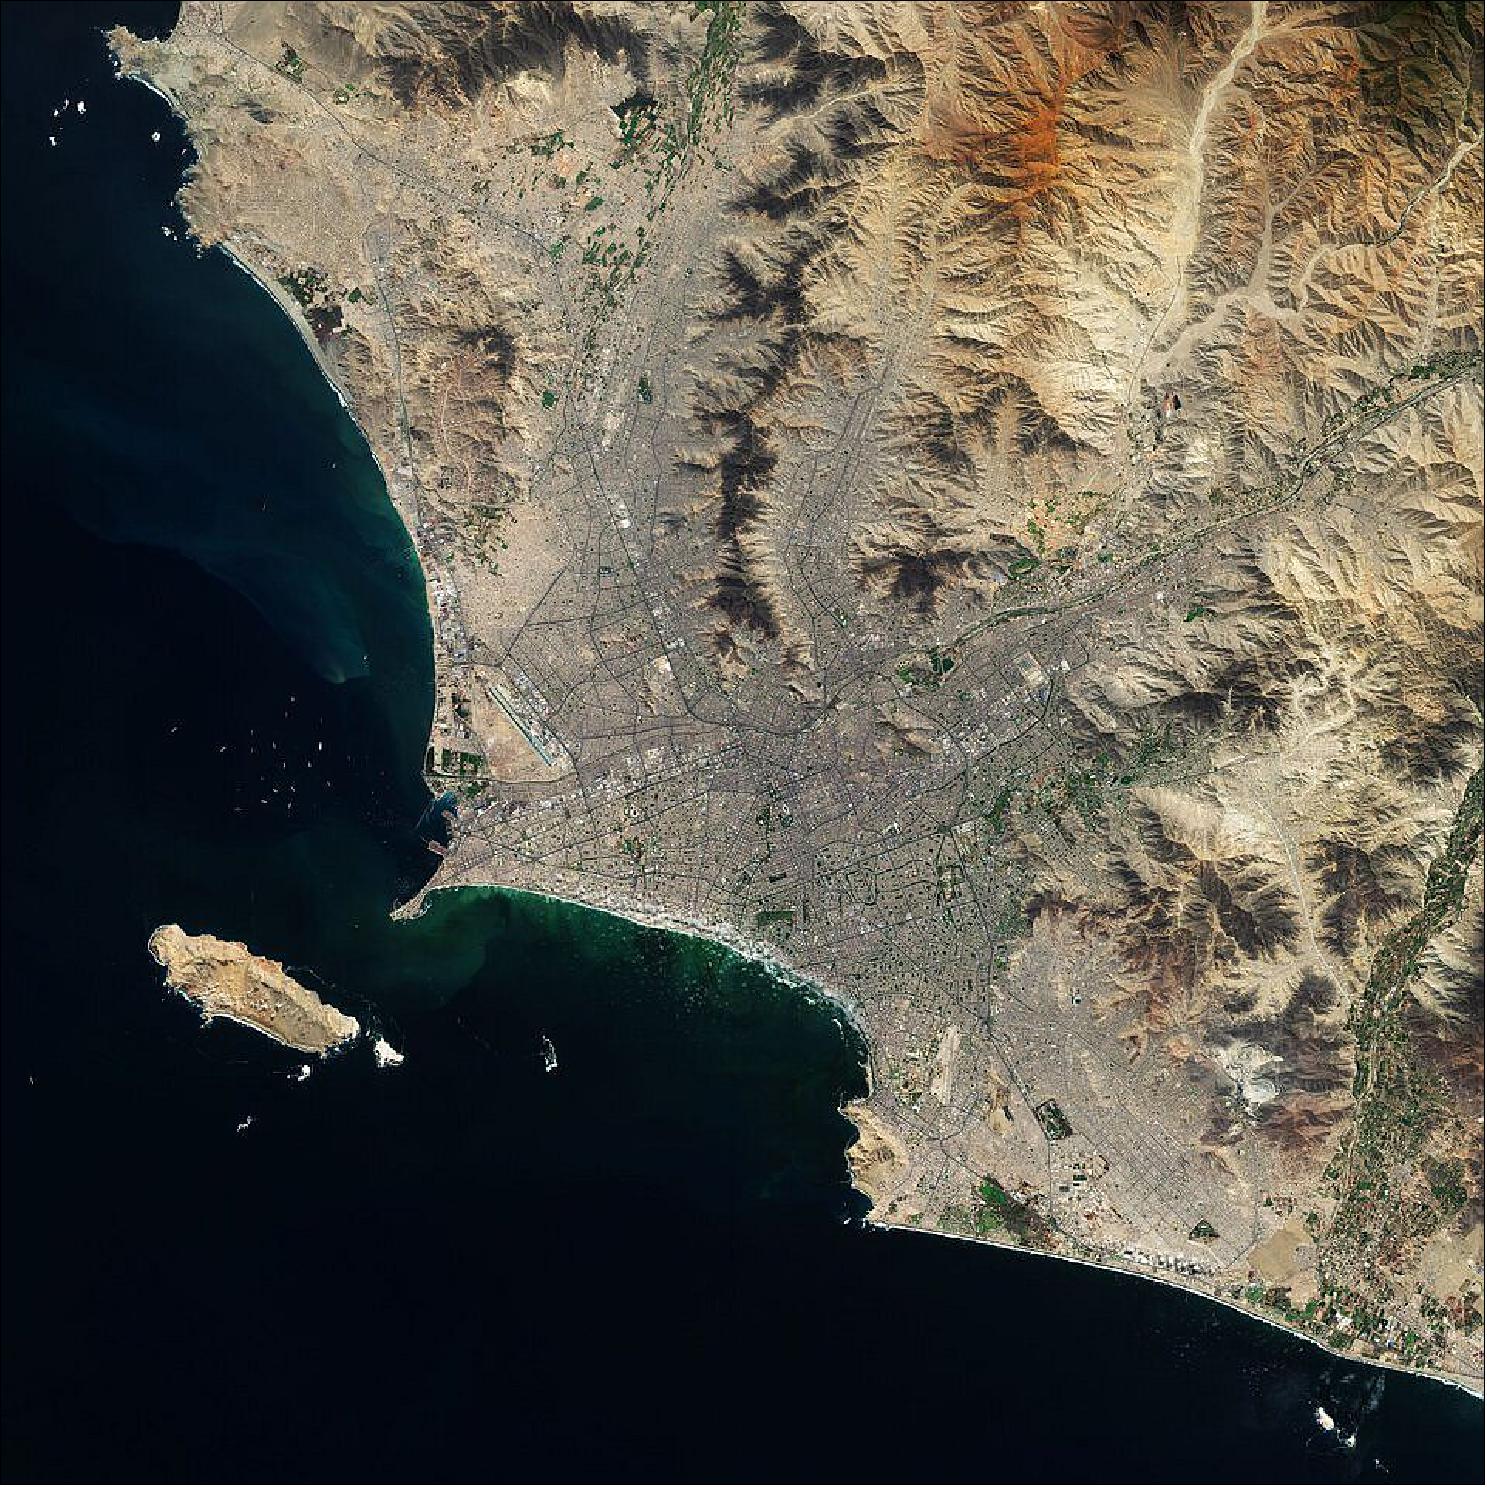
• July 16, 2021: The commercial and industrial center of Peru, Lima is located on the mostly flat terrain in the Peruvian coastal plain, within the valleys of the Chillón, Rímac and Lurín rivers. The city is bordered on the east by the foothills of the Andes Mountains and on the west by the Pacific Ocean. 24)
- Lima can be seen directly on the south bank of the Rímac River, which flows for around 200 km through the Lima Region, before emptying near Callao – a seaside city and port in the Lima metropolitan area (the largest metropolitan area of Peru).
- Lima’s historical center was declared a UNESCO World Heritage Site in 1988 owing to its large number of historical buildings dating from the Spanish colonial era. One of the most notable characteristics of Lima is the barren desert that surrounds the city, with the sand supporting little to no plant life, with the exception of where water has been artificially provided.
- Although Lima is located at a tropical latitude, the cool offshore Humboldt Current (also known as the Peru Current) produces a year-round temperate climate. The cooling of the coastal air mass produces thick cloud cover throughout winter and the dense sea mist, known locally as garúa, often rolls in to blanket the city. In this image, captured on 20 April 2020, several cloud formations can be seen dotted along the coast.
- Callao is Peru’s main seaport and home to its main airport, Jorge Chávez International Airport. Several small boats and vessels can be seen near the port. Callao has several islands: San Lorenzo Island (currently used as a military base), El Frontón (a former high security prison), the Cavinzas Islands, and the Palomino Islands, where numerous sea lions and sea birds live.
• July 9, 2021: The Gulf of Martaban, an arm of the Andaman Sea located in southern Myanmar, is featured in this false-color image captured by the Copernicus Sentinel-2 mission. The image has been processed in a way that included the near-infrared channel – which makes vegetation appear bright red. 25)
- The gulf, also known as Gulf of Mottama, is named after the port city of Mottama, formerly known as Martaban. The Gulf of Martaban is considered a unique estuarine mudflat environment that is home to a great variety of flora and fauna. Fed by sediment and nutrients from three major rivers (Sittang, Salween and Yangon), the gulf supports a number of species including marine fish, 150 000 migratory birds as well as supporting the livelihood of tens of thousands of people.
- A notable characteristic of the gulf is that it has a tide-dominated coastline, with tidal ranges between six and seven meters. The mouth of the gulf, which is approximately 100 km wide, narrows into a funnel-shaped bay to produce a powerful tidal bore phenomenon that can reach heights of over a meter in the upper estuary. As a result, the tidal mudflats of the gulf are among the largest in the world.
- The city of Yangon is visible in the bottom-left of the image, at the convergence of the Yangon and Bago Rivers. With over seven million people, Yangon is Myanmar's most populous city and its most important commercial center. The city served as the country’s capital until 2006.
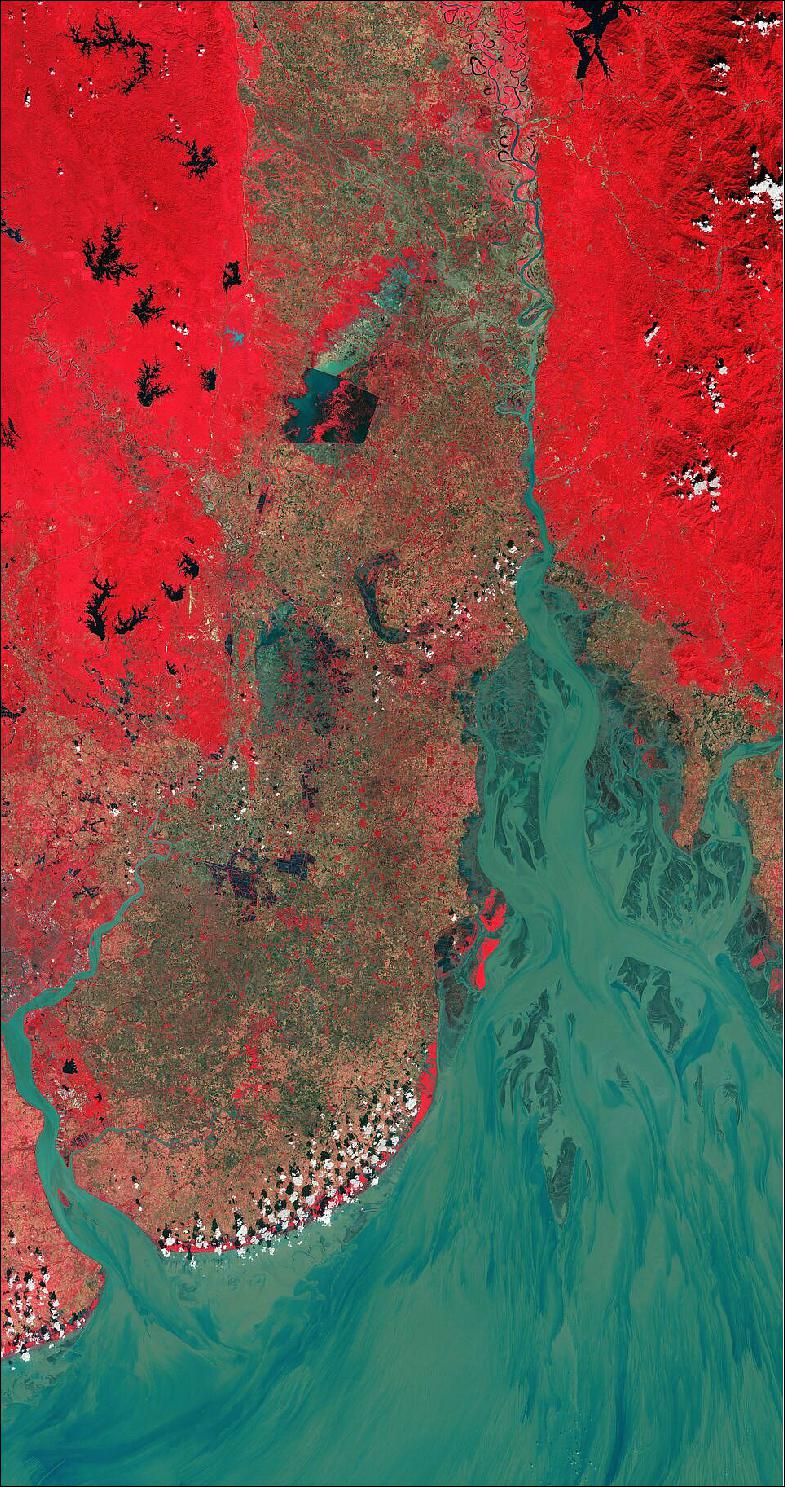
- Sentinel-2 is a two-satellite mission to supply the coverage and data delivery needed for Europe’s Copernicus program. The mission’s frequent revisits over the same area and high spatial resolution allow changes in water bodies to be closely monitored.
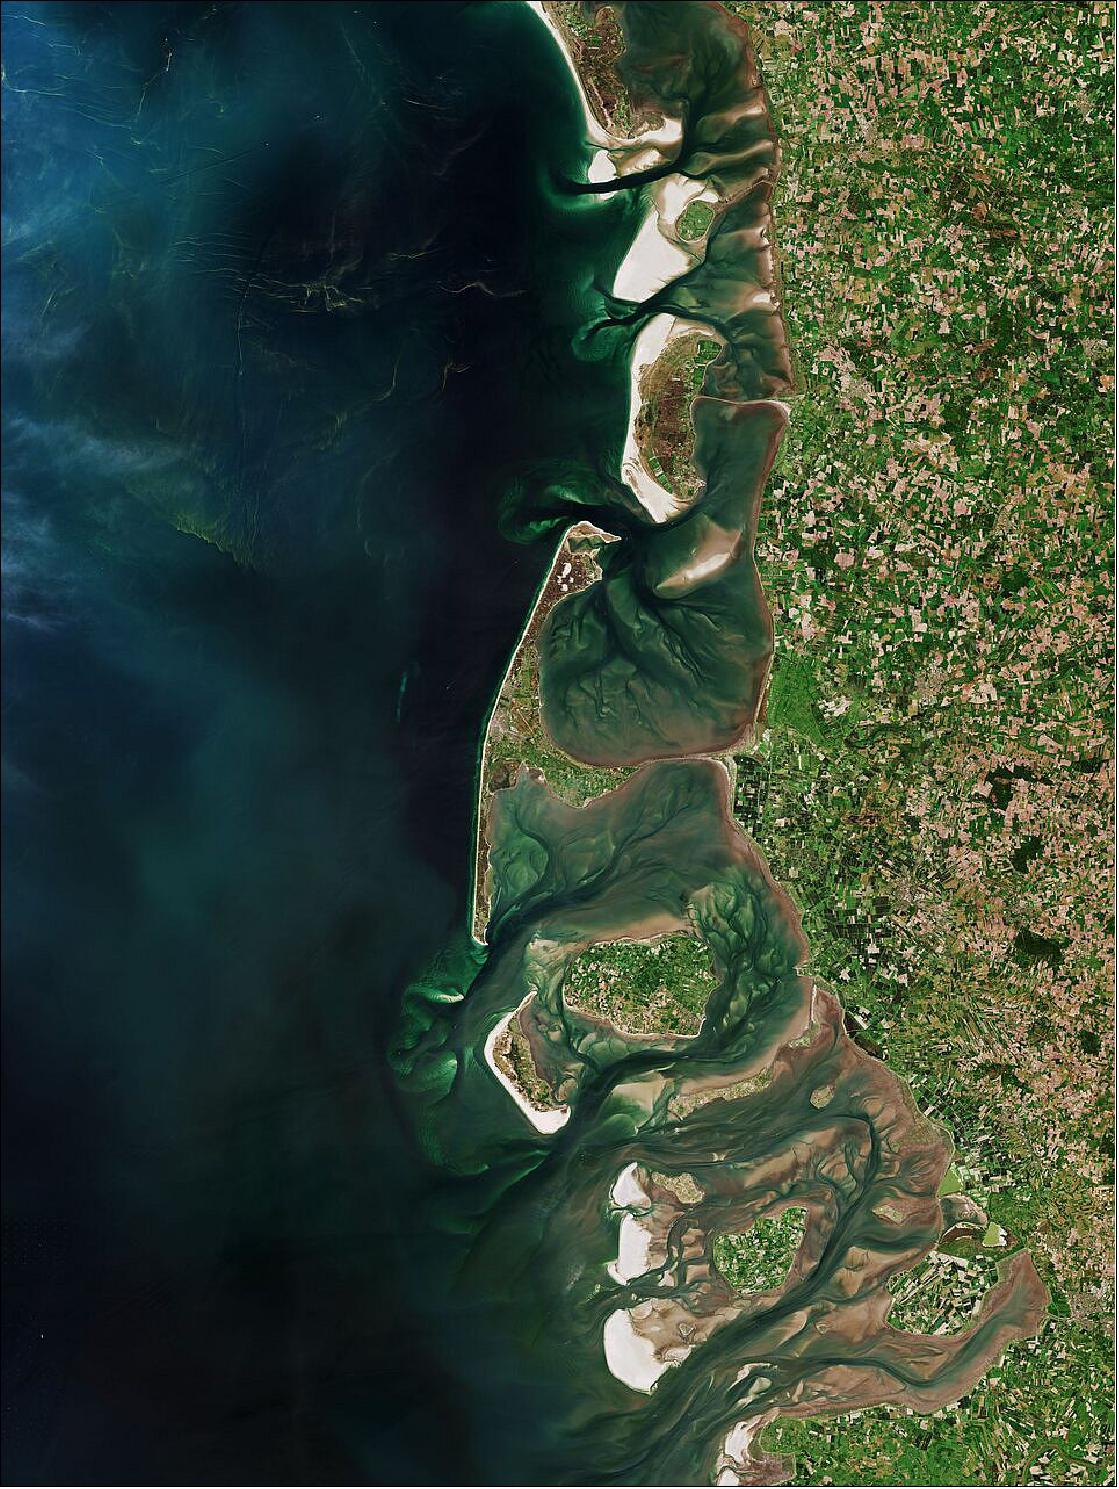
• July 2, 2021: The Frisian Islands stretch from the northwest of the Netherlands through Germany to the west of Denmark. Although they are considered a single physical feature, they are divided into West, East and North Frisian Islands – with the North Frisian Islands visible here. 26)
- The North Frisian Islands are split between Germany and Denmark. There are four larger islands that make up the archipelago: Sylt, Föhr, Amrum, and Pellworm.
- Sylt, the largest of the archipelago, is around 100 km2 and is known for its distinctive shape of its shoreline. Sylt extends in length more than 35 km and, in some places, is only 1 km wide. A sandy beach stretches across the islands’ west coast, however it has begun to erode owing to storm tides. The northernmost island of Germany, it is connected to the mainland by the Hindenburgdamm, an 11 km-long causeway.
- The Wadden Sea on the islands’ east side, between Sylt and the mainland, is part of the Schleswig-Holstein Wadden Sea National Park and has been a nature reserve and bird sanctuary since 1935.
- The islands of Föhr and Amrum are visible southeast of Sylt. The larger Föhr is called the ‘Green Island’ due to it being sheltered from the storms of the North Sea by its neighboring islands. The island of Amrum features an extended beach area along its west coast, which faces the open North Sea. The east coast borders to mud flats and tidal creeks of the Wadden Sea.
- The three white islands visible below Amrum are the North Frisian Barrier Islands. These sand banks, or shoals, act as a natural breakwater for the smaller islands closer to land. Just east of these lies the island of Pellworm.
- North of Sylt are the Danish islands of Rømø, Mandø, and, lastly, Fanø. In the top-left of the image, a large algal bloom is visible in emerald green. Harmful algal blooms caused by excessive growth of marine algae have occurred in the North Sea in recent years, with satellite data being used to track their growth and spread. These data can then be used to help develop alert systems to mitigate against damaging impacts for tourism and fishing industries.
• June 30, 2021: For Asteroid Day, the Copernicus Sentinel-2 mission takes us over the Shoemaker Impact Structure (formerly known as Teague Ring) in Western Australia. 27)
- The almost circular shape of the Shoemaker impact site, visible in the bottom-right of the image, is approximately 30 km in diameter and is defined by concentric rings formed in sedimentary rocks (seen in dark brown). The precise age of the impact is unknown, but is estimated to be between 1000 and 600 million years ago – making it Australia’s oldest impact crater.
- Asteroid Day, the UN-endorsed global awareness campaign is back on 30 June with an exciting 5-hour live broadcast from 18:00 CET. With the help of leading experts, Asteroid Day Co-founder Dr. Brian May and the most engaging voices in science communications from around the world, the five hour program will bring the solar system’s smallest worlds to vivid life for audiences of all ages and backgrounds. For more information, visit ESA joins Asteroid Day for rocky live broadcast.
• June 18, 2021: Sentinel-2 image of the week: 14-18 June 2021 showing the California drought. 28)
• June 18, 2021: The Tana River, Kenya’s longest river, is featured in this false-color image captured by the Copernicus Sentinel-2 mission. 29)
- The Tana River flows for around 1000 km from the Aberdare Mountains, west of Nyeri, running eastwards before veering south around the massif of Mount Kenya, and opening onto a wide valley, pictured here, where it meanders through a floodplain often subject to inundation. The river then continues its journey before entering the Indian Ocean at Formosa Bay, Kipini.
- The river is known for its extraordinary biodiversity, as it provides water and life for wild animals, nomads and their livestock, as well as for agricultural purposes.
- Some of the Tana’s tributaries as well as several smaller, seasonal rivers, known as lagas, that only flow during the rainy season, are visible flowing in an east-west direction in the image. The river beds support livestock and wildlife during the dry season owing to their ability to retain water.
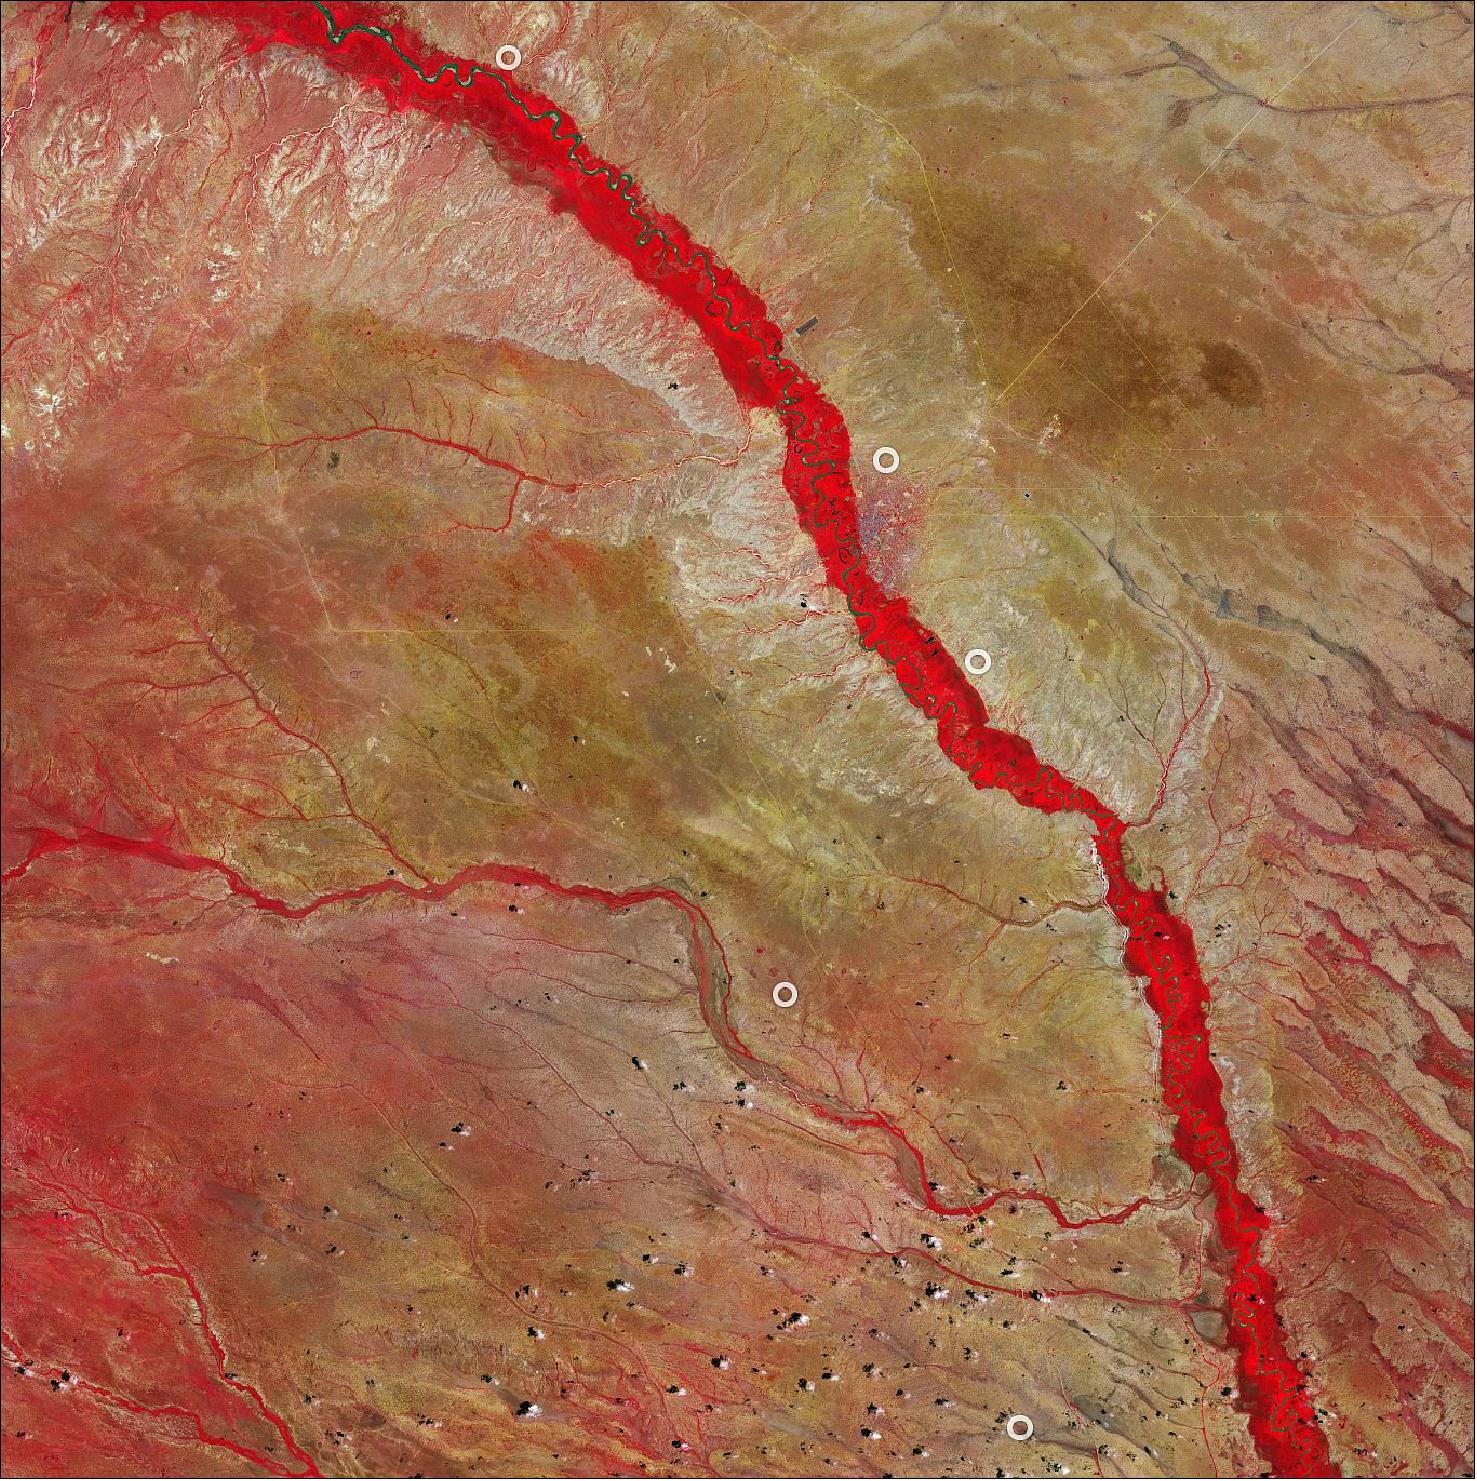
- It is easy to pick out the narrow band of riparian forest visible along the banks of the river in the image. The riparian forest usually thrives year-round, although its extent is highly dependent on seasonal flooding and ground water recharge by the Tana.
- This image was captured during the area’s wet season, where the small tributaries of the Tana are highly visible and a significant amount of vegetation can be seen. If the image had been captured during the dry season (around June-September), the smaller tributaries and the vegetation growing around them would have dried up.
- The river flows alongside the town of Garissa, the capital of Garissa County, and is visible as a greyish patch of land on the east side of the river. Around 5 km south of Garissa lies the Bour-Algi Giraffe Sanctuary, home to around 1000 giraffes and endangered wildlife including the Rothschild giraffe and gerenuk – a long-necked antelope found in the region.
- Copernicus Sentinel-2 is a two-satellite mission. Each satellite carries a high-resolution camera that images Earth’s surface in 13 spectral bands. The mission is mostly used to track changes in the way land is being used and to monitor the health of vegetation.
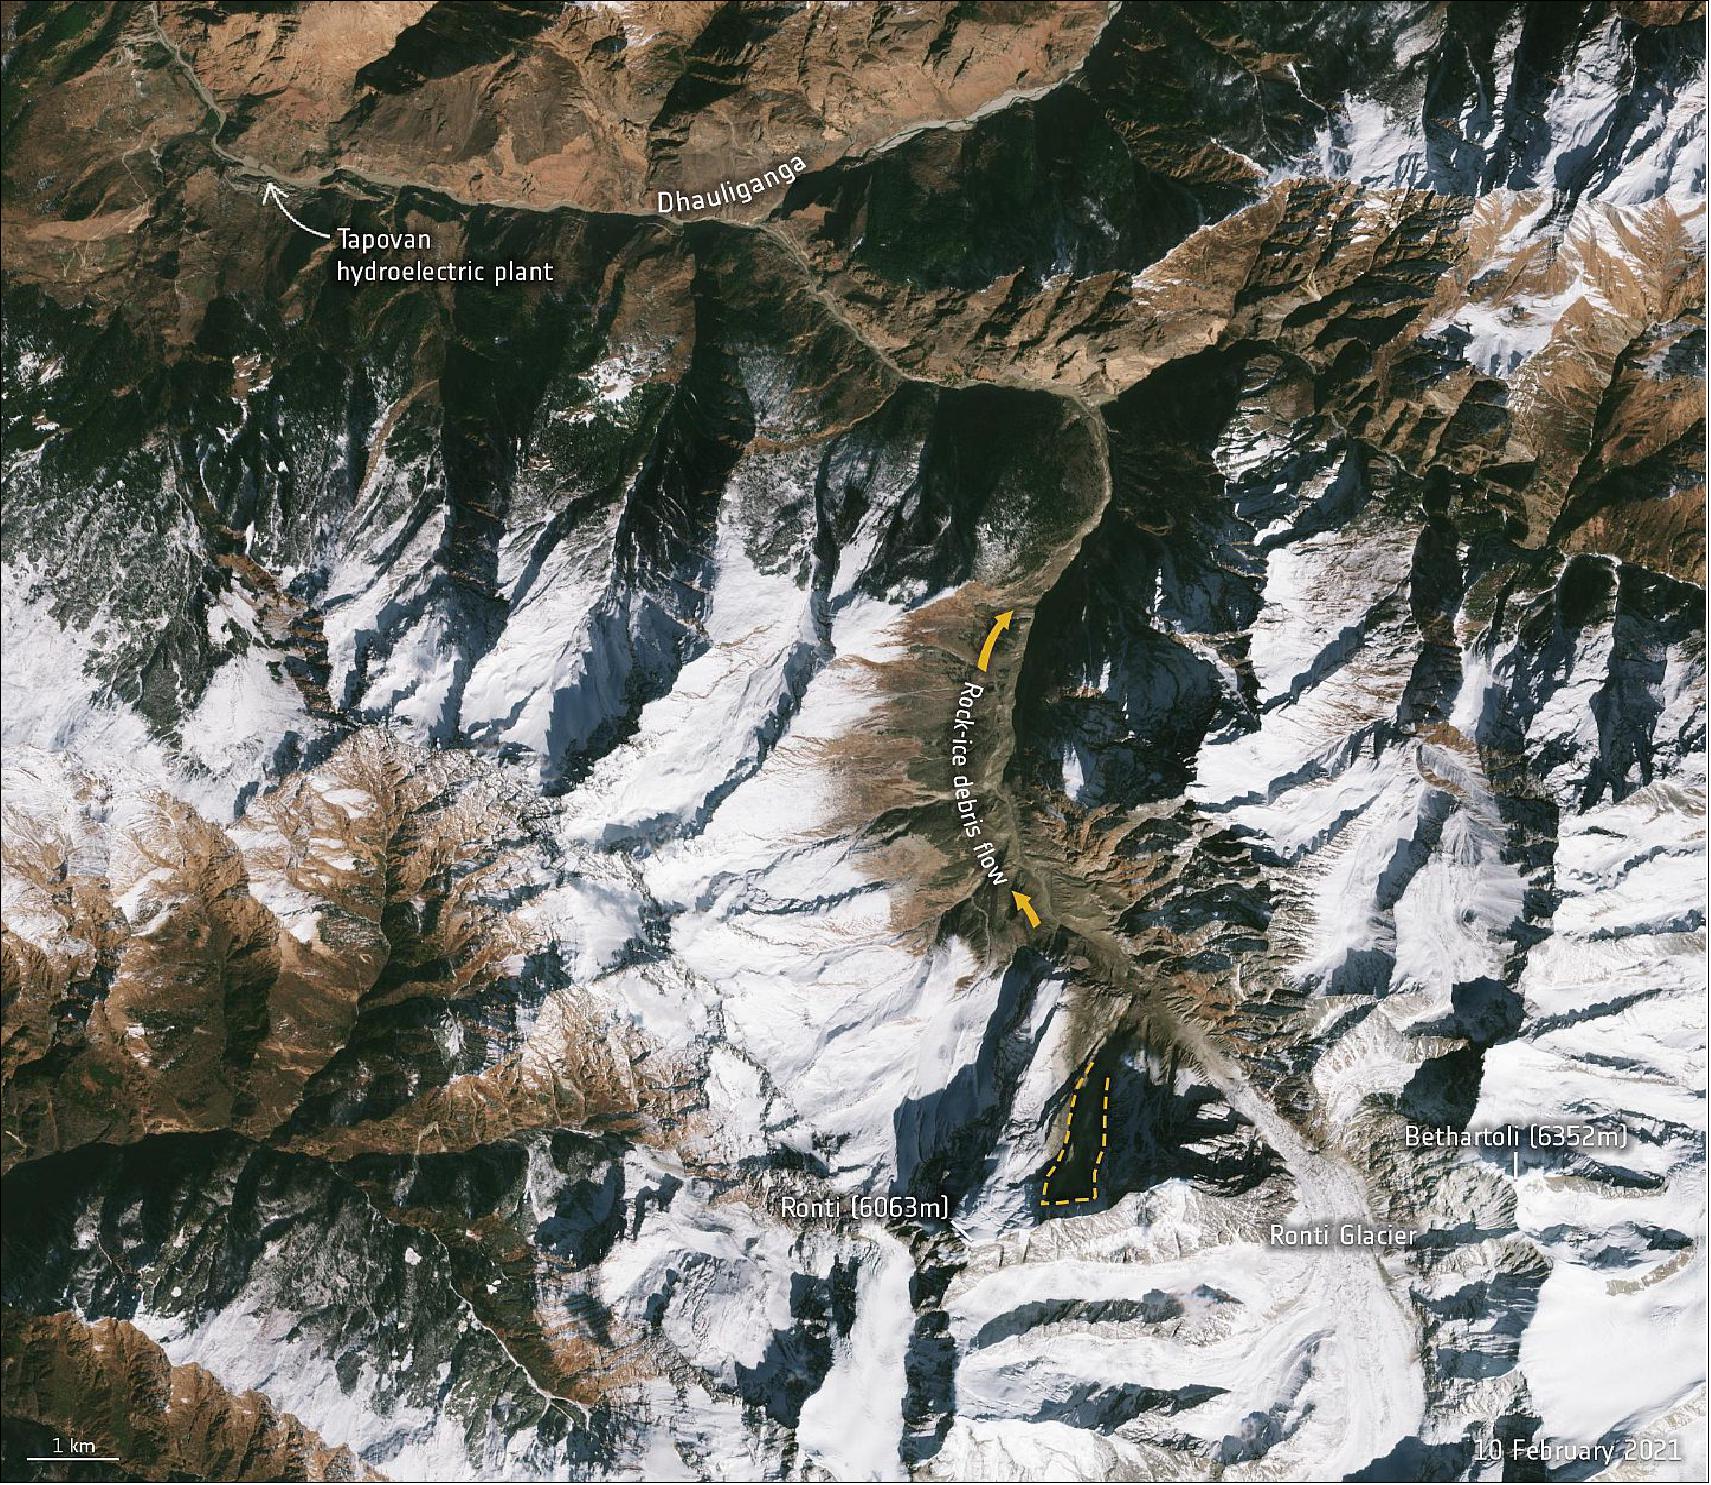
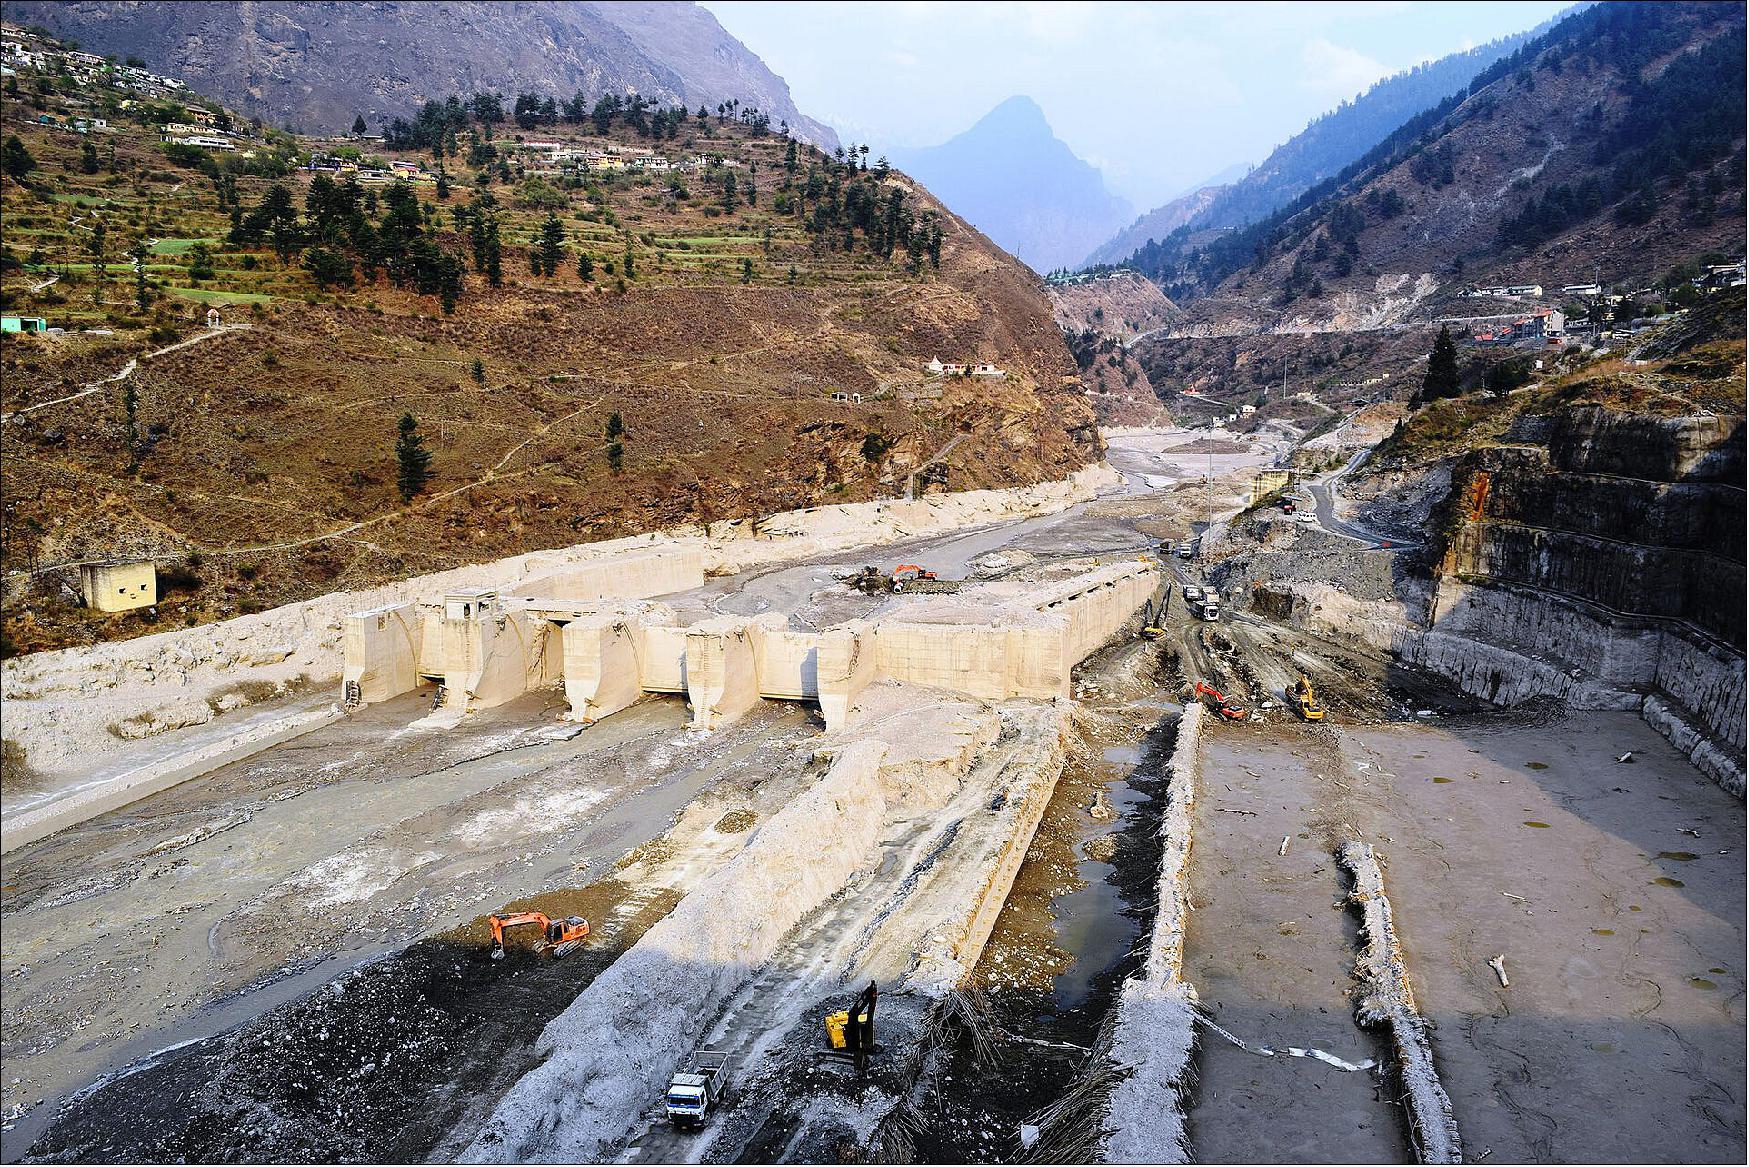
• June 14, 2021: A new study using satellite evidence confirms that a rock and ice avalanche caused the Chamoli disaster in India earlier this year. The resulting mud and debris flood led to massive destruction downstream. 30)
- On 7 February 2021, the Chamoli district in the Uttarakhand region of India experienced a humanitarian tragedy when a large mass of rock and ice, around 27 million m3, was released from the steep mountain flank of the Ronti peak.
- This collapse caused a flow of debris to barrel down the Ronti Gad, Rishiganga, and Dhauliganga river valleys, causing significant destruction along the route, killing more than 200 people and destroying two major hydropower facilities that were under construction.
- In response to this, the International Charter 'Space and Major Disasters', a service that provides satellite images in response to natural and human-made emergencies, was activated. The service provides free access to very high-resolution satellite data such as from Worldview 1/2, Cartosat-1 and Pleiades.
- Combined with freely available images from Landsat and the Copernicus Sentinel-2 mission, scientists analyzed numerous images acquired before and after the event to quickly determine what was going on and quantify key measures of the event, for example its total volume, elevation differences and travel distances.
- This analysis allowed scientists to exclude that a glacier lake outburst flood had been the cause of the disaster. Instead, the study provides satellite evidence that the disaster was caused by a large mass of ice and rock dislodged from the slopes of Ronti Peak, starting as a giant landslide that transformed into a mud and debris flow causing destruction along its path.
- The team of 53 scientists and experts came together online in the days following the disaster to re-construct the event and investigate the scope and impact of the flood caused by the landslide. Their study, published on 10 June in the journal Science, not only analyzed satellite imagery, but also seismic records and eye-witness videos to determine the timing of the event and produce computer models of the flow. 31)
- Lead author Dan Shugar, Associate Professor in the Department of Geoscience at the University of Calgary, commented, “The rapid increase in the number of satellites orbiting Earth allowed our team to understand the basics of what happened in a matter of hours. We now have access to satellites that image every part of Earth every day – sometimes even multiple times per day – and this has really revolutionized how we do this sort of science.”
- The results of the analysis were also sent to the governmental agencies of India to help them plan and support emergency assistance to the local teams.
- Two participants from ESA’s Climate Change Initiative, specifically the Glaciers_cci and Permafrost_cci projects, helped with the retrieval and analysis of satellite images which included Copernicus Sentinel-2, PlanetLab and Corona.
- Andreas Kääb, from the University of Oslo, was able to determine the volume and ice/rock mixing ratios based on his experience with such events from earlier studies. He explains, “The calculated 80% rock in the avalanche completely converted the 20% glacier ice into water over the 3200 m elevation difference from Ronti Peak to the Tapovan hydropower plant. This conversion is largely responsible for the devastating impact of the resulting mud and debris flood wave.”
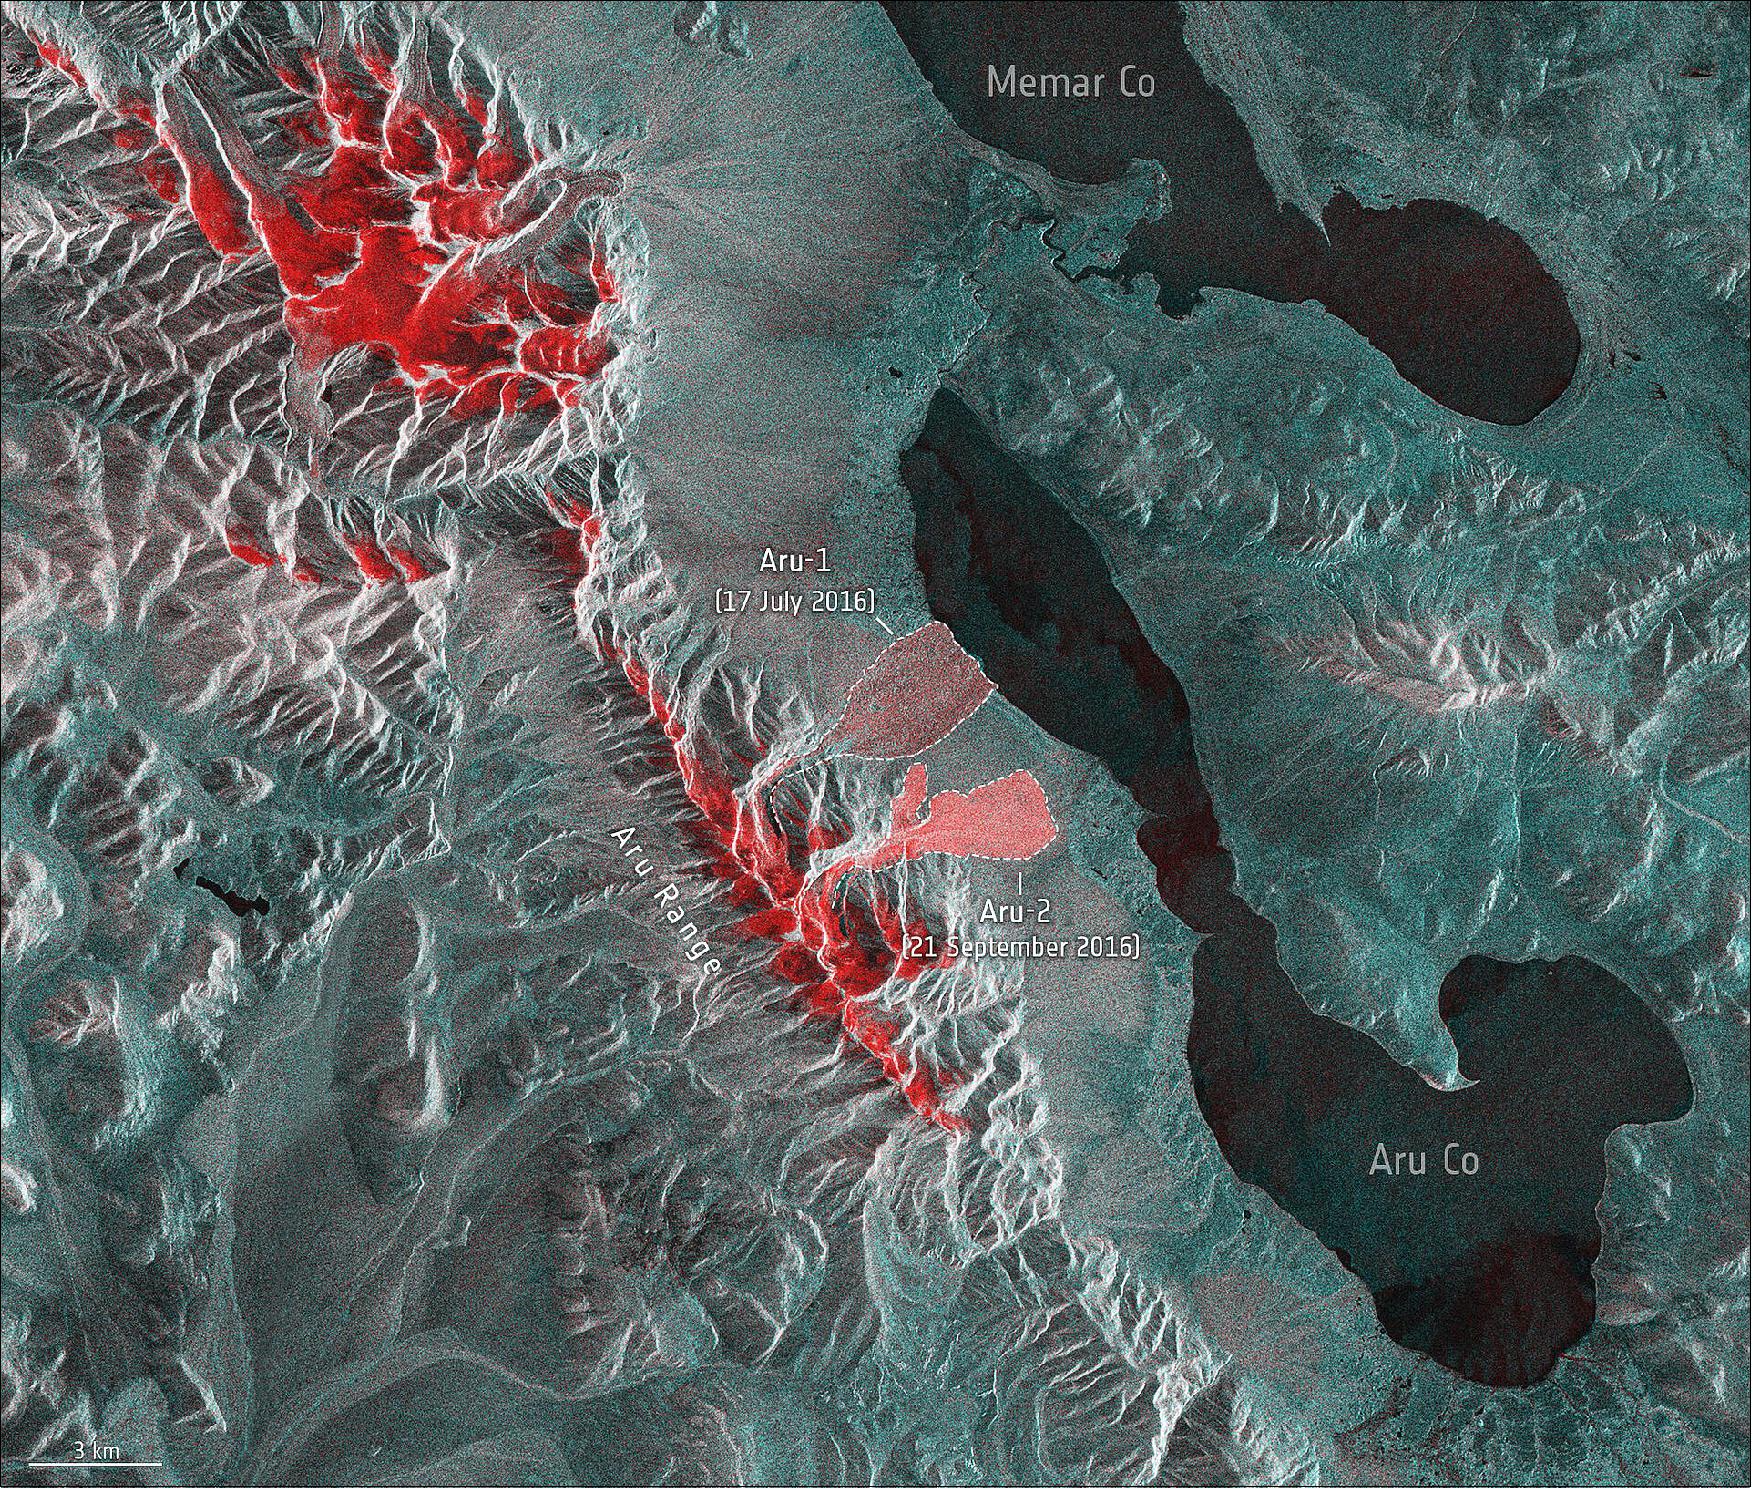
- Among many other technical details, Copernicus Sentinel-2 images revealed that the crack near the bergschrund (a crevasse that forms where moving glacier ice separates from stagnant ice) of the steep hanging glacier opened already some years ago and that an ice avalanche from a neighboring glacier occurred in 2016. The images from 2016—2020 show the ice avalanche deposit largely melting away over this period.
- Frank Paul, from the University of Zurich is science lead of the Glaciers_cci project, and commented: “This study clearly shows that satellite data could play a larger role in future high mountain hazard assessments, in particular for evaluating large and inaccessible areas.”
- Andreas Kääb added “This specific event was extreme and basically unpredictable. However, rock avalanches are known to be highly mobile, far-reaching and devastating when they mix with snow and ice.”
- The researchers suggest that in a warmer climate such events might be happening more frequently, and that the full potential of satellite data and knowledge should be utilized to identify possibly dangerous regions.
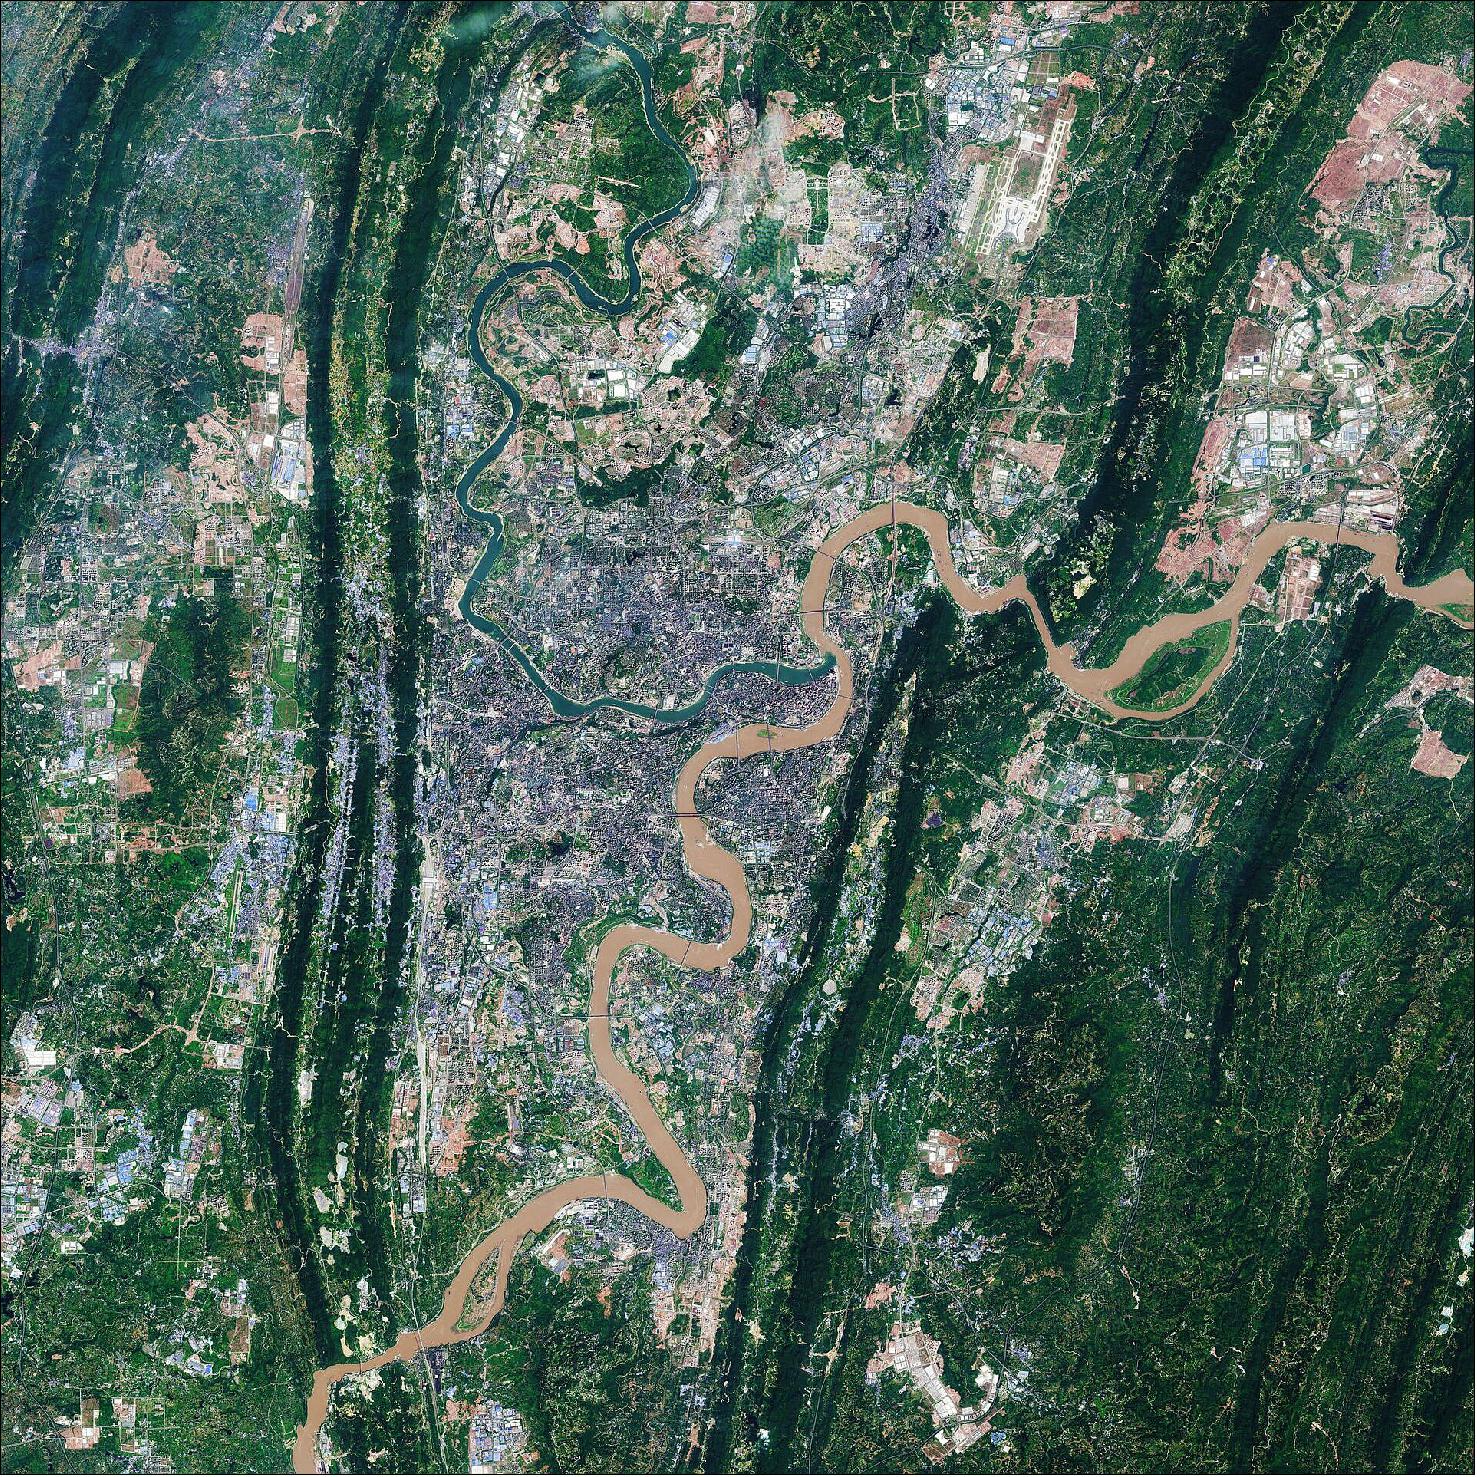
• June 11, 2021: Chongqing, the largest municipality in China, is featured in this Copernicus Sentinel-2 image. 32)
- Covering an area of over 80,000 km2, around the size of Austria, Chongqing is located in southwest-central China. Chongqing covers a large area crisscrossed by rivers and mountains. These are the Daba Mountains in the north, the Wu Mountains in the east, the Wuling Mountains in the southeast and the Dalou Mountains in the south.
- The city of Chongqing, one of the most important economic centers in China, is known as a ‘mountain city’ owing to its rugged terrain and steep gorges. Chongqing is a major manufacturing and transportation centre, and has become the biggest automobile manufacturing base in China.
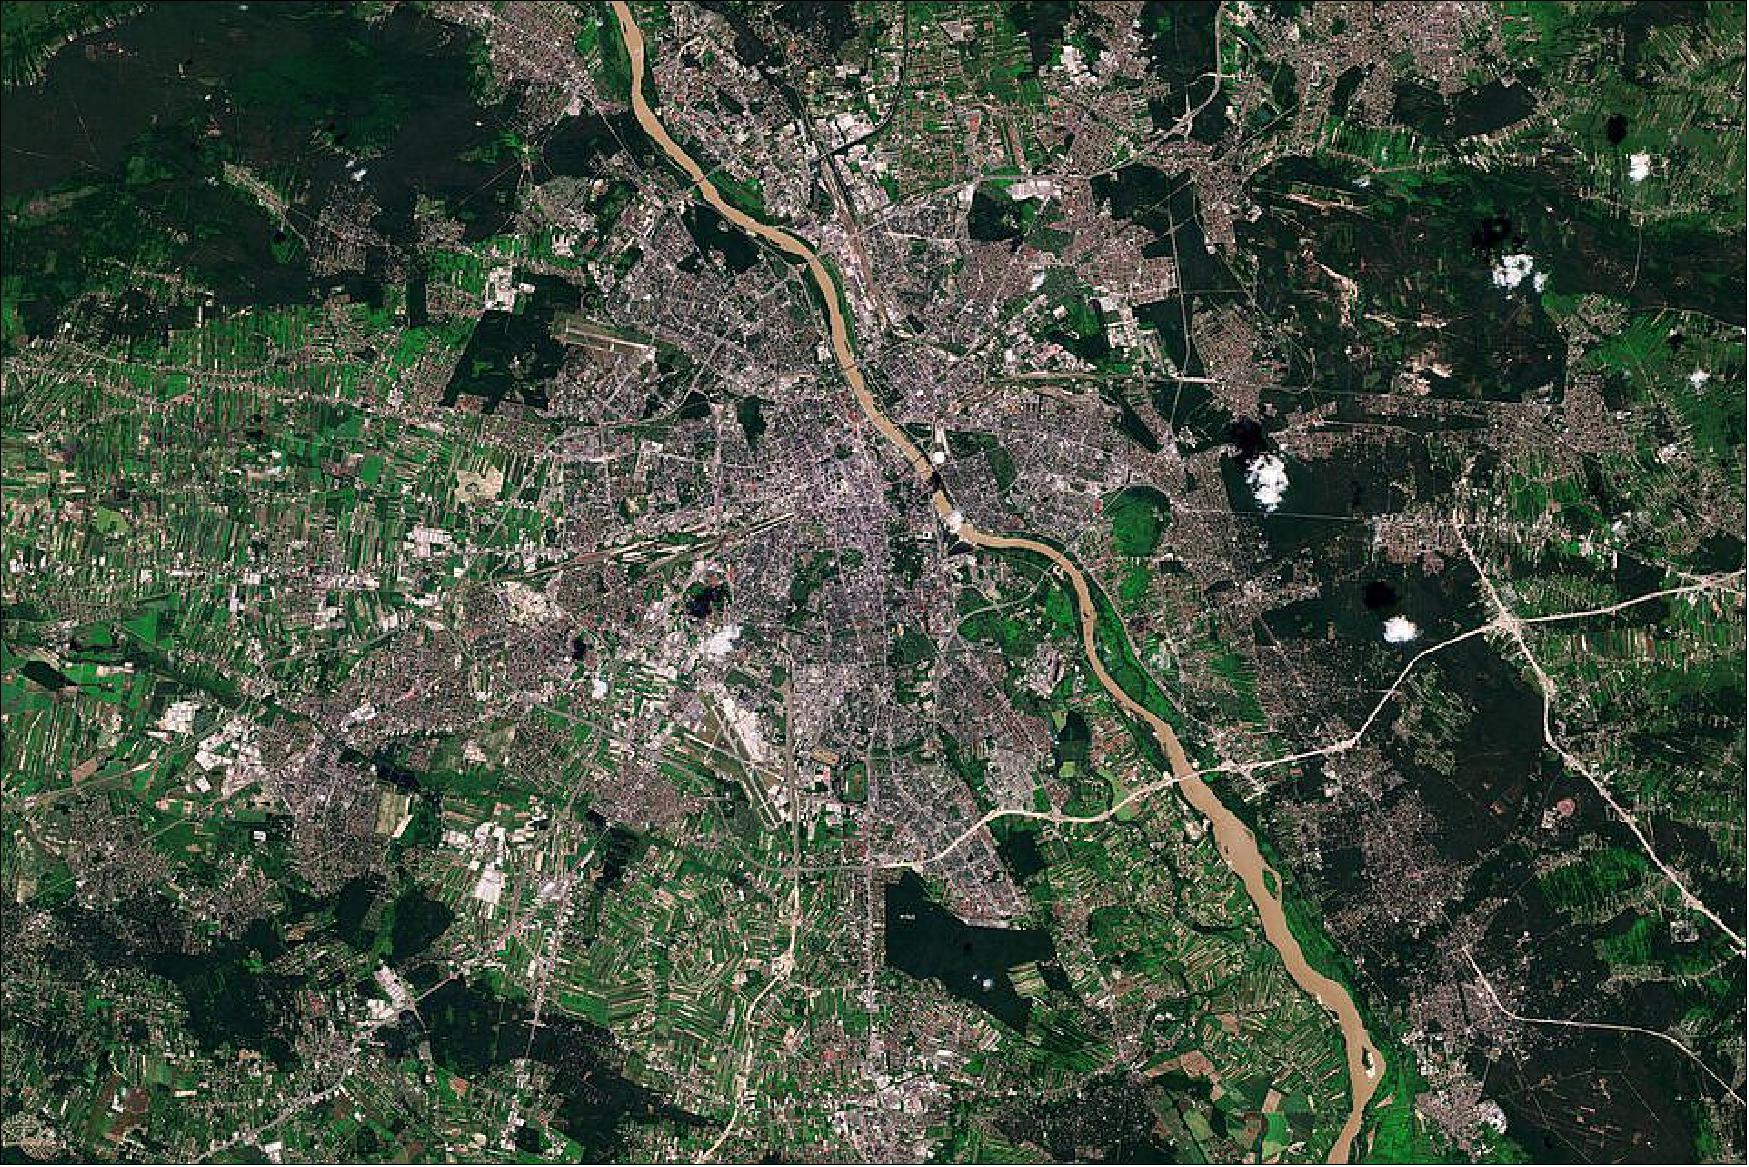
• June 4, 2021: The Copernicus Sentinel-2 mission takes us over Warsaw – the capital and largest city of Poland. 33)
- Warsaw straddles the Vistula (Wisla) River, the largest river in Poland. With a length of around 1000 km and a drainage basin of some 195 000 km2, the Vistula is an important waterway to the nations of Eastern Europe.
- The agricultural fields surrounding Warsaw, visible in the left of the image, are very distinctive with their small and highly fragmented shape. These unique agricultural structures are most likely due to the fact that many farms are private, with most fields covering a relatively small area (around 9 hectares on average).
- Divided into right and left bank portions by the river, Warsaw extends around 30 km from north to south and around 25 km from east to west. On the west bank of the river, lies Warsaw’s historical Old Town (Stare Miasto) which holds the most prominent tourist attractions and was designated a UNESCO World Heritage Site in 1980.
- East of the Vistula lies the Narodowy National Stadium, a retractable-roof stadium used for professional football, concerts and was used as the location of the United Nations Climate Change Conference (COP-19) in November 2013.
- Warsaw is also home to a prominent statue dedicated to the mathematician and astronomer Nicolaus Copernicus, which stands near the Polish Academy of Sciences. Copernicus was an important figure to humanity’s understanding of the universe. His theory of the heliocentric universe, the notion that Earth orbits the sun, went against the Ptolemy’s system which had been in place for a thousand years, which stated that Earth was at the centre of the solar system.
- Owing to Copernicus’ pioneering contribution to modern science, the European Union named their Earth observation programme after him. The programme provides accurate, timely and easily accessible information to monitor our planet and its environment, understand and mitigate the effects of climate change and ensure civil security.
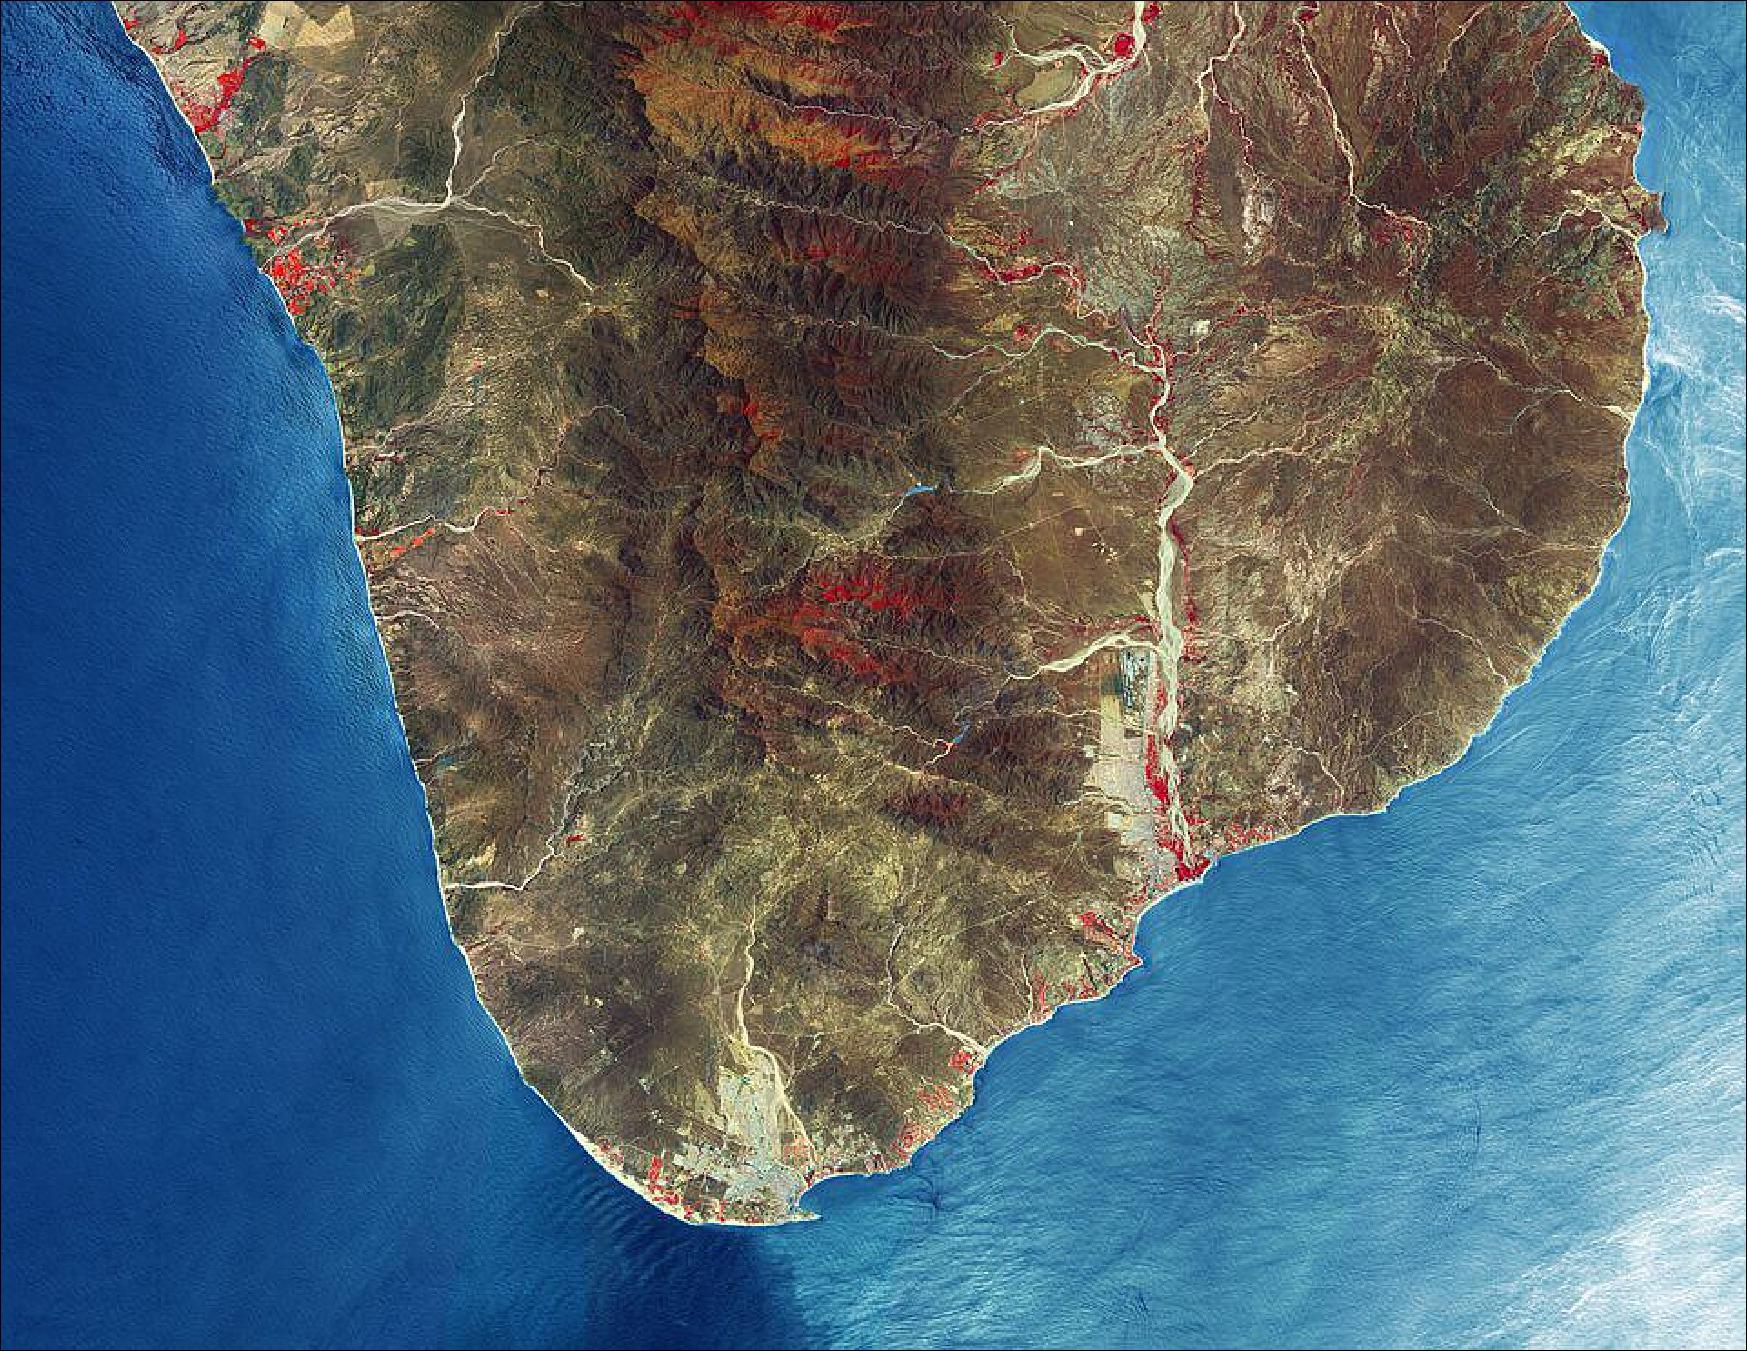
• May 21, 2021: The Copernicus Sentinel-2 mission takes us over Los Cabos – a municipality on the southern tip of Mexico's Baja California Peninsula. 34)
- Meaning ‘the capes’ in Spanish, Los Cabos is a region composed of mountains and coastal plains and is largely dry and rocky with over 320 days of sunshine each year. The area encompasses the two cities of Cabo San Lucas (visible in the bottom-left) and San José del Cabo (visible to the right).
- The area along the coast between the two cities, often referred to as the Los Cabos Resort Corridor or simply the Corridor, stretches around 30 km along the highway and features a plethora of beaches dotted primarily with hotels, resorts and golf courses.
- The peninsula ends with the Arch of Cabo San Lucas, known locally as ‘El Arco’ or ‘Land’s End.’ This distinctive land formation, carved by winds and waves, is where the Pacific Ocean meets the Gulf of California, also known as the Sea of Cortez.
- The Arch of Cabo San Lucas is adjacent to Lovers Beach (Playa del Amor) on the Sea of Cortez side and Divorce Beach (Playa del Divorcio) on the rougher Pacific Ocean side. The arch is a popular gathering area for sea lions and is frequented by tourists.
- A region of mountains dominate the landscape including the Sierra de la Laguna Mountain Range and the Sierra de San Lázaro, which are both formed of volcanic rock with peaks between 400 and 1000 m.
- The main river in the area is the San José River, visible in the right of the image, and flows north to south primarily during the summer rainy season. The river creates an estuary at its southern end, which is one of the largest in Mexico and is home to both native and migratory birds.
Los Cabos seasonal comparison
The Copernicus Sentinel-2 images of Figures 43 and 44 show a seasonal comparison over Los Cabos – a municipality on the southern tip of Mexico's Baja California Peninsula. Both images have been processed in a way that included Sentinel-2’s near-infrared channel, which makes vegetation appear bright red.
This type of band combination from Sentinel-2 is most commonly used to assess plant density and health, as plants reflect near-infrared and green light, while absorbing red. Since they reflect more near-infrared than green, dense, plant-covered land appears in bright red in the image.
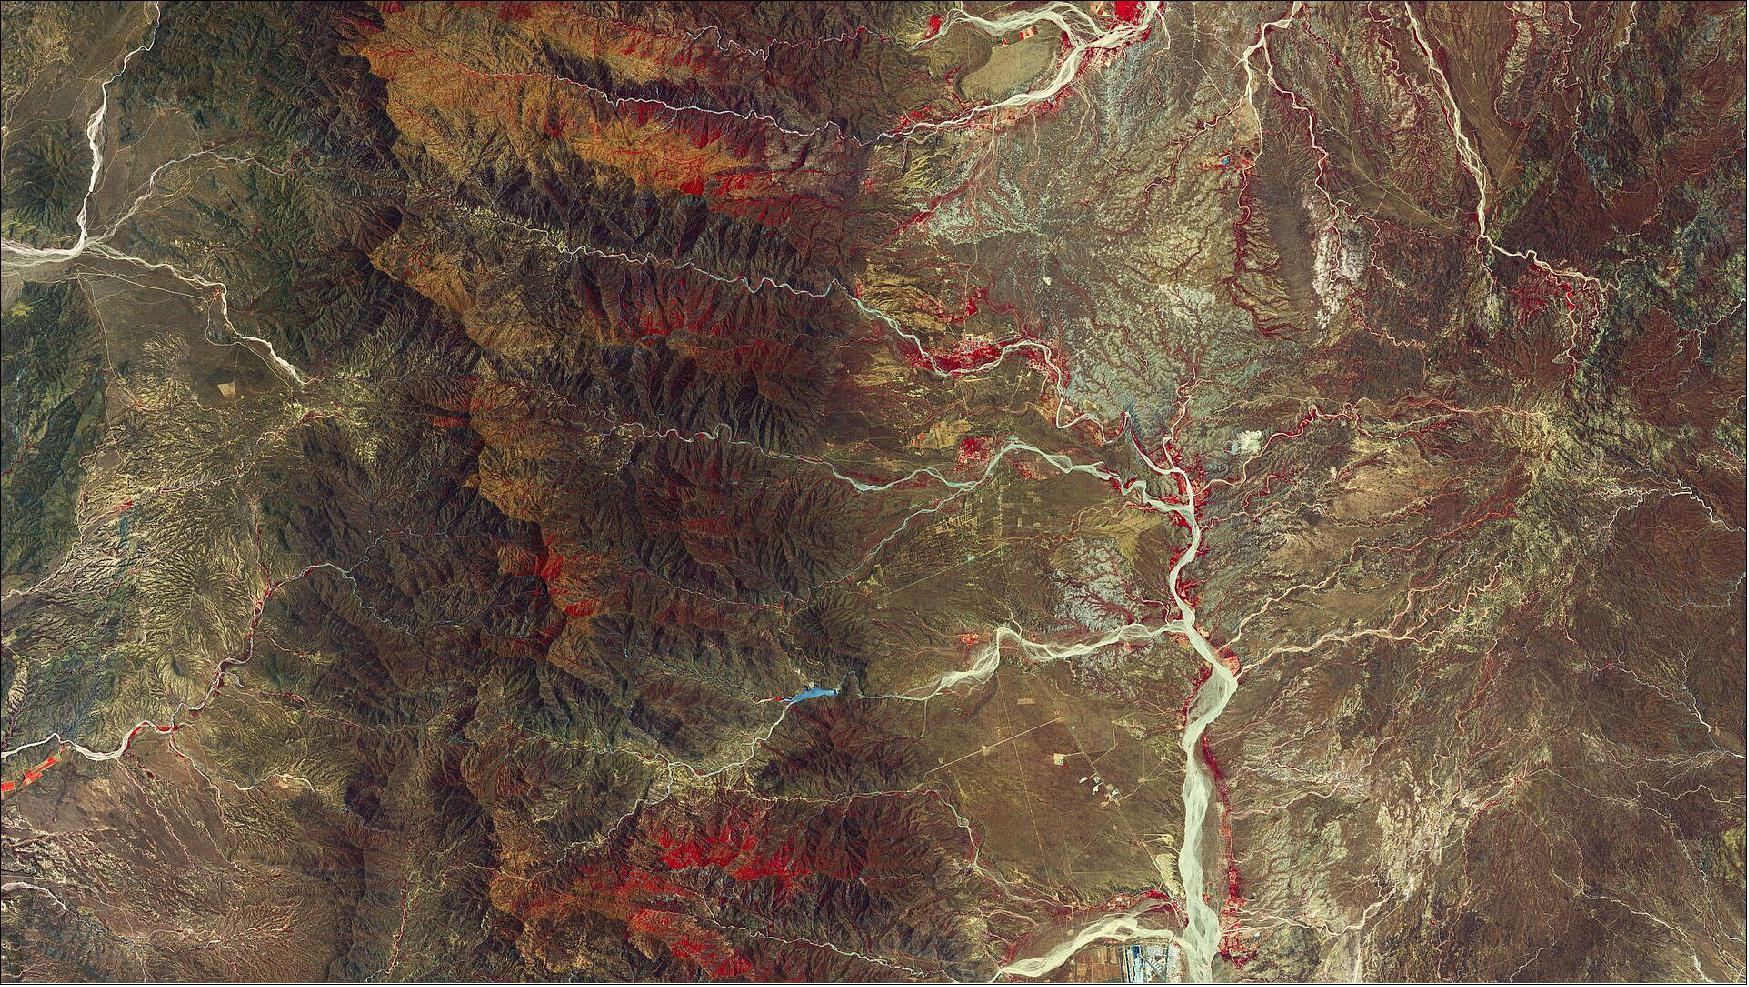
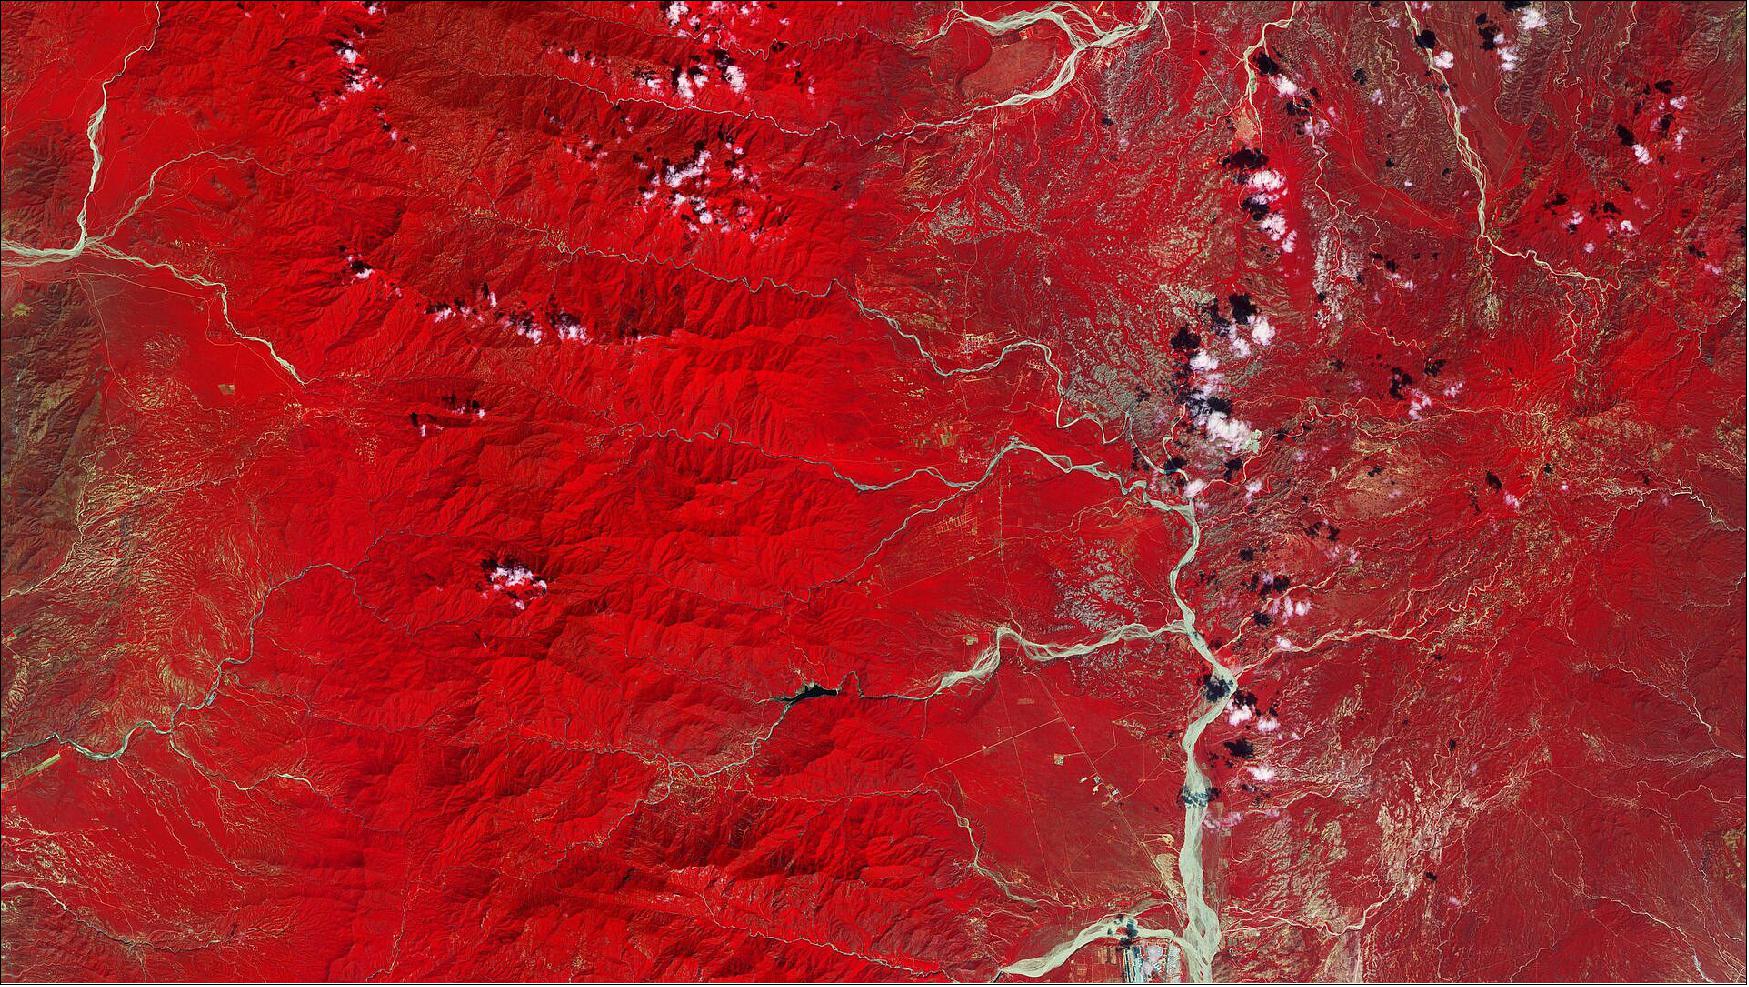
• May 18, 2021: Hundreds of satellite images spanning over 25 years have been compiled to show the evolution of Greece’s ever-changing coastlines. 35)
- For decades, coastal areas have been subject to intense urbanization and population growth. These areas are some of the most dynamic on Earth and, unfortunately, suffer from severe coastal hazards owing to storm activity and sea level rise. Monitoring coastal areas is key to understanding the evolution of coastal dynamics and in helping authorities protect these environments.
- The Space for Shore project, funded by ESA, provides a variety of tools for coastal erosion monitoring using Earth observation products. The consortium is composed of technical experts from five European countries.
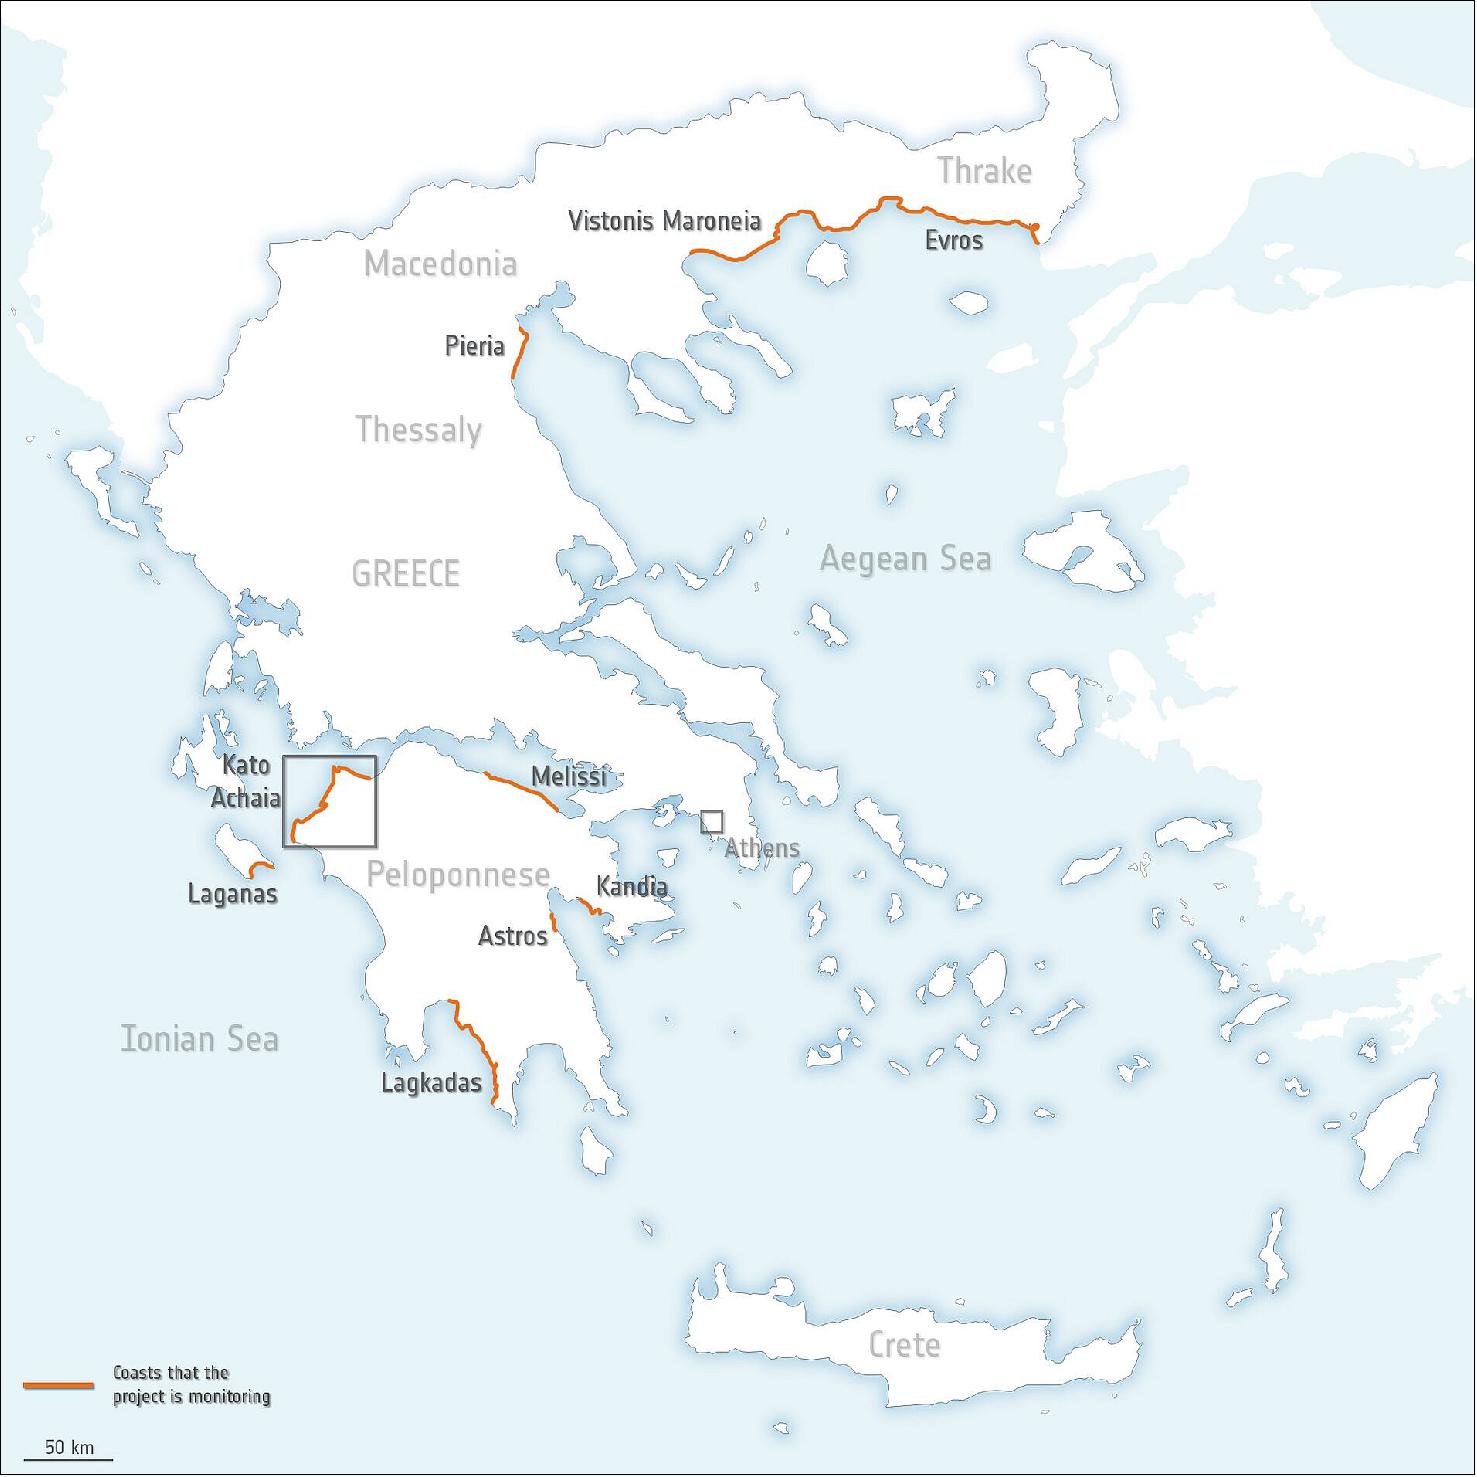
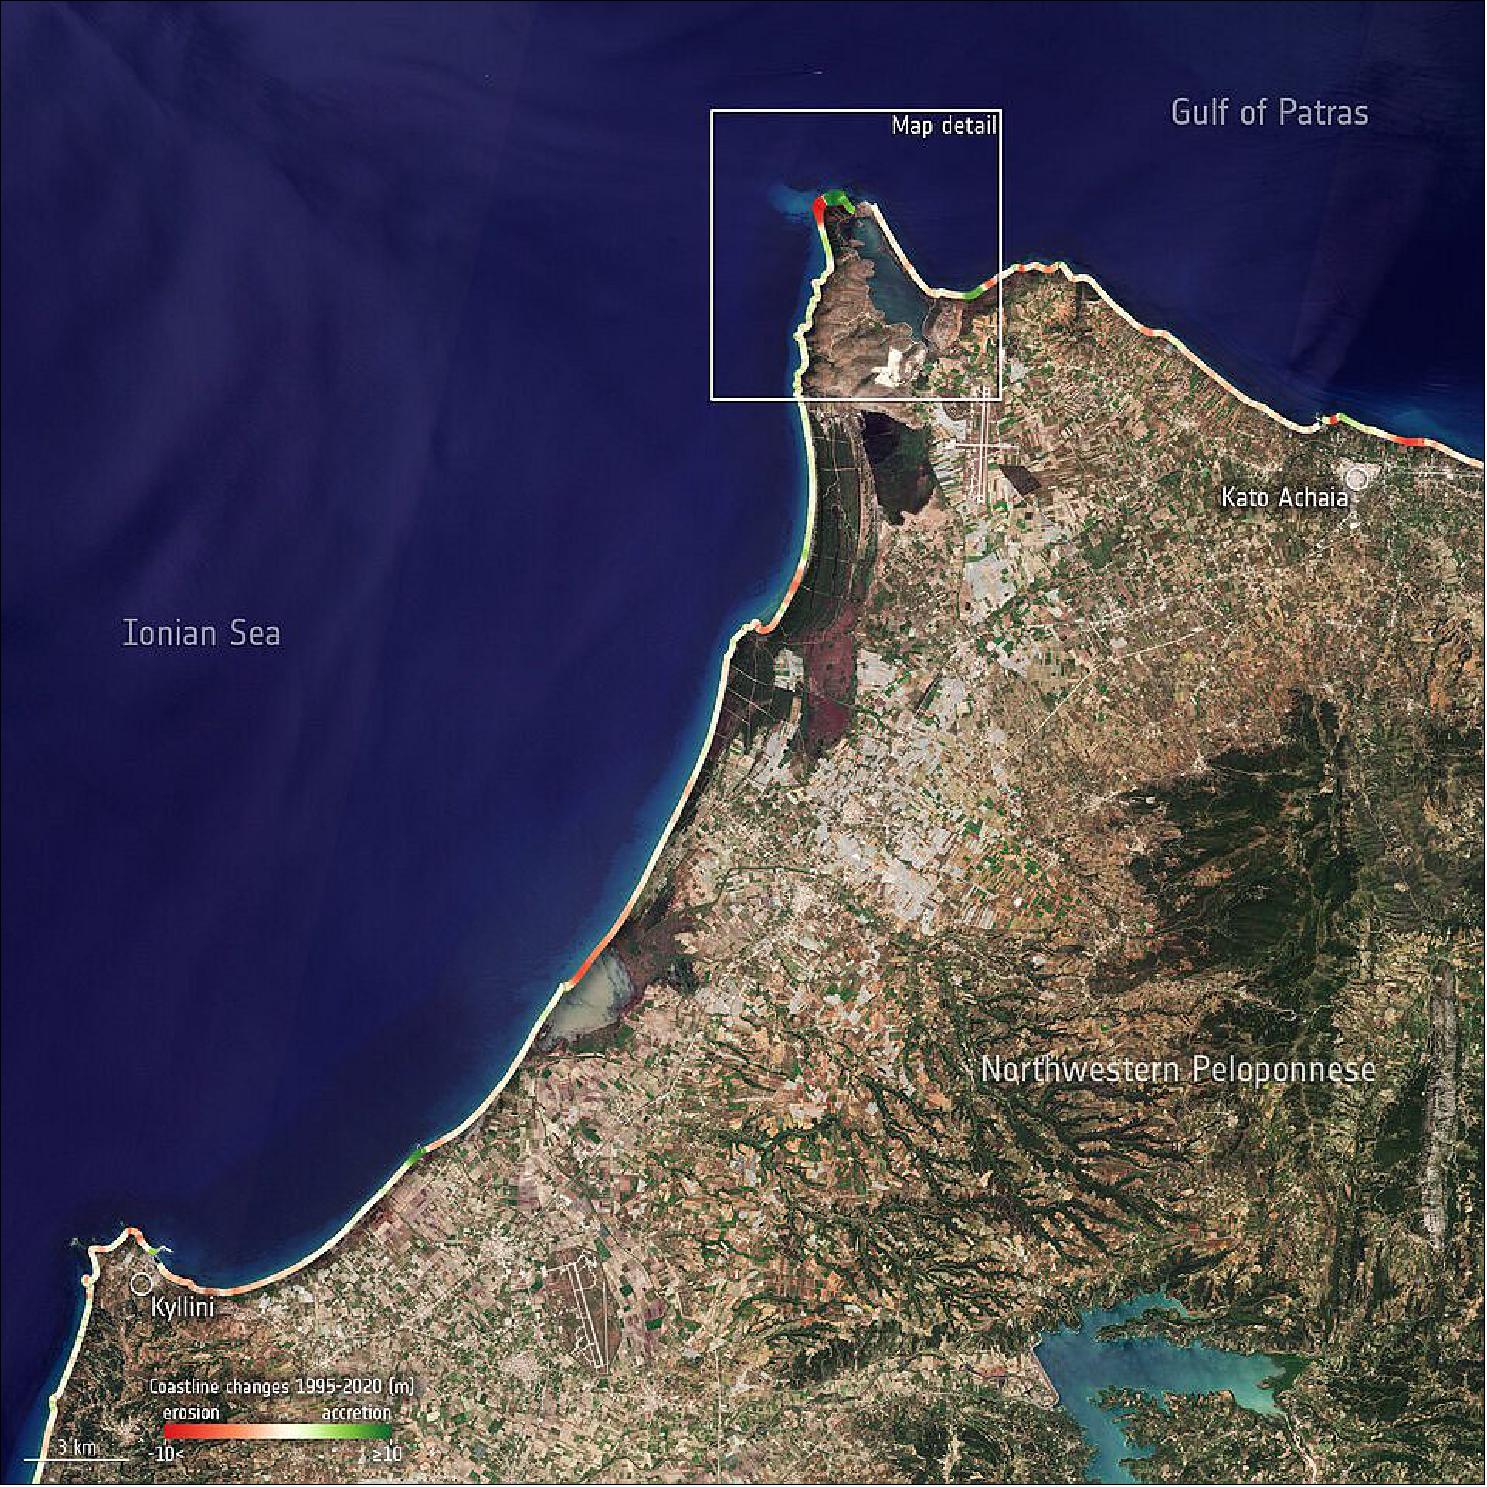
- Two key players of the consortium, Terraspatium and i-Sea, have processed hundreds of satellite images, including data from the Copernicus Sentinel-2 mission, from 1995—2020 to analyze over 900 km of coast in Greece – in the Peloponnese, Eastern Macedonia and Thrace regions.
- The results highlight the fragility of Greece’s coastline and indicate the likelihood of coastal erosion increasing in the coming years. Over the 1995—2020 period, around 40% of the coastlines analyzed have shown ‘progradation’ which is the seaward growth of beaches caused by the progressive build-up of sediment. The team found that nearly 10% of the studied coastal areas are subject to erosion greater than 3 m per year.
- Deltas, estuaries and capes appear to be the most exposed areas with retreat that can reach 30 m per year. Erosion at river mouths are especially of great concern as this signifies a sediment deficit and suggests critical and long-lasting consequences for coasts deprived of sediment input from rivers.
- As an example, the team studied Zakynthos Island, particularly the Laganas coastal area. Given that the beaches are frequently watched by ecologists who closely monitor the migration of loggerhead sea turtles, they found it to crucial to observe the bathymetry and the waterline of the coast to record changes in its environmental impact.
- Aurélie Dehouck, Head of i-Sea and coordinator of Space for Shore, commented, “Over the last 25 years, our analysis has revealed a strong variability in Greece’s coastlines, with extremely dynamic local changes.

- “From this assessment of intra-period variability, two foregone conclusions emerge: the need to monitor coastal dynamics on crossed timescales to better identify sediment movement, problematic depletions and coastal responses to high-energy events, and the need to constantly monitor in order to know the real status of beaches of which the issues of the present and the future are based.”
- “Through the Space for Shore project, a comprehensive set of in situ scientific measurements, combined with numerous retrospective remote sensing data were produced. Thus, an evidence-based up-to-date assessment framework for the extent of coastal erosion was provided, rendering it an extremely helpful and substantially incomparable toolkit to the coastal managers throughout the region, both for the present and future use,” commented Athanasios Nalmpantis from the Public Sector at the Region of Eastern Macedonia & Thrace.
- On 22 January 2021, the results of the Coastal Change from Space project were presented in an online webinar.
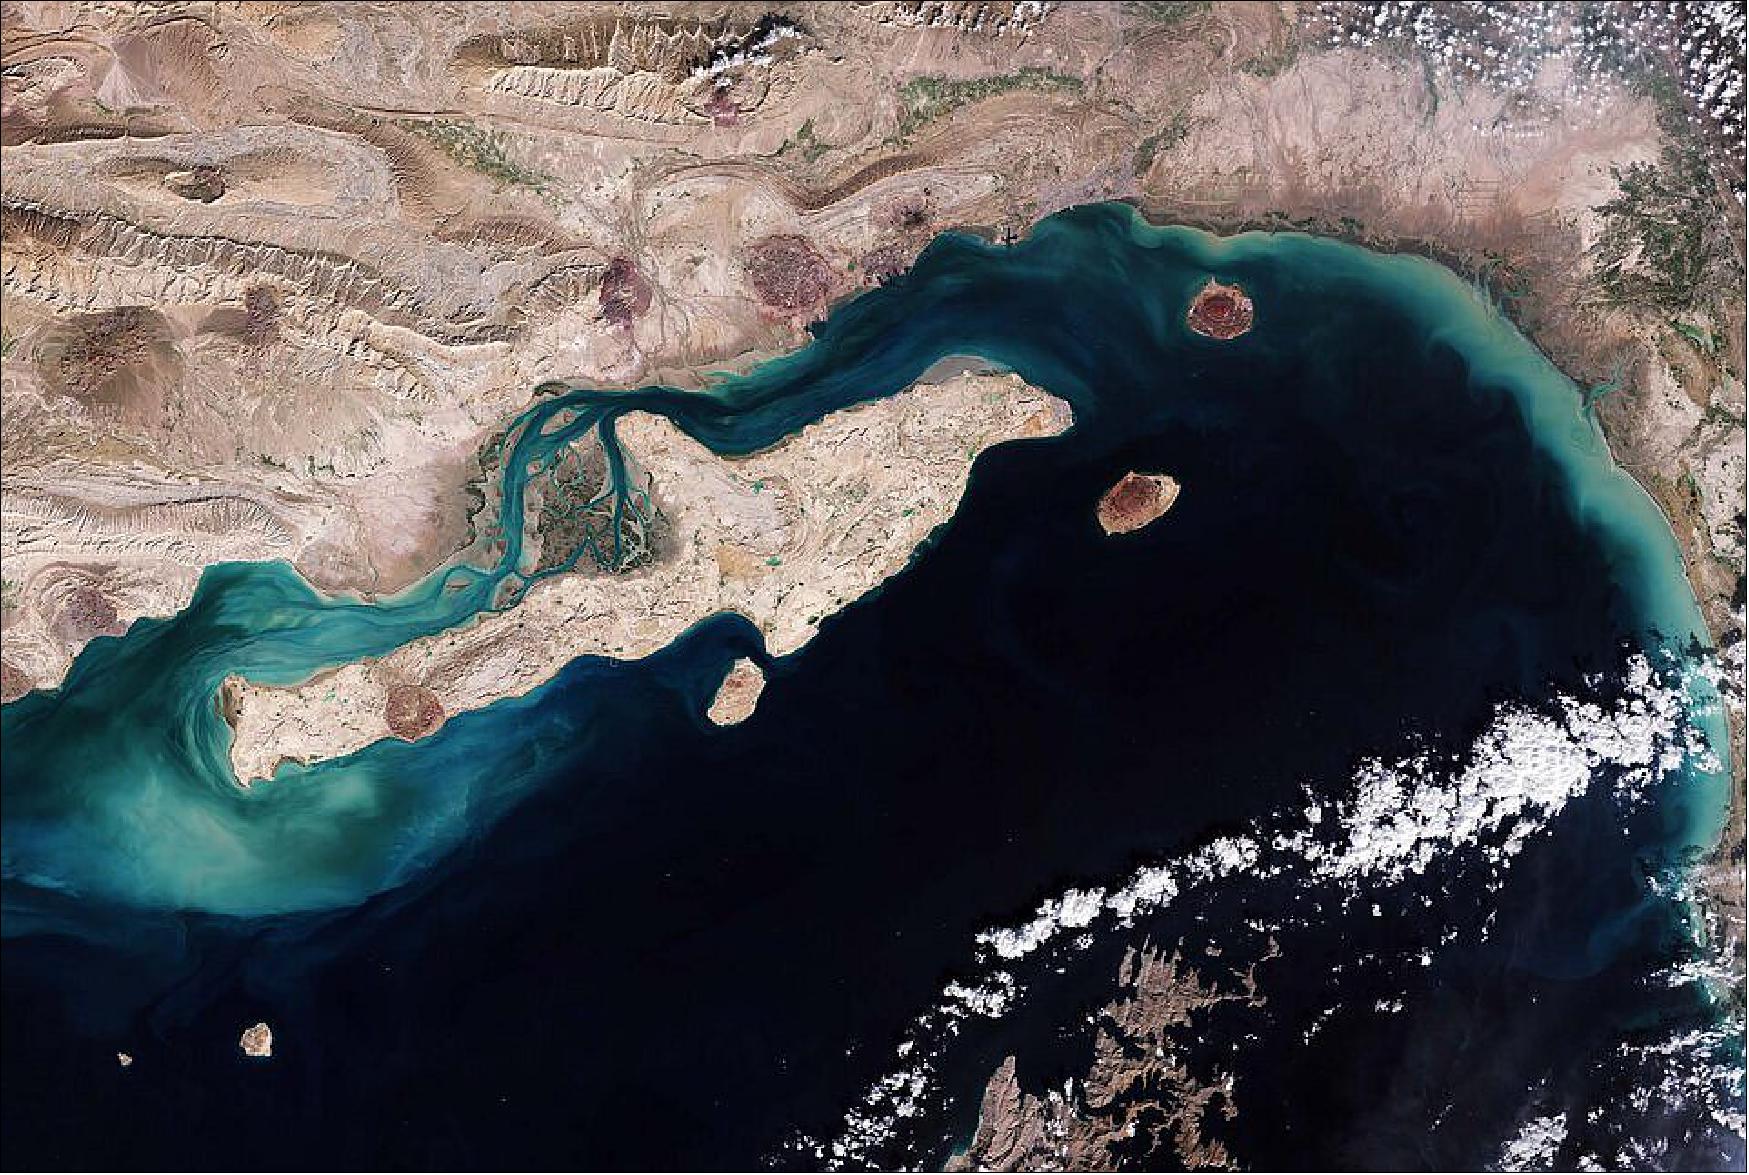
• May 14, 2021: The Copernicus Sentinel-2 mission takes us over Qeshm Island – the largest island in Iran. 36)
- Qeshm Island lies in the Strait of Hormuz, parallel to the Iranian coast from which it is separated by the Clarence Strait (Khuran). With an area of around 1200 km2, the island has an irregular outline and shape often compared to that of an arrow. The island is approximately 135 km long and spans around 40 km at its widest point.
- The Hara Forest Protected Area, a network of shallow waterways and forest, can be seen clearly in the image, between Qeshm Island and the mainland. Hara, which means ‘grey mangrove’ in the local language, is a large mangrove forest and protected area that brings more than 150 species of migrating birds during spring, including the great egret and the western reef heron. The forest also hosts sea turtles and aquatic snakes.
- The dome-shaped Namakdan mountain is visible in the southwest part of the island and features the Namakdan Cave – one of the longest salt caves in the world. With a length of six km, the cave is filled with salt sculptures, salt rivers and salt megadomes.
- The water south of Qeshm Island appears particularly dark, while lighter, turquoise colors can be seen in the left of the image most likely due to shallow waters and sediment content. Several islands can be seen in the waters including Hengam Island, visible just south of Qeshm, Larak Island and Hormuz Island which is known for its red, edible soil.
- Several cloud formations can be seen in the bottom-right of the image, as well as a part of the Musandam Peninsula, the northeastern tip of the Arabian Peninsula. The peninsula’s jagged coastline features fjord-like inlets called ‘khors’ and its waters are home to dolphins and other marine life.
- Data from the Copernicus Sentinel-2 mission can help monitor changes in urban expansion, land-cover change and agriculture monitoring. The mission’s frequent revisits over the same area and high spatial resolution also allow changes in inland water bodies to be closely monitored.
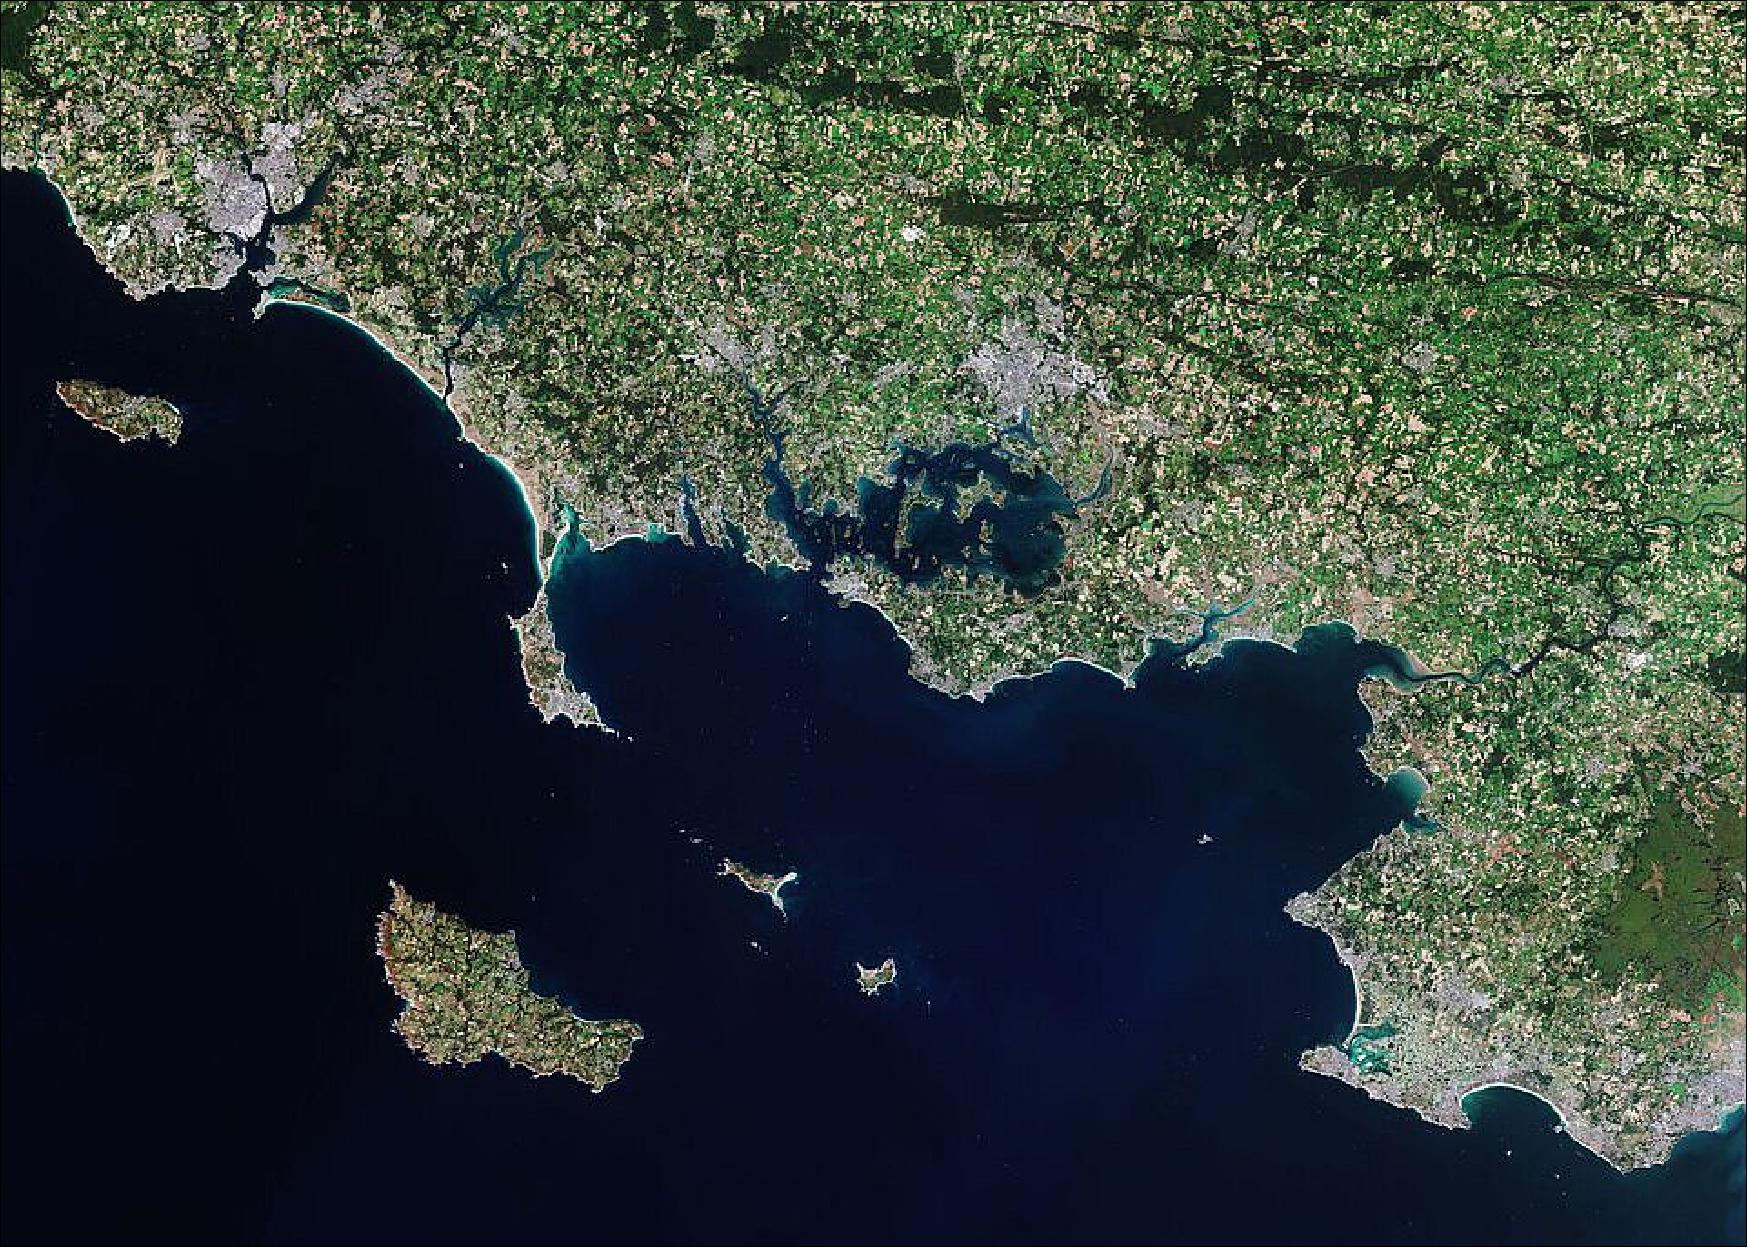
• May 07, 2021: The Copernicus Sentinel-2 mission takes us over Morbihan – a French department in the south of Brittany. 37)
- Morbihan takes its name from ‘Mor-Bihan’ which means ‘little sea’ in the Breton language. The Gulf of Morbihan, visible in the center of the image, is one of the most famous features of the coastline with numerous islands and islets. The gulf is around 20 km long from east to west and around 15 km wide from north to south. It opens onto the Bay of Quiberon by a narrow passage between Locmariaquer and Port-Navalo.
- Many ships and vessels can be seen in the bay. Several islands are visible in the image, including the small islands of Houat and Hœdic and the large Belle Île, which is visible in the bottom-left of the image. Belle Île is known for the sharp cliff edges visible on the southwest side, but also for its beaches and renowned opera festival.
- The town and sea port of Lorient is visible in the top-left of the image. The town is situated on the right bank of the Scorff River at its confluence with the Blavet on the Bay of Biscay. The island of Groix lies a few kilometers off Lorient. The island has high cliffs on its north coast and sandy beaches in secluded coves on the south coast.
- Morbihan is also known for its ‘Alignements de Carnac’ which consists of rows of around 3000 standing stones and megalithic tombs. The stones were said to be erected during the Neolithic period, around 4500 BC. Most of the stones are within the Breton village of Carnac, but some to the east are within La Trinité-sur-Mer.
- Fields dominate the French countryside as seen in this image captured on 13 September 2020. Brittany is known for its rich and varied agriculture including meats and dairy products, but also provides a variety of high quality fruit and vegetables including tomatoes, strawberries, peas and green beans.
- The Copernicus Sentinel-2 mission is designed to provide images that can be used to distinguish between different crop types as well as data on numerous plant indices, such as leaf area, leaf chlorophyll and leaf water – all essential to monitor plant growth accurately.
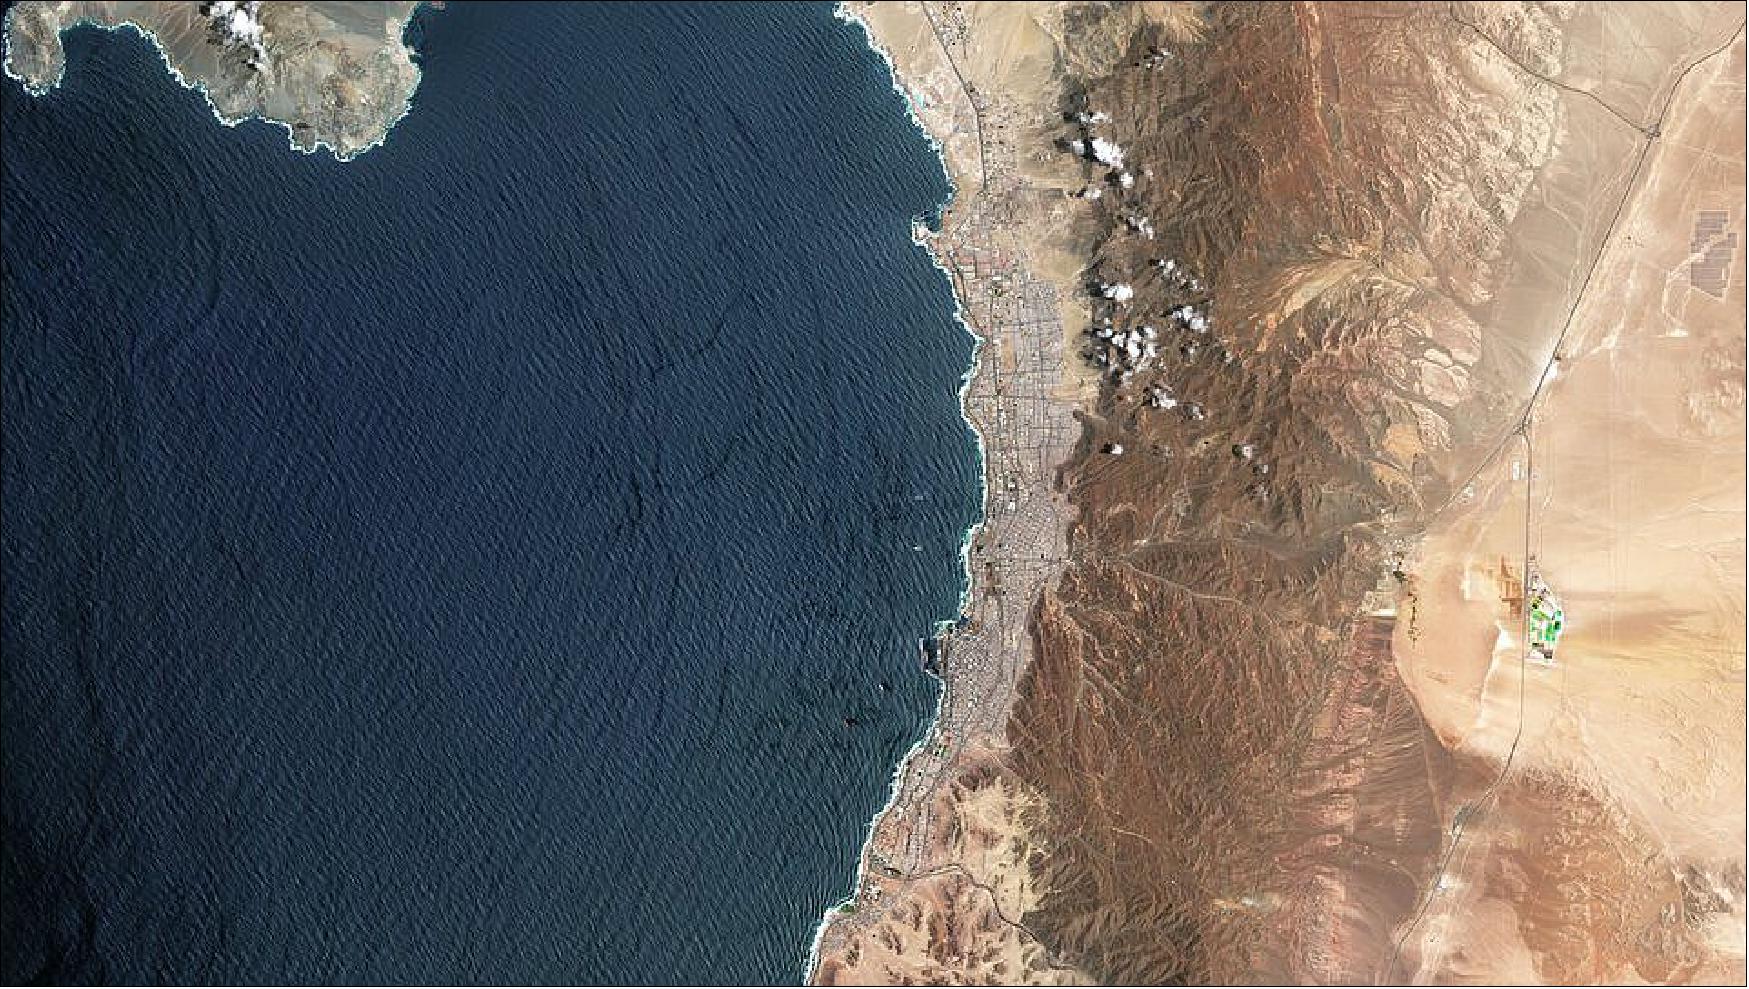
• April 30, 2021: Antofagasta, a port city in northern Chile, is featured in this image captured by the Copernicus Sentinel-2 mission. 38)
- The city stretches approximately 22 km along the coast, snuggled between the ocean and the arid mountains to the east. The largest city in northern Chile, Antofagasta has a population of around 400,000 people. The city’s early growth resulted from the discovery of nitrate deposits in 1866, while today the economy is mainly based on the exploitation of various minerals such as copper and sulphur.
- Located around 1000 km north of Santiago, Antofagasta is the capital of both the Antofagasta Province and Region. The Antofagasta province borders the El Loa and Tocopilla provinces to the north and the Pacific Ocean to the west.
- In the right of the image (Figure 50), large, emerald green geometric shapes are visible and are most likely evaporation ponds used in mining operations. These bright colors are in stark contrast with the surrounding desert landscape, which is largely devoid of vegetation, making them easily identifiable from space.
- The city of Antofagasta is also a communications centre on the Pan-American Highway, visible as distinctive black lines in the right of the image, and is also linked by rail to the mines, as well as Bolivia and Argentina.
- Antofagasta is located within the Atacama Desert which is considered one of the driest places on Earth, as there are some parts of the desert where rainfall has never been recorded. Antofagasta typically has a cold desert climate with abundant sunshine, with January being its warmest month.
• April 30, 2021: One tends to think of mountain glaciers as slow moving, their gradual passage down a mountainside visible only through a long series of satellite imagery or years of time-lapse photography. However, new research shows that glacier flow can be much more dramatic, ranging from about 10 meters a day to speeds that are more like that of avalanches, with obvious potential dire consequences for those living below. 39)
- Glaciers are generally slow-flowing rivers of ice, under the force of gravity transporting snow that has turned to ice at the top of the mountain to locations lower down the valley – a gradual process of balancing their upper-region mass gain with their lower-elevation mass loss. This process usually takes many decades. Since this is influenced by the climate, scientists use changes in the rate of glacier flow as an indicator of climate change.
- For some glaciers around the world this gradual flow can speed up, so that they advance several kilometers in just a few month or years, a process called glacier surging. After a surge, the glacier usually remains still and the displaced ice melts over a few decades.
- Although surges can block rivers and create lakes that may burst suddenly, these events don’t often pose any danger, as by their very nature, they tend to be in remote and sparsely-populated regions – a fact that means that these events are often only known about thanks to data and images from satellites.
- For several years now, scientists have known that a glacier can also actually detach from the mountain rock and gush down to the valley at speeds of up to 300 km an hour as a fluid ice-rock avalanche.
- However, a paper published recently in The Cryosphere (Ref. 40) describes how scientists working in ESA’s Climate Change Initiative Glaciers team has discovered, together with several colleagues, that these glacier detachments have happened much more often than had been known. Even more surprisingly, this is happening to glaciers resting on relatively flat beds. 40)
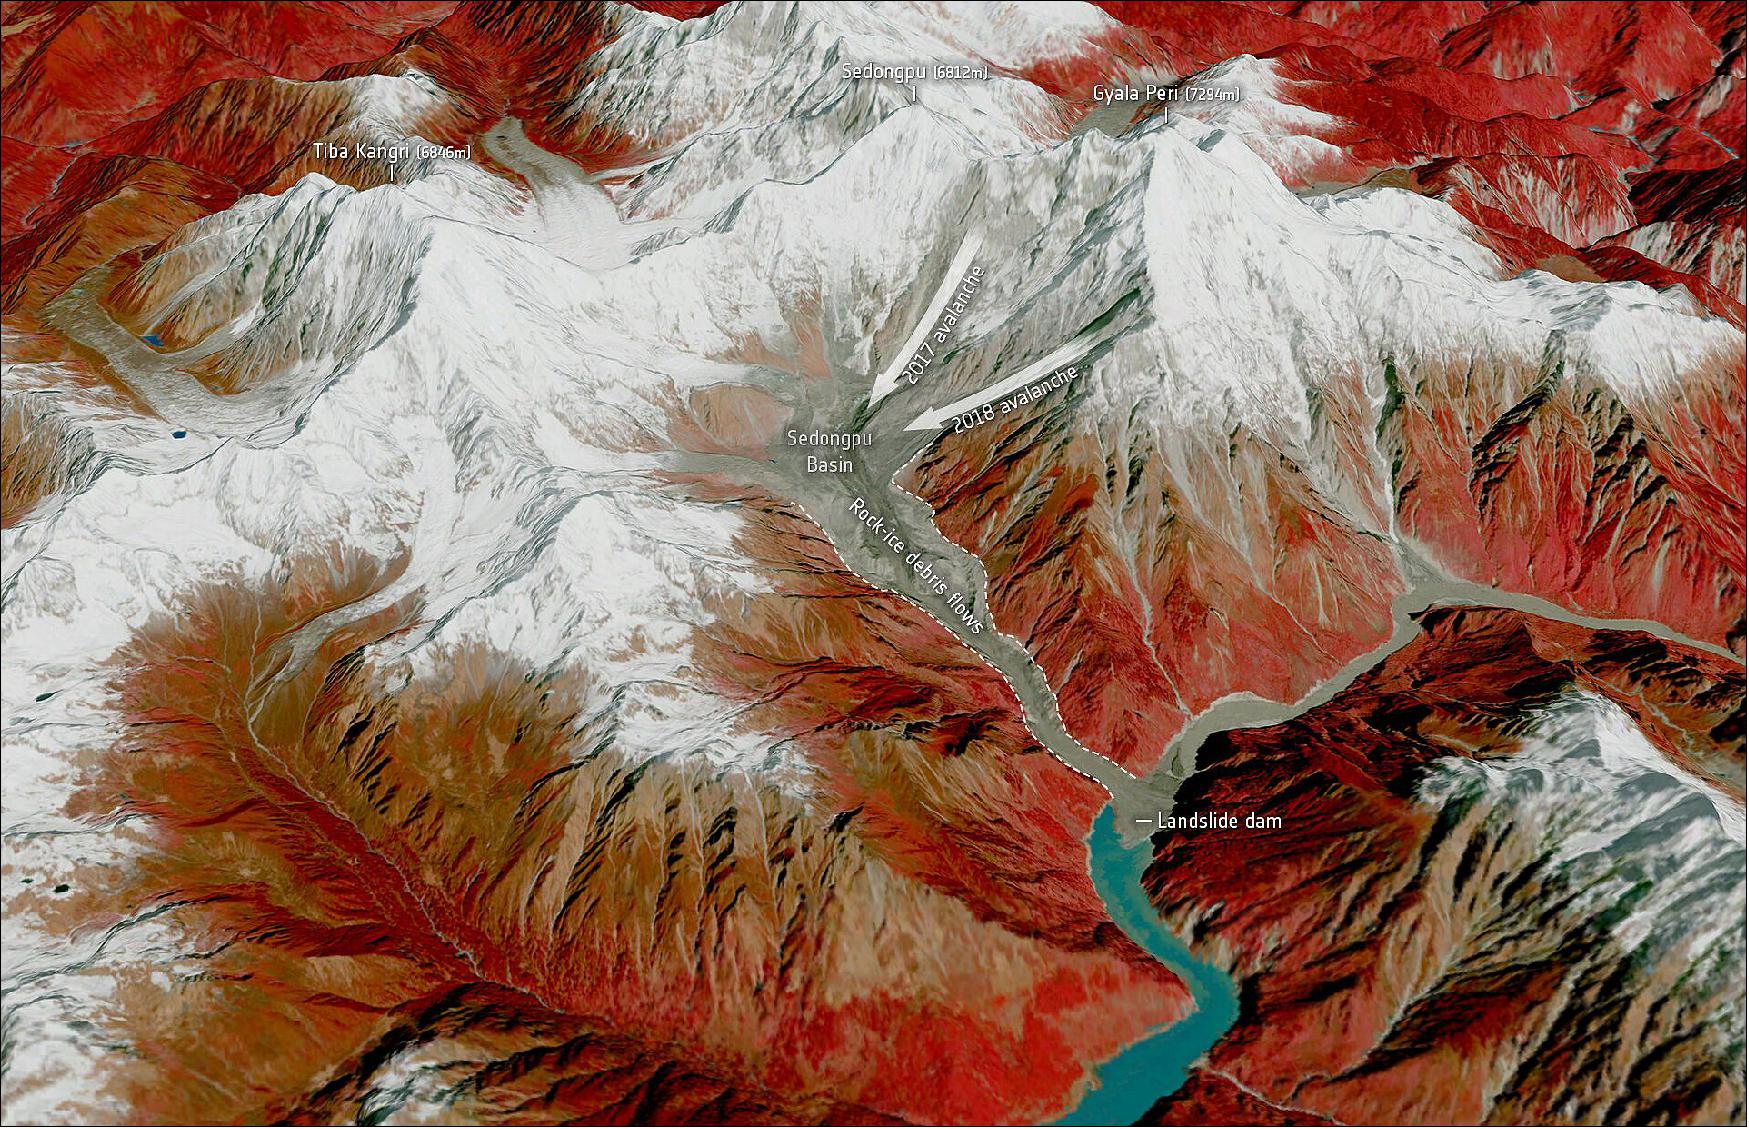
- Andreas Kääb, from the University of Oslo, explained, “We have known about debris flows originating from glaciers that break off at high elevations for several decades now, however, until relatively recently, we were extremely surprised to discover that glaciers resting on flatter beds can also detach as a whole.
- “These events are reported only rarely. In fact, they only really came to light in 2002 after a huge chunk of the Kolka glacier, which sits in a gently sloping valley on the Russian–Georgian border, detached and thundered down the valley at about 80 m/s, carrying around 130 million m3 of ice and rock that killed more than 100 people.
- “Using satellite data, we have now discovered that such events are more common than we could have ever imagined, and this might be a consequence of a changing climate.”
- The team of scientists from all over the world used data from different satellites including the Copernicus Sentinel-1 and Sentinel-2 missions and the US Landsat mission as well as digital elevation models to document and analyze events that were already known about, but also to identify glacier detachments that had not been recorded so far.
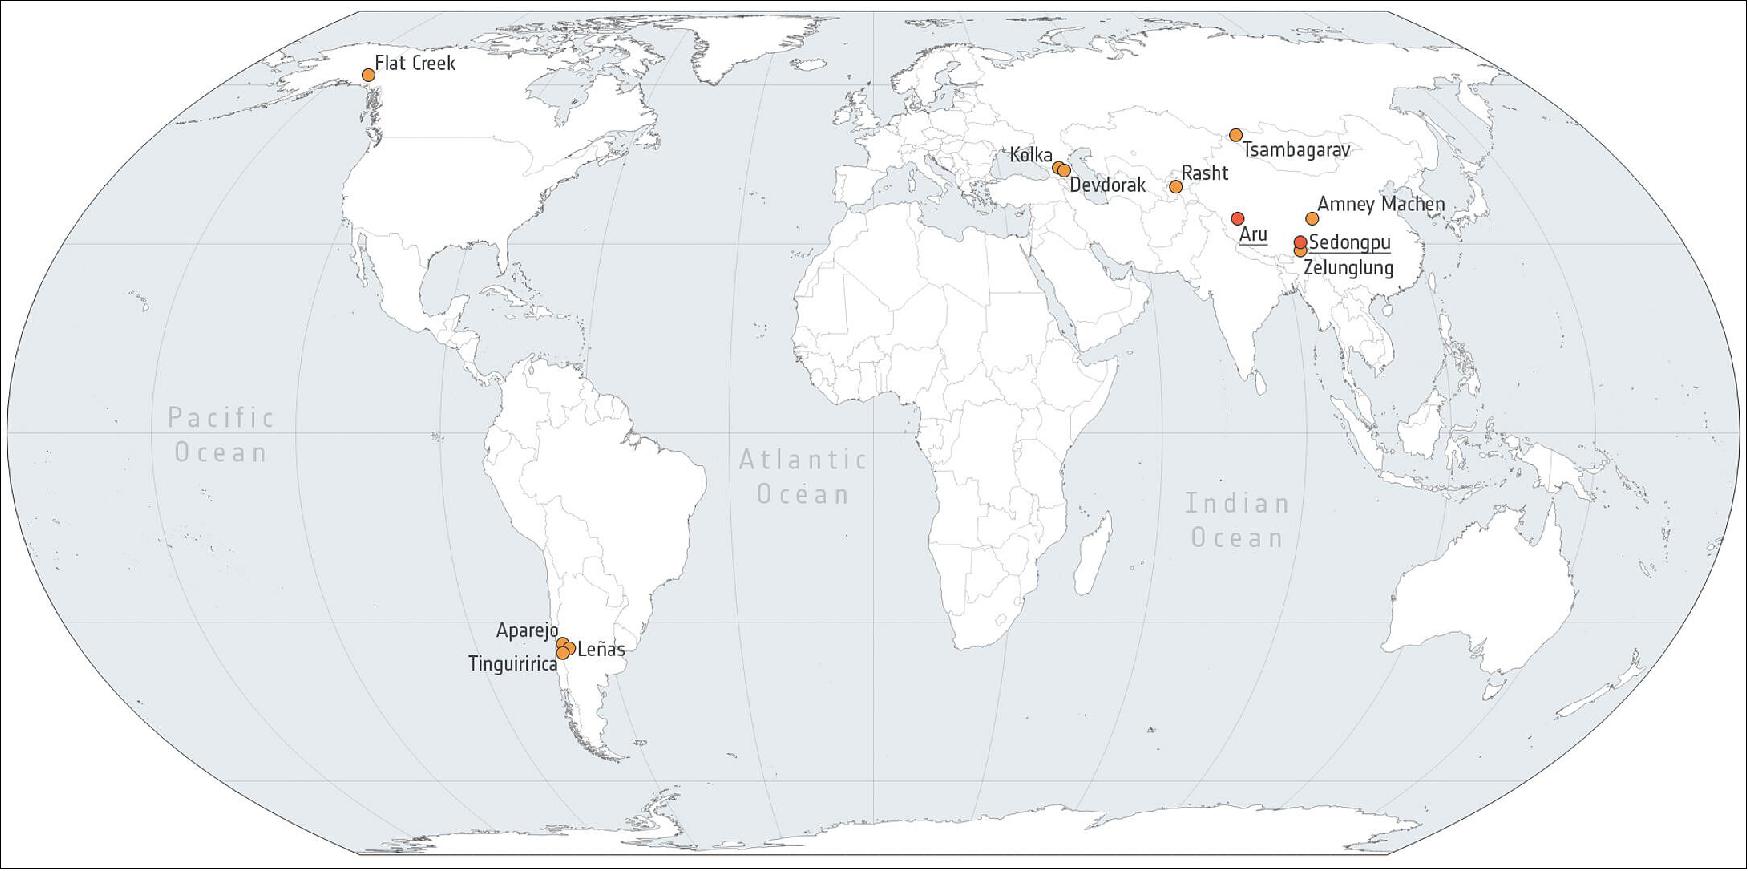
- They studied 20 glacier detachments that occurred in 10 different regions, from Alaska to the Andes and from the Caucasus to Tibet.
- Frank Paul, from the University of Zurich, said, “We analyzed the timing of events, calculated volumes, run-out distances, elevation ranges, permafrost conditions as well as possible factors triggering these glacier avalanches. Although we found some common characteristics, there are diverse circumstances that may have led to these events. However, we have concluded that, at least for some events, the effects of a warmer climate, such as permafrost thawing and meltwater infiltration, may well be to blame.”
- Andreas Kääb added, “The bottom line is that detachment of glaciers resting on flat bedrock are more common than we thought.
- “The current era of frequent high-resolution optical and radar data, not least from Sentinel-2 and Sentinel-1, has brought a step-change in detecting and understanding these events after they happen. Although we are still far away from having a prognostic tool to detect possible events before they happen, thanks to satellite data and this new understanding, we might be able to detect precursor signals in good time to potentially save lives.”
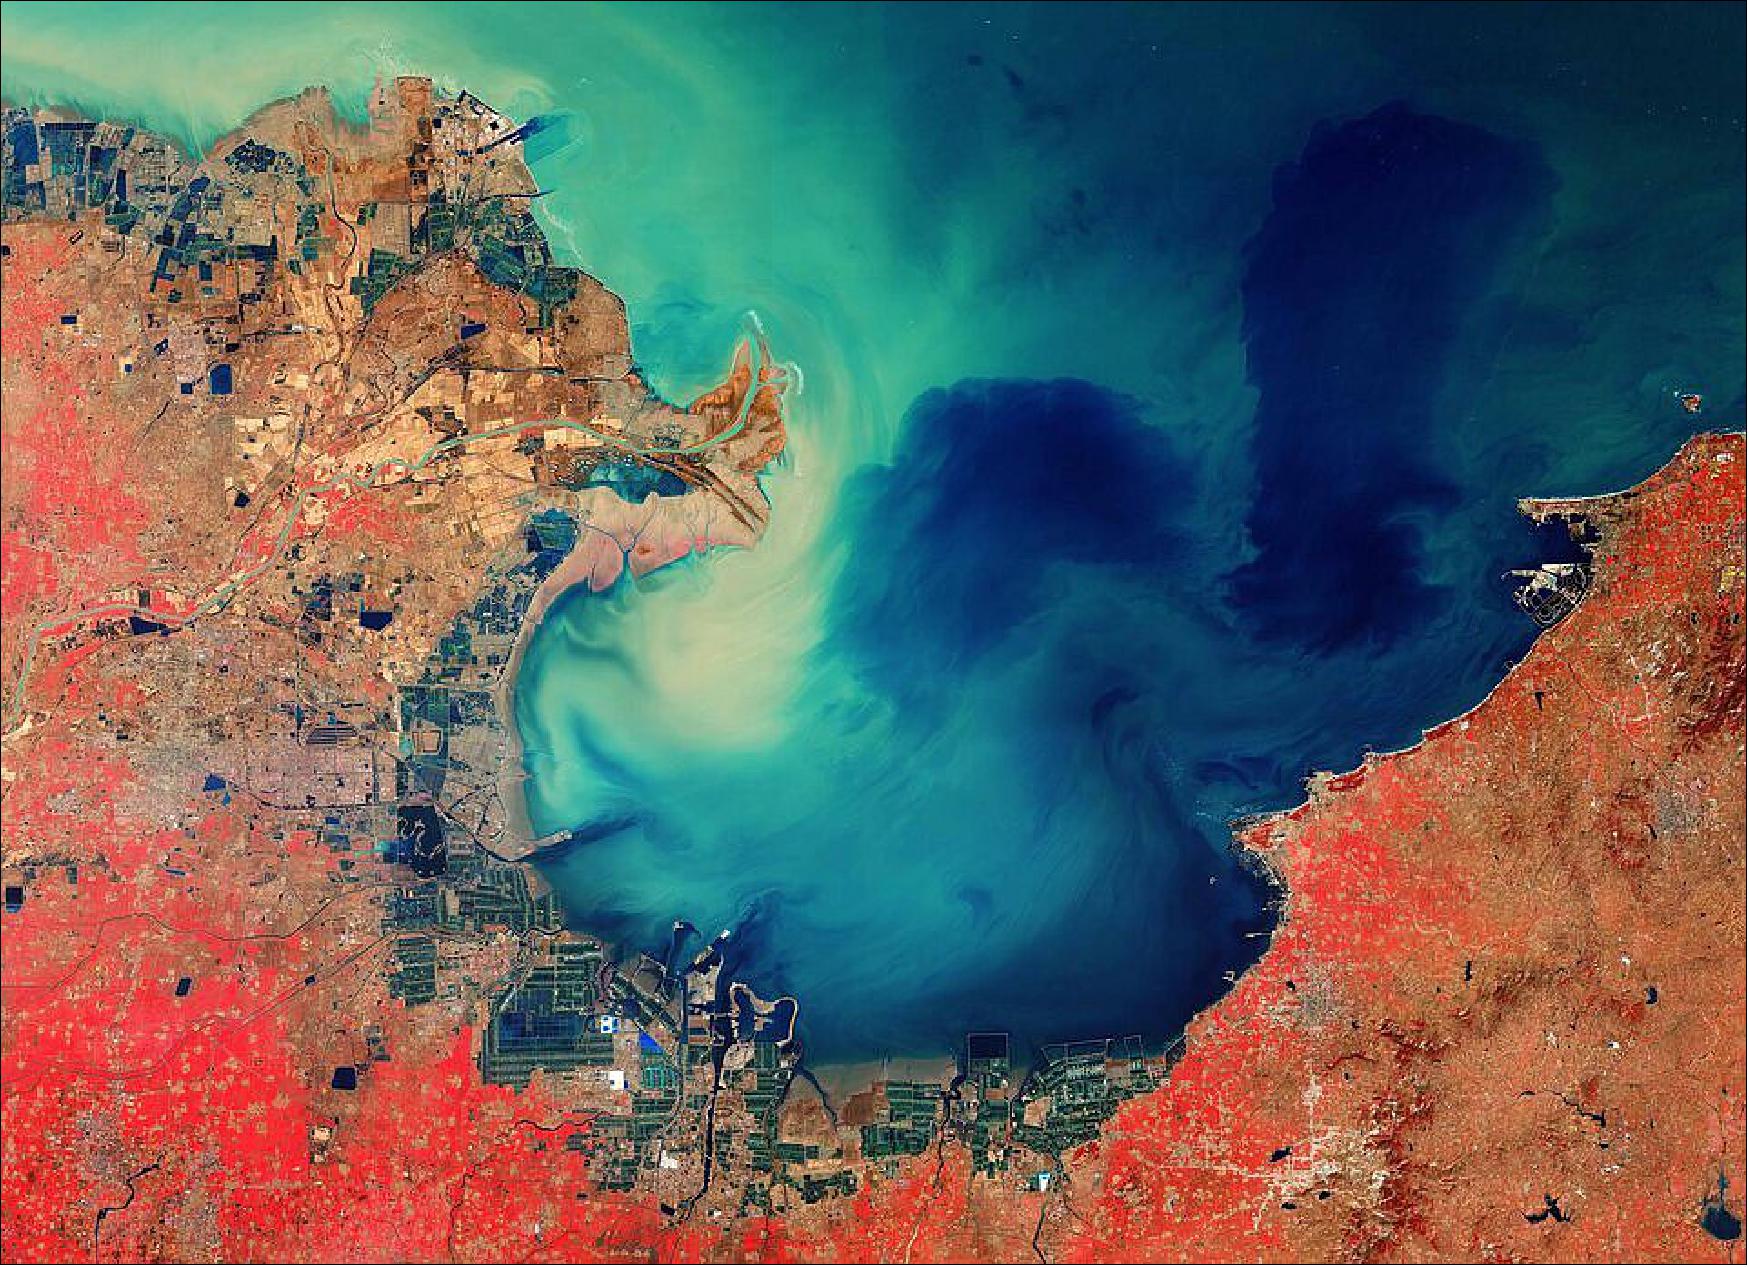
• April 23, 2021: The Copernicus Sentinel-2 mission takes us over the sediment-stained waters in Laizhou Bay, located on the southern shores of the Bohai Sea, on the east coast of mainland China. 41)
- The bay is the smallest of three main bays of the Bohai Sea, and is named after the city of Laizhou, visible to the east (Figure 54). Large quantities of sediment carried by the Yellow River, visible in the left of the image, discolor the waters of the bay and appear turquoise. This sediment can be seen throughout the waters in this image, even far from the coast.
- The Yellow River is China’s second longest river, with a length of over 5400 km, and is surpassed only by the Yangtze River. The river rises in the Bayan Har Mountains in Western China and flows through nine provinces before emptying into the Laizhou Bay. Its drainage basin is the third largest in the country, with an area of around 750,000 km2.
- The river is estimated to carry 1.6 billion tons of silt annually, carrying the majority to the sea. Owing to this heavy load of silt, the Yellow River deposits soil in stretches, ultimately elevating the river bed. Excessive sediment deposits have raised the river bed several meters above the surrounding ground, sometimes causing damaging floods.
- On the southern coast of Laizhou Bay, in the bottom of the image, flooded fields are visible and are most likely artificial fish farms. The city of Dongying, home to the second largest oilfield in China, is visible in the left of the image.
- Copernicus Sentinel-2 is a two-satellite mission. Each satellite carries a high-resolution camera that images Earth’s surface in 13 spectral bands. The mission is mostly used to track changes in the way land is being used and to monitor the health of vegetation.
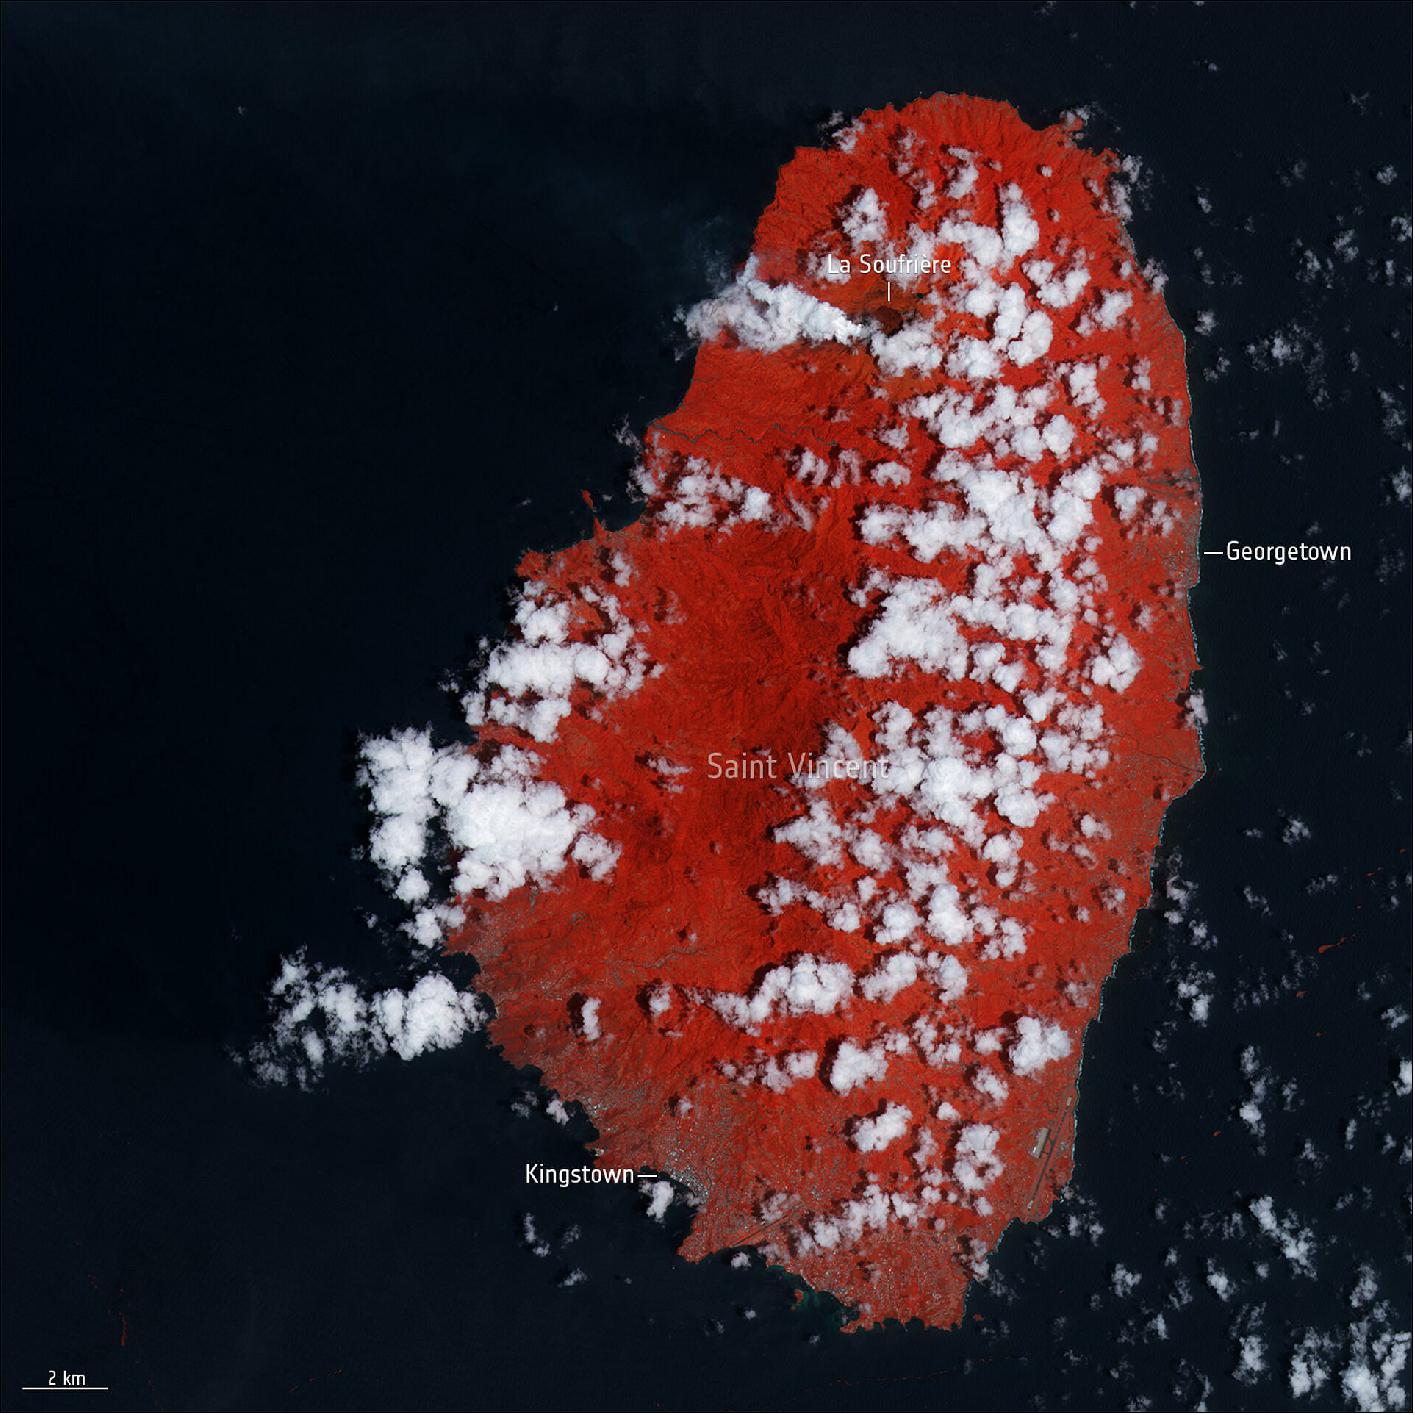
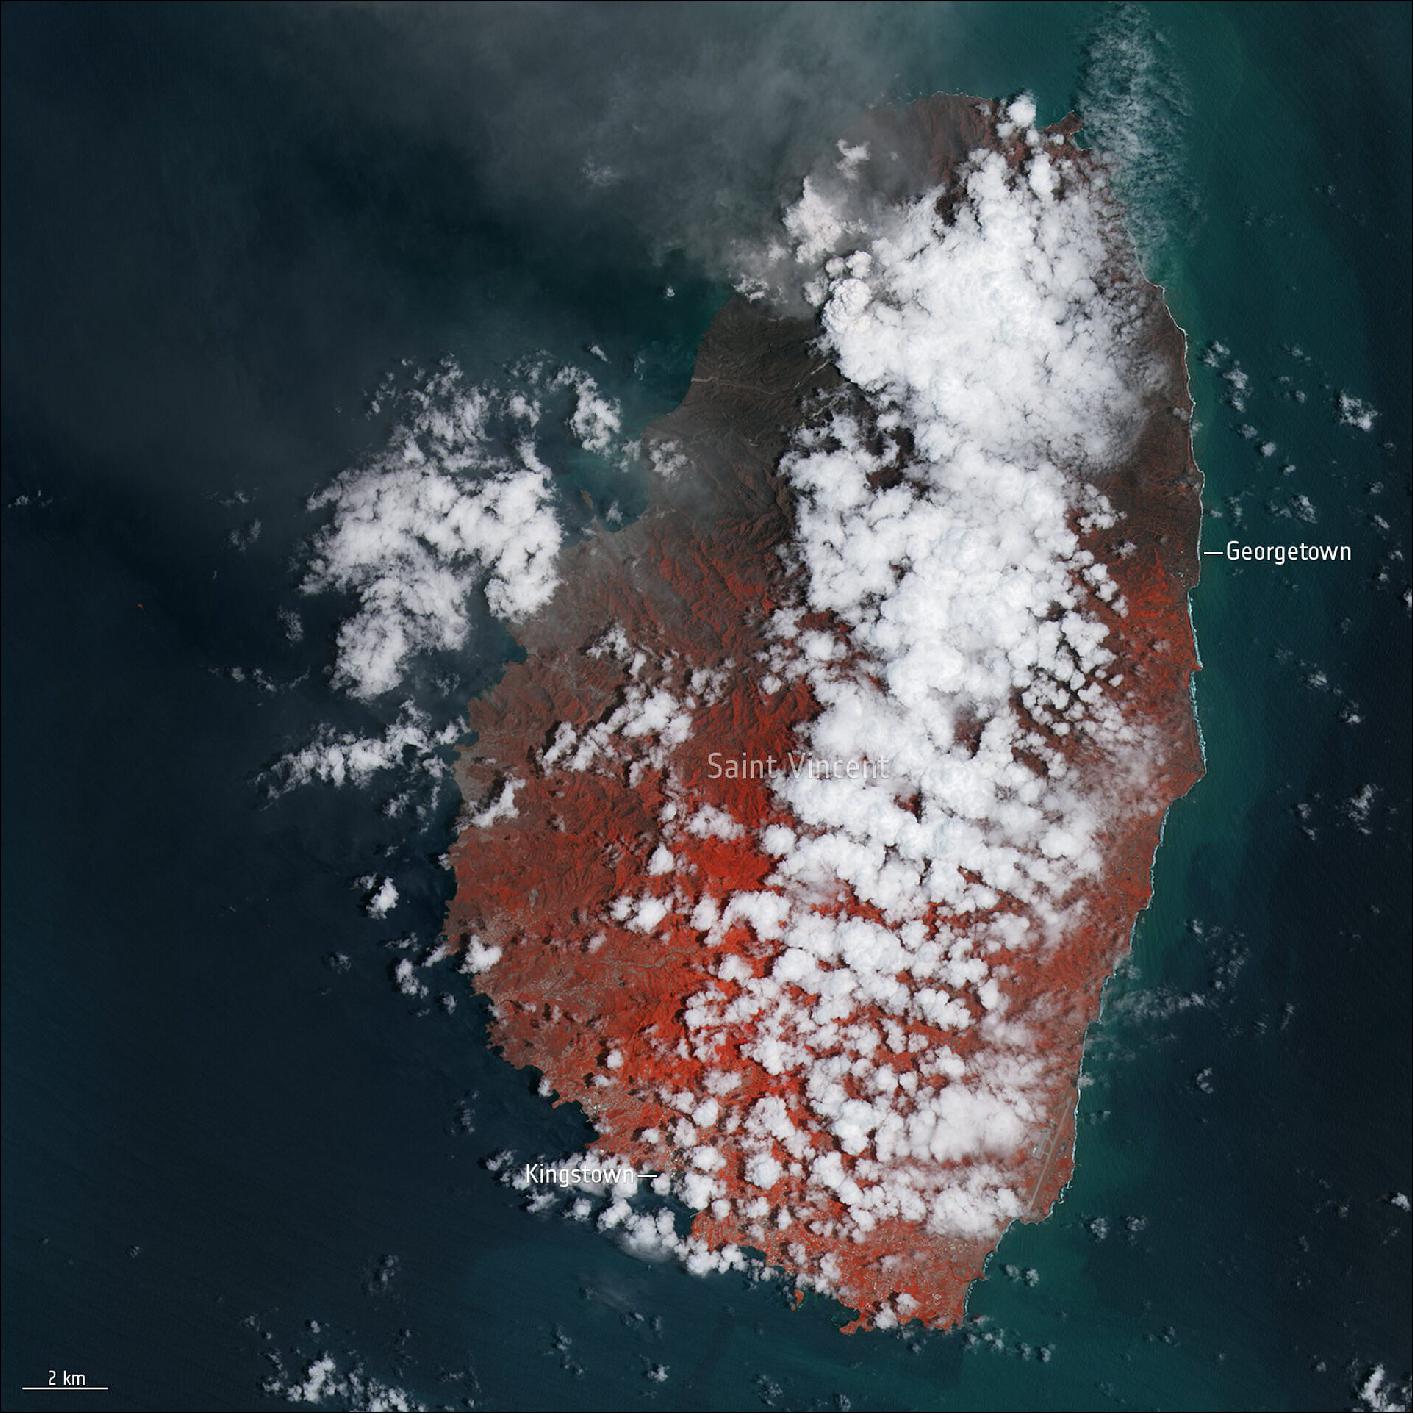
• April 16, 2020: Volcanic eruptions on Saint Vincent have blanketed the Caribbean island in ash leading to over 16 000 residents to be evacuated from their homes. False-color images captured by the Copernicus Sentinel-2 mission show the aftermath of the explosive eruption that took place on 9 April 2021. 42)
- La Soufrière is an active stratovolcano on the Caribbean island of Saint Vincent in Saint Vincent and the Grenadines. A series of explosive events began in April 2021, forming a plume of volcanic ash reaching 8 km in height, and generating pyroclastic flows down the volcano’s south and southwest flanks.
- The images have been processed in a way that included the satellite’s near-infrared channel. This type of band combination is most commonly used to assess plant density and health, as plants reflect near-infrared and green light, while absorbing red. Since they reflect more near-infrared than green, dense, plant-covered land appears in bright red.
- In response to the eruption, the Copernicus Emergency Mapping Service was activated. The service uses satellite observations to help civil protection authorities and, in cases of disaster, the international humanitarian community, respond to emergencies.
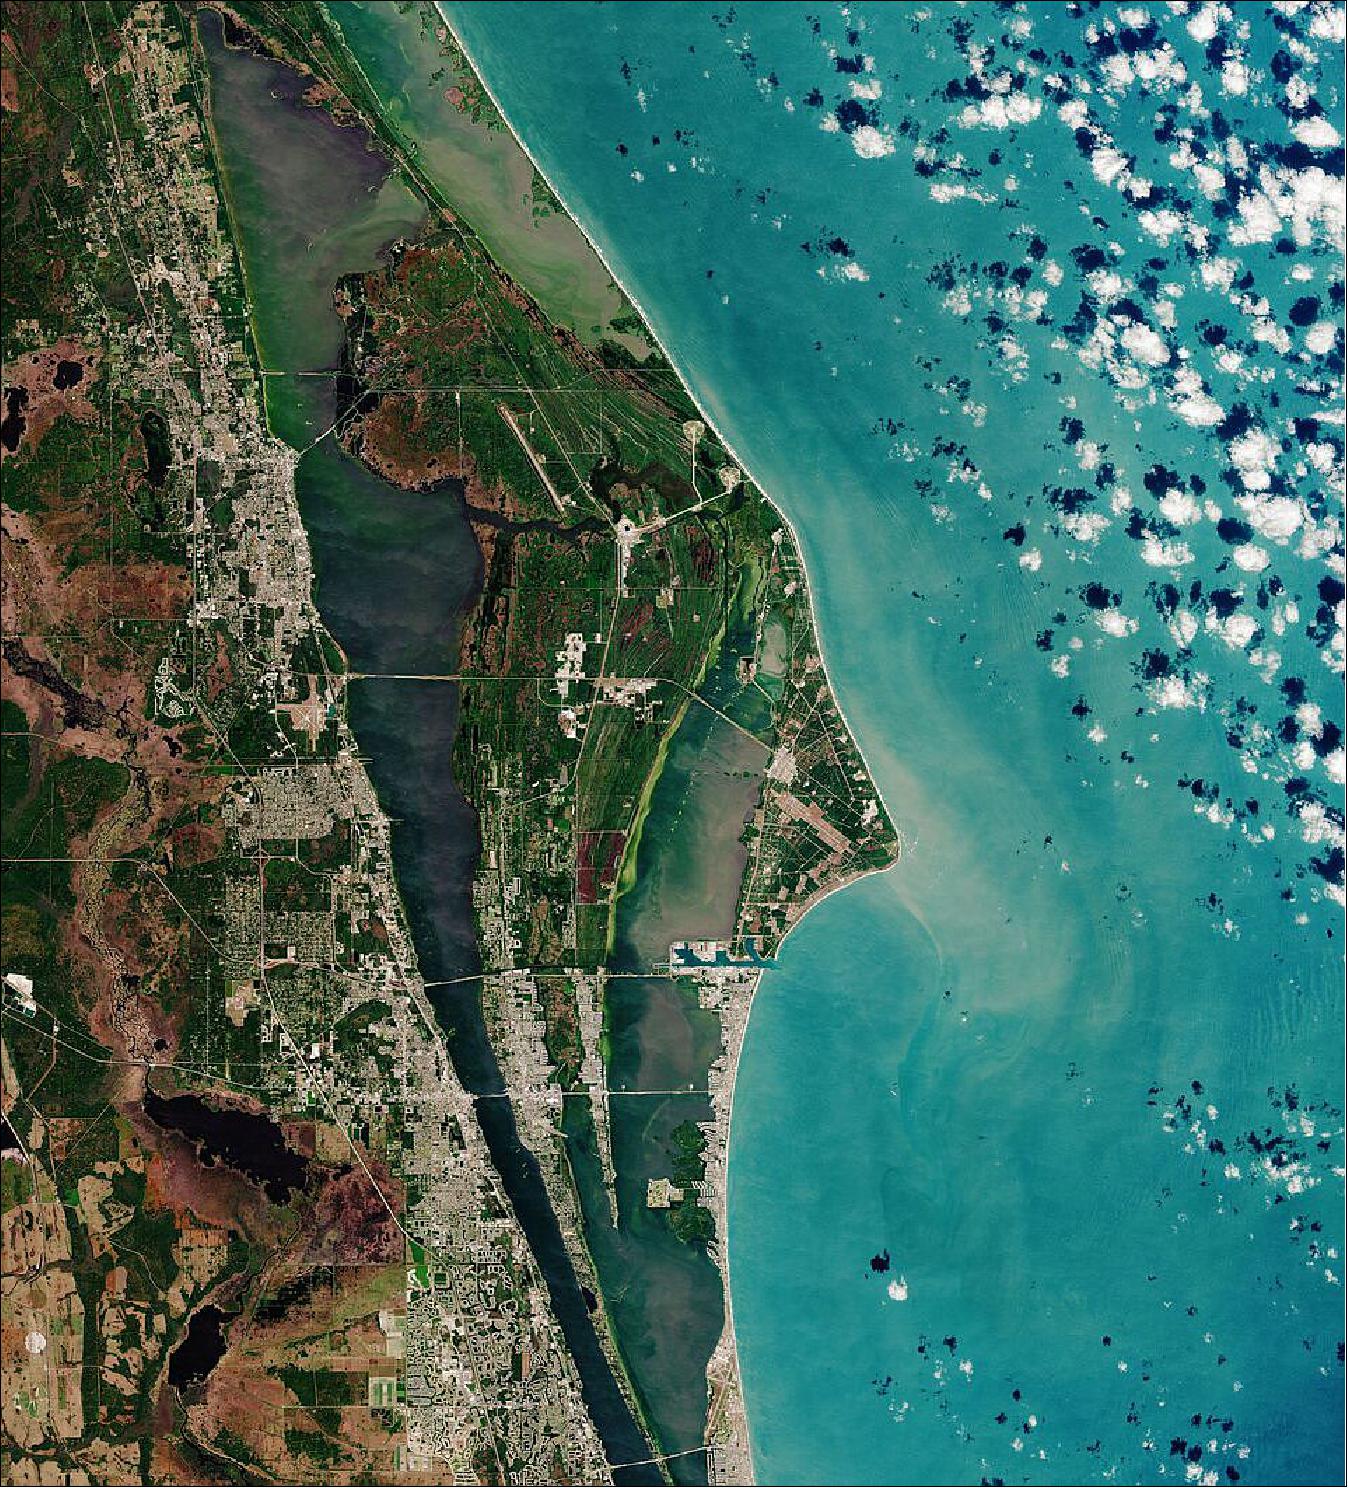
• April 16, 2021: On 22 April 2021, on Earth Day, Thomas Pesquet is planned to return to the International Space Station for his second mission, Alpha. Ahead of his launch, the Copernicus Sentinel-2 mission takes us over Cape Canaveral, USA, in a region known as the Space Coast. 43)
- The cape area is part of the region known as the Space Coast, and is home to the Kennedy Space Center – including the space shuttle landing facility, a visitor’s center, Cape Canaveral Air Force Station and a space vehicle assembly building. Launch Complex 39A, visible along the coast (Figure 57), is where the Saturn V rocket carrying Apollo 11 began its voyage to the moon in 1969, carrying Neil Armstrong, Michael Collins, and Edwin ‘Buzz’ Aldrin.
- Before the space program was launched, Cape Canaveral was a stretch of barren, sandy scrubland. The cape was chosen for rocket launches owing to its close proximity to the equator. As the linear velocity of Earth’s surface is greatest towards the equator, the southerly location of the cape allows for rockets to take advantage of this by launching eastward – in the same direction as Earth’s rotation.
- The space center is included in the Merritt Island National Wildlife Refuge, visible in the top of the image, which occupies more than 550 km2 of estuaries and marshes. It preserves the habitat of around 1000 plant and 500 wildlife species, included several endangered species. The city of Cape Canaveral lies just south of the space center and around 8 km north of Cocoa Beach (visible in the bottom of the image).
- It is from here where French ESA astronaut Thomas Pesquet will be launched on his second mission to the International Space Station. Thomas will be the first ESA astronaut to fly on a SpaceX Crew Dragon launching on a Falcon 9 rocket, together with NASA astronauts Shane Kimbrough and Megan McArthur and JAXA astronaut Akihiko Hoshide. He will be the first European to launch from the US since 2011, when Roberto Vittori, from Italy, flew onboard space shuttle Endeavour to deliver the Alpha Magnetic Spectrometer.
- During his six-month mission, called Alpha, Thomas will spend much of his time on scientific research and will also be carrying out maintenance tasks as part of the station’s crew. Towards the end of his mission, he will serve as commander of the Station. He will be the fourth European to hold the post of commander, after ESA astronauts Frank De Winne, Alexander Gerst and Luca Parmitano.
• April 9, 2021: The Copernicus Sentinel-2 mission takes us over Bucharest – the capital and largest city of Romania. 44)
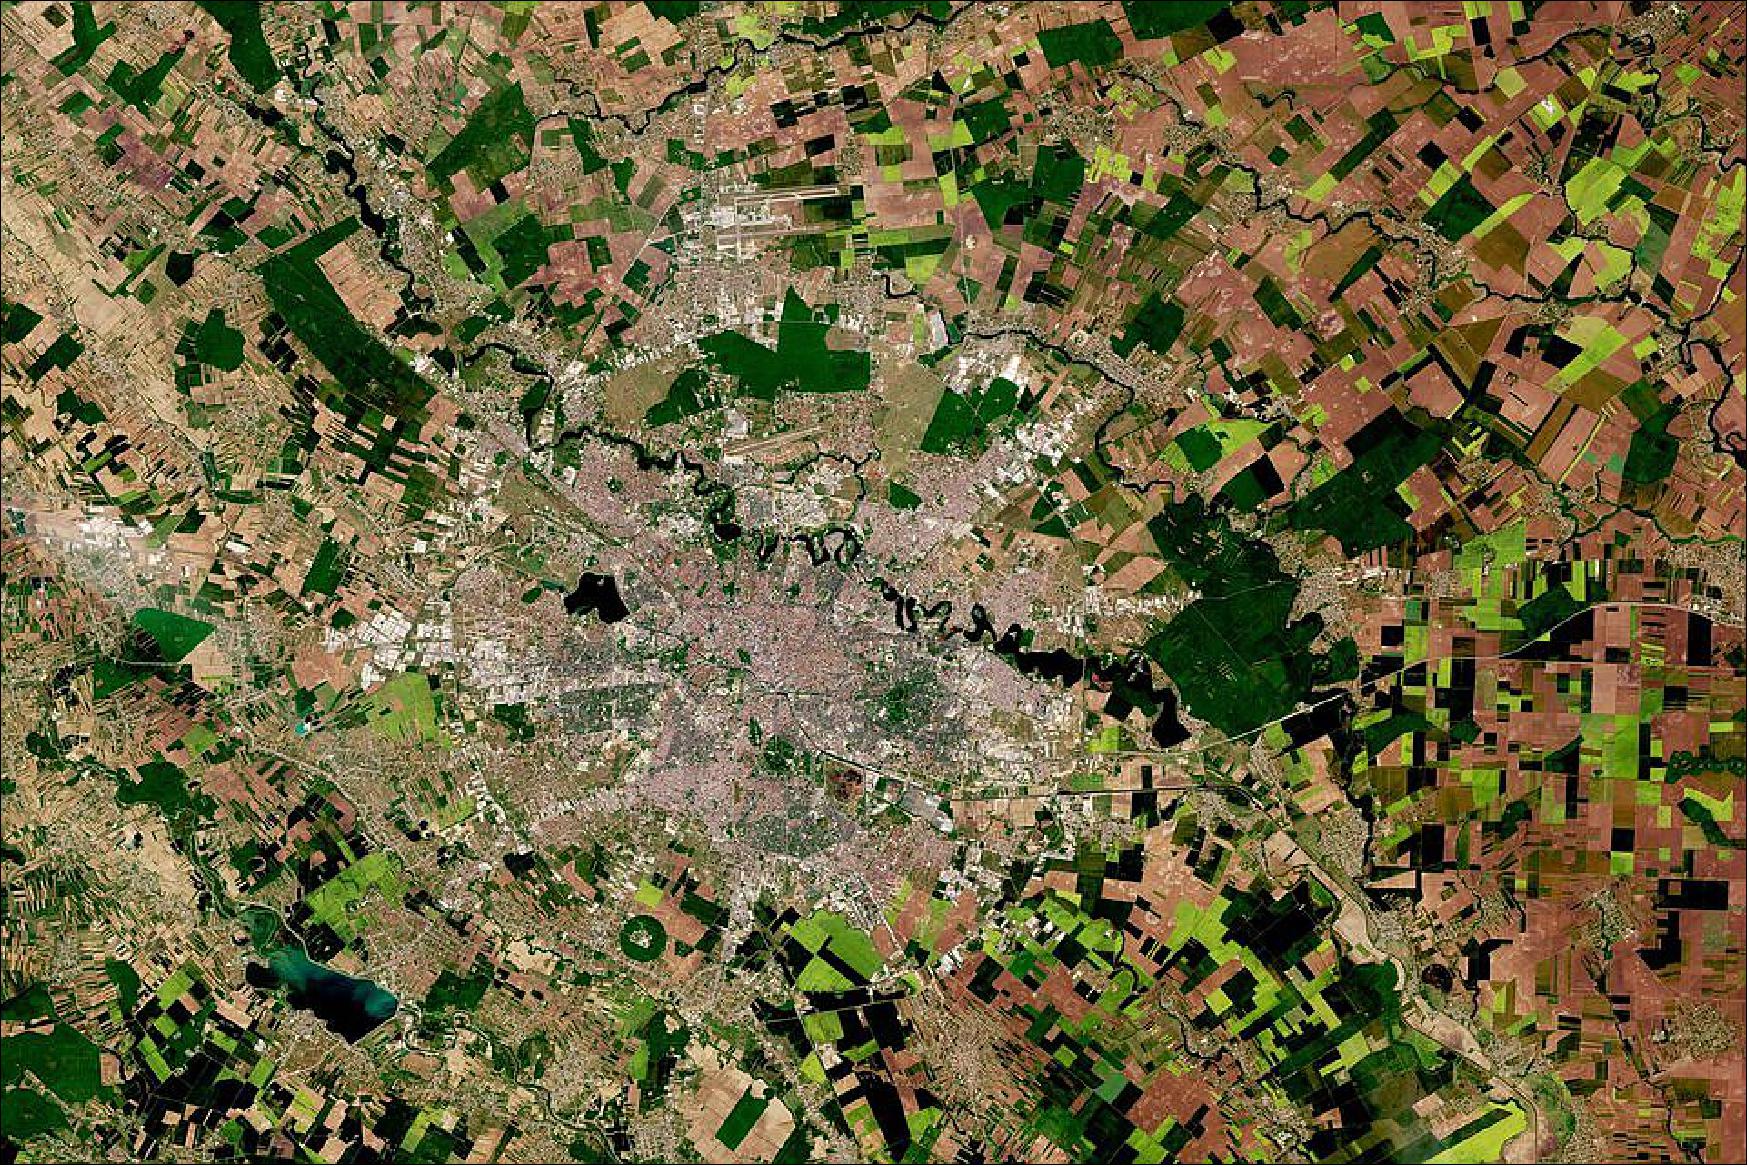
- The city is characterized by a number of main squares from which streets and boulevards radiate. One of the main boulevards, Bulevardul Unirii, can be spotted in the middle of the city and leads the way to the Palace of Parliament.
- An icon of the country’s capital, this monumental building is the largest in Europe and the world’s second-largest administrative building after the Pentagon in the United States. It is home to the Parliament of Romania as well as the National Museum of Contemporary Art.
- Several lakes stretch across the northern part of the city, the most important of which are Lake Herăstrău, Lake Floreasca, Lake Tei, and Lake Colentina. In the centre of the capital is a small artificial lake – Lake Cişmigiu – surrounded by the Cişmigiu Gardens.
- Văcăresti Nature Park can be seen in the southern part of the city. Covering an area of around 190 hectares, the park contains the wetlands surrounding Lake Văcăresti and hosts close to 100 species of birds, half of which are protected.
- Agricultural fields dominate the rest of this week’s image. Romania is one of the biggest agricultural producers in the European Union, exporting mainly maize, wheat and other grains.
• April 8, 2021: Italy’s Mount Etna, Europe’s most active volcano, has recently been on explosive form, with 17 eruptions in less than three months. Instruments onboard three different satellites orbiting Earth have acquired imagery of the eruptions – revealing the intensity of the lava-fountaining eruptive episodes, known as paroxysms. 45)
- Located on the east coast of Sicily, Mount Etna is one of the world’s most active volcanoes. Its eruptions occur at the summit, where there are four craters: the Voragine and the Bocca Nuova, formed in 1945 and 1928 respectively, the Northeast Crater, the highest point on Etna (3330 m) and the Southeast Crater, which has recently been the most active of the four.
- Starting in February 2021, the Southeast Crater produced a series of intense lava fountains coloring the night sky in hues of orange and red. Over the course of the following weeks, the volcano produced lava fountains reaching as high as 1.5 km.
- These spectacular explosions are amongst the highest observed at the Southeast Crater in recent decades. In the past, lava fountains reaching the same height were only observed at the Voragine crater in December 2015 – with lava fountains of over 2000 m.
- Different satellites carry different instruments that can provide a wealth of complementary information to understand volcanic eruptions. Once an eruption begins, optical instruments can capture the various phenomena associated with it, including lava flows, mudslides, ground fissures and earthquakes.
- Atmospheric sensors on satellites can also identify the gases and aerosols released by the eruption, as well as quantify their wider environmental impact. The image below, captured by the Copernicus Sentinel-5P satellite, shows the sulphur dioxide concentrations visible travelling southwards towards Libya. Sulphur dioxide is released from a volcano when magma is relatively close to the surface.
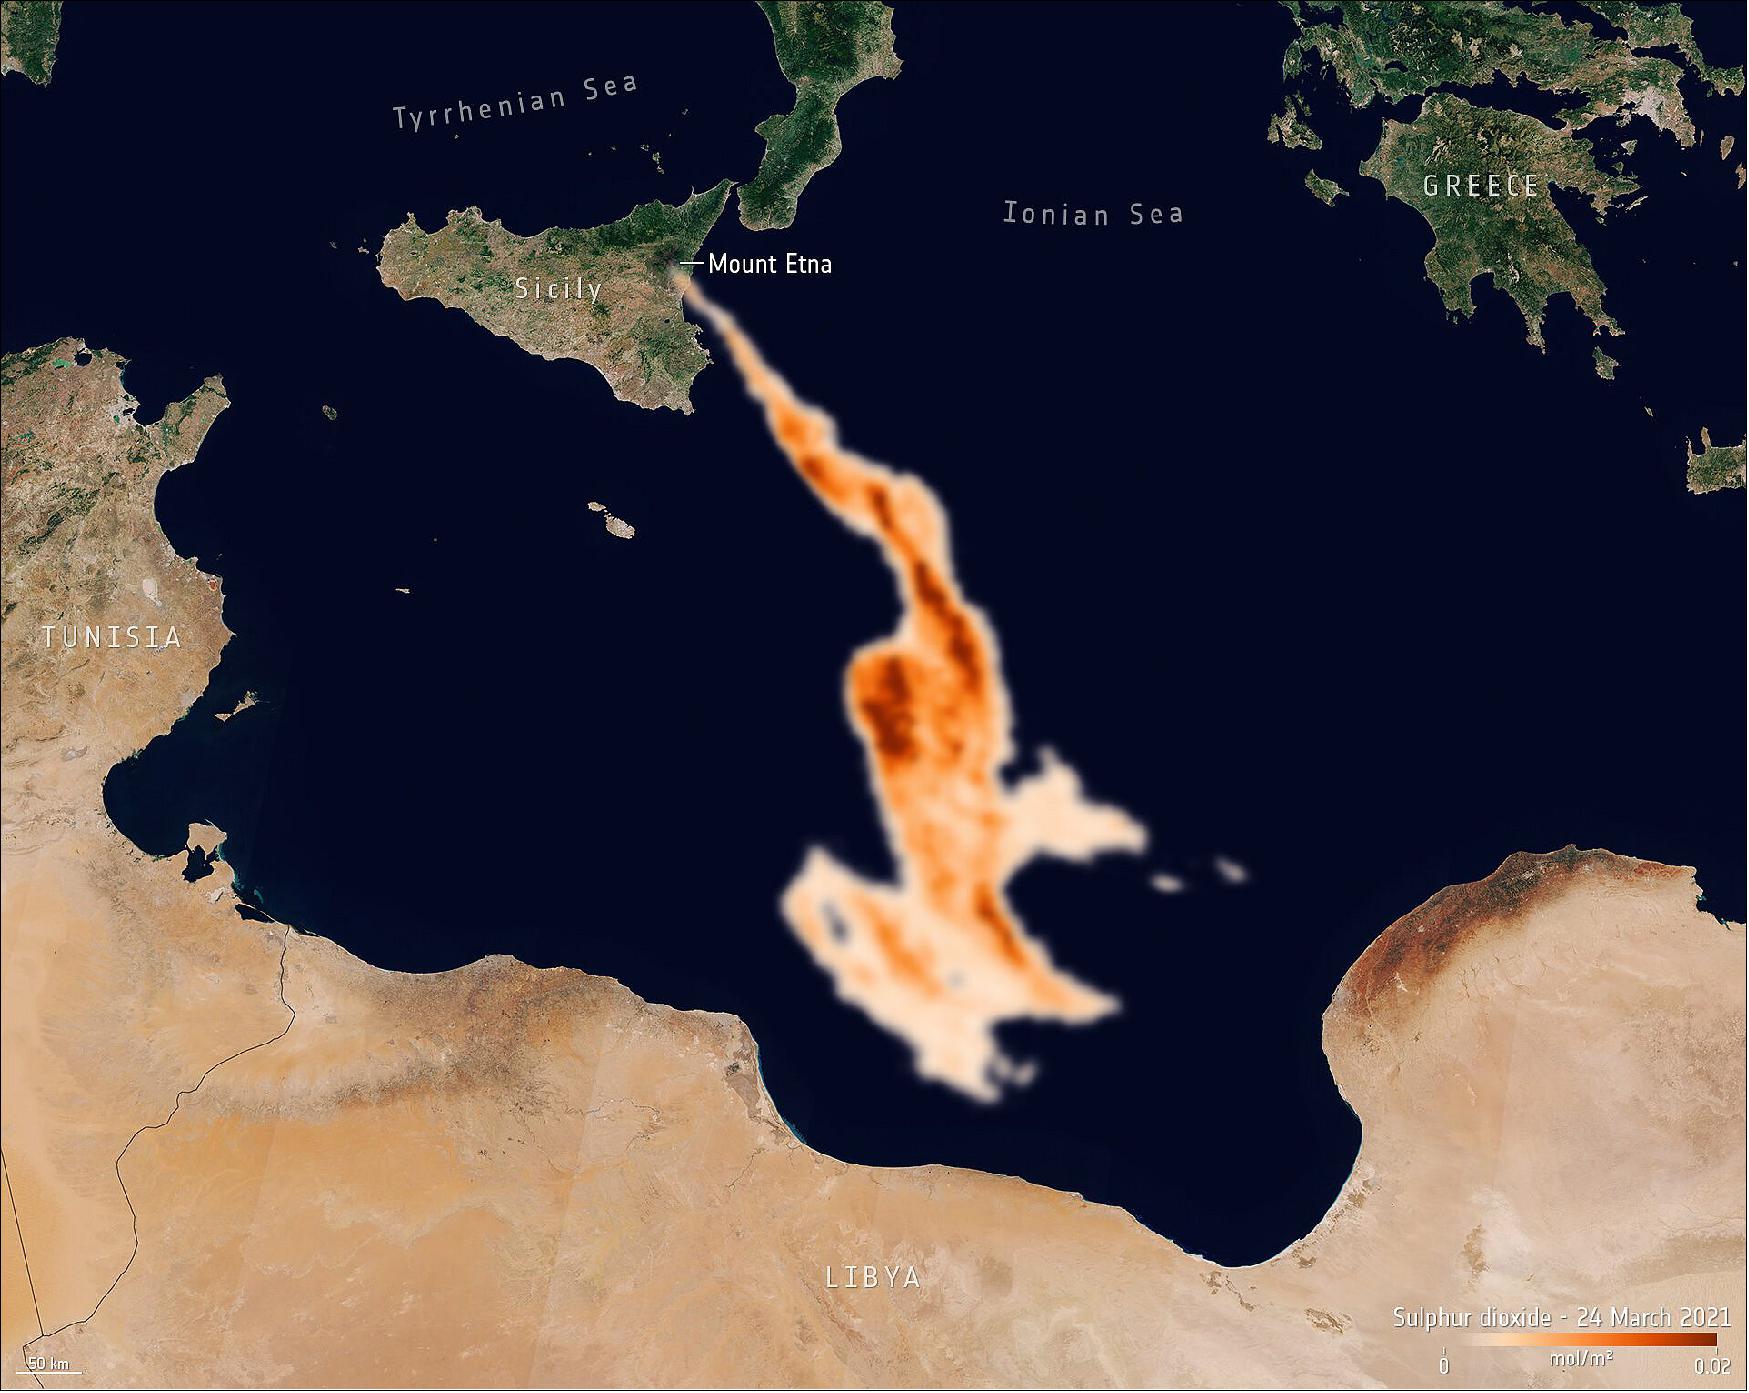
- After a week or so of remaining calm, Etna’s Southeast Crater re-awoke on the morning of 31 March with a loud explosion at around 07:00 CEST, followed by several puffs of ash and lava.
- According to the National Institute of Geophysics and Volcanology in Italy (INGV), the explosive activity increased in the late afternoon and during the night with lava flowing towards the Valle del Bove, with smaller flows advancing southwards. As of today, activity in the Southeast Crater remains calm.
• March 29, 2021: Climate change is having an undeniable influence on coastal areas. A substantial proportion of the world’s sandy coastlines are already eroding owing to increased storm surges, flooding and sea level rise. With our coastal environments in constant change, Earth observation satellites are being used to better strengthen our knowledge of changing coastlines. 46)
- For decades, coastal areas have been subject to intense urbanization and population growth. The European Union coastline is approximately 68,000 km long, more than three times longer than that of the United States. According to the European Environment Agency, almost half of the EU population lives less than 50 km from the sea, with the seaside being Europe’s most popular holiday destination.
- Coastal erosion is currently observed on many shorelines in Europe and will most likely worsen with rising sea levels. Monitoring coastal movement is key in understanding the evolution of coastal environments and these data can prove fundamental information to regional decision-makers.
- ESA has been developing an array of products to address these challenges. As part of ESA’s EO Science for Society program, the Coastal Change from Space project is providing important insights into global coastal changes. Using 25 years of satellite imagery, including data from the Copernicus Sentinel-1 and Sentinel-2 missions, the team has mapped 2800 km of coastline analyzed across four nations: The United Kingdom, Ireland, Spain and Canada.
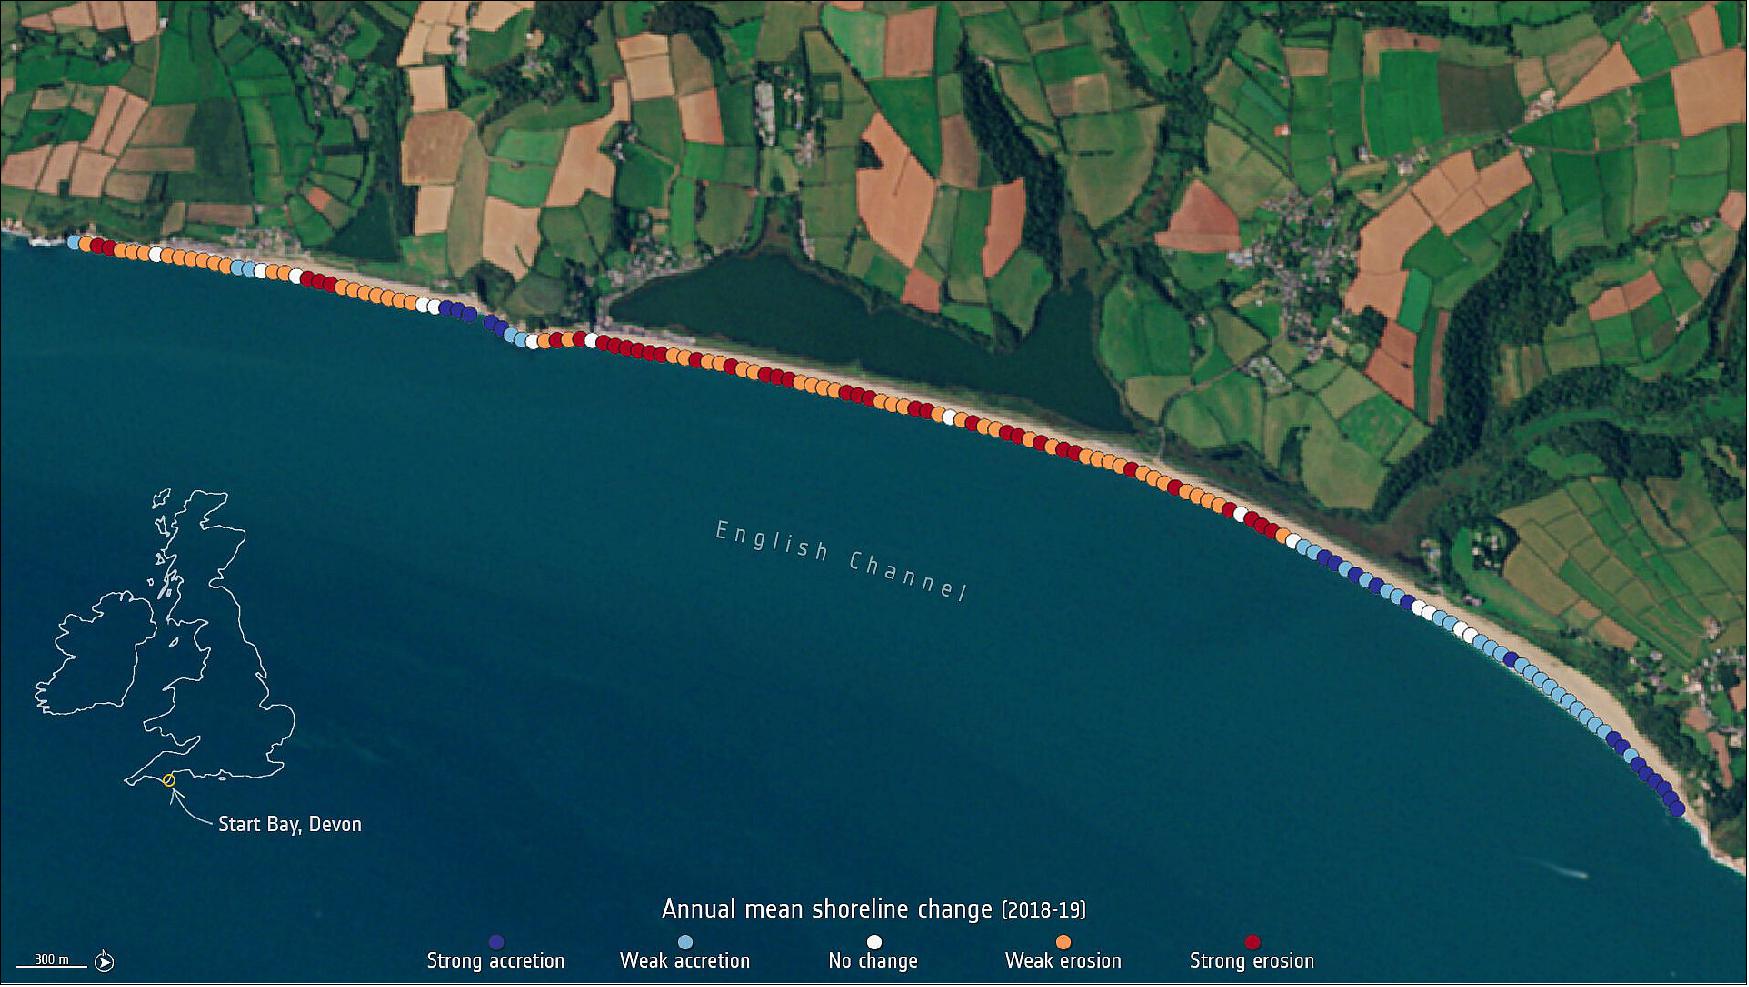
- As part of this project, a special process has been developed and applied to ensure each pixel from every image has a greatly improved accuracy on the ground, as well as identifying where the coastline is precisely located on a specific date.
- The frequent revisit rate of the Sentinel-1 and Sentinel-2 missions has enabled the changes to be observed as well as more permanent and extreme movements due to storm events. These results were then validated by a team of independent scientists from the four nations using results from field observations and local knowledge.
- Roberto Díaz Sánchez, from the Directorate General for the Coast and the Sea at the Ministry for the Ecological Transition and the Demographic Challenge, commented, “Taking part in this project has enlightened us in coastal surveillance from space. We are now firmly on the road to a new and promising coastal management paradigm, increasing our chances in successfully adapting our coasts to the effects of climate change.”
- The current dataset of over 30,000 individual images is now being used to help coastal scientists better understand their local processes.
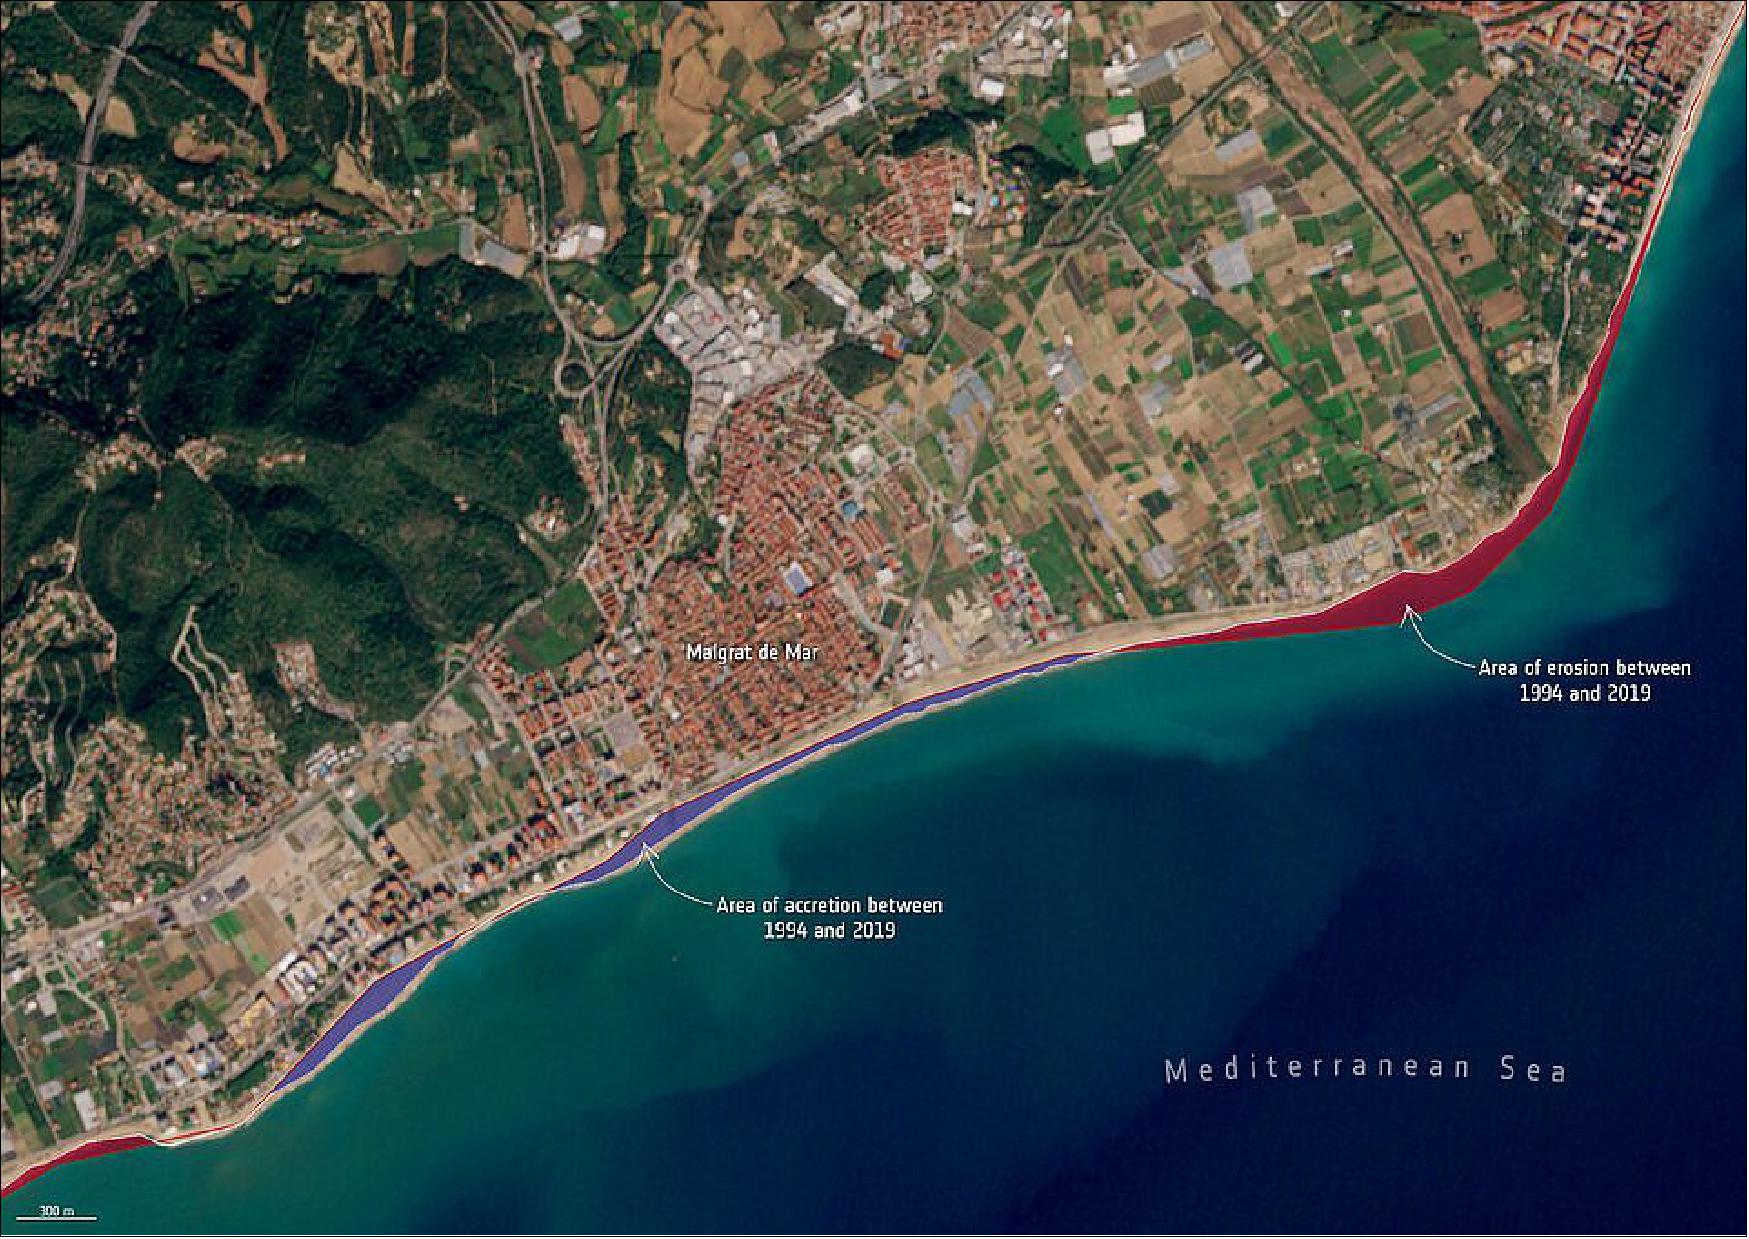
- Mónica López, Spanish Delegate at ESA and Centre for the Development of Industrial Technology, said, “I would like to congratulate all of the team for the successful project which is focused in a very important topic for some countries, including Spain. I would like to remark a very positive aspect of the project which has been the high involvement of final users in all the phases of the project, mainly during validation and testing.”
- Koen Verbruggen, Director Geological Survey Ireland at the Department of Environment, Climate & Communications, added, “The datasets being produced under the ESA-funded Coastal Change from Space project have great potential application in Ireland and come at a very opportune time as we are establishing a National Coastal Change Management Strategy. The coastal change data can help us recognize areas of greatest change, and thus prioritize the allocation of resources at national and local levels.”
- The next stage in the journey will be to use this insightful datasets to improve the performance of models and join with other infrastructure and coastal zone morphological knowledge to improve forecasts and enable sensible mitigation strategies to be employed.
- On 22 January, the results of the Coastal Change from Space project were presented in an online webinar.
• March 26, 2021: The Gariep Dam, the largest dam in South Africa, is featured in this false-color image captured by the Copernicus Sentinel-2 mission. 47)
- The image of Figure 63 has been processed in a way that highlights vegetation in shades of green and water bodies in black. The water on the east side of the Gariep Dam appears in royal blue owing to a large quantity of sediments coming from the Orange River, therefore appearing brighter than the water flowing out of the west side of the dam.
- The Orange River plays an important role in the South African economy by providing water for irrigation and hydroelectric power. It rises in the Drakensberg mountains in Lesotho, flowing westwards through South Africa to the Atlantic Ocean.
- The river is said to be one of the world’s most turbid, and is estimated to deliver around 60 million tons of sediment each year to the western margin of South Africa. A significant quantity of this sediment is believed to be from soil erosion, an increasing environmental threat to sustainability in southern Africa.
- The bright green circular shapes along the Orange River are an example of center-pivot irrigation systems, where equipment rotates around a centre pivot and crops are fed with water from the centre of the arc.
- The rest of the image is dominated by bare soil and rocky terrain which appear in different shades of pink and red. Straight lines in the image are roads which connect this area to other parts of South Africa.
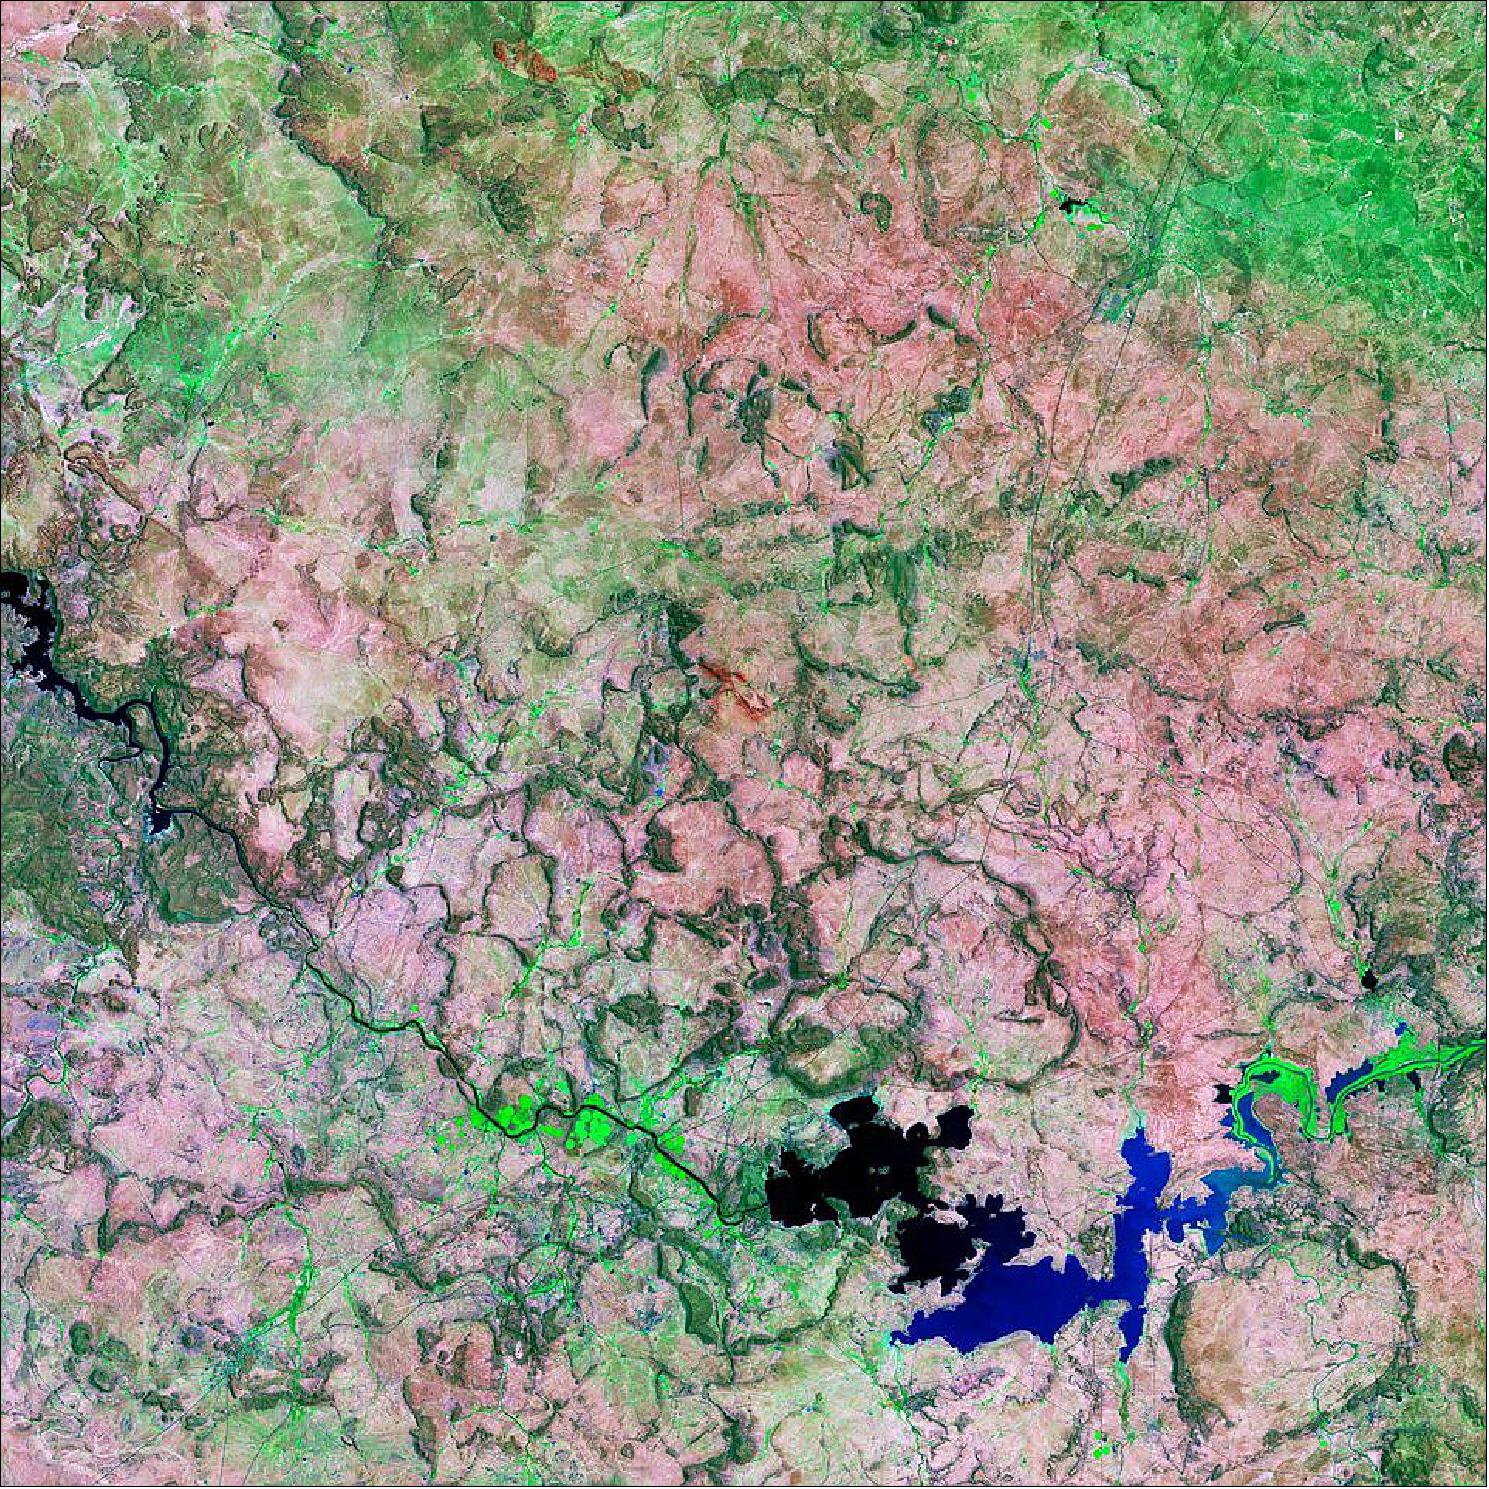
• March 22, 2021: Clustered at the edge of the Crocodile River in Mpumalanga Province, South Africa, stand thousands of farms and small holdings growing fresh fruit and sugar cane. Water to irrigate the crops is taken from the river, but this slows its flow rate and leaves less for those downstream. 48)
- On World Water Day, how can the government achieve the sustainable use of water for the benefit of all South Africans? ESA has been working in partnership with two Dutch companies and a South African catchment management authority to find a solution.
- Some 20 year ago, in response to severe water shortages, the South African government passed the National Water Act, which is intended to restrict the amount of water farmers use for irrigation.
- However ensuring that farmers only take the water to which they are entitled is tricky.
- Maurits Voogt, who works for HydroLogic, a relatively small company based in Amersfoort in the Netherlands, says: “It is a major task to monitor and enforce the legal use of water in places where there are limited qualified personnel available, and the areas that need to be monitored are huge.
- “We have developed a smart, satellite-based water auditing service as part of ESA’s program ARTES ( Advanced Research in Telecommunications Systems). It allows water management authorities to monitor irrigated water use in large areas without actually needing to visit every single farm.
- “By doing so, the water auditing application helps them implement regulatory measures effectively, and thereby supports the sustainable use of water resource.”
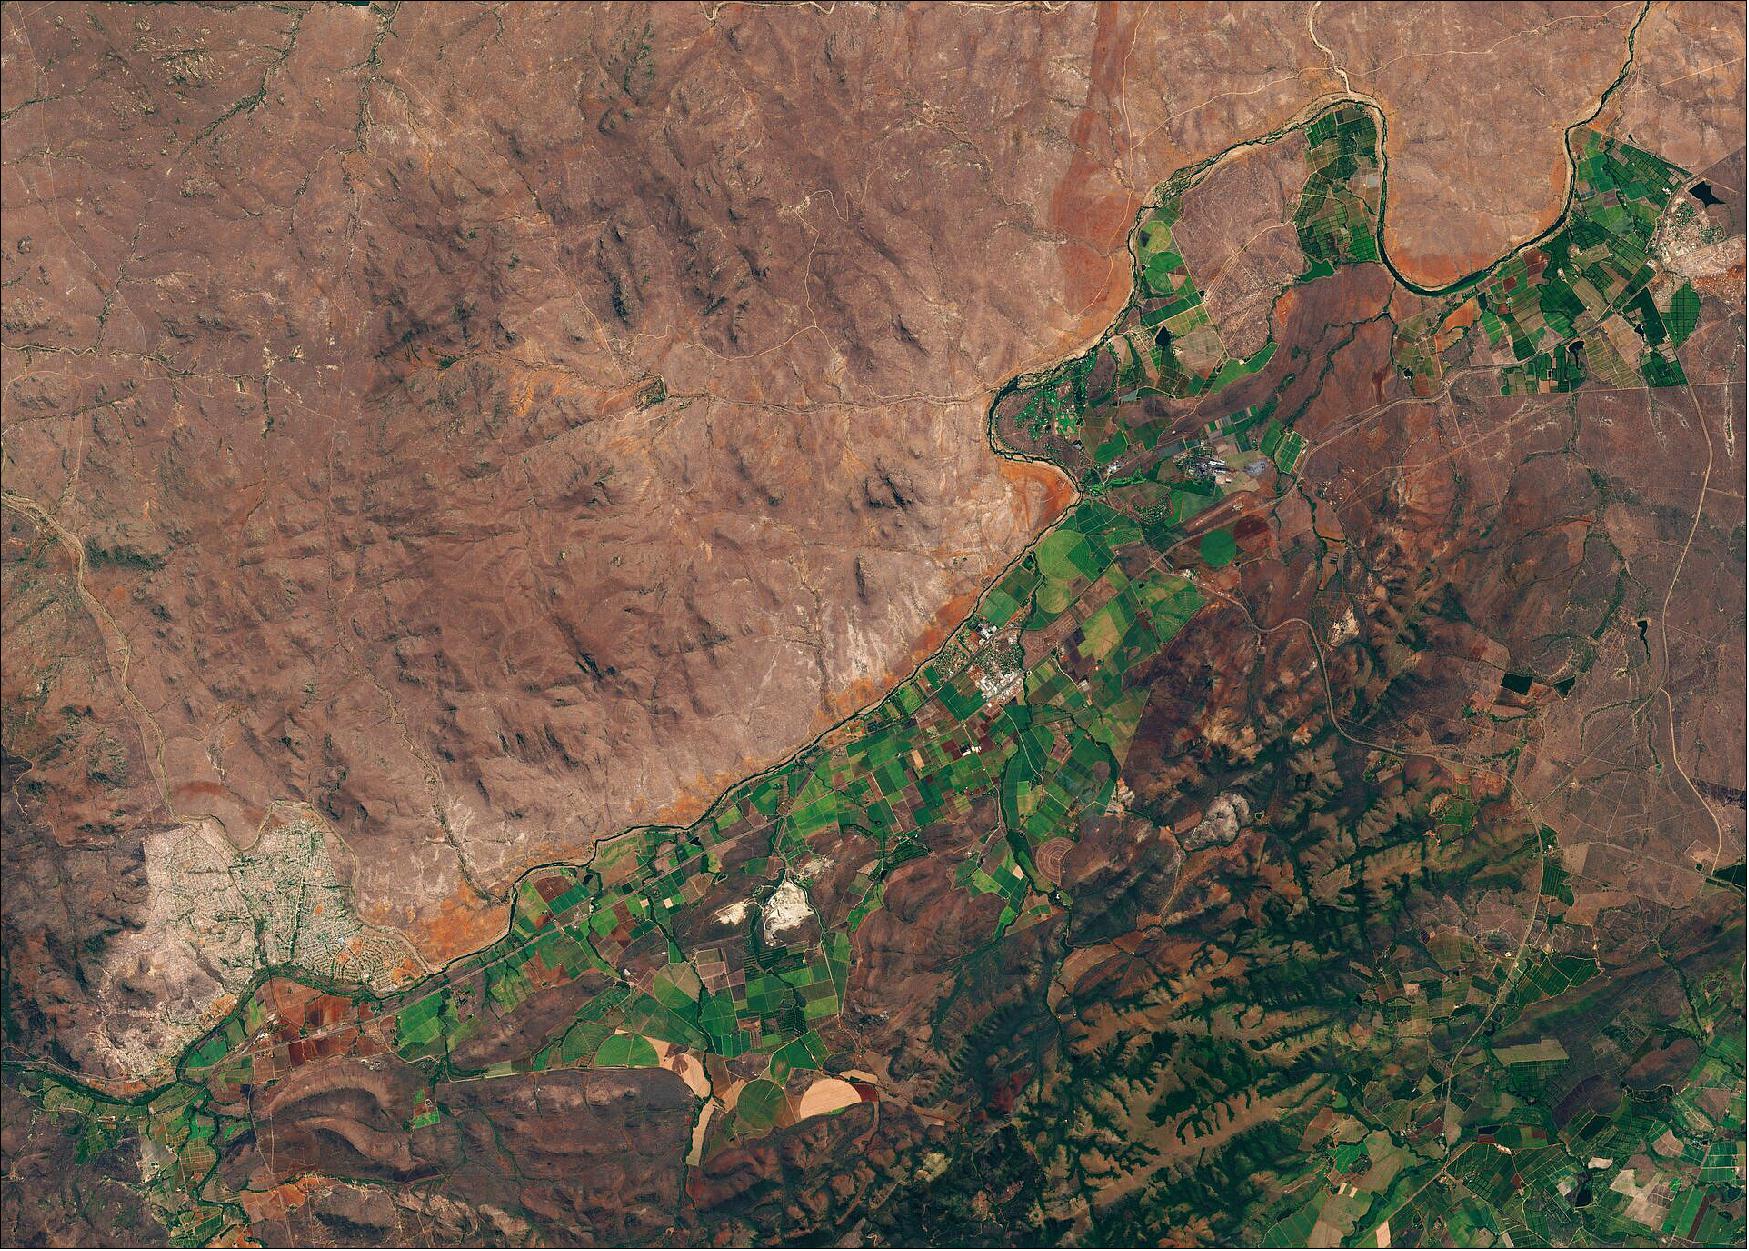
- The water auditing service uses evapotranspiration data calculated from satellite imagery by partner company eLEAF, based in Wageningen.
- Combined with rainfall data from rain gauges and satellites, this evapotranspiration data is used to calculate how much water is used for irrigation. The application automatically compares the water use with data taken from a national water use register that lists the amount of water allocated to each farm.
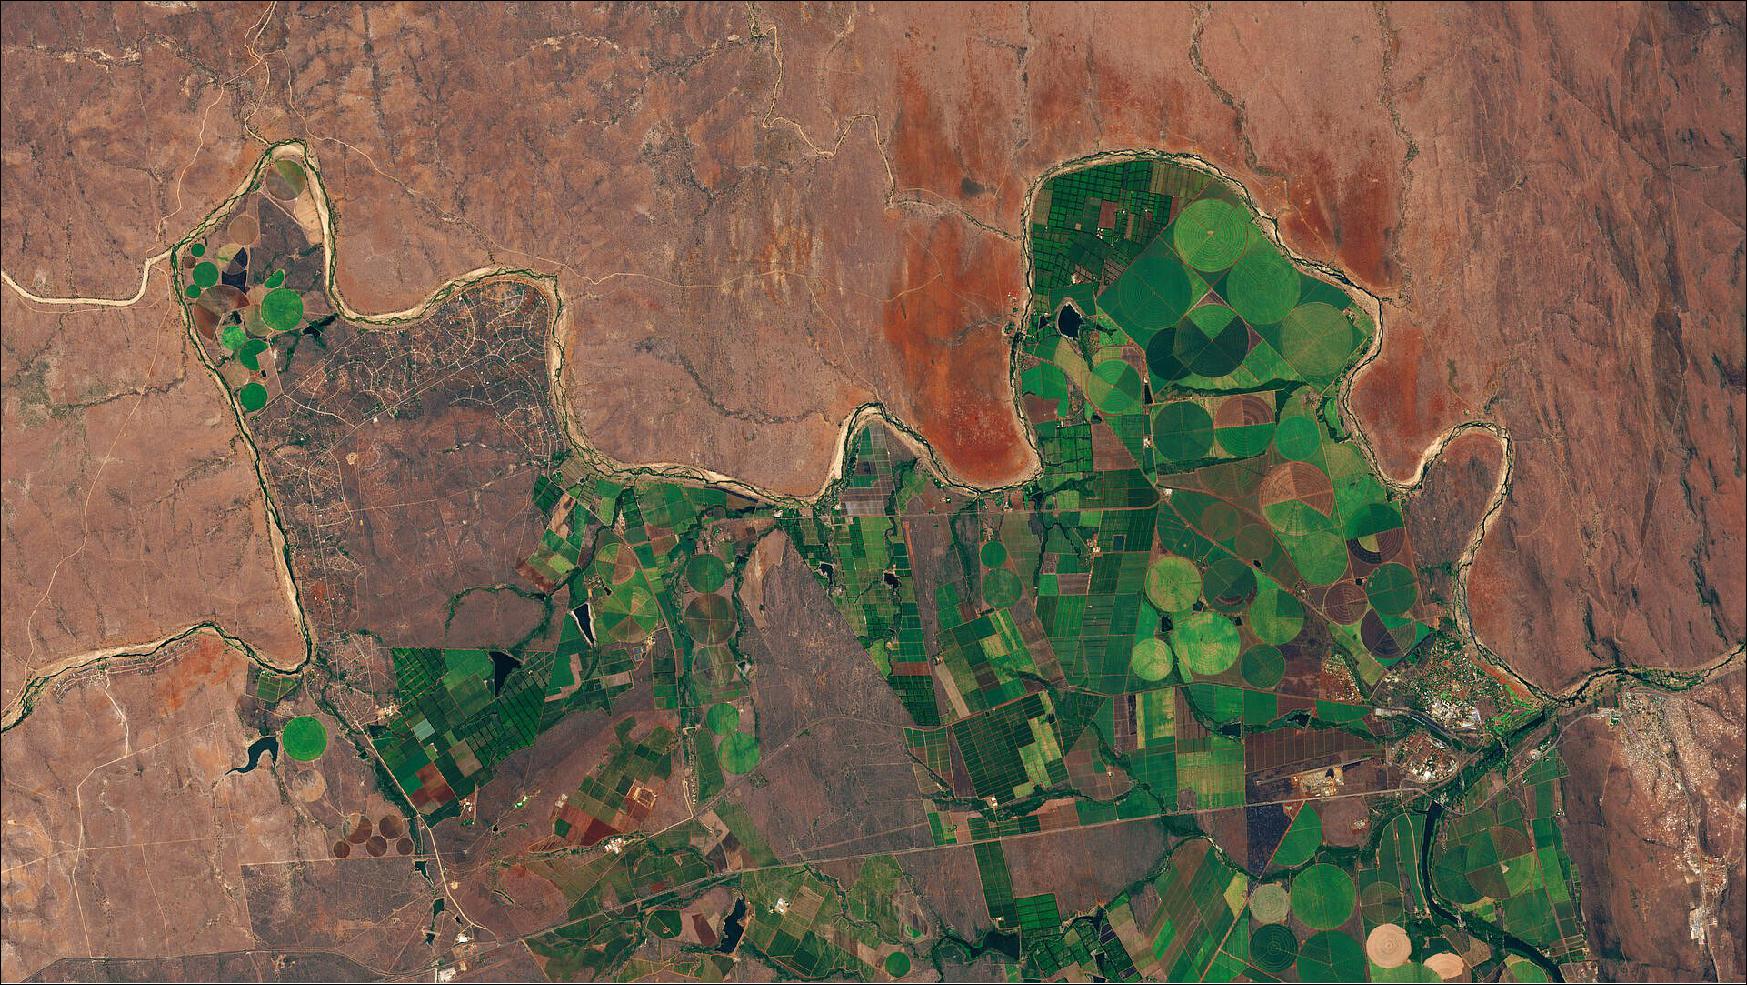
- In a pilot project, staff from HydroLogic and eLEAF used the technology to study irrigated water use for more than 50,000 fields covering some 40,000 km2 — about the area of the Netherlands.
- The team analyzed a handful of farms to confirm that the system could identify which farms had used large volumes of water compared to their neighbors.
- The costs of the pilot project were shared between ESA, eLEAF, Hydrologic and the Inkomati-Usuthu Catchment Management Authority, which is responsible for managing water resources in the region through which the Crocodile River flows.
- Following the demonstration project, the Inkomati-Usuthu Catchment Management Authority signed ongoing contracts for the water auditing service.
- Tendai Sawunyama, manager of resource planning and operations for the Inkomati-Usuthu Catchment Management Authority, says: “The application allows water managers to prioritize where to investigate for over-usage or illegal abstraction of water, and to make better decisions on where to place water meters. It can improve the understanding of water use and water allocation, and therefore help to create more sustainable water use in agriculture.”
- The water auditing application has been rolled out across South Africa to all catchment management authorities. It is now being modified to cater for the different user requirements needed by regional water authorities in Colombia and the Netherlands.
- It was developed with the support of ESA Space Solutions through the ESA Business Applications program.
• March 19, 2012: Ahead of the International Day of Forests, the Copernicus Sentinel-2 mission takes us over part of the Amazon rainforest in the Amazonas – the largest state in Brazil. 49)
- As its name implies, the Amazonas is almost entirely covered by the Amazon rainforest – the world’s largest tropical rainforest covering an area of around six million sq km. The Amazon is the world’s richest and most-varied biological reservoir, containing several million species of insects, birds, plants and other forms of life.
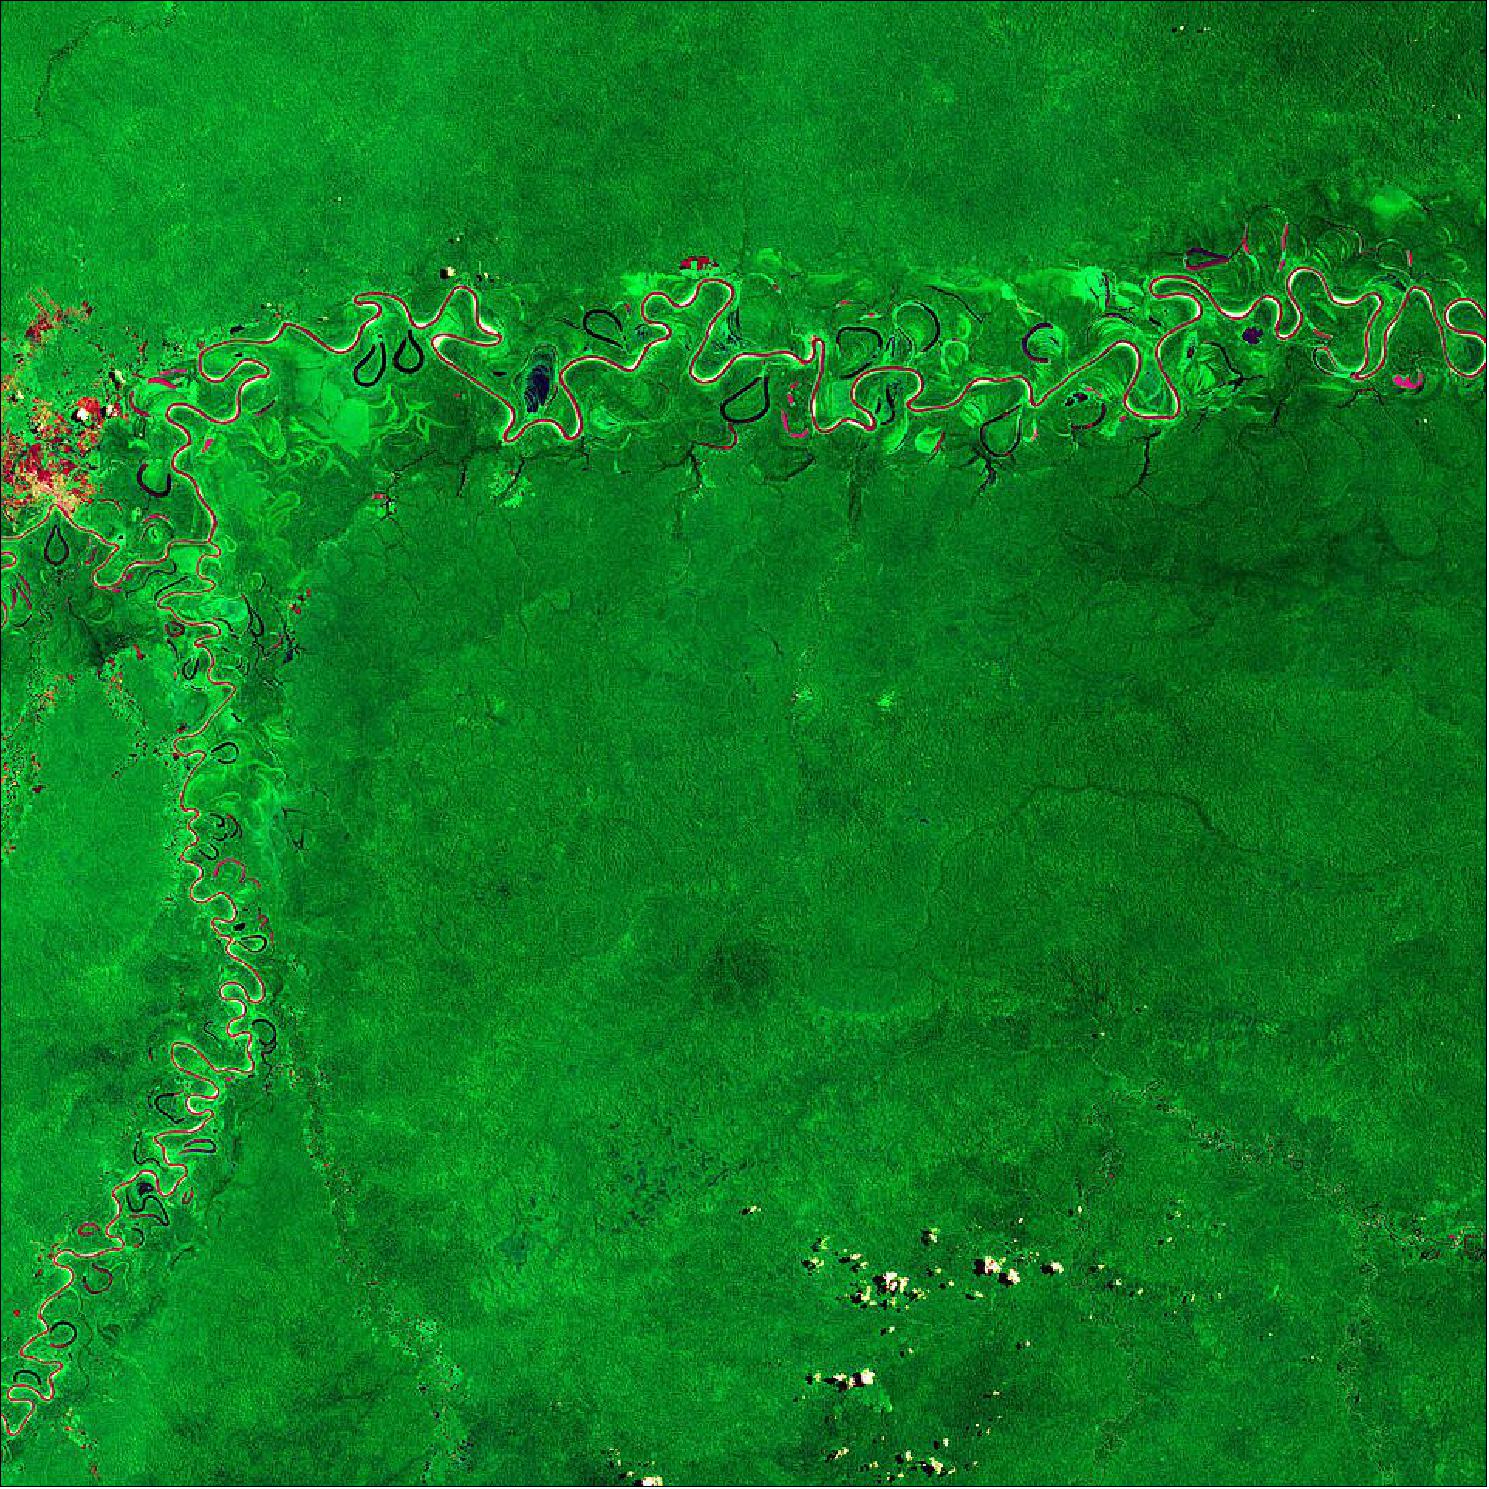
- The Juruá river, which flows more than 3000 km before emptying into the Amazon River, is turbid with relatively high nutrient levels. The river rises in the highlands in east-central Peru before winding its way through lowlands in Brazil.
- Several crescent-shaped oxbow lakes can be seen flanking the river. Oxbow lakes are generally formed when rivers cut through a meander ‘neck’ to shorten its course, causing the old channel to be blocked off – migrating away from the lake and creating a more direct route.
- The Tarauacá River, a tributary of Juruá, can be seen in the left of the image. Eirunepé, a settlement established in the 19th Century as a hub for rubber production, is visible in the top-left of the image.
- The 21 March marks the International Day of Forests – a day which seeks to raise awareness on a range of benefits that sustainably managed forests can contribute to our lives. According to the United Nations, the world is losing 10 million hectares of forest each year, which accounts for 12-20% of the global greenhouse gas emissions that contribute to climate change.
- The Amazon rainforest is crucial for helping to regulate global warming as the forests absorb millions of tons of carbon emissions every year. As plants grow, they remove carbon dioxide from the atmosphere and store it as biomass. This is then released back to the atmosphere through processes such as deforestation for agriculture and wildfires.
- Tracking biomass changes is key to understanding the global carbon cycle and also for informing global climate models that help predict future change. Earth observation satellites have been instrumental in helping our understanding of this important process. New maps produced by ESA’s Climate Change Initiative, provide a global view of above ground biomass are pertinent in helping to support forest management, emissions reduction and sustainable development policy goals.
- ESA’s upcoming Biomass mission will provide crucial information about the state of our forests and how they are changing. The satellite will pierce through woodland canopies to perform a global survey of Earth’s forests over the course of Biomass’s mission.
• March 12, 2021: The Strait of Gibraltar connects the Mediterranean Sea with the Atlantic Ocean and separates southernmost Spain from northernmost Africa. The channel is 58 km long and narrows to 13 km in width between Point Marroquí (Spain) and Point Cires (Morocco). Ferries and vessels can be seen travelling across the strait and crossing between the two continents. 50)
- Water bodies, such as the Mediterranean Sea and the Atlantic Ocean, appear in dark blue or black while turbid waters, such as those visible along the Spanish coast in the top-left of the image, appear in cyan or light blue. This is most likely due to sediment-laden waters flowing from rivers into the sea. Inland water bodies, such as the Barbate Reservoir visible at the top of the image, can be spotted in various shades of azure owing to their turbidity.
- Several prominent cities can be seen in the image in grey. These include Tangier, the port and principal city of northern Morocco which lies just 27 km from the southern tip of Spain. Tétouan lies along the Martil Valley and can be seen in the bottom-right of the image. Its medina is a designated UNESCO World Heritage site since 1997.
- At the southern end of the Iberian Peninsula, the Bay of Gibraltar can be seen. The shoreline is densely populated and the shore is divided, from west to east, between the Spanish municipalities of Algeciras, Los Barrios, San Roque, La Línea de la Concepción and the British Overseas Territory of Gibraltar.
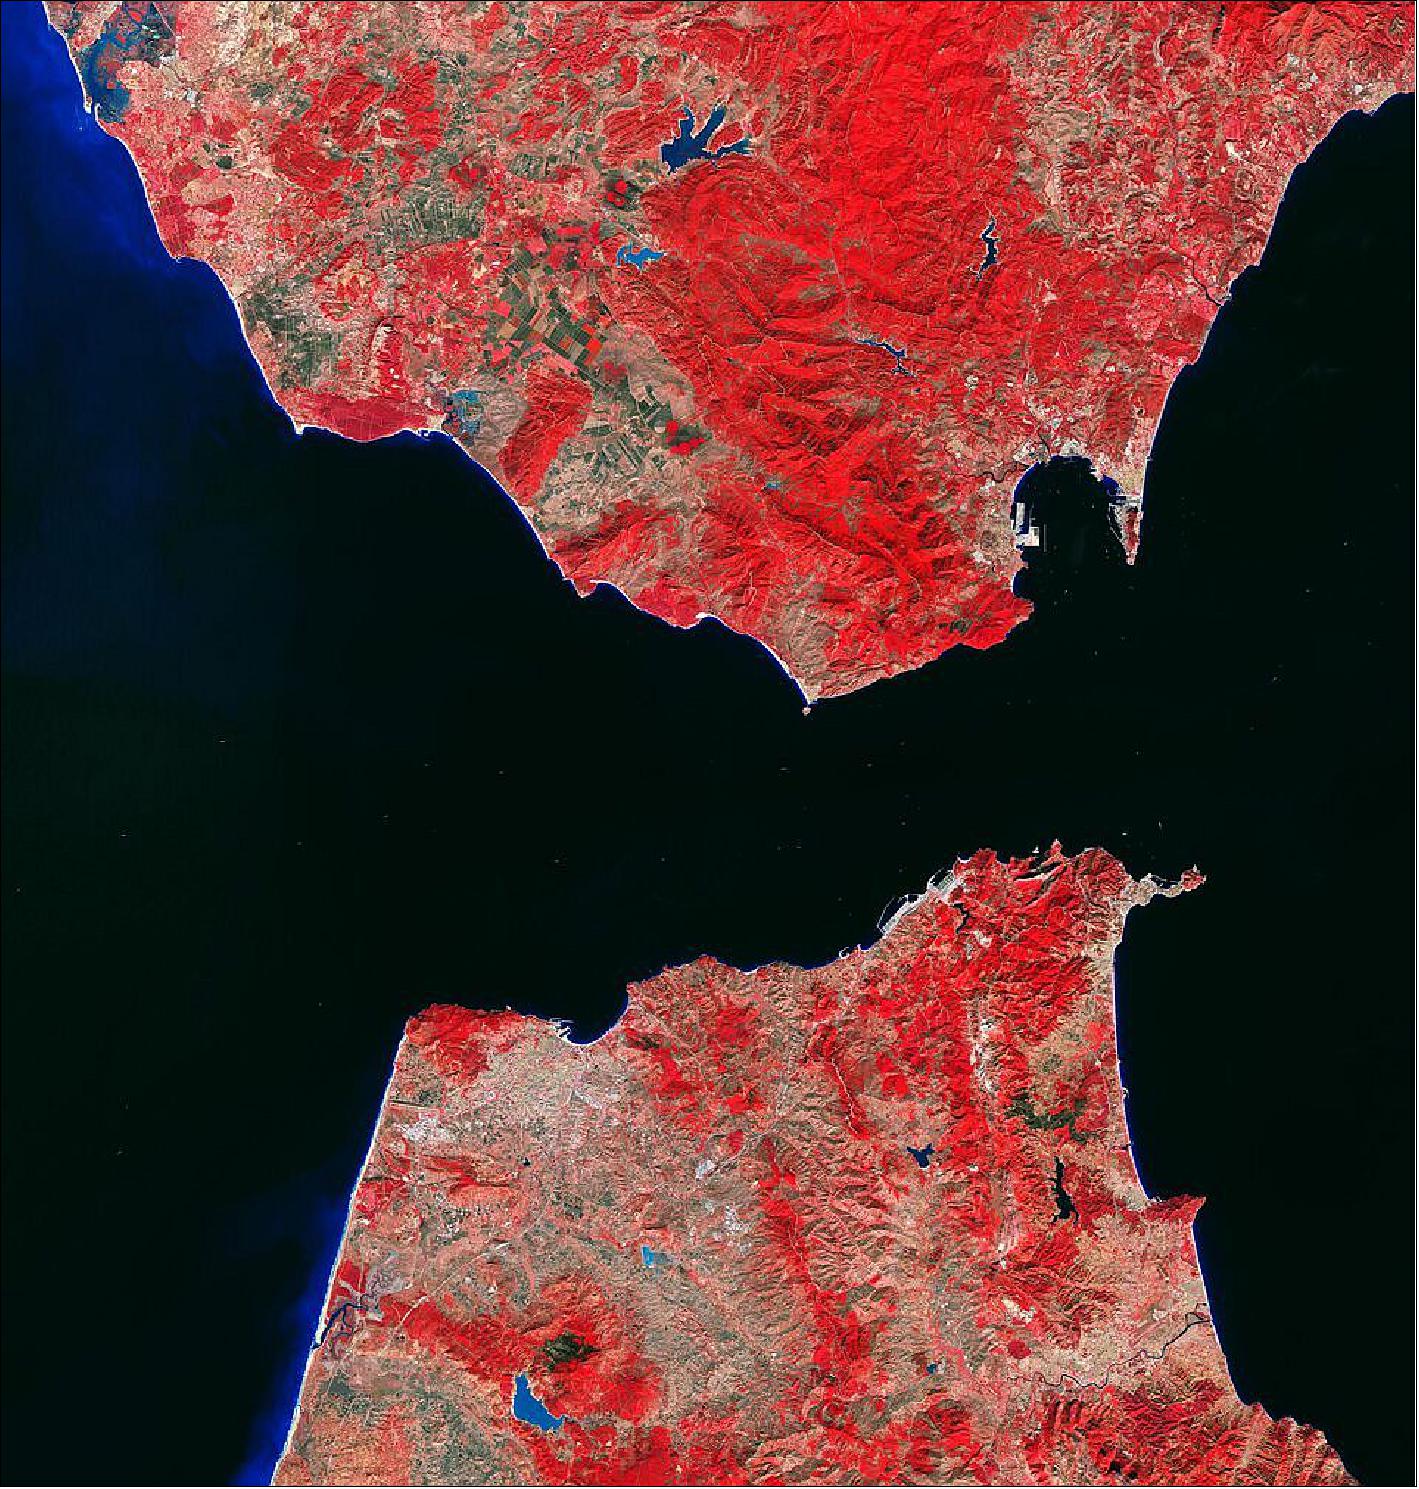
• March 5, 2021: The Copernicus Sentinel-2 mission takes us over the Galápagos Islands – a volcanic archipelago situated some 1000 km west of Ecuador in the Pacific Ocean. 51)
- The archipelago consists of 13 major islands and a handful of smaller islands and islets scattered across approximately 60,000 km2 of ocean. Repeated volcanic eruptions and ongoing seismic activity have helped form the rugged mountain landscape of the islands. In this image, captured on 23 September 2020, several circular volcanic cones can be seen atop the islands.
- The largest island of the archipelago, Isabela (Albemarle), is visible in the center. Around 132 km in length, the island’s seahorse shape is the result of the merging of multiple large volcanoes into a single land mass. The five volcanoes seen on the island are (from north to south): Wolf Volcano, Darwin Volcano, Alcedo Volcano, Sierra Negra Volcano and Cerro Azul Volcano. Two of the island’s volcanoes, Ecuador and Wolf, lie directly on the Equator.
- At the southern end of the island, hills covered with forests can be seen in bright green, separating the Sierra Negra, the most active of the Galapagos volcanoes, from the sandy coastline (partially visible here owing to cloud cover). Tortuga Island, named for its distinct shape, can be seen southeast from Isabela. The tiny island is actually a collapsed volcano that is a nesting location for a variety of seabirds.
- The second largest island of the archipelago, Santa Cruz, can be seen to the right of Isabela. Its capital, Puerto Ayora (not visible), is the most populated urban center in the islands.
- The Galápagos Islands are best known for their diverse array of plant and animal species, many of which are endemic meaning they are not found anywhere else in the world. These include the giant Galapagos tortoise, the marine iguana, the flightless cormorant and the Galapagos penguin – the only species of penguin that lives north of the equator.
- These species were observed by Charles Darwin during the voyage of the HMS Beagle in 1835 and inspired his theory of evolution by natural selection. To preserve the unique wildlife on the islands, the Ecuadorian government made the entire archipelago a national park in 1959.
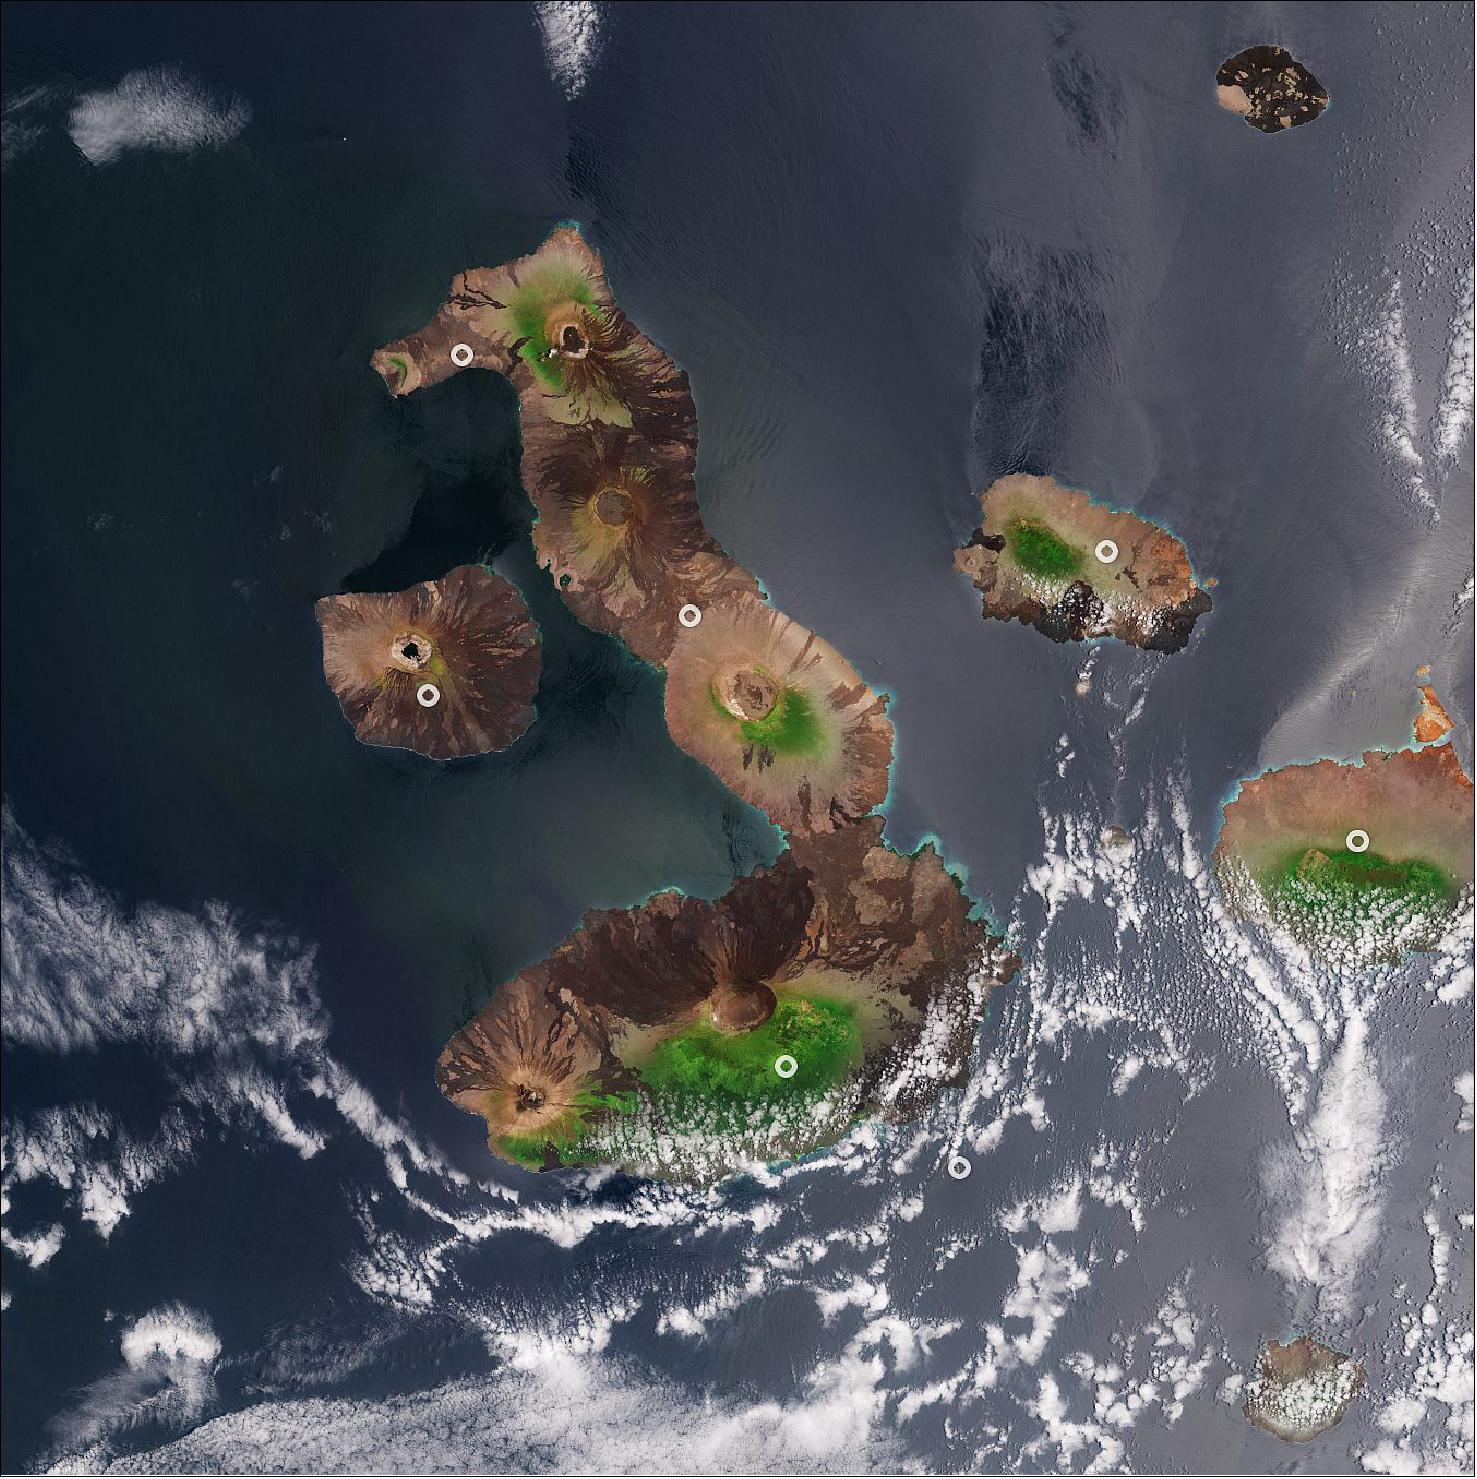
• February 26, 2021: The Copernicus Sentinel-2 mission takes us over Vancouver – the third largest city in Canada. 52)
- In this image, captured on 29 July 2019, an unusually large quantity of sediment can be seen gushing from the Fraser River into the Strait of Georgia. The Fraser River is the longest river within British Columbia rising at Fraser Pass in the Rocky Mountains and flows for over 1300 km before emptying into the strait. The river's annual discharge at its mouth is estimated to be around 3550 m3/s, and is said to discharge around 20 million tons of sediment into the ocean.
- Several ships and vessels can be easily spotted at the top of the image, in the Burrard Inlet, which separates the city of Vancouver from the slopes of the North Shore Mountains (not visible).
- Vancouver Island dominates the left-side of the image. Covering an area of over 31 000 km2, it is the largest island on the Pacific coast of North America. The island is heavily wooded and mountainous with several peaks of more than 2100 m.
- At the bottom of the image, marine stratocumulus clouds can be seen over the Strait of Juan de Fuca, which also marks the international boundary between Canada and the Unites States. These types of cloud formations could be related to the Puget Sound Convergence Zone – a frequent weather phenomena where northwest winds are split by the Olympic Mountains and then re-converge over Puget Sound, visible in the bottom-right of the image.
- Copernicus Sentinel-2 is a two-satellite mission. Each satellite carries a high-resolution camera that images Earth’s surface in 13 spectral bands. The mission is mostly used to track changes in the way land is being used and to monitor the health of our vegetation.
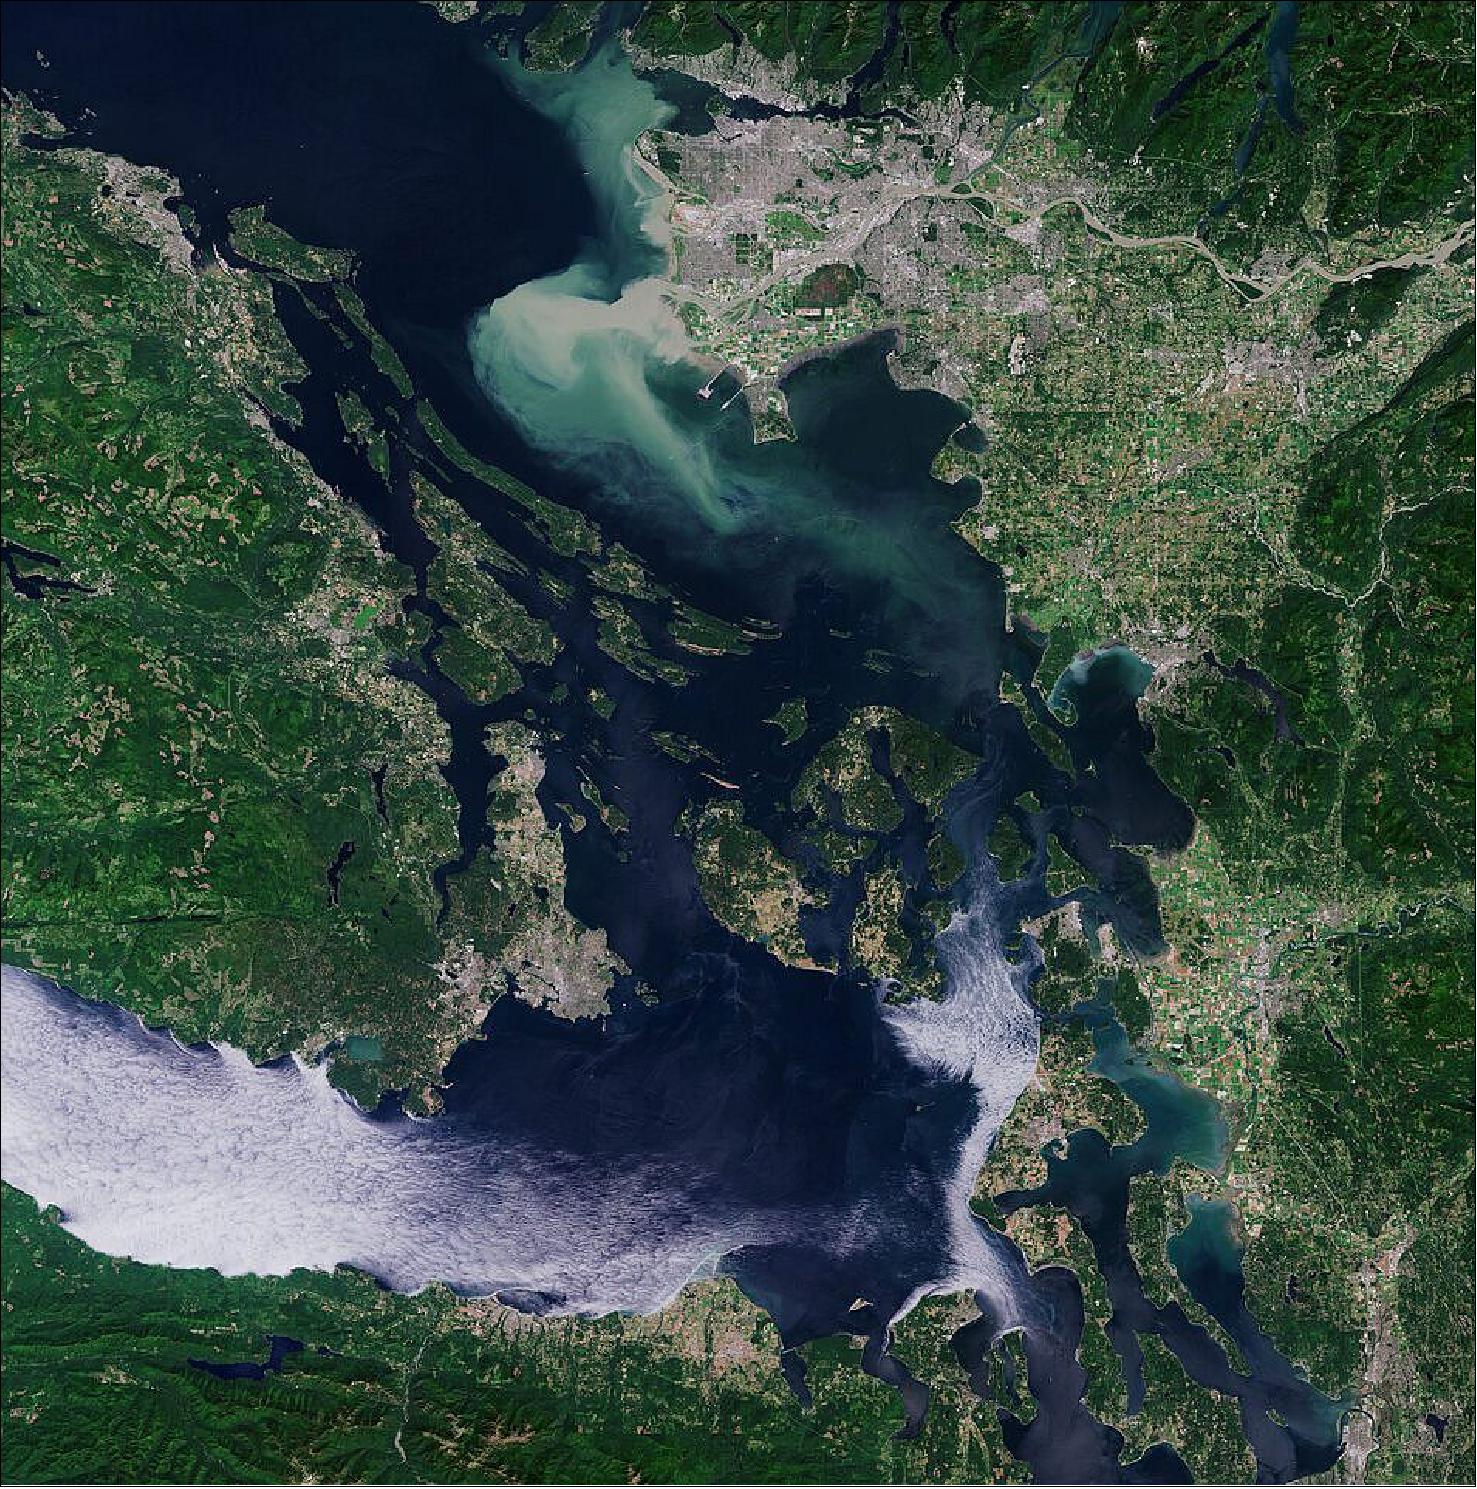
• February 19, 2021: After Etna’s powerful eruption on Tuesday 16 February, the volcano produced another spectacular display of fire – with tall lava fountains shooting into the night sky, reaching heights of around 700 m. The first eruption caused large lava flows to descend eastwards into the Valle del Bove, travelling for approximately 4 km, but the second major explosion on Thursday (Feb. 18) caused the lava also to run for about 1.3 km down the volcano’s southern flanks. 53)
- Ash from the eruptions covered the city of Catania and authorities have been monitoring developments in the nearby towns at the base of the volcano, including Linguaglossa, Fornazzo and Milo. The eruption also forced the temporary closure of Sicily’s Catania Airport, which often happens when the volcano is active.
- According to Volcano Discovery, which publishes frequent alerts about seismic activity, the volcano also saw activity earlier today, 19 February, with lava flows continuing to descend to the south and east. Mount Etna is the tallest active volcano in Europe and frequently erupts.
- Satellite data can be used to detect the slight signs of change that may foretell an eruption. Once an eruption begins, optical and radar instruments can capture the various phenomena associated with it, including lava flows, mudslides, ground fissures and earthquakes. Atmospheric sensors on satellites can also identify the gases and aerosols released by the eruption, as well as quantify their wider environmental impact.
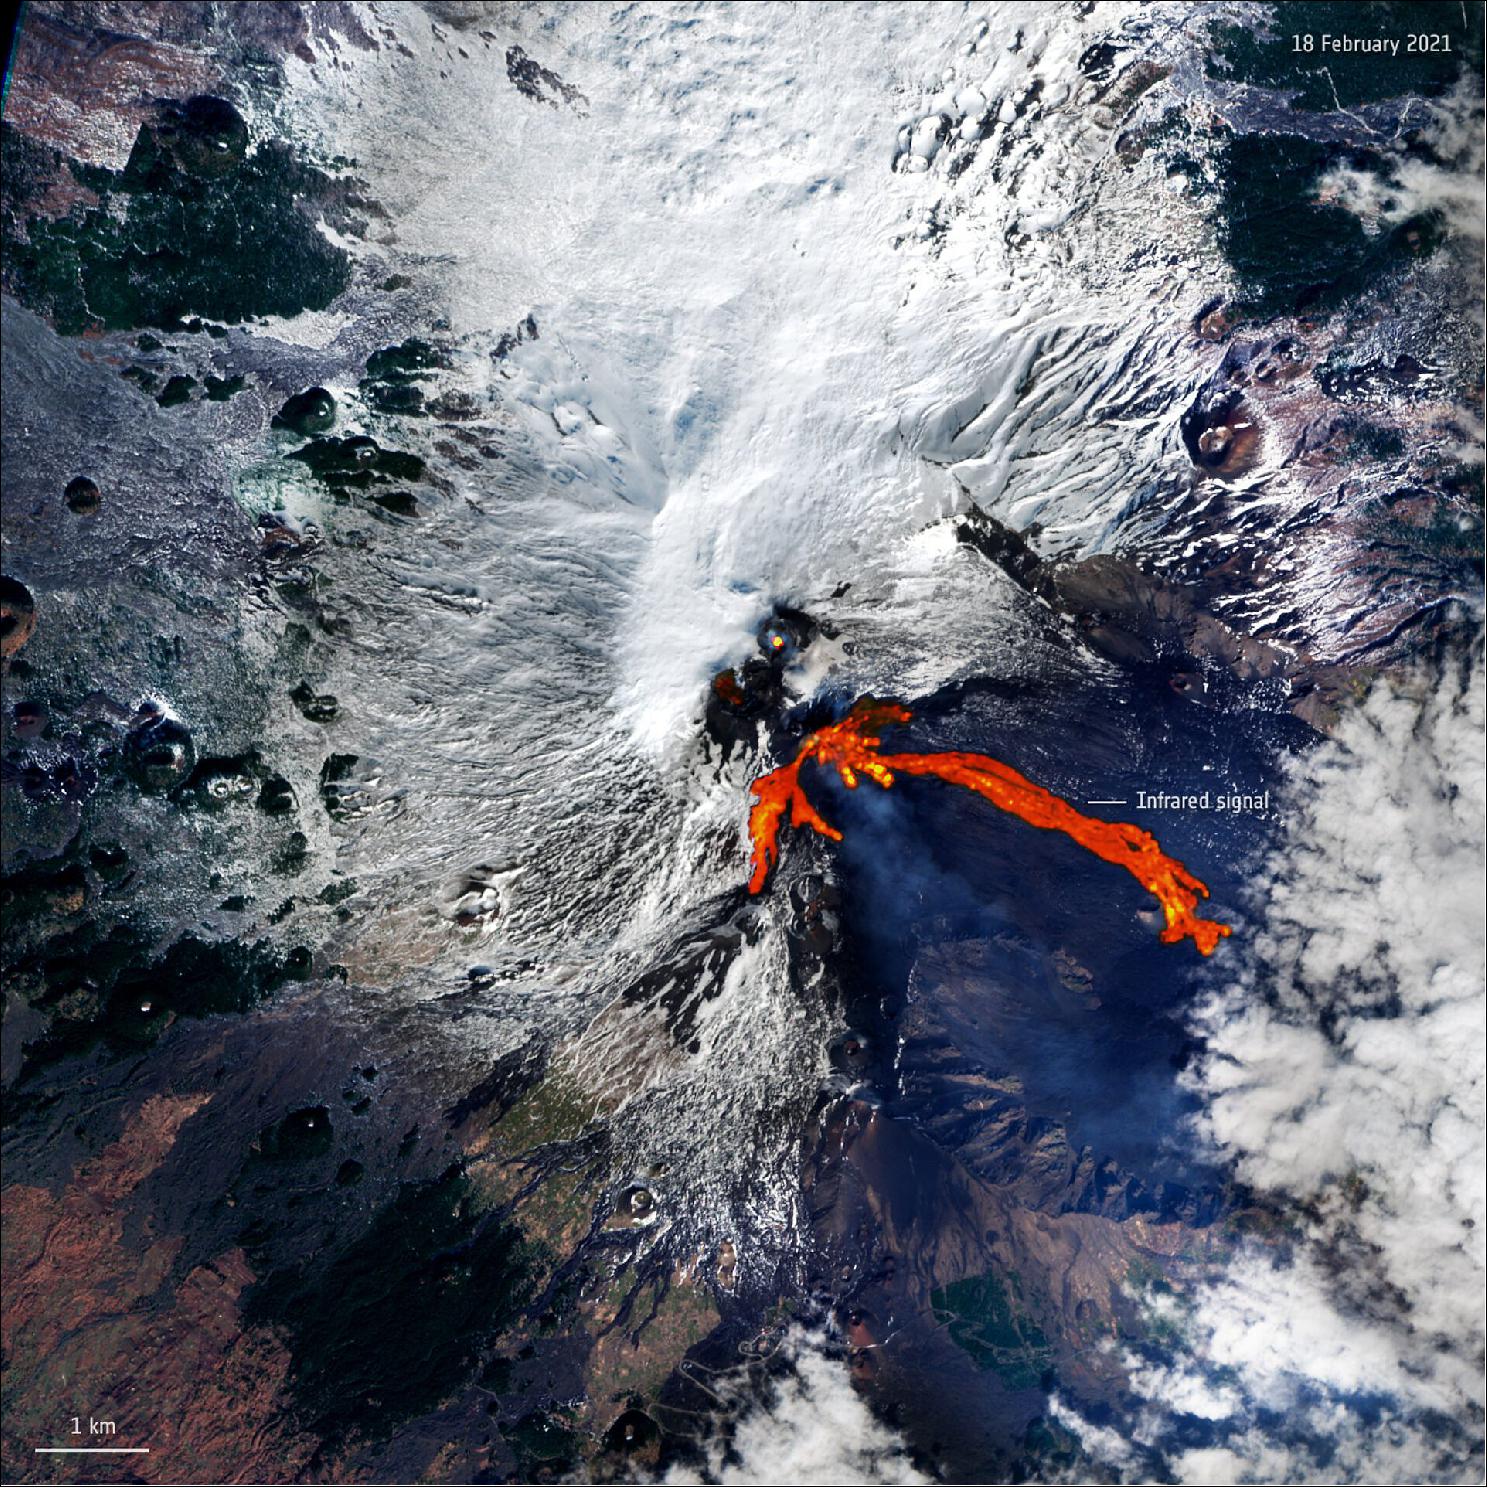
• February 19, 2021: The Copernicus Sentinel-2 mission takes us over Lusaka – the capital and largest city of Zambia. 54)
- Lusaka, visible at the top of the image of Figure 71, is located on a high plateau in south-central Africa with an elevation of around 1200 m. With a population of over 2 million people, Lusaka is one of the fastest developing cities in southern Africa. Lusaka National Park is easily identifiable as a brown patch of land just southeast of the city. The 6700 hectare park hosts a variety of rare and endangered animals.
- Owing to Zambia’s humid sub-tropical climate, agriculture is the country’s main source of income and jobs. The circular shapes in the image, visible mostly southwest of Lusaka in light green, are an example of pivot irrigation, or center-pivot irrigation systems. This type of irrigation functions where equipment rotates around a central pivot and crops are fed with water from the centre of the arc.
- Water from the nearby Kafue River, visible cutting across the image from left to right, is used for irrigation and hydroelectric power. At 1600 km long, the Kafue River is the longest river lying solely within Zambia. The river flows across the flat plain called Kafue Flats (also known as Butwa) and meanders in a maze of swampy channels and lagoons.
- The flats, visible in dark brown in the far-left of the image, are a shallow flood plain around 240 km long and about 50 km wide, and are usually flooded to a depth of less than one meter in the rainy season.
- From here, the Kafue River continues its journey southeast, flowing through the Kafue Gorge before finally joining the Zambezi River, visible in the bottom-right of the image, near Chirundu, Zimbabwe.
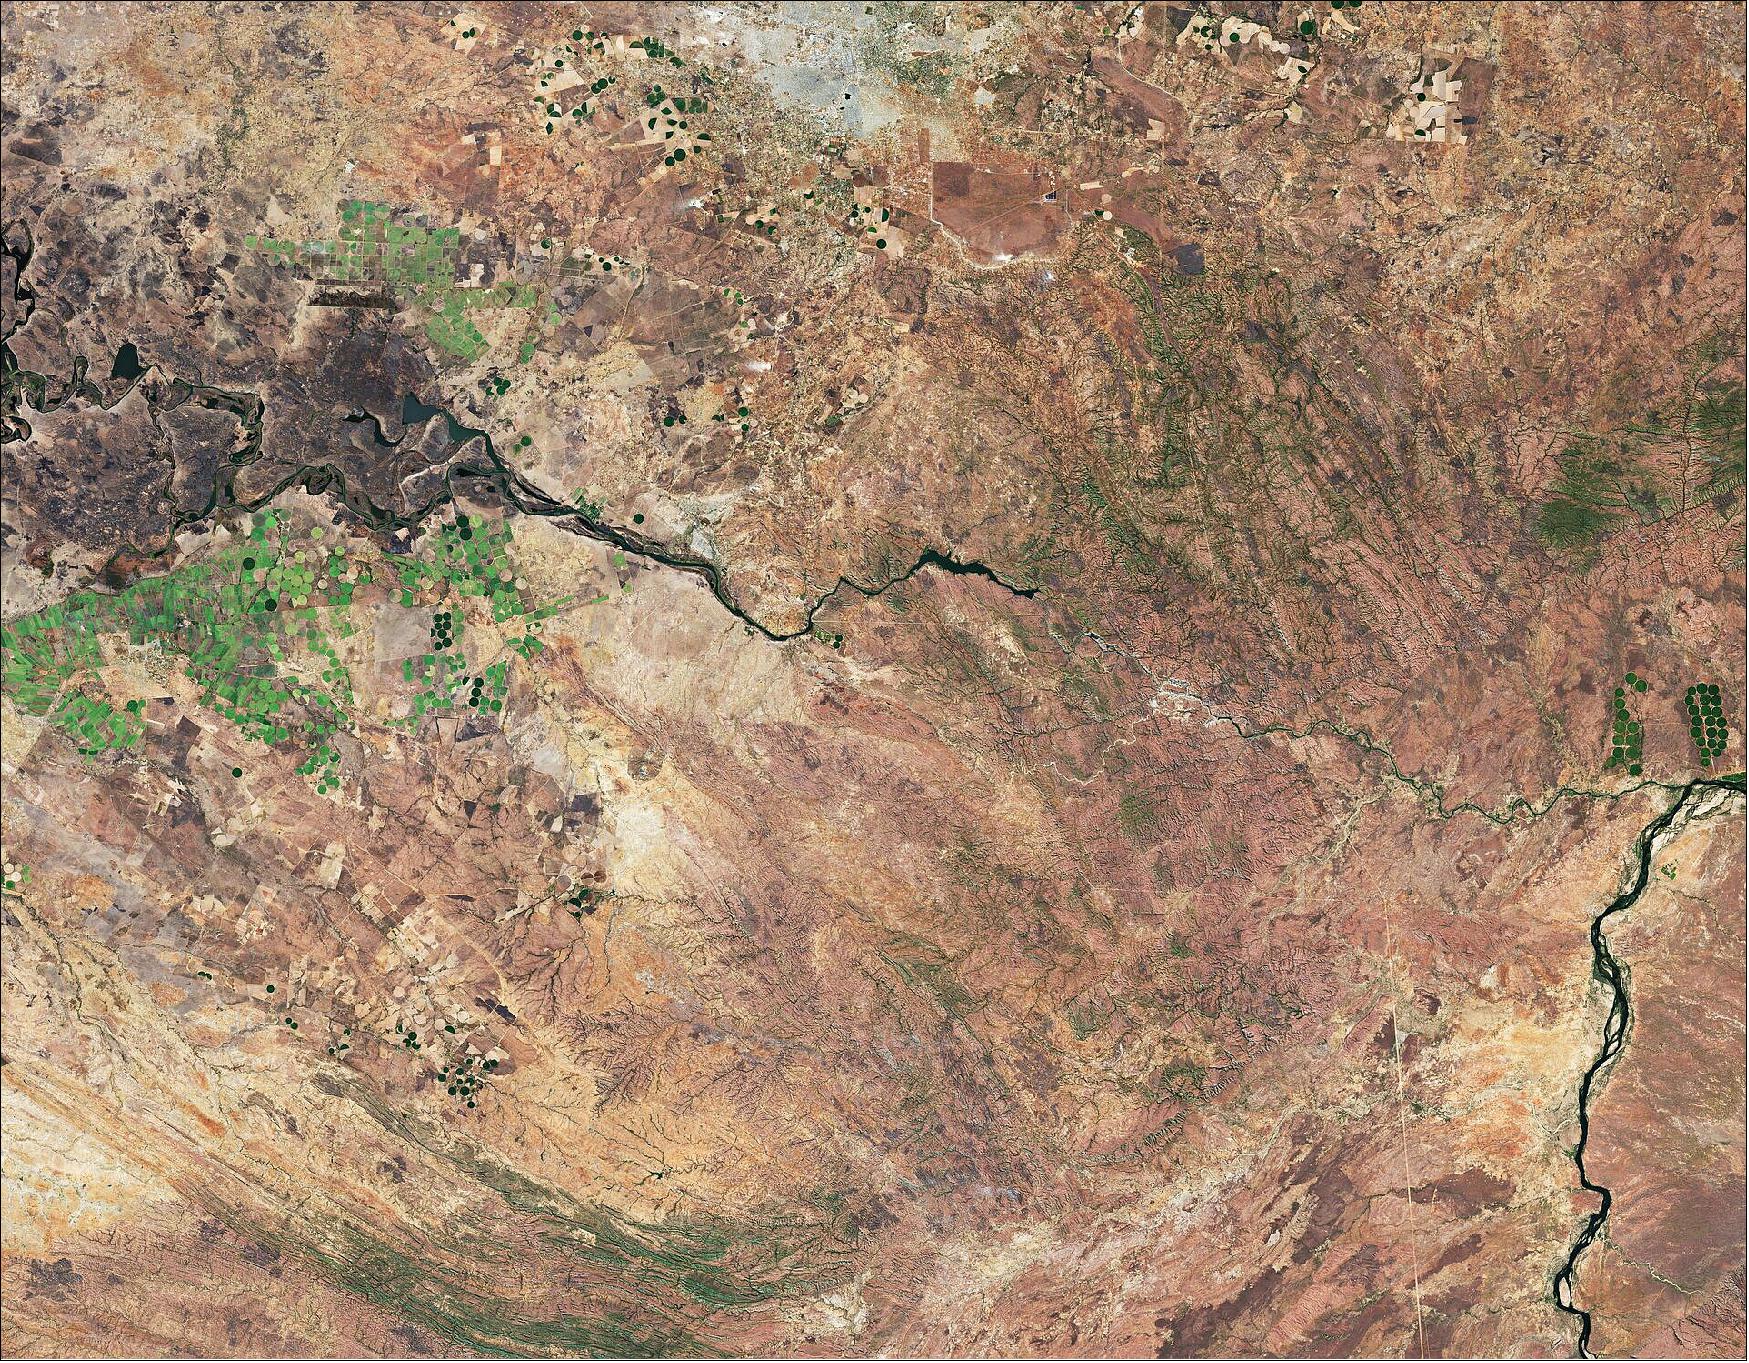
• February 12, 2021: For Valentine’s Day, the Copernicus Sentinel-2 mission takes us over Valentine Island in northern Western Australia. 55)
- The King Sound has one of the highest tides in Australia, and amongst the highest in the world, reaching a maximum tidal round of around 11 to 12 m. The Fitzroy River, one of Australia’s largest watercourses, along with the Lennard, Meda and Robinson Rivers, empty their muddy and sediment-laden waters into the Sound.
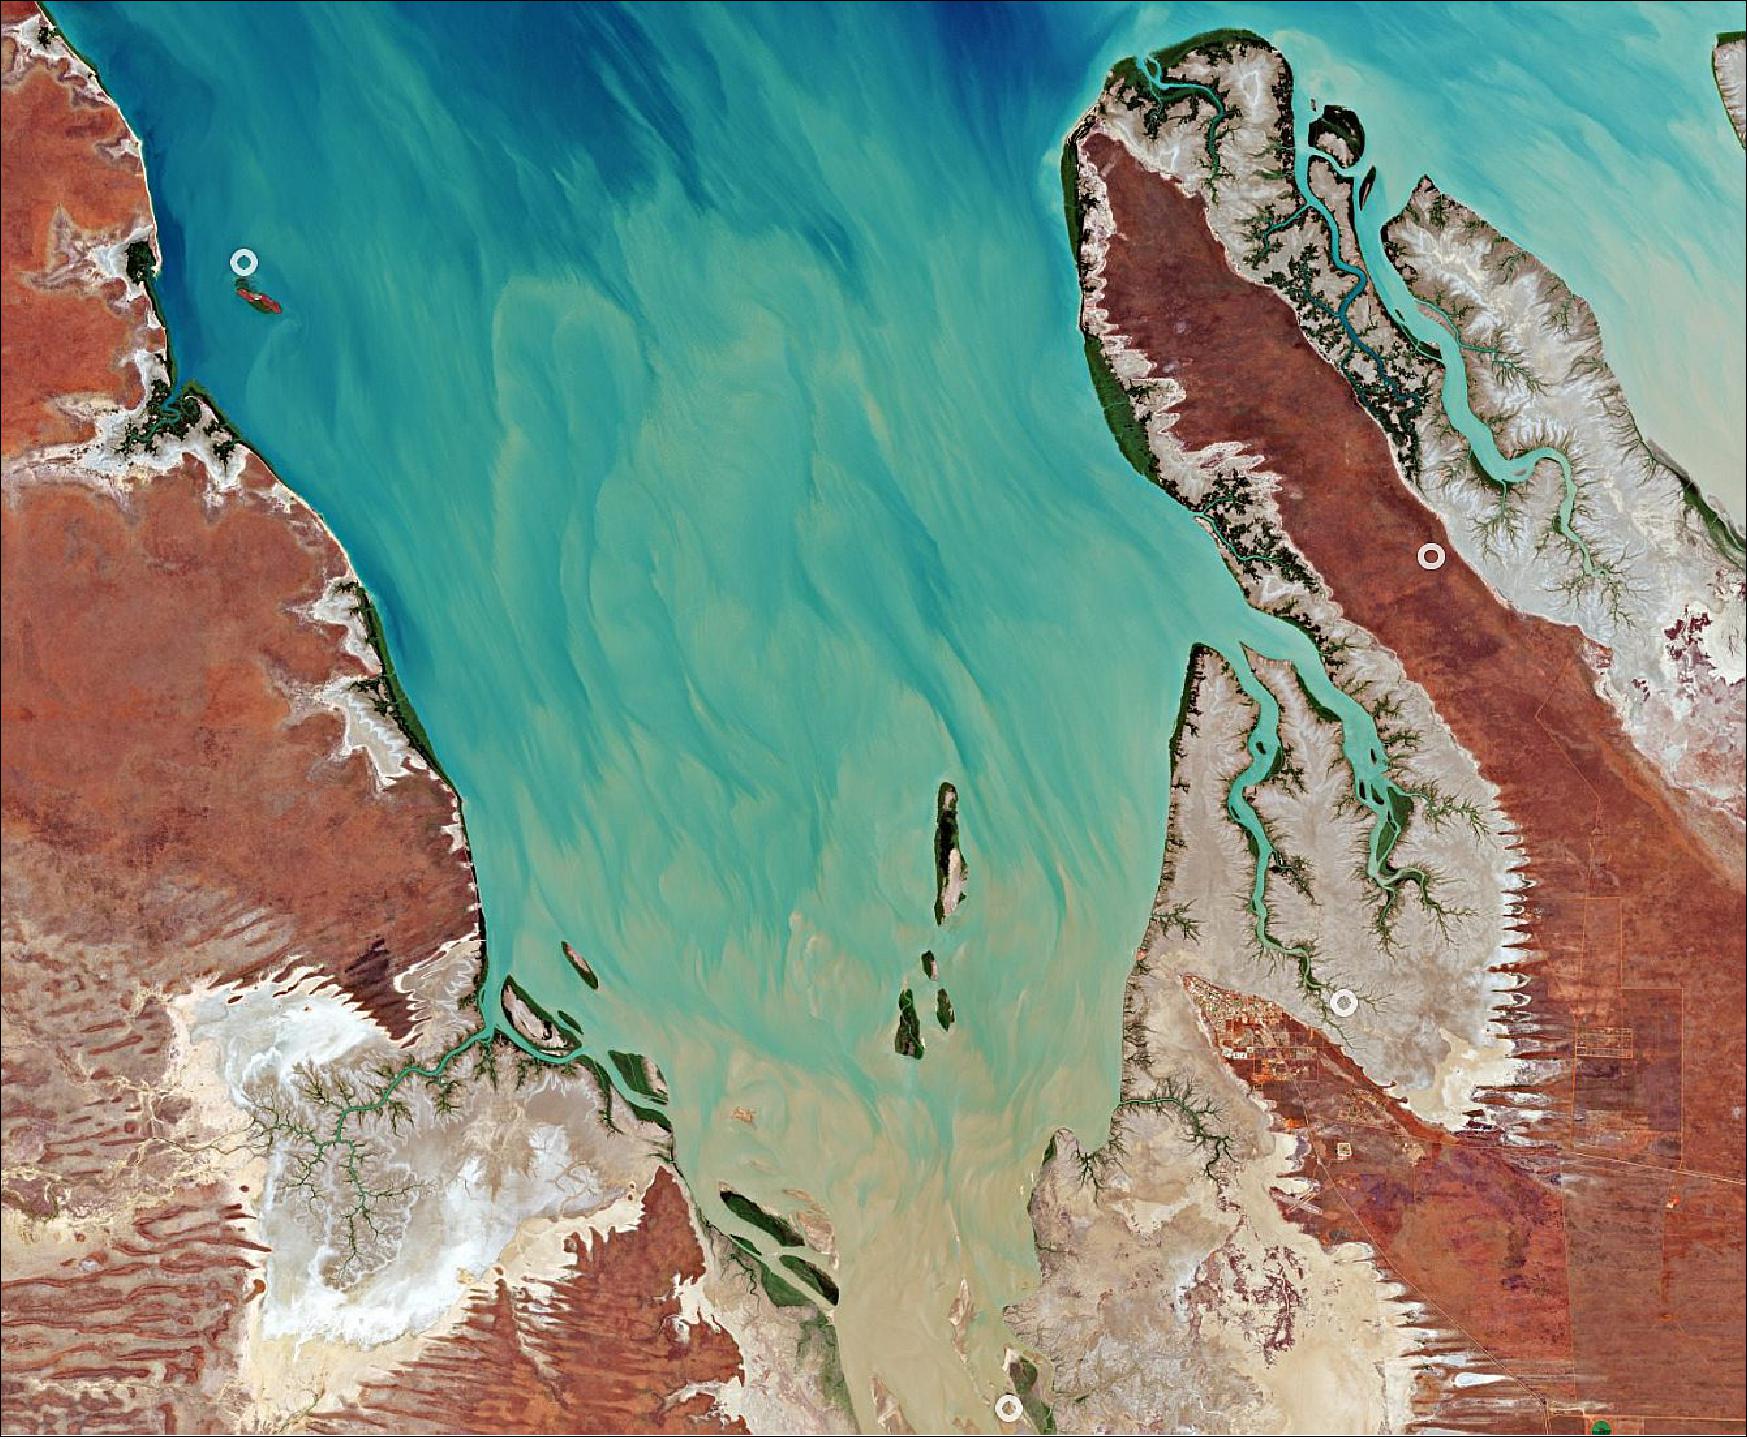
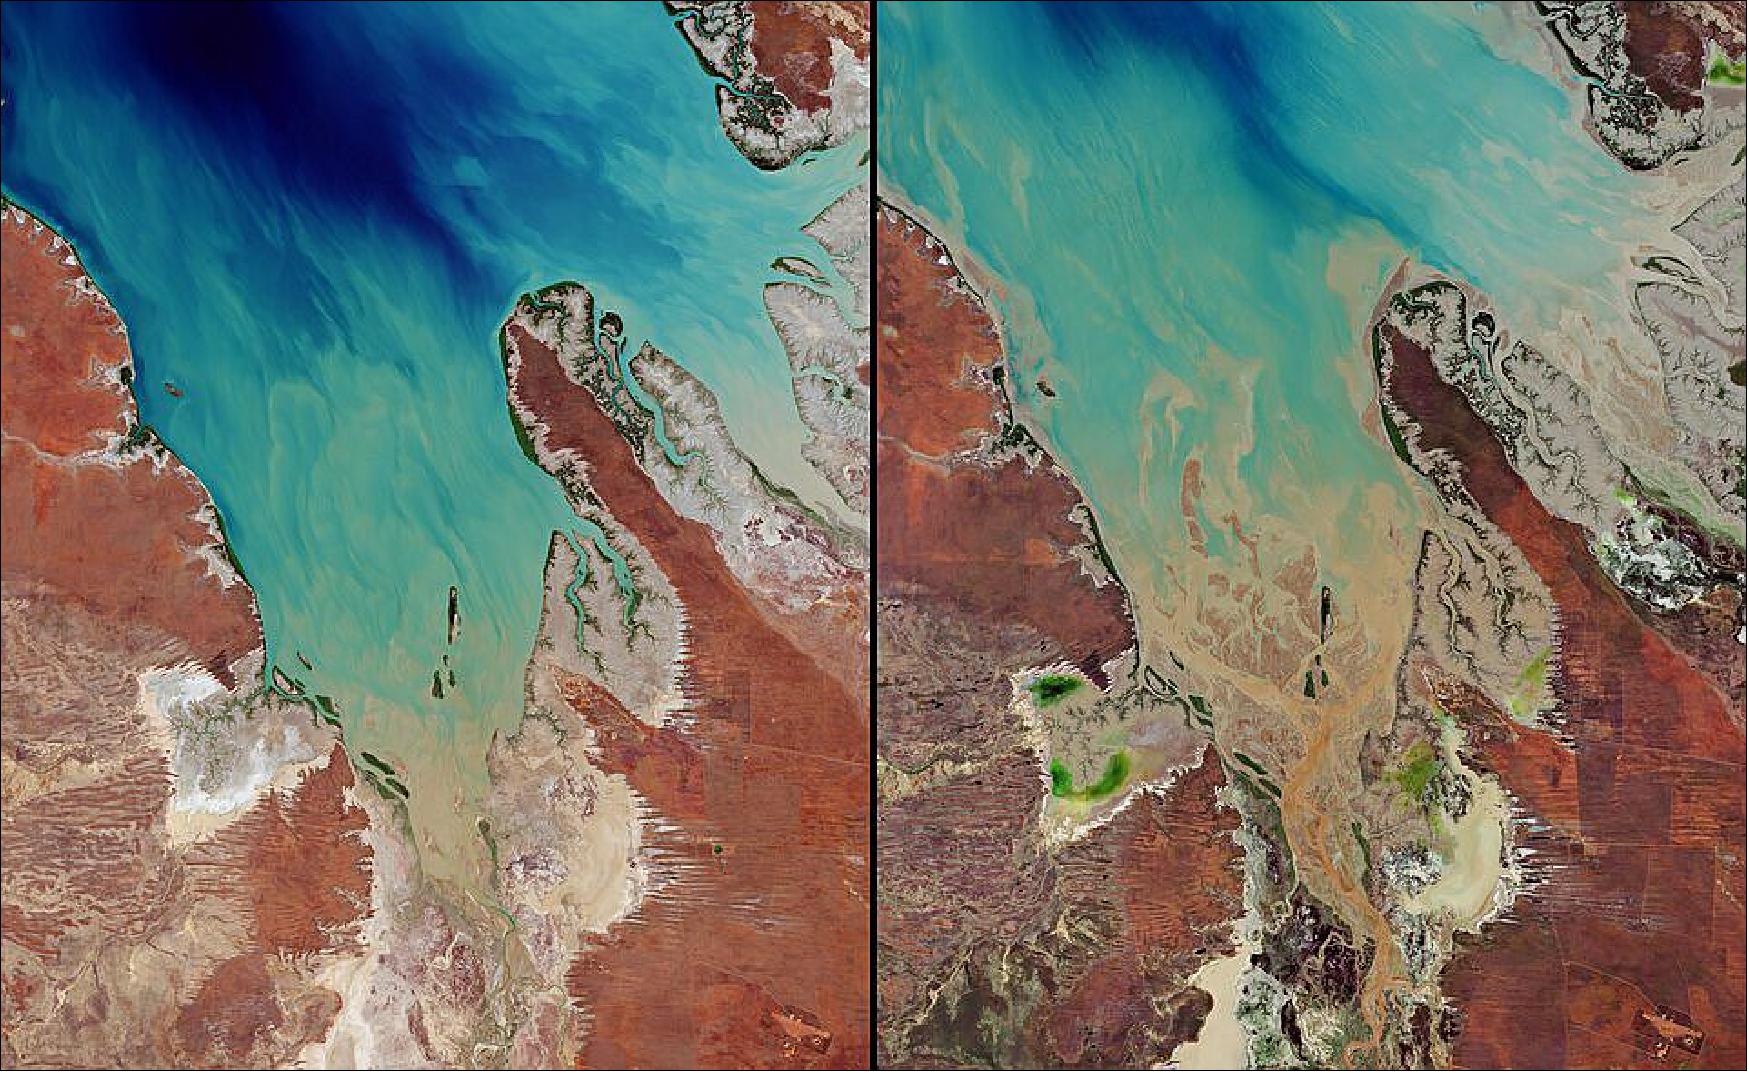
- The heavy rain caused a large amount of sediment to be discharged into the Sound, as seen in dark shades of brown which contrast with the clearer, turquoise-colored waters visible at the top. The sediment has also been transported and deposited around Valentine Island.
- A myriad of mangrove estuaries can be seen scattered around the coast. Australia is surrounded by around 11,000 km of mangrove-lined coast, located primarily on the northern and eastern coasts of the continent. Mangroves contribute many environmental benefits to coastal and estuarine ecosystems; they provide food and habitats for a wealth of wildlife such as birds and fish.
- As more people move closer to coastal zones, the risk to mangroves increases. Greater pressure is placed on the mangrove environment from both direct and indirect sources such as dumping of waste, fish farming, sea level rise and climate change.
- Satellite missions such as Copernicus Sentinel-2 allow us to capture spectacular images such as these from space. This year, some of our incredible images of Earth from Space are now available as posters in the ESA On Demand shop. From the Amazon, to the Baltic Sea, to Antarctica, browse our new, Earth-inspired wall art for your home or office. Surprise someone special this Valentine’s Day with the special-edition image of the heart-shaped Moorea Island.
• February 5, 2021: The Copernicus Sentinel-2 mission takes us over the algal blooms swirling around the Pacific Ocean, just off the coast of Japan. 56)
- Algae blooms refer to the rapid multiplying of phytoplankton – microscopic marine plants that drift on or near the surface of the sea. Excessive algal growth, or algal blooms, can become visible to the naked eye and collectively tint ocean waters, allowing us to detect these tiny organisms from space.
- Although algal blooms are a natural and essential part of life in the sea, human activity is also said to increase the number of annual blooms. Harmful algal blooms can be stimulated by environmental factors, such as light, warmer water temperatures and excessive nutrients.
- During the spring bloom season, nutrients such as nitrates and phosphates are more abundant in the surface waters. Without direct in situ measurements, it is difficult to distinguish the type of algae that cover the ocean here. Algae is then usually carried by winds and currents closer to the coast of Japan.
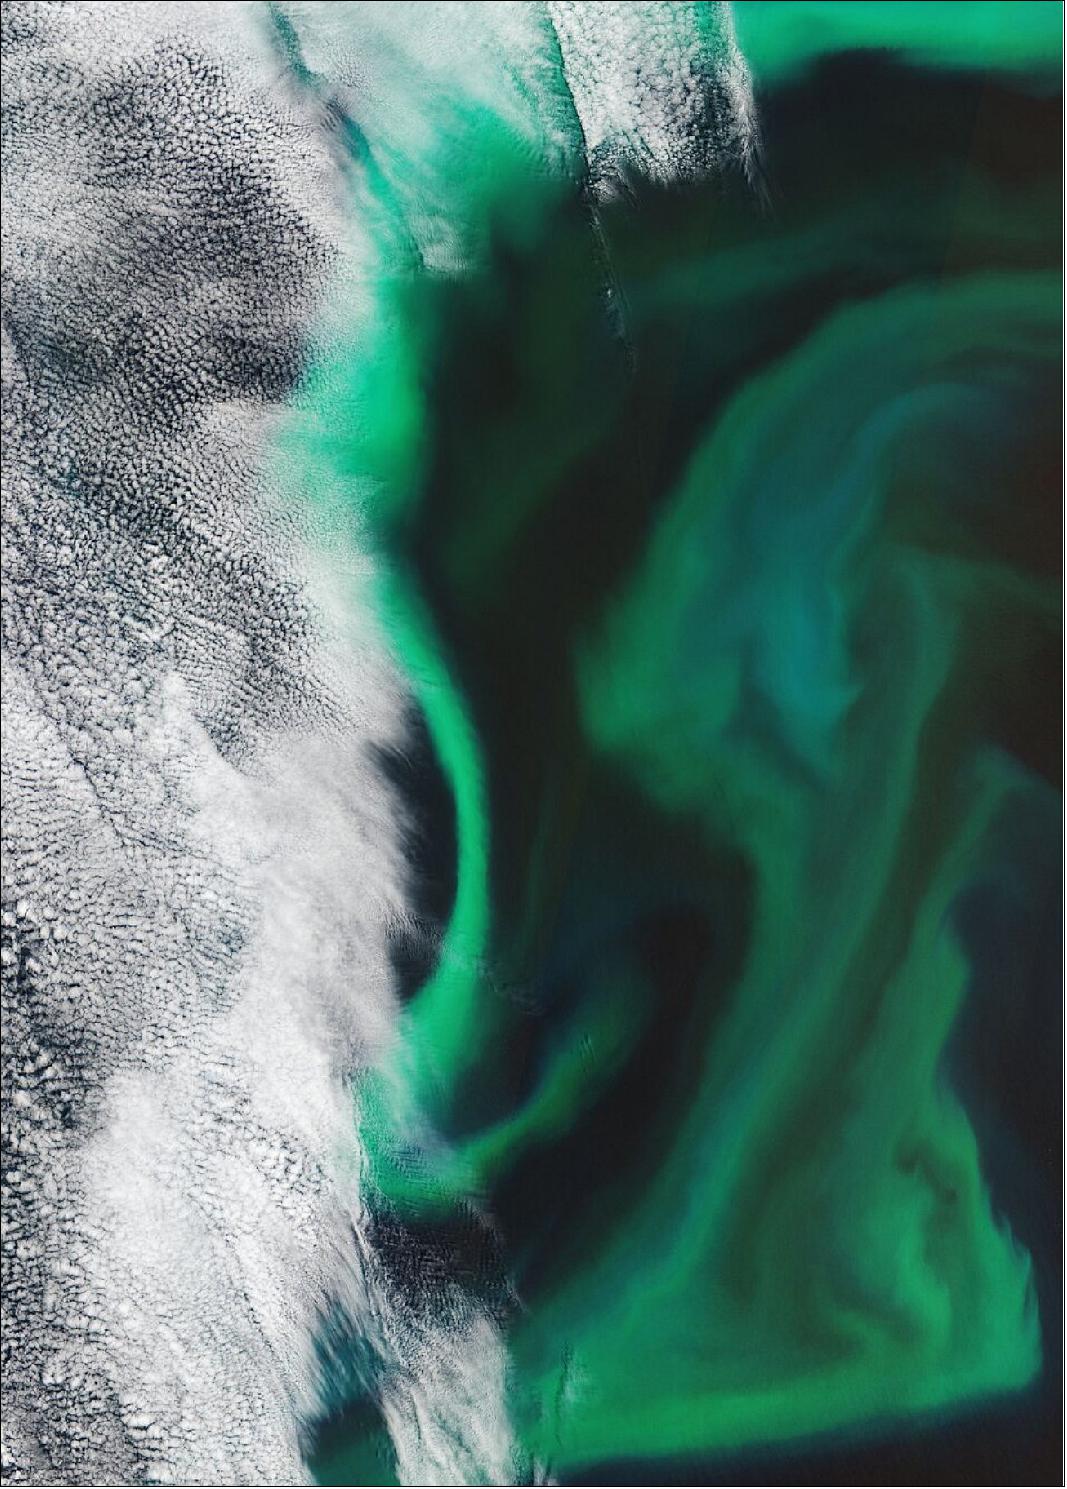
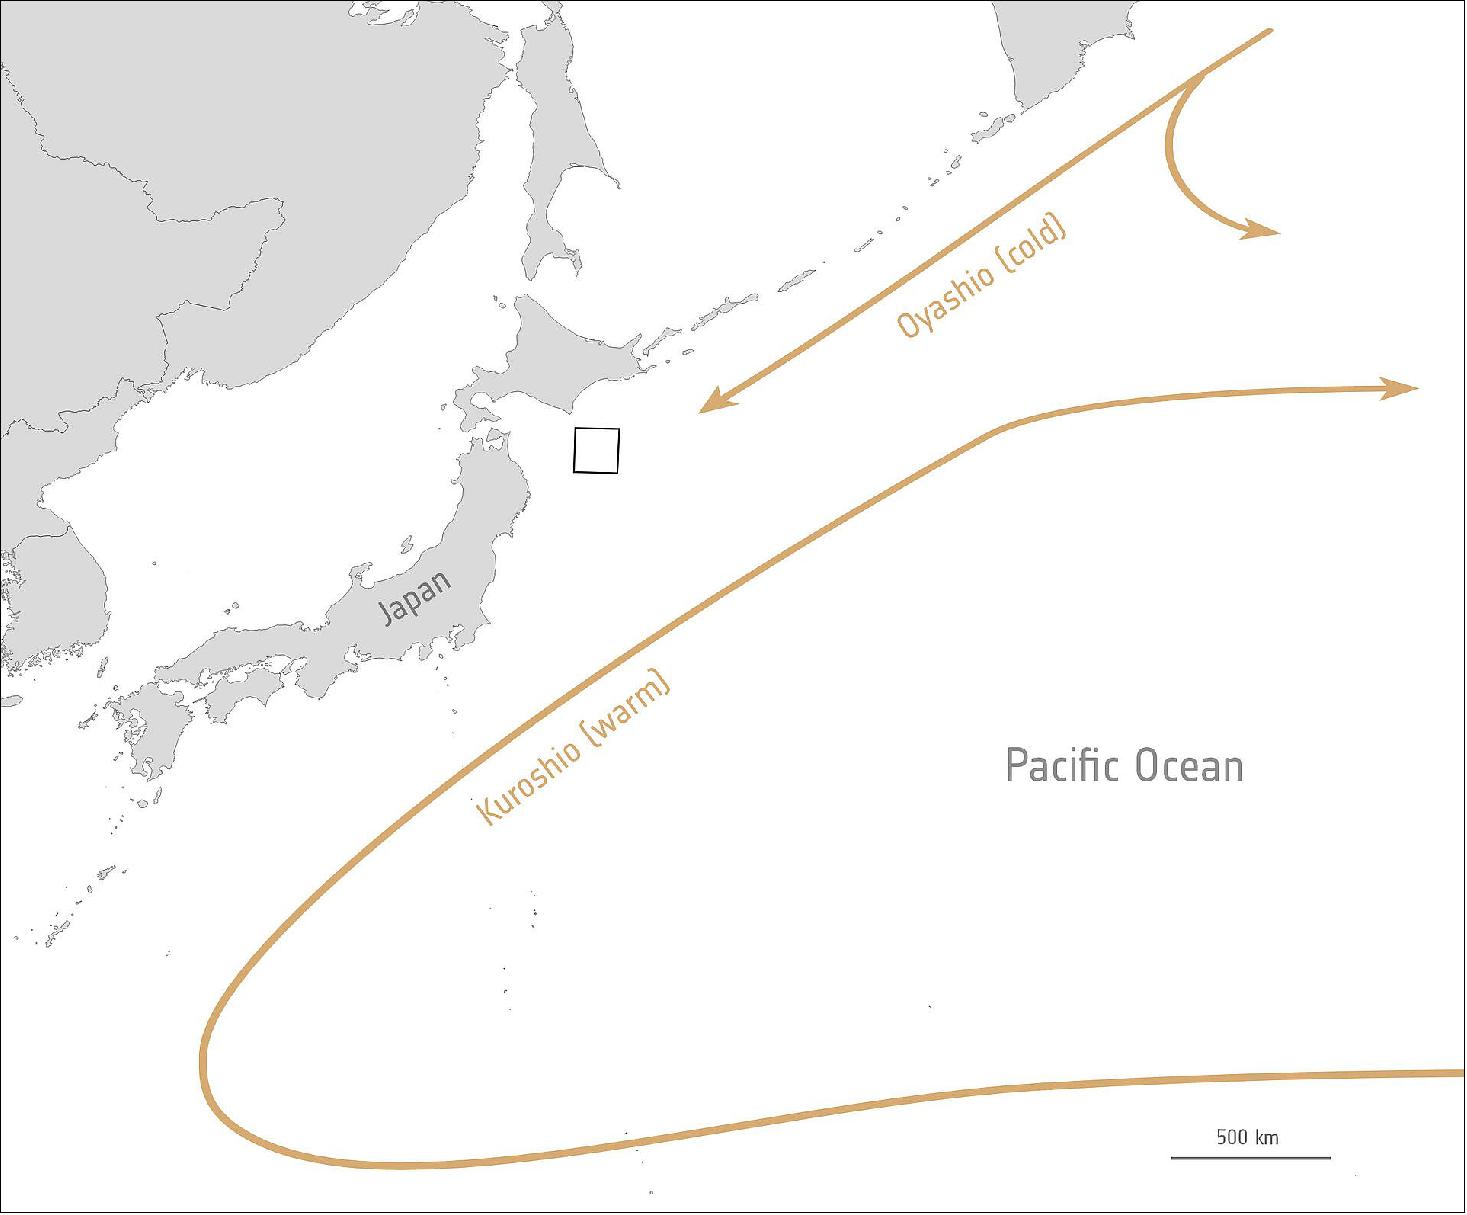
- Phytoplankton play an important role in the food chain, but they also have an impact on the global carbon cycle by absorbing carbon dioxide on a scale equivalent to that of terrestrial plants. Primary production is often used to describe the synthesis of organic material from carbon dioxide and water through photosynthesis. Even small variations in primary productivity can affect carbon dioxide concentrations, as well as influencing biodiversity and fisheries.
- As ocean surfaces warm in response to increasing atmospheric greenhouse gases, phytoplankton productivity will need to be monitored both consistently and systematically.
- Satellite data can not only be used to track the growth and spread of harmful algae blooms in order to alert and mitigate against damaging impacts for tourism and fishing industries, but have also recently proven fundamental to providing a global view of phytoplankton and their role in, and response to, climate change.
• January 29, 2021: Ahead of World Wetlands Day, the Copernicus Sentinel-2 mission takes us over Lake Titicaca – one of the largest lakes in South America. 57)
- Covering an area of around 8300 km2, Lake Titicaca lies on the high Andes plateau and straddles the border between Peru (to the west) and Bolivia (to the east). It is considered the highest major body of navigable water in the world, as it sits at an elevation of 3800 m above sea level.
- The lake extends approximately 190 km from northwest to southwest and is 80 km across at its widest point. Tiquina, a narrow strait, actually separates the lake into two separate bodies of water. The larger subbasin in the northwest is called Lake Chucuito in Bolivia and Lake Grande in Peru, while the smaller in the southeast is referred to as Lake Huiñaymarca in Bolivia and Lake Pequeño in Peru.
- Many rivers drain into the lake, including the Ramis, one of the largest, visible in the northwest corner of the lake. The smaller Desaguadero river drains the lake at its southern end, which then flows south through Bolivia. This outlet only accounts for a small percentage of the lake’s excess water, as the rest is lost by evaporation caused by persistent winds and intense sunlight.
- Lake Titicaca is a designated Ramsar Site of International Importance, as the waters of Titicaca are essential to the wellbeing of millions of people who rely on the lake for agriculture, fishing and tourism, as well as water birds and animals that live along and on its shores.
- February 2 marks the anniversary of the signing of the Convention on Wetlands of International Importance, known as the Ramsar Convention, in Ramsar, Iran in 1971. World Wetlands Day aims to raise global awareness about the vital role of wetlands for our planet and population.
- From their vantage point of 800 km high, Earth-observing satellites provide data and imagery on wetlands that can be used to monitor and manage these precious resources sustainably. For example, both the Copernicus Sentinel-2 and Sentinel-3 missions have recently been used to monitor the variation of chlorophyll concentrations in the lake and help detect trends and hotspots over time.
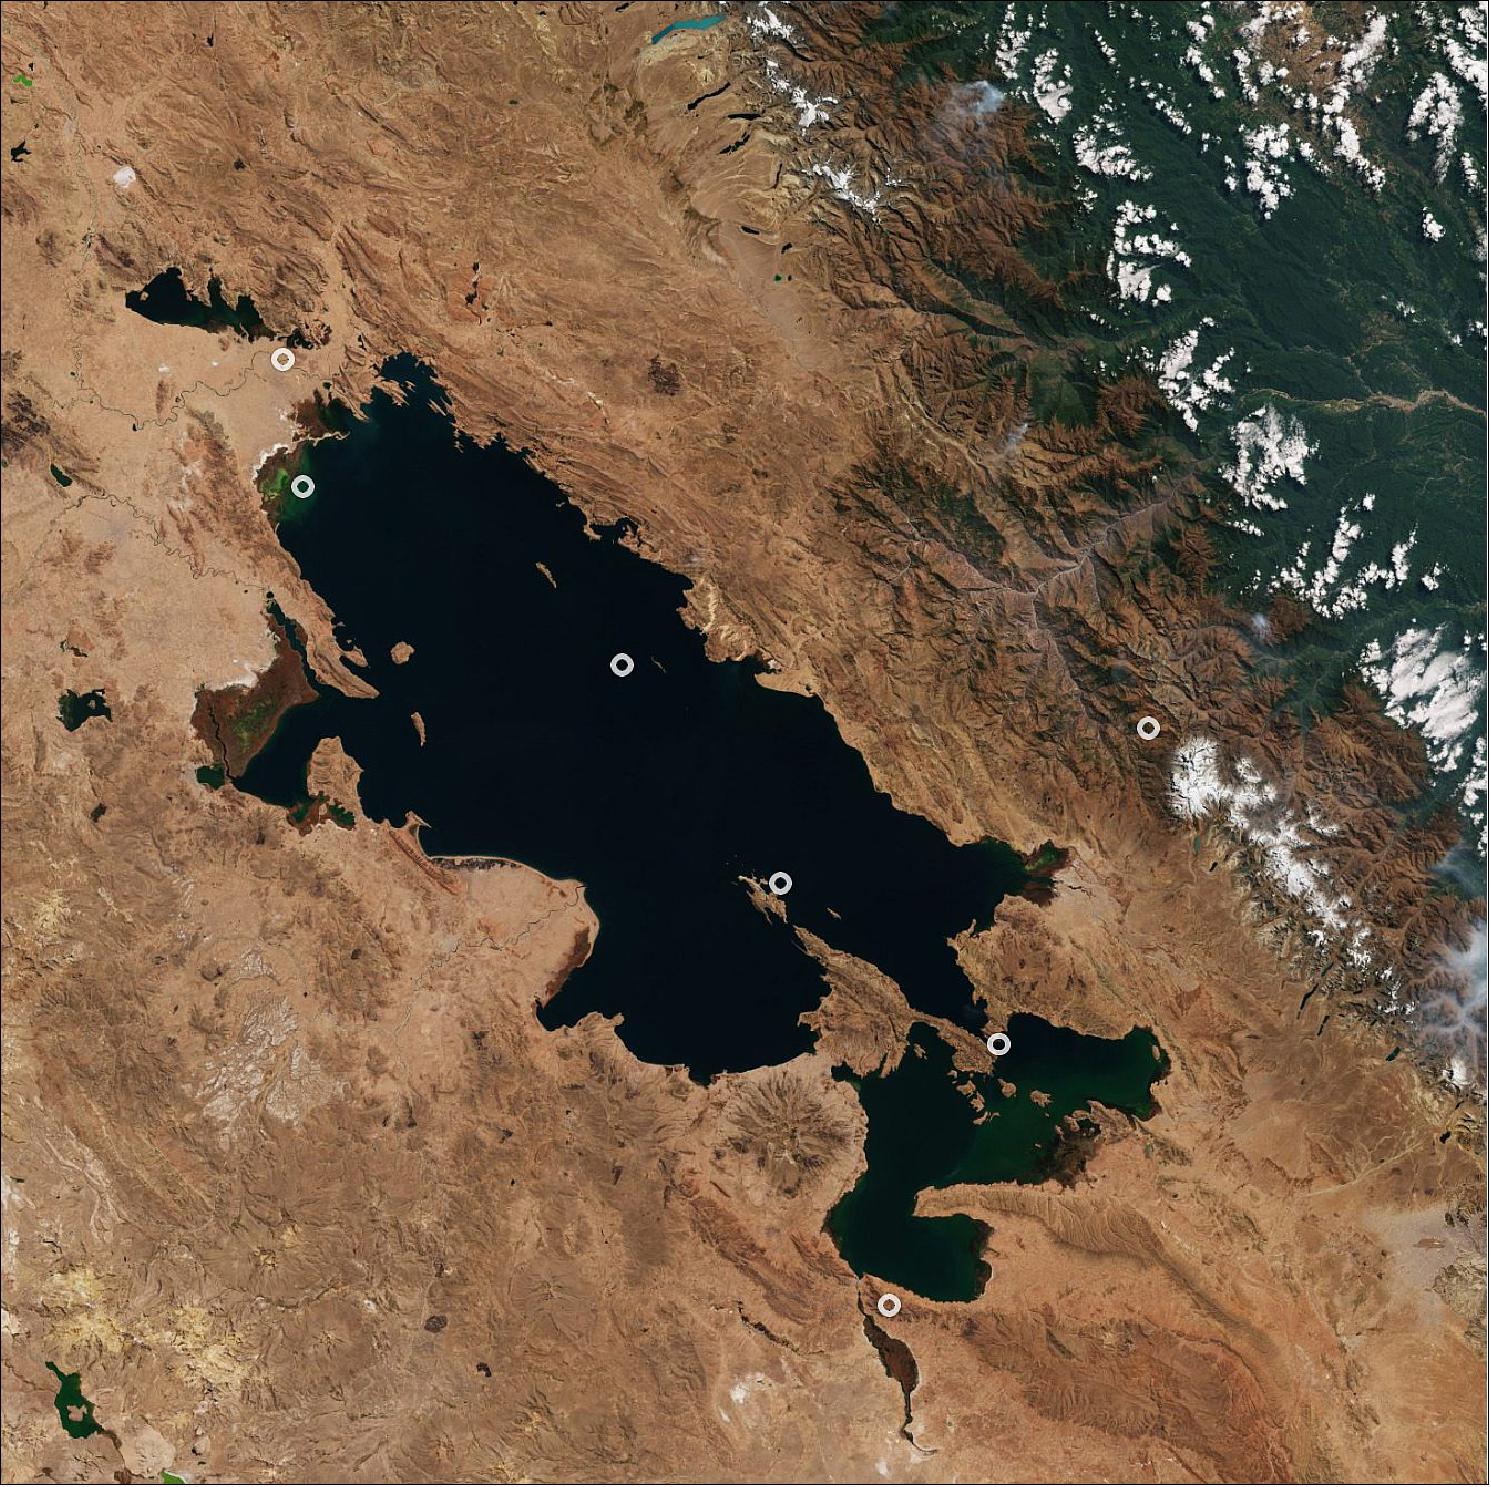
• January 22, 2021: Sardinia, the second-largest island in the Mediterranean Sea, is featured in this false-color image captured by the Copernicus Sentinel-2 mission. 58)
- Sardinia (also known as Sardegna) is situated between the Mediterranean Sea to the west and south and the Tyrrhenian Sea to the east. The island sits 200 km west of the Italian Peninsula, 200 km north of Tunisia and around 12 km south of the French island of Corsica, partially visible in the top of the image.
- Sardinia is a mainly mountainous region, with its highest point Mount La Marmora in the Gennargentu massif visible in the centre-right of the image. With over 1800 km of coastline, Sardinia is internally renowned for its beaches including those along the Emerald Coast, or Costa Smeralda, Alghero and Villasimius. The coasts, particularly in the east, are high and rocky, with long stretches of coastline with bays, inlets and various smaller islands located off the coast.
- The archipelago of La Maddalena, including the renowned islands of La Maddalena, Caprera and Santo Stefano, can be seen in the top-right of the image. Its islands are known for their pristine beaches and wild beauty. Cagliari, the island’s capital and largest city, lies on the southern coast of the island.
- Copernicus Sentinel-2 is designed to provide images that can be used to distinguish between different crop types as well as data on numerous plant indices, such as leaf area index, leaf chlorophyll content and leaf water content – all of which are essential to accurately monitor plant growth.
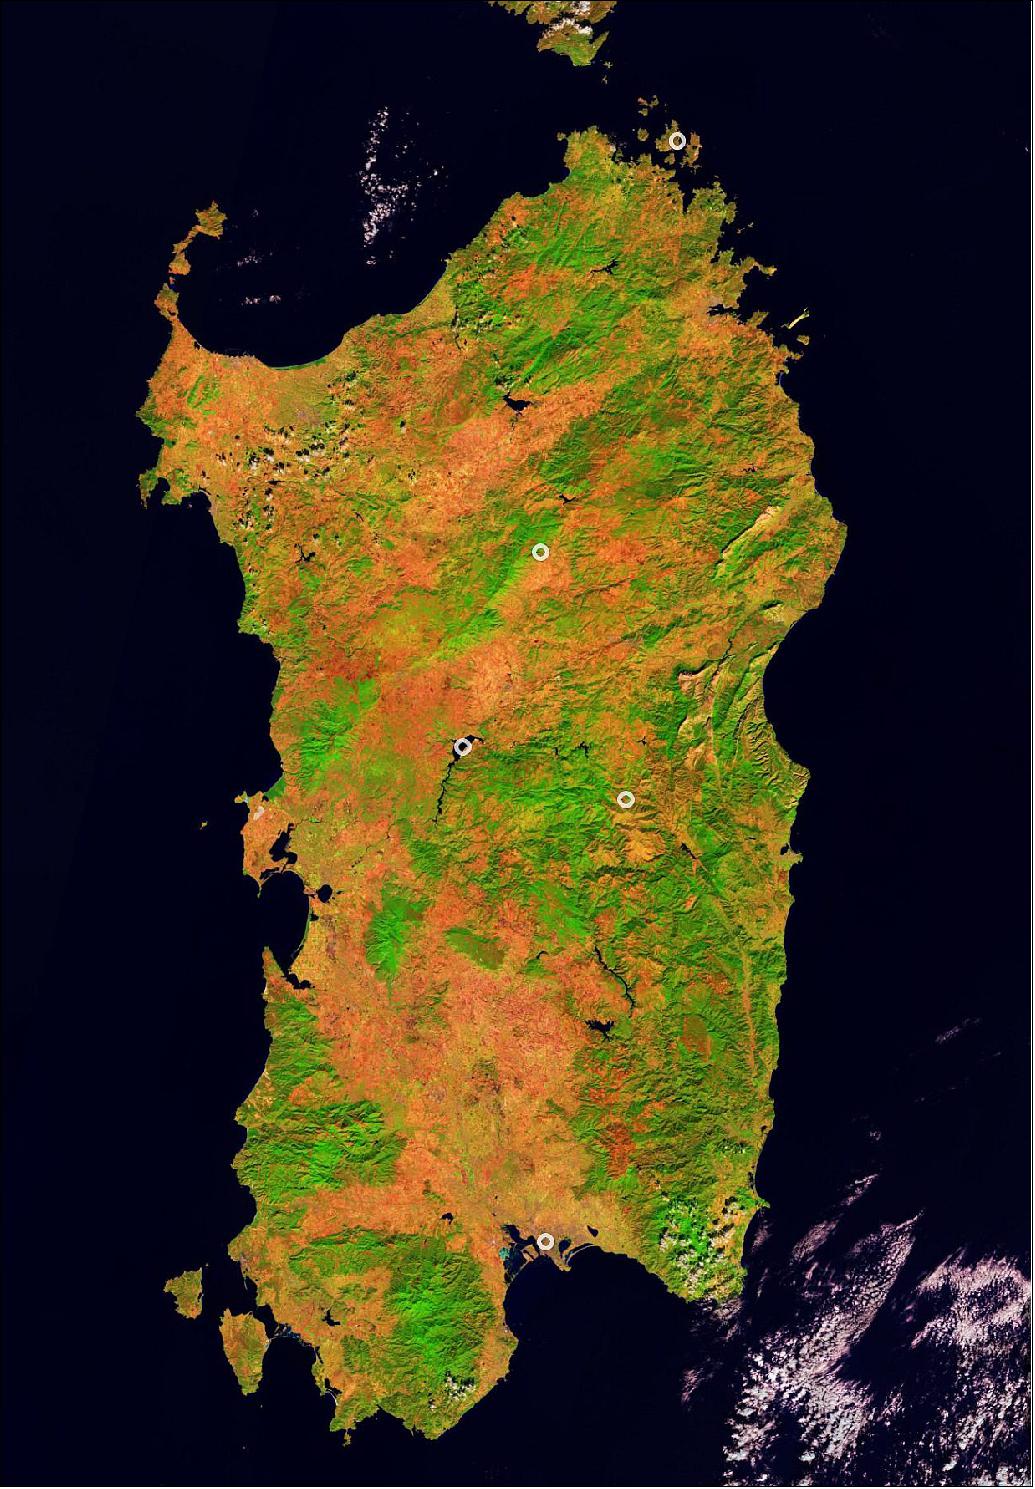
• January 15, 2021: The Copernicus Sentinel-2 mission takes us over the Tanezrouft Basin – one of the most desolate parts of the Sahara Desert. 59)
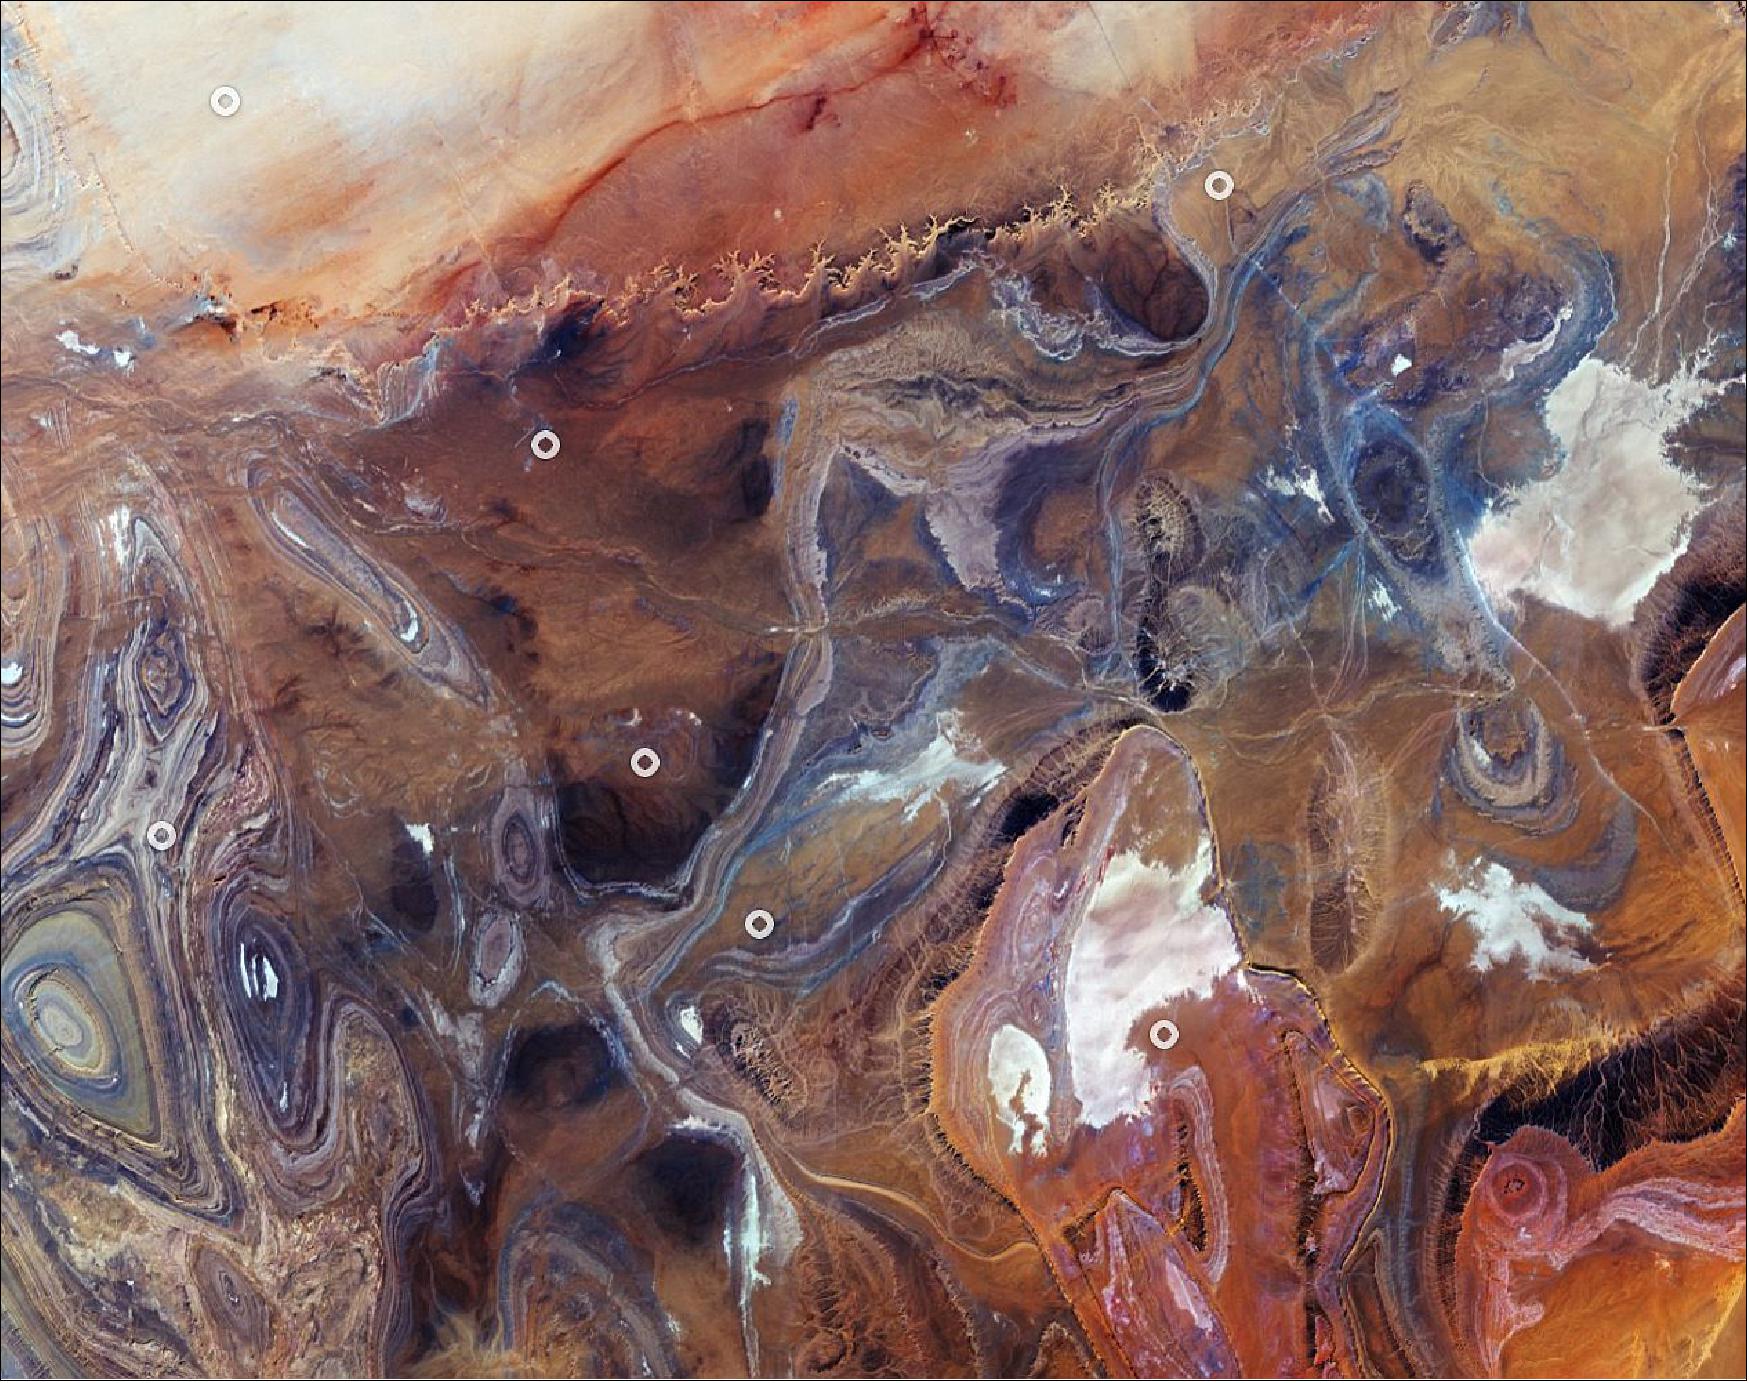
- The barren plain extends to the west of the Hoggar mountains and southeast of the sandy Erg Chech. The terrain shows evidence of water erosion that occurred many years ago, when the Sahara Desert’s climate was much wetter, as well as wind erosion caused by frequent sandstorms – exposing ancient folds in the Paleozoic rocks.
- The region is characterized by dark sandstone hills, steep canyon walls, salt flats (visible in white in the image), stone plateaus and seas of multi-storey sand dunes known as ‘ergs’. Concentric rings of exposed sandstone strata create a stunning pattern predominantly visible in the left of the image.
- White lines in the right of the image are roads that lead to In Salah – the capital of the In Salah Province and In Salah District. Just above the center-left of the image, an airstrip can be seen. An interesting, grid-like pattern can be seen in the bottom of the image and mostly consists of human-made clearings and roads.
• January 12, 2021: Captured by the Copernicus Sentinel-2 mission on 11 January 2021 at 12:14 CET, this image of Madrid in Spain appears to have been taken in black and white. In fact, it is a true-color image – but the heaviest snowfall in 50 years has blanketed the region, turning the landscape white. 60)
- Storm Filomena hit Spain over the weekend, blanketing parts of the country in thick snow and leaving half of the country on red alert. Madrid, one of the worst affected areas, was brought to a standstill with the airport having to be closed, trains cancelled and roads blocked.
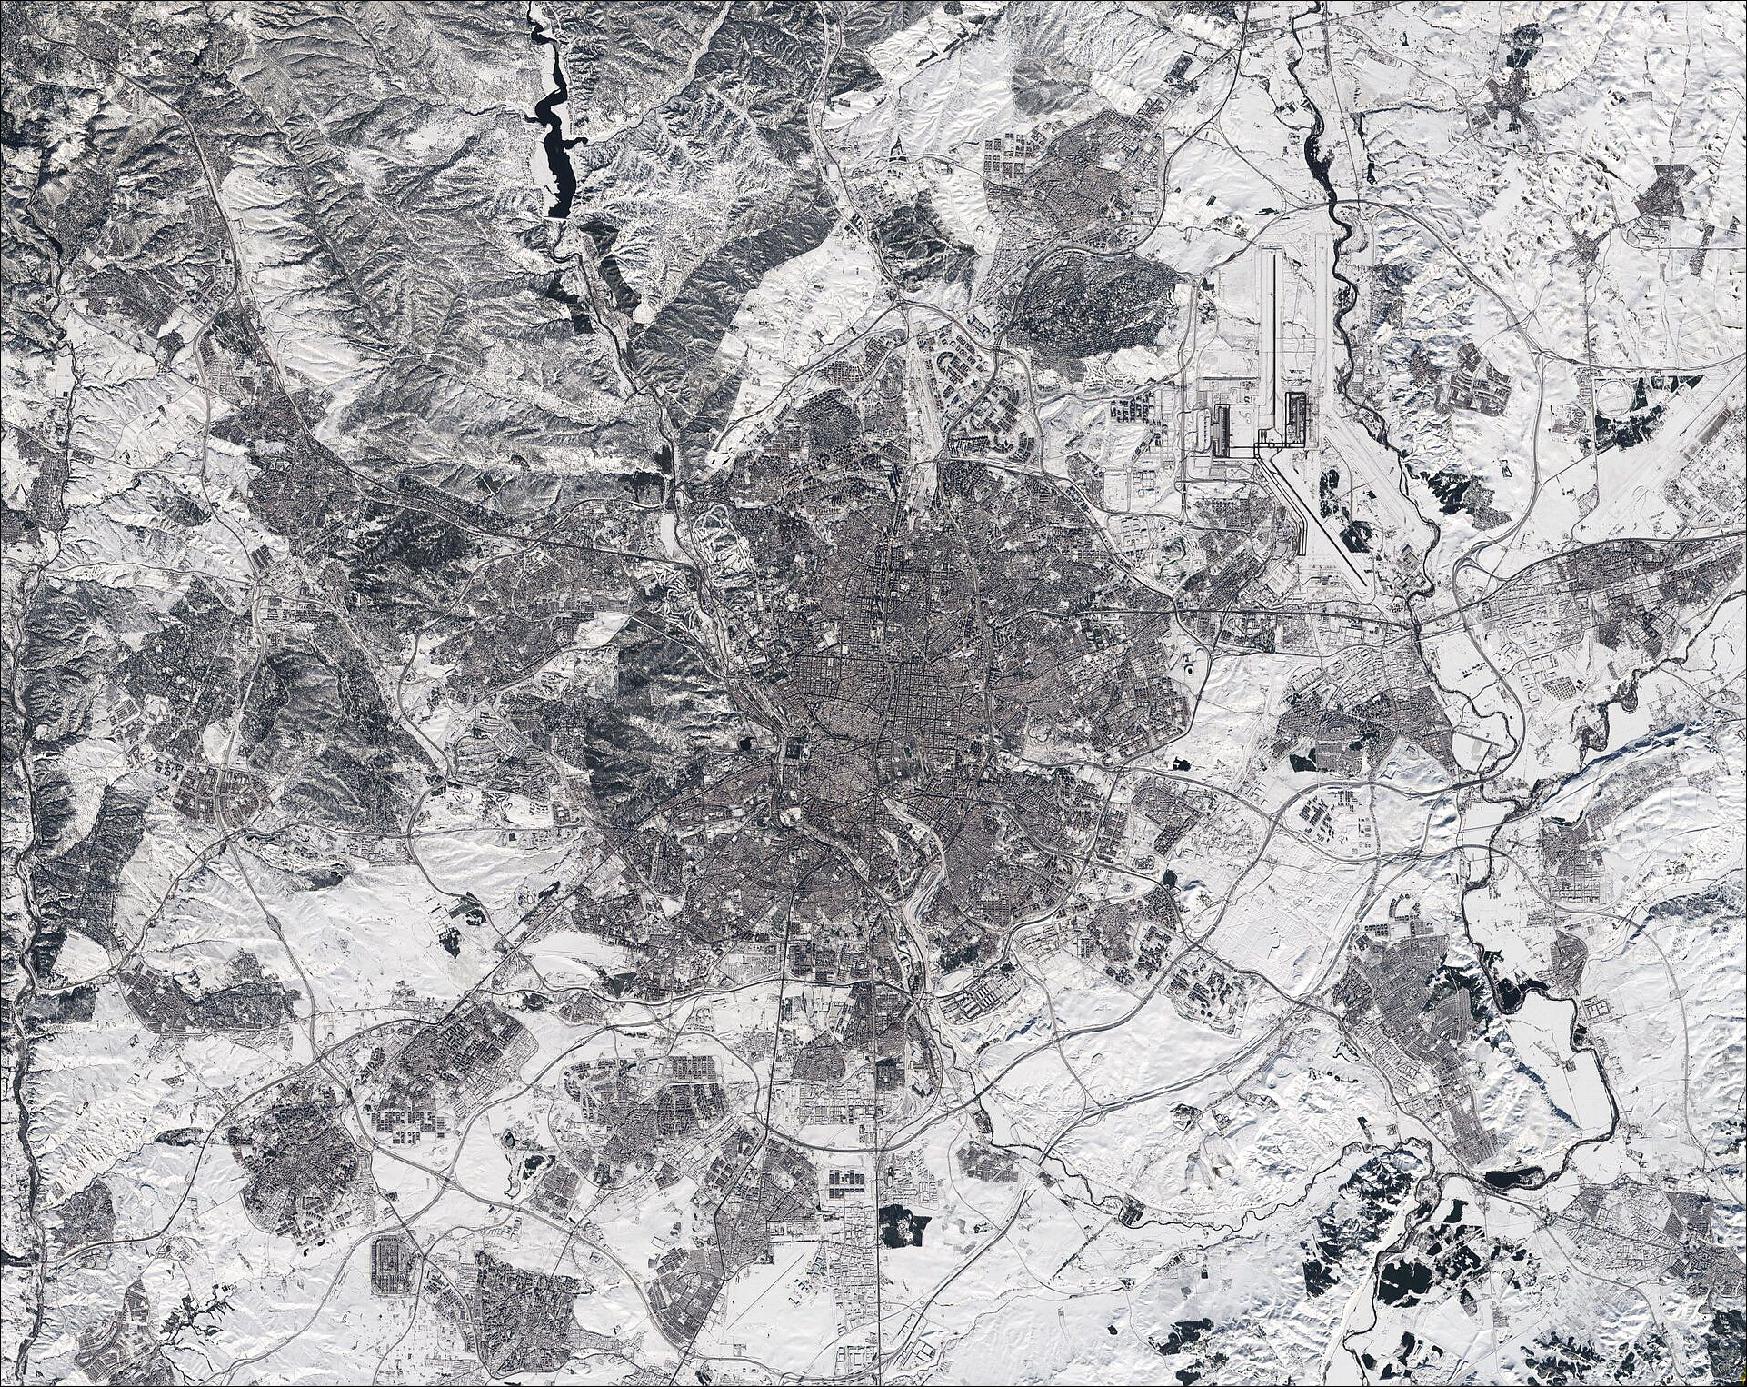
1) ”Earth from Space: Kourou, French Guiana,” ESA Applications, 17 December 2021, URL: https://www.esa.int/Applications/Observing_the_Earth/Copernicus/Earth_from_Space_Kourou_French_Guiana
2) ”Earth from Space: Fairbanks, Alaska,” ESA Application, 10 December 2021, URL: https://www.esa.int/Applications/Observing_the_Earth/Copernicus/Earth_from_Space_Fairbanks_Alaska
3) ”Earth from Space: White Nile, Sudan,” ESA Applications, 03 December 2021, URL: https://www.esa.int/Applications/Observing_the_Earth/Copernicus/Earth_from_Space_White_Nile_Sudan
4) ”Earth from Space: Kainji Lake,” ESA Applications, 26 November 2021, URL: https://www.esa.int/Applications/Observing_the_Earth/Copernicus/Earth_from_Space_Kainji_Lake
5) ”Earth from Space: Kuala Lumpur, Malaysia,” ESA Applications, 19 November 2021, URL: https://www.esa.int/Applications/Observing_the_Earth/Copernicus/Earth_from_Space_Kuala_Lumpur_Malaysia
6) ”Washington state flooding,” ESA Applications, 18 November 2021, URL: https://www.esa.int/ESA_Multimedia/Images/2021/11/Washington_state_flooding
7) ”Cancún, Mexico,” ESA Applications, 12 November 2021, URL: https://www.esa.int/Applications/Observing_the_Earth/Copernicus/Earth_from_Space_Cancun_Mexico
8) ”Earth from Space: Shetland Islands,” ESA Applications, 5 November 2021, URL: https://www.esa.int/Applications/Observing_the_Earth/Copernicus/Earth_from_Space_Shetland_Islands
9) ”Earth from Space: Glasgow,” ESA Applications, 29 October 2021, URL: https://www.esa.int/Applications/Observing_the_Earth/Copernicus/Earth_from_Space_Glasgow
10) ”Perth, Australia,” ESA Applications, 22 October 2021, URL: https://www.esa.int/Applications/Observing_the_Earth/Copernicus/Earth_from_Space_Perth_Australia
11) ”Earth from Space: New Delhi,” ESA Applications, 15 October 2021, URL: https://www.esa.int/Applications/Observing_the_Earth/Copernicus/Earth_from_Space_New_Delhi
12) ”La Palma volcano: How satellites help us monitor eruptions,” ESA Applications, 11 October 2021, URL: https://www.esa.int/Applications/Observing_the_Earth/Copernicus/La_Palma_volcano_How_satellites_help_us_monitor_eruptions
13) ”Earth from Space: Budapest, Hungary,” ESA Applications, 08 October 2021, URL: https://www.esa.int/Applications/Observing_the_Earth/Copernicus/Earth_from_Space_Budapest_Hungary
14) ”La Palma lava flows into the sea,” ESA Applications, 01 October 2021, URL: https://www.esa.int/ESA_Multimedia/Images/2021/10/La_Palma_lava_flows_into_the_sea
15) ”Earth from Space: Calabria, Italy,” ESA Applications, 24 September 2021, URL: https://www.esa.int/Applications/Observing_the_Earth/Copernicus/Earth_from_Space_Calabria_Italy
16) ”The Cumbre Vieja volcano on La Palma,” ESA Applications, 22 September 2021, URL: https://www.esa.int/About_Us/Week_in_images/Week_in_images_20_-_24_September_2021
17) ”Earth from Space: Maharloo Lake,” ESA Applications, 17 September 2021, URL: https://www.esa.int/Applications/Observing_the_Earth/Copernicus/Earth_from_Space_Maharloo_Lake
18) ”California continues to burn,” ESA Applications, 15 September 2021, URL: https://www.esa.int/Applications/Observing_the_Earth/California_continues_to_burn
19) ”Danube Delta,” ESA Applications, 10 September 2021, URL: https://www.esa.int/About_Us/Week_in_images/Week_in_images_6_-_10_September_2021
20) ”Vilia wildfires,” ESA Applications, 18 August 2021, URL: https://www.esa.int/About_Us/Week_in_images/Week_in_images_16_-_20_August_2021
21) ”Wildfires ravage Greek island of Evia,” ESA Applications, 12 August 2021, URL: https://www.esa.int/ESA_Multimedia/Images/2021/08/Wildfires_ravage_Greek_island_of_Evia
22) ”Malé, the Maldives,” ESA Applications, 30 July 2021, URL: https://www.esa.int/Applications/Observing_the_Earth/Earth_from_Space_Male_the_Maldives2
23) ”Earth from Space: Tarso Toussidé, Chad,” ESA Applications, 23 July 2021, URL: https://www.esa.int/Applications/Observing_the_Earth/Earth_from_Space_Tarso_Tousside_Chad
24) ”Earth from Space: Lima, Peru,” ESA Applications, 16 July 2021, URL: https://www.esa.int/Applications/Observing_the_Earth/Earth_from_Space_Lima_Peru
25) ”Earth from Space: Gulf of Martaban,” ESA Applications, 9 July 2021, URL: https://www.esa.int/Applications/Observing_the_Earth/Earth_from_Space_Gulf_of_Martaban
26) ”Earth from Space: North Frisian Islands,” ESA Applications, 02 July 2021, URL: https://www.esa.int/Applications/Observing_the_Earth/Earth_from_Space_North_Frisian_Islands
27) ”Shoemaker Crater, Australia,” ESA Applications, 30 June 2021, URL: https://www.esa.int/ESA_Multimedia/Images/2021/06/Shoemaker_Crater_Australia
28) ”California drought,” ESA Applications, 18 June 2021, URL: https://www.esa.int/About_Us/Week_in_images/Week_in_images_14_-_18_June_2021
29) ”Earth from Space: Tana River,” ESA Applications, 18 June 2021, URL: https://www.esa.int/Applications/Observing_the_Earth/Earth_from_Space_Tana_River
30) ”Satellites reveal cause of Chamoli disaster,” ESA Applications, 14 June 2021, URL: https://www.esa.int/Applications/Observing_the_Earth/Satellites_reveal_cause_of_Chamoli_disaster
31) D. H. Shugar, M. Jacquemart, D. Shean, S. Bhushan, K. Upadhyay, A. Sattar, W. Schwanghart, S. McBride, M. Van Wyk de Vries, M. Mergili, A. Emmer, C. Deschamps-Berger, M. McDonnell, R. Bhambri, S. Allen, E. Berthier, J. L. Carrivick, J. J. Clague, M. Dokukin, S. A. Dunning, H. Frey, S. Gascoin, U. K. Haritashya, C. Huggel, A. Kääb, J. S. Kargel, J. L. Kavanaugh, P. Lacroix, D. Petley, S. Rupper, M. F. Azam, S. J. Cook, A. P. Dimri, M. Eriksson, D. Farinotti, J. Fiddes, K. R. Gnyawali, S. Harrison, M. Jha, M. Koppes, A. Kumar, S. Leinss, U. Majeed, S. Mal, A. Muhuri, J. Noetzli, F. Paul, I. Rashid, K. Sain, J. Steiner, F. Ugalde, C. S. Watson, M. J. Westoby, ”A massive rock and ice avalanche caused the 2021 disaster at Chamoli, Indian Himalaya,” Science, Published: 10 June 2021, eabh4455, https://science.sciencemag.org/content/early/2021/06/09/science.abh4455.full
32) ” Earth from Space: Chongqing, China,” ESA Applications, 11 June 2021, URL: https://www.esa.int/Applications/Observing_the_Earth/Earth_from_Space_Chongqing_China
33) ”Earth from Space: Warsaw, Poland,” ESA Applications, Observing the Earth, 04 June 2021, URL: https://www.esa.int/Applications/Observing_the_Earth/Earth_from_Space_Warsaw_Poland
34) ”Earth from Space: Los Cabos, Mexico,” ESA Applications, 21 May 2021, URL: https://www.esa.int/Applications/Observing_the_Earth/Earth_from_Space_Los_Cabos_Mexico
35) ”Monitoring coastal changes in Greece,” ESA Applications, 18 May 2021, URL: https://www.esa.int/Applications/Observing_the_Earth/Space_for_our_climate/Monitoring_coastal_changes_in_Greece
36) ”Earth from Space: Qeshm Island,” ESA Applications, 14 May 2021, URL: https://www.esa.int/Applications/Observing_the_Earth/Earth_from_Space_Qeshm_Island
37) ”Earth from Space: Morbihan, France,” ESA Applications, 07 May 2021, URL: https://www.esa.int/Applications/Observing_the_Earth/Earth_from_Space_Morbihan_France
38) ”Earth from Space: Antofagasta, Chile,” ESA Application, 30 April 2021, URL: https://www.esa.int/Applications/Observing_the_Earth/Earth_from_Space_Antofagasta_Chile
39) ”Glacier avalanches more common than thought,” ESA Applications, 30 April 2021, URL: https://www.esa.int/Applications/Observing_the_Earth/Glacier_avalanches_more_common_than_thought
40) Andreas Kääb, Mylène Jacquemart, Adrien Gilbert, Silvan Leinss, Luc Girod, Christian Huggel, Daniel Falaschi, Felipe Ugalde, Dmitry Petrakov, Sergey Chernomorets, Mikhail Dokukin, Frank Paul, Simon Gascoin, Etienne Berthier, and Jeffrey S. Kargel, ”Sudden large-volume detachments of low-angle mountain glaciers – more frequent than thought?,” The Cryosphere, Volume 15, pp: 1751–1785, 2021, Published: 12 April 2021, https://doi.org/10.5194/tc-15-1751-2021, URL: https://tc.copernicus.org/articles/15/1751/2021/tc-15-1751-2021.pdf
41) ”Earth from Space: Laizhou Bay,” ESA Applications, 23 April 2021, URL: https://www.esa.int/Applications/Observing_the_Earth/Earth_from_Space_Laizhou_Bay
42) ”La Soufrière volcano: before-and-after,” ESA Applications, 16 April 2021, URL: https://www.esa.int/ESA_Multimedia/Images/2021/04/La_Soufriere_volcano_before-and-after
43) ”Earth from Space: Space Coast, Florida,” ESA Applications, 16 April 2021, URL: https://www.esa.int/Applications/Observing_the_Earth/Earth_from_Space_Space_Coast_Florida
44) ”Earth from Space: Bucharest, Romania,” ESA Applications, 09 April 2021, URL: https://www.esa.int/Applications/Observing_the_Earth/Earth_from_Space_Bucharest_Romania
45) ”Satellites monitor Mount Etna’s unpredictable behaviour,” ESA Applications, 08 April 2021, URL: https://www.esa.int/Applications/Observing_the_Earth/Satellites_monitor_Mount_Etna_s_unpredictable_behaviour
46) ”Measuring shoreline retreat,” ESA Applications, 29 March 2021, URL: https://www.esa.int/Applications/Observing_the_Earth/Space_for_our_climate/Measuring_shoreline_retreat
47) ”Earth from Space: Gariep Dam, South Africa,” ESA Applications, 26 March, 2021, URL: https://www.esa.int/Applications/Observing_the_Earth/Earth_from_Space_Gariep_Dam_South_Africa
48) ”How ESA helps South Africa share water fairly,” ESA / Applications / Telecommunications & Integrated Applications, 22 March 2021, URL: https://www.esa.int/Applications/Telecommunications_Integrated_Applications/How_ESA_helps_South_Africa_share_water_fairly
49) ”Earth from Space: Amazon rainforest,” ESA Applications, 19 March 2021, URL: https://www.esa.int/Applications/Observing_the_Earth/Earth_from_Space_Amazon_rainforest
50) ”Earth from Space: Strait of Gibraltar,” ESA Applications, 12 March 2021, URL: https://www.esa.int/Applications/Observing_the_Earth/Earth_from_Space_Strait_of_Gibraltar
51) ”Earth from Space: Galápagos Islands,” ESA Applications, 5 March 2021, URL: https://www.esa.int/Applications/Observing_the_Earth/Earth_from_Space_Galapagos_Islands2
52) ”Earth from Space: Vancouver,” ESA Applications, 26 February 2021, URL: https://www.esa.int/Applications/Observing_the_Earth/Earth_from_Space_Vancouver
53) ”Etna erupts,” ESA Applications, 19 February 2021, URL: https://www.esa.int/ESA_Multimedia/Images/2021/02/Etna_erupts
54) ”Earth from Space: Lusaka, Zambia,” ESA Applications, 19 February 2021, URL: https://www.esa.int/Applications/Observing_the_Earth/Earth_from_Space_Lusaka_Zambia
55) ”Earth from Space: Valentine Island,” ESA Applications, 12 February 2021, URL: https://www.esa.int/Applications/Observing_the_Earth/Earth_from_Space_Valentine_Island
56) ”Earth from Space: Japan in bloom,” ESA Applications, 5 February 2021, URL: https://www.esa.int/Applications/Observing_the_Earth/Earth_from_Space_Japan_in_bloom
57) ”Lake Titicaca,” ESA Applications, 29 January, 2021, URL: https://www.esa.int/Applications/Observing_the_Earth/Earth_from_Space_Lake_Titicaca
58) ”Sardinia, Italy,” ESA Applications, 22 January 2021, URL: https://www.esa.int/ESA_Multimedia/Images/2021/01/Sardinia_Italy
59) ”Tanezrouft Basin,” ESA Applications, 15 January 2021, URL: https://www.esa.int/ESA_Multimedia/Images/2021/01/Tanezrouft_Basin
60) ”Madrid snowbound,” ESA Applications, 12 January 2021, URL: https://www.esa.int/ESA_Multimedia/Images/2021/01/Madrid_snowbound
The information compiled and edited in this article was provided by Herbert J. Kramer from his documentation of: ”Observation of the Earth and Its Environment: Survey of Missions and Sensors” (Springer Verlag) as well as many other sources after the publication of the 4th edition in 2002. - Comments and corrections to this article are always welcome for further updates (herb.kramer@gmx.net).
References Back to top