AEM-2 (Applications Explorer Mission-2)
EO
Atmosphere
Cloud type, amount and cloud top temperature
Atmospheric Temperature Fields
Quick facts
Overview
| Mission type | EO |
| Agency | NASA |
| Mission status | Mission complete |
| Launch date | 18 Feb 1979 |
| End of life date | 19 Nov 1981 |
| Measurement domain | Atmosphere |
| Measurement category | Cloud type, amount and cloud top temperature, Atmospheric Temperature Fields, Aerosols, Atmospheric Humidity Fields, Ozone, Trace gases (excluding ozone) |
| Measurement detailed | Cloud top height, Aerosol absorption optical depth (column/profile), Aerosol Extinction / Backscatter (column/profile), Atmospheric specific humidity (column/profile), O3 Mole Fraction, Atmospheric temperature (column/profile), NO2 Mole Fraction, BrO (column/profile) |
| Instruments | SAGE I |
| Instrument type | Atmospheric chemistry |
| CEOS EO Handbook | See AEM-2 (Applications Explorer Mission-2) summary |
AEM-2 (Applications Explorer Mission-2)
AEM-2 was a NASA/LaRC mission (also referred to as `SAGE', `Explorer 60' or AEM-B) with the objective to monitor stratospheric aerosol and ozone and its influence on the climate (study of aerosol sources and sinks, aerosol transport, aerosol radiative and climatological implications, etc.). 1)
Application: stratospheric chemistry related to aerosol, ozone, and nitrogen dioxide. Provision of almost global profiles by solar occultation techniques.
Spacecraft
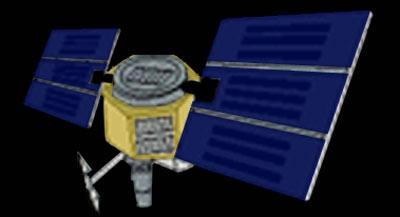
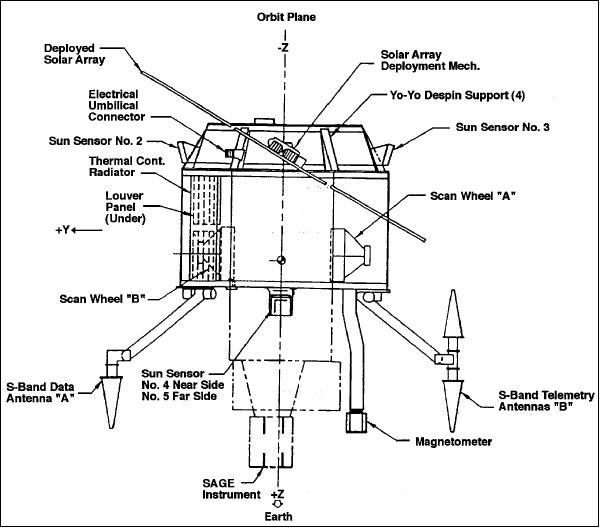
The small low-cost AEM-2 minisatellite was developed and built at the Boeing Aerospace Company consisting of two distinct modules: the spacecraft base module and the instrument module. The base module is a small, hexagonal prism containing power, command, communications, data handling and attitude control subsystems to support the instrument module. The base module includes a PCM (Pulse-Code Modulation) telemetry data system and a communications subsystem that makes use of a conical log spiral S-band antenna and two VHF antennas.
The base module is spin-stabilized, with three-axis stabilization provided by an active reaction wheel and a magnetic torquing system (the attitude determination hardware consists of five Adcole two-axis DSS, two Hughes HS scanners, and a TAM). The required attitude determination accuracies are: roll 0.7º, pitch 0.5º, and yaw 2.0º in operational mode. A hydrazine orbit adjust system provides the capability to minimize orbit variations to assure adequate mapping by the on-board instrument. 2)
The spacecraft had a launch mass of 147 kg. The base module (six-sided prism) had a height of 65 cm. The overall height of the spacecraft, including antenna, was 1.62 m. Power was provided by two solar paddels and batteries.

Launch
Feb 18, 1979 using a Scout D vehicle (LV configuration) from Wallops Island, VA, USA.
Orbit: Near-circular non-synchronous orbit, perigee = 548 km, apogee = 660 km, inclination = 55º, period = 96.8 minutes.
Mission Status
• The spacecraft experienced power problems after May 15, 1979. However, the spacecraft operations continued until November 19, 1981 (providing a data set of ~ 2 1/2 years). The signal from the spacecraft was last received on January 7, 1982, when the battery failed. On April 11, 1989, the spacecraft decayed in the atmosphere.
• SAGE detected and tracked also five volcanic eruption plumes that penetrated the stratosphere. It determined the amount of new material each volcano added to the stratosphere. (Mount St. Helens, for example, contributed about 0.5 x 10⁶ metric tons for a 100% enhancement in background stratospheric aerosol mass).
Sensor Complement
SAGE-I (Stratospheric Aerosol and Gas Experiment)
The scientific objective of SAGE-I was to develop a global stratospheric aerosol, ozone, and nitrogen dioxide data base that could be used for the investigation of the spatial and temporal variations of these species caused by seasonal and short-term meteorological variations, atmospheric chemistry and microphysics, and transient phenomena such as volcanic eruptions. The data base could also be used for the study of trends, atmospheric dynamics and transport, and potential climatic effects. 3) 4)
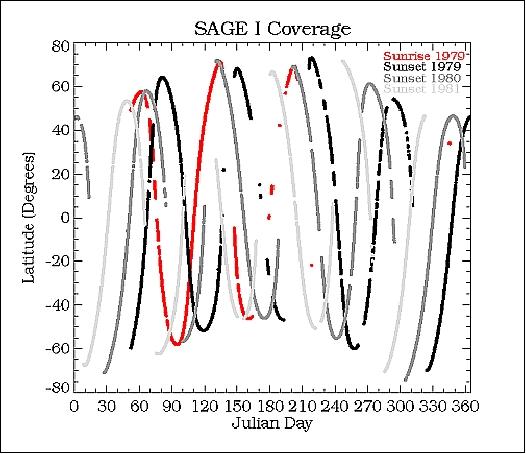
The instrument is a four-channel sun photometer [of SAM (on Apollo-Soyuz) and SAM-II (on Nimbus-7) heritage] built by the Ball Aerospace Systems Division of Boulder, CO. Note: A photometer is usually a broadband instrument capable of measuring the thermal continuum radiation (i.e. flux) thereby permitting the study of energy balance and surface composition (also detection of infrared roughness of surface features). Objective: measurement of solar intensity profiles during each sunrise and sunset event (about 30 sampling opportunities per day, sunrise + sunset). The SAGE-1 instrument boresights were pointing toward the horizon during observations.
The SAGE-I payload consists of a separate structure (instrument module) upon which the SAGE instrument is mounted and a spacecraft base module. The SAGE instrument is a radiometer (mass = 18 kg) consisting of a Gregorian telescope and a detector subassembly measuring the attenuation of solar radiation at four wavelengths centered at 0.385, 0.45, 0.6, and 1.0 µm during solar occultation.
The sensor scanned the atmosphere from the horizon up, and measured the attenuation of solar radiation at different atmospheric layers as the S/C emerged from the Earth's shadow. This procedure was repeated during S/C sunset. Two vertical scannings were obtained during each orbit, with each scan requiring approximately 1 minute to cover the atmosphere above the troposphere. The instrument FOV was about 0.15 mrad, resulting in a vertical resolution of about 1 km.
The aerosol profiles can be interpreted to give concentrations of ozone, nitrogen dioxide, and total molecular density.
The operation of the instrument, during each sunrise and sunset measurement, was totally automatic. Prior to each sunrise or sunset, the instrument was rotated in azimuth to its predicted solar acquisition position. When the Sun entered the instrument's field of view, the instrument adjusted its azimuth position to lock onto the radiometric center of the Sun to within ±45 arcsec and then acquired the sun by rotating its scan mirror to the proper elevation angle. As the sun traversed between the horizon and the tangent height of 150 km, radiometric channel data were sampled at a rate of 64 samples/s per channel, digitized to 12 bit resolution, and recorded for later transmission back to Earth.

Ground truth: A number of ground truth measurements in the US, Japan, Europe, and Nimbus-7 data are an integral part of the SAGE mission. - The SAGE-1 aerosol data were validated by comparison with correlative lidar and dustsonde in situ measurements, the ozone data were validated by comparison with balloon ECC ozonesonde and rocket measurements, and the nitrogen dioxide measurements were compared with climatology.
Data: The instrument data include vertical profiles of stratospheric aerosol, ozone, and nitrogen dioxide. The SAGE-I aerosol data were validated by comparison with correlative lidar and dustsonde in situ measurements, the ozone data were validated by comparison with balloon electrochemical cell ozonesonde and sounding rocket measurements, the nitrogen dioxide measurements were compared with climatology data. All data are archived at NSSDC (National Space Science Data Center) at GSFC. 6) 7)

References
1) M. P. McCormick, P. Hamill, T. J. Pepin, W. P. Chu, T. J. Swissler, L. R. McMaster, “Satellite Studies of the Stratospheric Aerosol,” Bulletin of the American Meteorological Society, Vol. 60, No. 9, September 1979, pp. 1038-1046, URL: http://journals.ametsoc.org/doi/pdf/10.1175/1520-0477%281979%29060%3C1038%3ASSOTSA%3E2.0.CO%3B2
2) http://library01.gsfc.nasa.gov/gdprojs/projinfo/sage.pdf
3) William P. Chu, M. Patrick McCormick, “Inversion of Stratospheric Aerosol and Gaseous Constituents From Spacecraft Solar Extinction Data in the 0.38-1.0 micrometer Wavelength Region,” Applied Optics, Vol. 18, No. 9,, pp. 1404-1413.
4) http://badc.nerc.ac.uk/data/gedex/detail/aem2sag1.det
5) http://history.nasa.gov/SP-4012/vol6/vol_vi_ch_2.pdf
6) L. R. McMaster, M. W. Rowland, “SAGE-I Data User's Guide,” NASA Reference Publication 1275, Aug. 1992 , URL: http://citeseerx.ist.psu.edu/viewdoc/download?doi=10.1.1.80.3395&rep=rep1&type=pdf
7) “Stratospheric Aerosol and Gas Experiment I (SAGE I) Langley DAAC Project/Campaign Document,” URL: http://eosweb.larc.nasa.gov/GUIDE/campaign_documents/sage1_project.html/#overview
The information compiled and edited in this article was provided by Herbert J. Kramer from his documentation of: ”Observation of the Earth and Its Environment: Survey of Missions and Sensors” (Springer Verlag) as well as many other sources after the publication of the 4th edition in 2002. - Comments and corrections to this article are always welcome for further updates (eoportal@symbios.space).