EO
ESA
Ocean
Multi-purpose imagery (ocean)
Sentinel-1 is a constellation of two imaging radar satellites operated by ESA, operating in the C-band. Sentinel-1A remains operational, while Sentinel-1B reached the end of its life in August 2022. Sentinel-1C launched in December 2024 to replace 1B.
Quick facts
Overview
| Mission type | EO |
| Agency | ESA, COM |
| Mission status | Operational (extended) |
| Launch date | 03 Apr 2014 |
| Measurement domain | Ocean, Land, Snow & Ice |
| Measurement category | Multi-purpose imagery (ocean), Multi-purpose imagery (land), Vegetation, Landscape topography, Ocean topography/currents, Sea ice cover, edge and thickness, Soil moisture, Snow cover, edge and depth, Ocean surface winds, Ocean wave height and spectrum |
| Measurement detailed | Ocean imagery and water leaving spectral radiance, Land surface imagery, Vegetation type, Ocean surface currents (vector), Land surface topography, Wind vector over sea surface (horizontal), Sea-ice cover, Snow cover, Soil moisture at the surface, Wind speed over sea surface (horizontal), Iceberg fractional cover, Significant wave height, Bathymetry, Dominant wave direction, Sea-ice type, Dominant wave period, Above Ground Biomass (AGB), Automatic Identification System (AIS) vessel data |
| Instruments | AIS, C-Band SAR |
| Instrument type | Data collection, Imaging microwave radars |
Related Resources

Summary
Mission Capabilities
The Sentinel-1 satellites are identical and carry the C-SAR (C-band Synthetic Aperture Radar) onboard. This instrument is composed of the SAR Electronics Subsystem (SES) in charge of radar command and data handling, and the SAR Antenna Subsystem (SAS) in charge of signal radiation and reception. The C-SAR has four observation modes each with a different swath and resolution to suit their purpose: Stripmap (SM), Interferometric Wide swath (IW), Extra Wide swath (EW), and Wave (WV) mode.
The satellites are used for the monitoring of sea and land ice, surveillance of oil spills and ships, monitoring of marine wind and waves, monitoring of land surface motion risks, and the mapping of forest, water, and soil management. SM mode is designed to support ERS (European Remote Sensing) and Envisat missions; IW mode is the default mode over land; EW mode is designed for maritime, ice, and polar zone observation services where wide coverage and short revisit times are demanded; and WV mode is the default mode over the open ocean.
Performance Specifications
SM mode has an 80 km swath and 5 m spatial resolution; IW mode has a 250 km swath and a 5 m x 20 m resolution; EW mode has a 400 km swath and a 25 m x 100 m resolution, and WV mode takes 20 m x 20 m images at 100 km intervals with a resolution of 5 m x 20 m. The C-SAR has a centre frequency of 5.405 GHz.
The two satellites follow the same sun-synchronous orbit with an inclination of 98.2° but are 180° out of phase. The satellites are situated at an altitude of 693 km and have a period of 98.7 minutes.
Space and Hardware Components
The PRIMA (Piattaforma Italiana Multi Applicativa) bus consists of the propulsion module (PPM) which carries all propulsion equipment, the service module (SVM) which carries all other necessary equipment to stay operational, and the payload module (PLM) which contains the C-SAR and other secondary payloads. SVM contains a variety of subsystems that control the thermal environment, power generation and storage, orbit path, and payload data handling and transmission (PDHT). The PDHT subsystem has a storage capacity of 1410 Gbit and a 520 Mbit/s X-band downlink capacity.
In December 2021, Sentinel-1B experienced an anomaly related to the instrument electronics power supply provided by the satellite platform, leaving it unable to deliver radar data. The mission was replaced by Sentinel-1C, which launched in December 2024.
Copernicus: Sentinel-1 — The SAR Imaging Constellation for Land and Ocean Services
The Sentinel-1 mission is the European Radar Observatory for the Copernicus joint initiative of the European Commission (EC) and the European Space Agency (ESA). Copernicus is a European initiative for the implementation of information services dealing with environment and security. It is based on observation data received from Earth Observation satellites and ground-based information.
The Sentinel-1 mission comprises a constellation of two sun-synchronous polar-orbiting satellites, sharing the same orbital plane with 180° orbital phasing difference, operating day and night performing C-band synthetic aperture radar imaging, enabling them to acquire imagery regardless of the weather. It operates in four exclusive imaging modes with different resolution (down to 5 m) and coverage (up to 400 km). It provides dual polarisation capability, very short revisit times and rapid product delivery. 1)
The Sentinel-1 mission represents a completely new approach to SAR mission design by ESA in direct response to the operational needs for SAR data expressed under the EU-ESA Copernicus program. The mission ensures the continuity of C-band SAR data to applications and builds on ESA's heritage and experience with the ERS and Envisat SAR instruments, notably in maintaining key instrument characteristics such as stability and accurate well-calibrated data products.
The key mission parameters are:
- revisit time,
- coverage,
- timeliness combined with frequency band,
- polarization,
- resolution and other image quality parameters.
Short revisit time demands an appropriate orbit selection and large swath widths.
The baseline mission is a two-satellite constellation, with four nominal operational modes on each spacecraft designed for maximum compliance with user requirements. 5) 6) 7) 8) 9) 10)
• Orbit: Sun-synchronous near-polar orbit, repeat cycle of 12 days, cycle length of 175 days. With both satellites operating, the repeat cycle is six days.
• Aquisition modes:
- Stripmap mode (SM): 80 km swath, 5 m x 5 m resolution (single look)
- Interferometric Wide Swath mode (IWS): 250 km swath, 5 m x 20 m resolution (single look)
- Extra Wide Swath mode (EWS): 400 km swath, 20 m x 40 m resolution (single look)
- Wave mode (WM): 20 km x 20 km vignettes, 20 m x 5 m resolution, aquired every 100 km along the orbit
• Polarization: SM, IW and EW products are available in single (HH or VV) or dual polarisation (HH+HV or VV+VH). WV is single polarisation only (HH or VV).
• Operations:
- Consistent, reliable and conflict-free mission operations
- Near real-time delivery of data within 3 hours (worst case) with 1 hour as the goal
- Data delivery from the archive within 24 hours
• Sensitivity: NESZ (Noise Equivalent Sigma Zero), σo = -22 dB
• Radiometry:
- Stability = 0.5 dB
- Accuracy = 1.0 dB
• Ambiguity ratio: DTAR (Distributed Target Ambiguity Ratio) = -25 dB
In April 2007, ESA selected TAS-I (Thales Alenia Space Italia) as prime contractor for the Sentinel-1 spacecraft (overall satellite design & integration at system and subsystem level, including the design of the SAR antenna's transmit/receive modules). ESA awarded the contract to TAS-I on June 18, 2007 at the Paris International Air Show. EADS Astrium GmbH of Friedrichshafen, was in turn awarded a contract by TAS-I to build the radar imaging payload for Sentinel-1, including the central radar electronics subsystem developed by Astrium UK. The objective of Sentinel-1 is to assure C-band SAR data continuity for the user community currently provided by Envisat and ERS-2. 11)
Three priorities (fast-track services) for the mission have been identified by user consultation working groups of the European Union: Marine Core Services, Land Monitoring and Emergency Services. These cover applications such as: 12)
• Monitoring sea ice zones and the arctic environment
• Surveillance of marine environment
• Monitoring land surface motion risks
• Mapping of land surfaces: forest, water and soil, agriculture
• Mapping in support of humanitarian aid in crisis situations.
Unlike its more experimental predecessors ERS-1, ERS-2 and Envisat that supply data on a best effort basis, operational satellites like Sentinel-1 are required to satisfy user requirements and to supply information reliably with the data provider accepting legal responsibility for the delivery of information.
In March 2010, ESA and TAS-I signed a contract to build the second Sentinel-1 (Sentinel-1B) and Sentinel-3 (Sentinel-3B) satellites, marking another significant step in the Copernicus program. 13)
As part of the Copernicus space component, the Sentinel-1 mission is implemented through a constellation of two satellites (A and B units) each carrying an imaging C-band SAR instrument (5.405 GHz) providing data continuity of ERS and Envisat SAR types of mission. Each Sentinel-1 satellite is designed for an operations lifetime of 7 years with consumables for 12 years. The Sentinel-1 satellites will fly in a near polar, sun-synchronized (dawn-dusk) orbit at 693 km altitude. 14)
The Sentinel-1 mission is specifically designed to acquire systematically and provide routinely data and information products to Copernicus Ocean, Land and Emergency as well as to national user services. These services focus on operational applications such as the observation of the marine environment, including oil spill detection and Arctic/Antarctic sea-ice monitoring, the surveillance of maritime transport zones (e.g. European and North Atlantic zones), as well as the mapping of land surfaces including vegetation cover (e.g. forest), and mapping in support of crisis situations such as natural disasters (e.g. flooding and earthquakes) and humanitarian aid.
In addition, the 12-day repeat orbit cycle of each Sentinel-1 satellite along with small orbital baselines will enable SAR interferometry (InSAR) coherent change detection applications such as the monitoring of surface deformations (e.g. subsidence due to permafrost melt) and cryosphere dynamics (e.g. glacier flow).
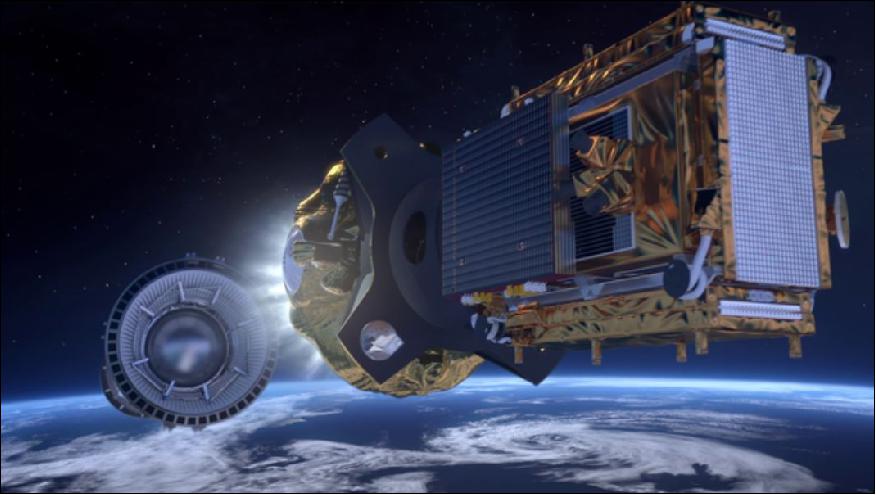
Figure 1: Artist's view of the deployed Sentinel-1 spacecraft (image credit: ESA, TAS-I)
Spacecraft
The spacecraft is based on the PRIMA (Piattaforma Italiana Multi Applicativa) bus of TAS-I, of COSMO-SkyMed and RADARSAT-2 heritage, with a mission-specific payload module. Attitude stabilization: 3-axis, attitude accuracy = 0.01º (each axis), orbital knowledge = 10 m (each axis, 3σ using GPS).
The spacecraft structure provides the accommodation for all platform and payload units. A box type structure has been adopted using external aluminum sandwich material, with a central structure in CFRP (Carbon Fiber Reinforced Plastic). A modular approach has been taken whereby the payload is mounted to a dedicated part of the structure, allowing separate integration & test of the payload before integration to the main part of the structure carrying the platform units. This has many advantages for the overall AIT (Assembly, Integration and Test) process. 15) 16) 17) 18) 19) 20)
The PRIMA platform comprises three main modules, which are structurally and functionally decoupled to allow for a parallel module integration and testing up to the satellite final integration. The modules are: 21)
1) SVM (Service Module), carrying all the bus units apart from the propulsion ones
2) PPM (Propulsion Module), carrying all the propulsion items connected by tubing and connectors
3) PLM (Payload Module), carrying all the payload equipment including the SAR Instrument antenna.
Figure 2: 3D exploded view of the Sentinel-1 platform (image credit: TAS-I)
TCS (Thermal Control Subsystem): The TCS provides control of the thermal characteristics and environment of the Satellite units throughout all phases of the mission. In general the TCS is passive, with the control provided using standard techniques such as heat pipes, radiators and MLI (Multi-Layered Insulation). Survival heaters are provided to prevent units becoming too cold during non-operative phases.
EPS (Electric Power Subsystem): The EPS uses two solar array wings for power generation. Each wing consists of 5 sandwich panels using GaAs triple junction solar cells. The average onboard power is 4.8 kW (EOL), the Li-ion battery has a capacity of 324 Ah. The PCDU (Power Control and Distribution Unit) is designed to provide adequate grounding, bonding & protection for the overall electrical system (e.g. by use of fuses) and must also be integrated into the satellite FDIR concept to ensure that adequate power resources and management are available in the event of on-board failures. Li-Ion battery technology has been selected for the batteries because of the large benefits offered in terms of mass and energy efficiency.
The spacecraft dimensions in stowed configuration are: 3.4 m x 1.3 m x 1.3 m. The Sentinel-1 spacecraft has a launch mass of ~2,200 kg, the design life is 7.25 years (consumables for up to 12 years). 22) 23)
Since the B2 Phase of Sentinel-1, a commonality approach with Sentinel-2 and Sentinel-3 was introduced and deeply investigated, to optimize and minimize as much as possible new developments, HW procurement and operations costs. Besides the differences among payload instruments and their relative required performances, each of these three satellites have its orbital parameters, as well its specific requirements. 24) 25)
Parameter | Sentinel-1 | Sentinel-2 | Sentinel-3 |
Launch date | April 03, 2014 of S1-A | June 23, 2015 of S2-A | 2016 of S3-A |
Orbit type | SSO (Sun-synchronous Orbit) 12 day repeat cycle LTAN = 18:00 hours | SSO 10 day repeat cycle LTDN = 10:30 hours | SSO 27 day repeat cycle LTDN = 10:00 hours |
Orbital altitude | 693 km | 786 km | 814.5 km |
Sensor complement | C-SAR (C-band Synthetic Aperture Radar) | MSI (Multi Spectral Instrument) | SRAL (Sentinel-3 Radar Altimeter) MWR (MicroWave Radiometer) OLCI (Ocean and Land Color Instrument) SLSTR (Sea and Land Surface Temperature Radiometer) |
Spacecraft mass Spacecraft size Spacecraft power | 2300 kg 3.4 m x 1.3 m x 1.3 m 4.8 kW (EOL) | 1140 kg 3.0 m x 1.7 m x 2.2 m 1.7 kW (EOL) | 1250 kg 3.9 m x 2.2 m x 2.2 m 2.05 kW (EOL) |
Downlink X-band data rate | 520 Mbit/s | 520 Mbit/s | 520 Mbit/s |
TT&C S-band | 64 kbit/s uplink 128 kbit/s or 2 Mbit/s downlink | 64 kbit/s uplink 128 kbit/s or 2 Mbit/s downlink | 64 kbit/s uplink 128 kbit/s or 2 Mbit/s downlink |
Science data storage | 1.4 Tbit (EOL) | 2 Tbit (EOL) | 300 Gbit (EOL) |
Required data quality | BER (Bit Error Rate): < 10-9 | FER (Frame Error Rate): < 10-8 | FER (Frame Error Rate): < 10-7 |
Operational autonomy | 8 days | 14 days | 27 days |
Prime contractor | TAS-I (Thales Alenia Space-Italy) | EADS Astrium GmbH, Germany | TAS-F (Thales Alenia Space-France) |
Baseline launcher | Soyuz (Kourou) | Vega (Kourou) | Rockot vehicle of Eurockot Launch Services |
Table 1: List of some Sentinel-1, -2, -3 characteristics and key requirements impacting on end-to-end performance 26)
The Sentinel-1 spacecraft design is characterized by a single C-band SAR (Synthetic Aperture Radar) instrument with selectable dual polarization, a deployable solar array, large on-board science data storage, a very high X-band downlink rate, and stringent requirements on attitude accuracy and data-take timing. In addition, the spacecraft will embark the LCT (Laser Communication Terminal) unit allowing downlink of recorded data via the EDRS (European Data Relay Satellite). 27) 28)
Spacecraft stabilization | 3-axis stabilized |
Attitude accuracy, knowledge | ≤ 0.01º for each axis, < 0.003º for each axis |
Nominal flight attitude, attitude profile | Right side looking geometry, geocentric and geodetic |
Orbit knowledge | 10 m (each axis, 3 sigma) using GPS (dual frequency receiver) |
Operative autonomy of spacecraft | 96 hours |
Spacecraft availability | 0.998 |
Spacecraft structure | Box of aluminum sandwich panels + CFRP central structure |
Spacecraft body dimensions | 3.4 m x 1.3 m x 1.3 m |
Spacecraft envelope dimensions | 3.9 m x 2.6 m x 2.5 m |
Spacecraft launch mass | 2157 kg (inclusive 154 kg of monopropellant fuel) |
Spacecraft design life | 7.25 years (consumables for 12 years) |
EPS (Electric Power Subsystem) | 4800 W average (End-of-Life), GaAs triple junction solar cells, 2 solar array wings, each wing of 5 sandwich panels |
Battery (for eclipse operation) Battery assembly mass | Li-ion technology, capacity = 324 Ah, max discharge power ≥ 1950 W ≤ 130 kg |
Onboard science data storage capacity | 1410 Gbit (End-of-Life) |
S-band TT&C data rates | 4 kbit/s TC (telecommand); 16/128/512 kbit/s TM (programmable) |
X-band science data telemetry rate | 600 Mbit/s |
Propulsion subsystem (orbit maintenance) | Monopropellant hydrazine system, 14 thrusters, 6 (orbit control)+8 (attitude) |
Thermal control | Mainly passive, standard techniques |
AVS (Avionics Subsystem): The AVS performs both Data Handling & Attitude/Orbit Control functions. This is realized through the concept of an integrated control system that performs the control of the platform and payload. The AVS performs all data management & storage functions for the satellite, including TM/TC reception and generation, subsystem & unit monitoring, autonomous switching actions and synchronization. The AVS includes the AOCS processing and the interfaces to the AOCS sensors Star trackers, fine sun sensors, and fine gyroscope and actuators, 4 reaction wheels, 3 torque rods, 14 thrusters, 2 solar array drive mechanism. 29)
The AOCS comprises all means to perform transfer- and on-orbit control maneuvers and to control all necessary satellite attitude and antenna pointing states during all mission phases, starting at separation from the launcher until de-orbiting of the satellite at end of life. This includes the attitude steering of the LEO satellite to provide both yaw and roll steering capability.
At present, a dedicated precise orbit predictor is implemented within the AOCS, in addition to making use of the data uploaded to the payload by the GPS constellation. The AOCS (Attitude and Orbit Control Subsystem) can perform some functions autonomously and it is supported by a very reliable FDIR scheme (Ref. 15). Telecommand data will be received from the TT&C subsystem and will be decoded and deformatted in the AVS.
AOCS consists of the following sensors and actuators: fine sun sensors, magnetometers, gyroscopes, star trackers, GPS receivers, magnetic torquers, a reaction wheels assembly and a monopropellant (hydrazine) propulsion system. The propulsion system has 3 pairs of 1 N orbit control thrusters and 4 pairs of reaction control thrusters for attitude correction. Every pair is made up of a prime and a redundant component.
The attitude control thrusters are fired when the spacecraft enters RDM (Rate Damping Mode) after separation, damping any residual rotation left by the launcher upper stage and achieving a spacecraft pitch rotation of -8 times the orbital period. In the subsequent AOCS mode, called SHM (Safe Hold Mode), magnetotorquers and reaction wheels maintain the attitude and reduce the pitch rotation rate to twice the orbital period.
The periodic behavior of the Earth’s magnetic field in a polar orbit and the polarization of the angular momentum with the loading of the reaction wheels allow the magnetotorquers to maintain this pitch rate while aligning the spacecraft –Y axis with the orbit normal, which in a dusk-dawn orbit coincides with the direction to the Sun.
When the appendages deployment commences, the effect of the gravity gradient torque dominates over the magnetic torque, resulting in the alignment of the S/C X axis (appendages axis) with the nadir direction, maintaining thus a pitch rate equal to the orbital period. Upon ground telecommand, a transition into the NPM (Normal Pointing Mode) occurs, where the spacecraft performs a fine attitude control based on the use of reaction wheels in close loop with star trackers, gyroscopes and GPS, and magnetotorquers for wheel unloading (Ref. 20).
Figure 3: Sentinel-1A stowed representation (in RDM and SHM). +X S/C axis points towards the flight direction. S/C Y axis is aligned with the Sun direction. Solar Array –Y illuminated when stowed (image credit: ESA, Ref. 20)
Figure 4: Architecture of the avionics subsystem (image credit: TAS-I)
Figure 5: Spacecraft power generation and distribution (image credit: TAS-I)
PDHT (Payload Data Handling & Transmission) subsystem (Ref. 24):
The commonality process is driving the spacecraft design with the objective to satisfy the needs of three different missions within the same product. This involves several Sentinels subsystems, in particular, TAS-I was selected to coordinate the common design of two assemblies: 30)
• TXA (Telemetry X-band transmission Assembly) 31)
• XBAA (X-Band Antenna Assembly)
The objective of the PDHT subsystem is to provide the services of data acquisition, storage and transmission to the ground in X-band. After having acquired observation data from the DSHA (Data Storage and Handling Assembly), the TXA executes encoding, modulation, up-conversion, amplification and filtering; the X-band signal provided at the TXA output is then transmitted by an isoflux, wide coverage antenna, included in the XBAA.
To summarize, the performance requirements on TXA specification took into account the different needs of the Sentinels, allowing a fully recurrent units approach: beside a specific TXA layout due to accommodation needs, the modulator, TWTA, and RF filter are the same for the three Sentinels.
After the selection of the TXA & XBAA suppliers (TAS-España and TAS-I IUEL respectively), an agreement was reached between ESA and the Sentinel prime contractors on the way to handle the common design and procurement for TXA and XBAA.
Besides strong efforts to manage different needs coming from different missions, the commonality activities performed in the frame of Copernicus Sentinels enable an effective optimization of costs and development time for those subsystems selected for a common design.
To provide flexibility in the downlink operation, the PDHT is designed with two X-band independent links. The PDHT provides an overall input/output throughput of about 1950 Mbit/s, with a payload input data rate of 2 x 640 Mbit/s (multi-polarization acquisition) or 1 x 1280 Mbit/s (single-polarization acquisition) and a transmitted symbol rate of 2 x 112 Msample/s. The data storage capacity is > 1410 Gbit at EOL.
The provided antenna isoflux coverage zone is about ±64º to nadir to allow link establishment with the ground starting from the ground antenna elevation angle of 5º above the horizon.
Figure 6: The PDHT (Payload Data Handling & Transmission) subsystem (image credit: TAS-I)
Legend of Figure 6:
• DSHA (Data Storage & Handling Assembly)
• TXA (Telemetry X-band transmission Assembly)
• XBAA (X-band Antenna Assembly)
Mass memory capacity of SAR data (EOL) | > 1400 Gbit (SD-RAM based cubes) |
Mass memory capacity of HK/GNSS/POD data (EOL) | 32 Gbit |
PDHT overall throughput | 1950 Mbit/s |
Encryption | AES (Advanced Encryption Standard) |
Coding | RS (255,223) |
Information data rate (on each link) | 300 Mbit/s |
Bandwidth (on each link, without baseband shaping) | 280 MHz |
Modulation scheme | O-QPSK |
Frequency carrier | 8180 MHz |
EIRP (on each channel) | > 18.45 dBW |
Antenna gain (at 4.5º w.r.t. boresight) | > 20 dB |
Polarization | RHCP and LHCP |
Antenna pointing mechanism speed | 2º/s |
Maximum power consumption (10% of contingency) | 450 W |
Table 3: Main performance characteristics of the PDHT
The TXA architecture provides two redundant X-band channels with the same output power (16 dBW) and useful data rate (260 Mbit/s). Cold redundancy is implemented at channel level. The main elements of the assembly are:
- X-band modulators, developed by TAS-F, are fully compliant with ECSS and modulation standard
- TWTA (Traveling Wave Tube Amplifiers), provided by TAS-B (ETCA), deliver up to 60 W RF power
- OMUX (Optical Multiplexer), developed by TAS-F, filters and combines both channels and provides out of band rejection.
To achieve good spectral confinement and especially to ensure that the emission levels in the adjacent deep space band (8400 to 8450 MHz) are respected, both baseband filtering with a roll-off of 0.35 (0.35-SRRC) and filtering techniques have been applied. In addition, 6-pole channel band pass filters have been implemented in the OMUX. The 6-pole solution provides two main advantages in front of other less selective solutions, such as 4-pole:
- It filters our more efficiently the regrowth of baseband filtered 8PSK carrier due to the gain nonlinearity of the TWTA, thus allowing for a better overall DC efficiency
- It is compatible with data rates up to 300 Mbit/s per channel by adjusting the frequency plan (increase of frequency spacing between channels).
Figure 7: Architecture of the TXA (image credit: TAS)
Parameter | Performance | Remarks |
Frequency plan | F1 = 8095 MHz, F2 = 8260 MHz |
|
Occupied bandwidth | < 295 -2.1/+1.8 MHz for 112 MS/s | < 130 MHz per channel |
Modulation scheme | 8PSK |
|
Inner coding | TCM 5/6 encoding rate |
|
Downlink useful data rate | 280 Mbit/s per channel at modulator input | 260 Mbit/s channel at RS decoder output |
RF losses | < 1.1 dB | Between TWTA output and TXA output I/F |
RF output power level | > 15.3 dBW per channel | At OMUX output flange |
Transmission technological degradation (at FER <10-7) | < 1.4 dB | Both channels active |
Power consumption, dissipation | < 280 W, < 195 W | Both channels active |
Mass of device | < 24.7 kg | Panel excluded |
PRP (Propulsion Subsystem): The PRP is based on 14 RCTs (Reaction Control Thrusters) located in 4 different sides of the spacecraft, provides the means to make orbit corrections to maintain the requested tight orbit control throughout the mission. Initially, corrections are required to reach the final orbit position after separation from the launcher. During the mission, some infrequent corrections to the orbit are necessary to maintain the requirements upon the relative and absolute positioning of individual satellite. The thrusters located on the –Z side of the satellite are specifically dedicated to attitude control during the safe mode.
Figure 8: Sentinel-1 satellite block diagram (TAS-I, ESA, Ref. 15)
Figure 9: Stowed satellite views (image credit: TAS-I)
RF communications: Onboard source data storage volume of 900 Gbit (EOL). TT&C communications in S-band at 4 kbit/s in uplink and 16, 128, or 512 kbit/s in downlink (programmable). Payload downlink in X-band at a data rate of 2 x 260 Mbit/s.
The Copernicus Sentinel spacecraft are the first ESA Earth Observation spacecraft to implement communications security on the command link. It has been decided to secure the spacecraft from unauthorised command access by adding a security trailer to the command segments which are sent to the spacecraft. The trailer is composed of a Logical Authentication Counter and a Message Authentication Code. The latter is obtained by performing cryptographic encryption of the hash value of the command segment and the Logical Authentication Counter. Only parties in possession of the right key can perform this operation in a way that the command segment is accepted by the spacecraft. The concept applies to all Copernicus Sentinel spacecraft. 32)
Science data compression: Currently, the most promising solution seems to be the FDBAQ (Flexible Dynamic Block Adaptive Quantization) approach as proposed by ESA; 3 output bits would be sufficient for most of “typical” acquisitions over various targets, while few high reflectivity scenes would need 4 bits, making the expected average output bit rate little higher then 3 bits, thus lower then the estimated 3.7 bits for the ECBAQ (Entropy-Constrained Block Adaptive Quantization) compression. 33) 34) 35) 36)
Data delivery: Sentinel-1 will provide a high level of service reliability with near-realtime delivery of data within 1 hour after reception by the ground station, and with data delivery from archive within 24 hours.
OCP (Optical Communication Payload): In parallel to the RF communications, an optical LEO-GEO communications link using the LCT (Laser Communication Terminal) of Tesat-Spacecom (Backnang, Germany) will be provided on the Sentinel spacecraft. The LCT is based on a heritage design (TerraSAR-X) with a transmit power of 2.2 W and a telescope of 135 mm aperture to meet the requirement of the larger link distance. The GEO LCT will be accommodated on AlphaSat of ESA/industry (launch 2012) and later on the EDRS (European Data Relay Satellite) system of ESA. The GEO relay consists of an optical 2.8 Gbit/s (1.8 Gbit/s user data) communication link from the LEO to the GEO satellite and a 600 Mbit/s Ka-band communication link from the GEO satellite to the ground. 37)
Since the Ka-band downlink is the bottleneck for the whole GEO relay system, an optical ground station for a 5.625 Gbit/s LEO-to-ground and a 2.8 Gbit/s GEO-to-ground communication link is under development.
LCT | 1st Generation | 2nd Generation | 3rd Generation |
Link type | LEO-LEO | LEO-GEO | LEO-LEO, LEO-GEO, UAS-GEO |
Mission | NFIRE, TerraSAR-X | Sentinel 1 & 2, AlphaSat, ERDS | Euro Hawk, Global Hawk |
Lifetime | 2-5 years | 15 years | Mission depending |
Data rate | 5.625 Gbit/s | 1.800 Gbit/s | 1.800 - 5.625 Gbit/s |
Range | 1000 - 5100 km | < 45,000 km | 1000 - 45,000 km |
Target BER | 1 x 10⁻⁸ | 1 x 10⁻⁸ | Better than 1 x 10⁻⁸ |
Tx power | 0.7 W | 2.2-5.0 W | < 5 W |
Telescope diameter | 125 mm | 135 mm | < 125 mm |
Instrument mass | ~33 kg | ~53 kg | < 45 kg |
Power consumption | ~ 120 W | ~160 W | 120 - 180 W |
Instrument volume | ~ 0.5 m x 0.5 m x 0.6 m | ~ 0.6 m x 0.6 m x 0.74 m | 3-box design (TBD) |
Technology Readiness Level | TRL9 | TRL5 | TBD |
Table 5: Technical data of the LCT generations 38)
Ground segment: Spacecraft operations is provided by ESOC, Darmstadt, while the payload data processing and archiving functions (including the planning for SAR data acquisitions) are provided by ESRIN, Frascati. Options are being provided to permit some functions to be outscored to other operating entities.
Figure 10: Isometric views of the deployed satellite (image credit: TAS-I)
Figure 11: SAR antenna deployment test supported by zero gravity deployment device (solar array in stowed position), image credit: TAS-I, (Ref. 21)
The figure above shows the fully integrated Sentinel-1A spacecraft with the SAR antenna and the solar array wings in stowed position. The figure shows the Sentinel-1 spacecraft already mounted on the shaker and ready for sine vibration testing after it has successfully passed the Mass Properties measurements (namely center of mass and inertia moments). Successful completion of vibration and acoustic testing has been followed by the deployment tests of both the SAR antenna and the solar array. Each solar array is tied down on four hold down points by dedicated Kevlar cables. Wing deployment is purely passive, driven by springs, and actuated upon activation of specific thermal knives devices. The time to complete deployment of one wing lasts about 3.5 minutes since the last cable cut. In the end position, the solar array panels are mechanically latched.
Figure 12: Photo of the Sentinel-1A spacecraft during functional tests in Cannes, France (image credit: TAS) 39)
• Before shipment to the launch site in late February 2014, the Sentinel-1 spacecraft has spent the last couple of months at Thales Alenia Space in Cannes, France, being put through a last set of stringent tests. This included suspending the satellite from a structure to simulate weightlessness and carefully unfolding the two 10 m-long solar wings and the 12 m-long radar antenna. 40)
• The first satellite dedicated to Europe’s Copernicus environmental monitoring program arrived at Cayenne in French Guiana on 24 February 2014. Sentinel-1A is scheduled to be launched from Europe’s spaceport in Kourou on 3 April. By delivering timely information for numerous operational services, from monitoring ice in polar oceans to tracking land subsidence, Sentinel-1 is set to play a vital role in the largest civil Earth observation programme ever conceived. 41)
Launch
Spacecraft | Launch Date (UTC) | Launch Vehicle | Spaceport |
| Sentinel-1C | December 5, 2024, 21:20 | Vega C launcher (VV25 mission) | ELV (Ensemble de Lancement Vega, 'Vega Launch Complex') Guiana Space Center, French Guiana |
Sentinel-1B | April 25 2016, 21:02 | Soyuz-STA Fregat | ELA-3, Guiana Space Centre, Kourou, French Guiana, South America |
Sentinel-1A | April 3 2014 21:02 | Soyuz-STB Fregat | ELA-3 (Ensemble de Lancement Ariane 3, 'Ariane Launch Complex 3') Guiana Space Centre, Kourou, French Guiana, South America |
On March 22, 2016, the Sentinel-1B satellite has arrived in French Guiana to be prepared for liftoff on 22 April. 49)
Orbit: Sun-synchronous near-circular dawn-dusk orbit, altitude = 693 km, inclination = 98.18º, orbital period = 98.6 minutes, ground track repeat cycle = 12 days (175 orbits/cycle). An exact repeat cycle is needed for InSAR (Interferometric Synthetic Aperture Radar) support. LTAN (Local Time on Ascending Node) = 18:00 hours.
Orbital tube: A stringent orbit control is required to the Sentinel-1 system. Satellites’ position along the orbit needs to be very accurate, in terms of both accuracy and knowledge, together with pointing and timing/synchronization between interferometric pairs. Orbit positioning control for Sentinel-1 is defined by way of an orbital Earth fixed “tube” 50 m (rms) wide in radius around a nominal operational path. The satellite is kept inside such a tube for most of its operational lifetime Ref. 15). 51)
One of the challenges of the Sentinel-1 orbit control strategy is the translation of a statistical tube definition in a deterministic control strategy practically functional to the ESOC (European Space Operations Center) operations.
Figure 14: Schematic view of the orbital tube (image credit: ESA, TAS, Ref. 15) 52)
The second obvious challenge is the very stringent tube diameter which forces the application of frequent and intense maneuvers nevertheless still compatible with S/C request for consumables of up to a 12 years lifetime.
A satellite control strategy has been specifically developed and consists in applying a strict cross-track dead-band control in the most Northern Point and in the ascending node crossing. Controlling the orbit at these 2 latitudes, the satellite is shown to remain in the tube, within the rms (root mean square) criteria, for all other latitudes.
Figure 15: Orbital tube section (image credit: ESA, TAS, Ref. 15)
Orbit knowledge accuracy (< 3 m rms in each axis) in realtime for autonomous operations is not considered as demanding as the on-ground postprocessing requirements (< 5 cm 3D rms) for the detection of (slow) land movements and deformations through the differential interferometry technique. The latter is almost as demanding as for Sentinel-3 and requires dual-frequency receivers. 53)
As both satellites, Sentinel-1A and Sentinel-1B, will fly in the in the same orbital plane with 180º phased in orbit, and each having a 12-day repeat orbit cycle, it will facilitate the formation of SAR interferometry (InSAR) image pairs (i.e., interferograms) having time intervals of 6 days. This, along with the fact that the orbital deviation of each Sentinel-1 satellite will be maintained within a tube of ±50 m radius (rms) will enable the generation of geographically comprehensive maps of surface change such as for measuring ice velocity in the Polar regions, as well as monitoring geohazard related surface deformation caused by tectonic processes, volcanic activities, landslides, and subsidence (Ref. 119).
Further imagery from Sentinel-1 can be found in the below articles:
• Sentinel-1 imagery in the period 2020-2022
• Sentinel-1 imagery in the period 2019
• Sentinel-1 imagery in the period 2018-2014
Mission Status
• December 10, 2024: Less than a week after its launch on December 5, 2024, the Copernicus Sentinel-1C satellite has captured and delivered its first high-resolution radar images of Earth, showcasing its advanced capabilities for environmental monitoring. Initial images of Svalbard, Norway, the Netherlands, and Brussels, Belgium, highlight its diverse applications, from tracking Arctic ice coverage to supporting sustainable farming and urban planning. The Svalbard image, taken just 56 hours after launch, demonstrates its potential to monitor polar ecosystems, while the Netherlands image aids in agricultural and water resource management. The Brussels image reveals intricate urban details, echoing a legacy connection to earlier Sentinel missions. Its freely available data aims to benefit global scientific and environmental initiatives, continuing the legacy of its Sentinel-1 predecessors.


• December 5, 2024: The Copernicus Sentinel-1C satellite lifted-off from the Guiana Space Center, French Guiana onboard the Vega C launcher (VV25 mission), at 9:20 p.m. UTC. Sentinel-1C successfully reached Sun-synchronous orbit (SSO) at an altitude of 700 km. Spacecraft separation occurred 1 hour and 43 minutes after lift-off. 177)
• September 23, 2024: ESA announced that Sentinel-1B has reached the end of its life, after successfully completing the electrical passivation of the reentry phase, which is due within 25 years. The satellite’s orbit has been lowered to allow the successors Sentinel-1C and Sentinel-1D to reach the planned orbit, once launched. 174)
• April 17, 2024: ESA has adjusted the orbit control strategy for the Sentinel-1A satellite due to a thruster anomaly affecting its inclination control system. This change, implemented to preserve spacecraft safety, involves suspending out-of-plane orbit maneuvers while continuing in-plane adjustments. The altered approach leads to gradual deviations in the satellite's orbital path, particularly at higher latitudes, though equatorial performance remains stable.
ESA has conducted simulations to assess the impact on SAR Interferometry (INSAR) applications, determining that the deviations are within acceptable limits for most use cases. While minor degradations in interferometric coherence and spectral overlap are anticipated, they do not significantly compromise mission objectives. The situation will be closely monitored, and further adjustments may be made if necessary. The result of the analysis is made available on the technical note available here. 175)
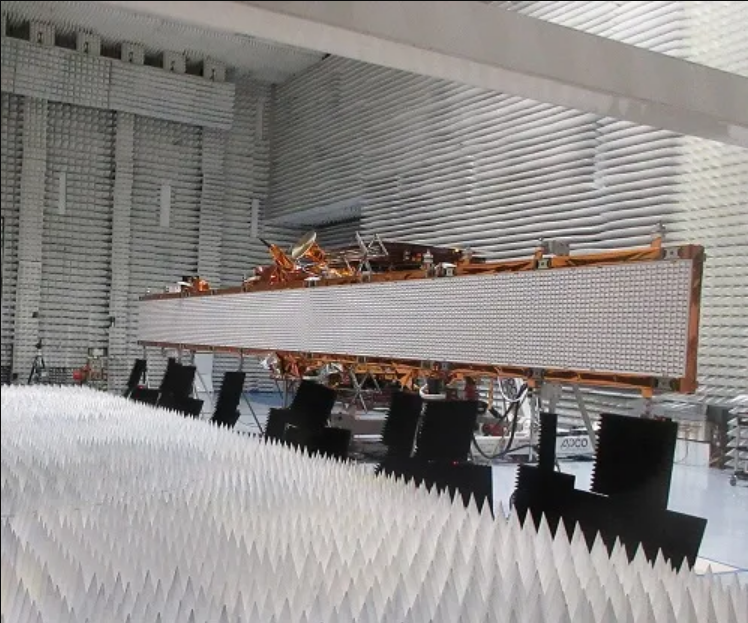
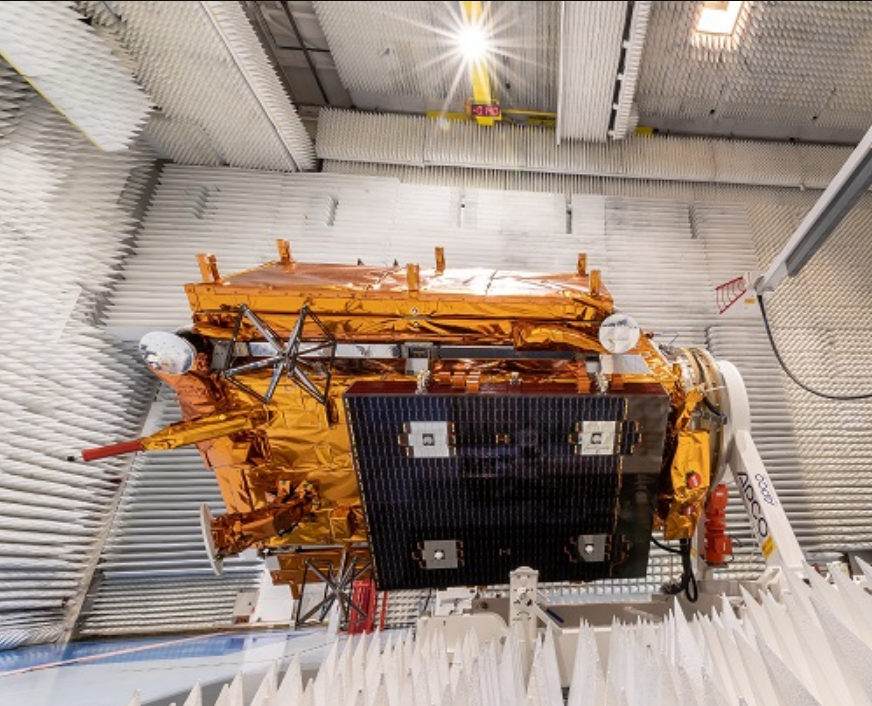
• February 22, 2023: Europe’s next synthetic aperture radar satellite, Copernicus Sentinel-1C, has undergone pre-flight testing at Thales Alenia Space’s facility in Cannes, France. Those tests include ensuring the satellite will survive the noise and vibrations it will experience during launch and separation from the rocket.
The mechanisms that will deploy the satellite’s two 10-metre-long solar panel wings and 12-metre-long radar antenna have also been tested. There have also been electromagnetic and radio frequency compatibility tests.
Sentinel-1C will soon be moved from Cannes to Rome for short-term storage before being sent to the launch site in French Guiana. 157)
• August 3, 2022: The European Space Agency and the European Commission announce the end of the mission for the Copernicus Sentinel-1B satellite and regret the inconvenience caused to the Copernicus Services, Copernicus Participating States, and the many users worldwide affected by the lack of Sentinel-1B data. The conclusions drawn by the Anomaly Review Board resulted in the impossibility to recover the 28V regulated bus of the C-SAR Antenna Power Supply unit (CAPS), which provides power to the radar electronics. The capability of Sentinel-1B to support the mission is therefore considered lost. A summary report of the description of the anomaly, of the investigations and the recovery attempts, as well as the parallel Sentinel-1 mission level actions and way forward is available here. 155)
• April 7, 2022: ESA on behalf of the European Commission and Arianespace signed a launch contract for the third radar satellite in the Sentinel-1 mission, Sentinel-1C. 55) 56)
• March 21, 2022: European Space Agency officials said prospects are dimming for the recovery of a radar imaging satellite that malfunctioned nearly three months ago, but that efforts to save the spacecraft continue. 61) The Sentinel-1B spacecraft malfunctioned in December, keeping the spacecraft from collecting C-band synthetic aperture radar (SAR) imagery. ESA said in January that they were investigating a problem with the power system for the SAR payload on the satellite, launched in April 2016. In a February 25th update, the ESA said work was continuing to investigate problems with both the main and backup power system for the payload but that effort had yet to identify a root cause of the anomaly. The problem doesn’t affect operations of the spacecraft itself, which has remained under control. ESA leaders were not optimistic about the prospects of recovering Sentinel-1B.
• February 25, 2022: Following the previous news on the Sentinel-1B anomaly that occurred on 23 December 2021, very detailed investigations related to the satellite power system’s affected unit are still on-going. The anomaly is related to a 28V power regulated bus that supplies power to the SAR electronics subsystem. The reactivation of both the main and redundant power regulators of this 28V bus have not been successful so far. 62) Whereas good progress has been made on the investigation of 18 identified possible failure scenarios linked to the affected power unit, at this stage the root cause of the anomaly has not been clearly identified. Satellite system level analyses are conducted in parallel, to perform new recovery attempts of the unit.
• January 07, 2022: Following the previous news on the Sentinel-1B anomaly that occurred on 23 December 2021, the resuming of the operations was carefully prepared including the on-board configuration changes preventing the anomaly to occur again. 68)However, during the preparation of the recovery operations, it became clear that the initial anomaly was a consequence of a potential serious problem related to a unit of the power system of the Sentinel-1B satellite.
• December 25, 2021: Copernicus Sentinel-1B is unavailable since 23 December 2021 at 06:53 UTC, no data are being generated. 69) Specific actions were performed over the next days to implement an onboard configuration change that would prevent the re-occurrence of the anomaly (that could result in satellite safety risks). This required simulations and system validation activities on ground, before upload to the satellite. The satellite unavailability period was 2 weeks.
• December 23, 2021: Copernicus Sentinel-1B is unavailable since 23 December 2021 at 06:53 UTC, no data are being generated. An anomaly occurred onboard. The satellite was in a nominal mode, the SAR had been temporarily switched off.
• October 4, 2021: This week marks seven years since the very first satellite that ESA built for the European Union’s Copernicus program started delivering data to monitor the environment. The Sentinel-1A satellite has shed new light on our changing world and has been key to supplying a wealth of radar imagery to aid disaster response. While this remarkable satellite may have been designed for an operational life of seven years, it is still going strong and fully expected to be in service for several years to come. 70) Launched on 3 April 2014 and delivering a stream of operational data by the beginning October 2014. Copernicus has been the largest provider of Earth observation data in the world for some years now. Copernicus Sentinel-1A exceeded its designed lifetime.
- The Copernicus Sentinel-1 mission comprises two identical satellites orbiting 180° apart to image the planet with a repeat frequency of six days, down to a daily coverage at high latitudes to support operational sea-ice monitoring. Sentinel-1B was launched in April 2016. It is also used for monitoring ground deformation resulting from subsidence, earthquakes and volcanoes, mapping for forest, water and soil management, and mapping to support humanitarian aid and crisis situations. Over the last seven years, the mission has, for example, tracked the huge A-68 iceberg that calved from Antarctica and had a near-collision with South Georgia, has been used in synergy with the Copernicus Sentinel-2 optical mission to map crop types and with ESA’s CryoSat to map ice loss from ice sheets and diminishing sea ice as well as ice lost from the world’s glaciers.
• Sept. 16, 2016: Sentinel-1B was declared operational. On 14 September, project manager Ramón Torres who led the development team, handed over the satellite to the mission manager, Pierre Potin in the presence of Volker Liebig, Senior Advisor to ESA’s Director General. Following liftoff on 25 April 2016, the Copernicus Sentinel-1B satellite has been commissioned and handed over for mission operations. It joins its identical twin, Sentinel-1A, which has been systematically scanning Earth with its radar since October 2014. Orbiting 180° apart, the two satellites optimize coverage and data delivery for the Copernicus services that are making a step change in the way our environment is managed. More than 45,000 users have registered to access Sentinel data, under the free and open data policy data framework of Europe’s Copernicus environmental monitoring program. 160)
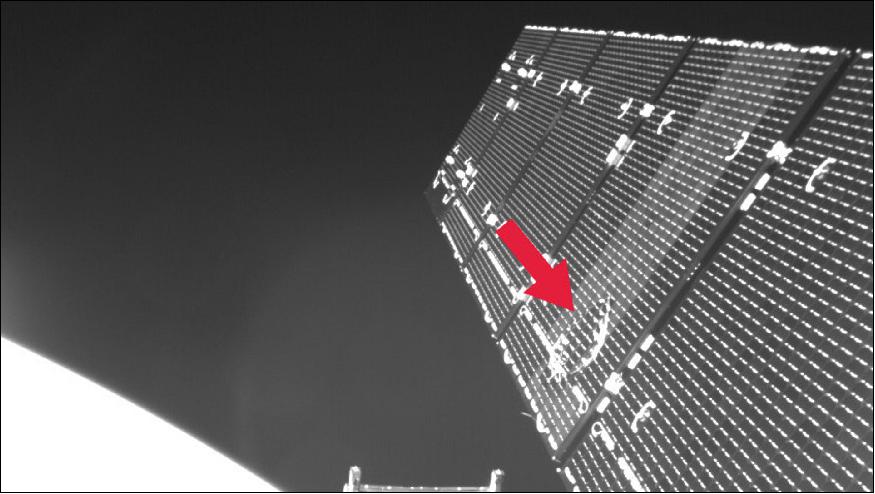
• August 31, 2016: ESA engineers have discovered that a solar panel on the Copernicus Sentinel-1A satellite was hit by a millimeter-size particle in orbit on 23 August. Thanks to onboard cameras, ground controllers were able to identify the affected area. So far, there has been no effect on the satellite’s routine operations. 161)
- A sudden small power reduction was observed in a solar array of Sentinel-1A, orbiting at 700 km altitude, at 17:07 GMT on 23 August. Slight changes in the orientation and the orbit of the satellite were also measured at the same time. Following a preliminary investigation, the operations team at ESA’s control center in Darmstadt, Germany suspected a possible impact by space debris or micrometeoroid on the solar wing. Detailed analyses of the satellite’s status were performed to understand the cause of this power loss. In addition, the engineers decided to activate the board cameras to acquire pictures of the array. These cameras were originally carried to monitor the deployment of the solar wings, which occurred just a few hours after launch in April 2014, and were not intended to be used afterwards. Following their switch-on, one camera provided a picture that clearly shows the strike on the solar panel. The power reduction is relatively small compared to the overall power generated by the solar wing, which remains much higher than what the satellite requires for routine operations.
• April 28, 2016: Sentinel-1B has produced its first images only two hours after the radar was switched on – a record time for a space radar. The first observations were taken a little more than two days after launch, after Sentinel-1B had followed a complicated routine to deploy its 12 m-long radar and two 10-m long solar wings, as well as passing a series of initial checks. The first image, 250 km wide and 600 km long, captured Svalbard, the Norwegian archipelago in the Arctic Ocean, with the Austfonna glacier clearly visible. 162)
- At ESA’s operations center in Darmstadt, Germany, mission controllers thoroughly checked the satellite’s control, navigation and power systems, among others, during the intense first few orbits. The team also conducted the complex unfolding of the radar wings and solar arrays.
- When Sentinel-1B reaches its final orbit, on the other side of Earth from Sentinel-1A, the radar vision constellation will be complete, meeting the coverage and revisit needs of Copernicus. In the coming months, the satellite will be tested and calibrated before it is declared to be operational.
![Figure 65: Sentinel-1B’s first data strip stretches 600 km from 80ºN through the Barents Sea. The image, which shows the Norwegian Svalbard archipelago on the left, was captured on 28 April 2016 at 05:37 GMT - just two hours after the satellite’s radar was switched on (image credit: ESA, contains modified Copernicus Sentinel data [2016], processed by ESA)](/api/cms/documents/163813/4731689/S1-2018-14_Auto3C.jpeg)
![Figure 66: This full resolution subset of the first Sentinel-1B image shows Norway’s Nordaustlandet island in the Svalbard archipelago, covered by the Austfonna ice cap ((image credit: ESA, contains modified Copernicus Sentinel data [2016], processed by ESA)](/api/cms/documents/163813/4731689/S1-2018-14_Auto3B.jpeg)
• April 27, 2016: Following liftoff on 25 April from Europe’s Spaceport in French Guiana, Sentinel-1B has opened its large solar wings and radar antenna. 163)
- After its launch, Sentinel-1B has followed a carefully planned sequence over 10 hours to open its large radar antenna and solar wings. During ascent, the satellite’s 12 m-long radar antenna and two 10 m-long solar wings were folded up to fit into the Soyuz rocket’s protective fairing. They opened together in a specific sequence, which also allowed power from the solar panels to be available as soon as possible, so that the satellite no longer depends on batteries.
• April 26, 2016: The launch of Sentinel-1B went according to plan; the spacecraft was placed into its orbit (altitude = 693 km) 23 minutes and 35 seconds after launch (launch mass of 2164 kg). Sentinel-1B is the fourth in a series of Sentinel satellites for the European Copernicus program, a joint project of the EC (European Commission) and ESA (European Space Agency).
• December 15, 2015: ESA has ensured the continuation of the Sentinel-1 Earth observation satellite series for Europe’s Copernicus environmental program by ordering two more satellites. The contract was signed today Thales Alenia Space of Italy to build Sentinel-1C and -1D. Thales Alenia Space will lead a consortium of 60 European companies, including Germany’s Airbus Defence and Space, responsible for the radar instrument. 164)
• February 2015: The current status of the Sentinel-1A mission as well as expected mission steps of Sentinel-1B are listed below. 165)
- Sentinel-1B satellite under procurement, launched foreseen in early 2016
- Sentinel-1A RORR (Routine Operation Readiness Review) planned May 2015. This milestone completes the operational qualification with steady operations providing a sustained service with consolidated KPI (Key Performance Indicators).
- Sentinel-1A Operational Qualification phase is on-going in Feb. 2015
- Satellite and ground segment status and performance are nominal, regular operations since January 23, 2015
- First PolInSAR observations were acquired in January 2015
- Data flow opened to all users on 3 October 2014
- Sentinel-1A commissioning phased completed on 23 September 2014 with IOCR (In-Orbit Commissioning Review)
- Nominal orbit reached on 7 August 2014
- Sentinel-1A launched on 3 April 2014 on Soyuz from Kourou
• Nov. 28. 2014: Marking a first in space, Sentinel-1A and Alphasat have linked up by laser stretching almost 36 000 km across space to deliver images of Earth just moments after they were captured (LEO-GEO communication). This important step demonstrates the potential of Europe’s new space data highway to relay large volumes of data very quickly so that information from Earth-observing missions can be even more readily available. 166) 167) 168) 169)

• October 6, 2014: ESA announced the end of Sentinel-1A commissioning period. This marks the beginning of the satellite’s operational life, delivering radar coverage for an array of applications in the areas of oceans, ice, changing land and emergency response. The operation of the Sentinel-1A spacecraft was formally handed over to the mission management team. The satellite will now begin delivering radar scans for an array of operational services and scientific research. 170)
• On April 16, 2014, ESA released initial imagery of the Sentinel-1A mission. The first radar image of Brussels was acquired in the satellite’s ‘strip map’ mode, which has a swath width of 80 km, and in dual polarization. The image also shows a more detailed view of the city in the ‘zoom in’. Antwerp harbor is also visible in the top left. The green colors correspond to vegetation, red–blue to urban areas, white to high-density urban areas and black to waterways and low-reflective areas such as airport runways. 171)
The satellite is not yet in its operational orbit, nor is it calibrated for supplying true data. These tasks will be carried out during the commissioning phase, which will take about three months to complete.


• April 4, 2014: Following the launch, Sentinel-1A has performed a carefully a choreographed 10-hour dance routine to open its large radar antenna and solar wings. During the launch, the 12 m long radar and two 10 m long solar wings were folded up to fit into the protective Soyuz rocket fairing. After being lofted to 693 km above Earth and released into orbit, the satellite gently ‘tumbled’ to stabilize before embarking on its elaborate dance routine. 173)
- The solar wings and radar opened together in a specific sequence that took around 10 hours to complete. As one of most critical stages in the life of the mission, it was choreographed to ensure that both deploy in the safest possible way. The sequence also allowed power from the wings to be available as soon as possible so that the satellite was independent.
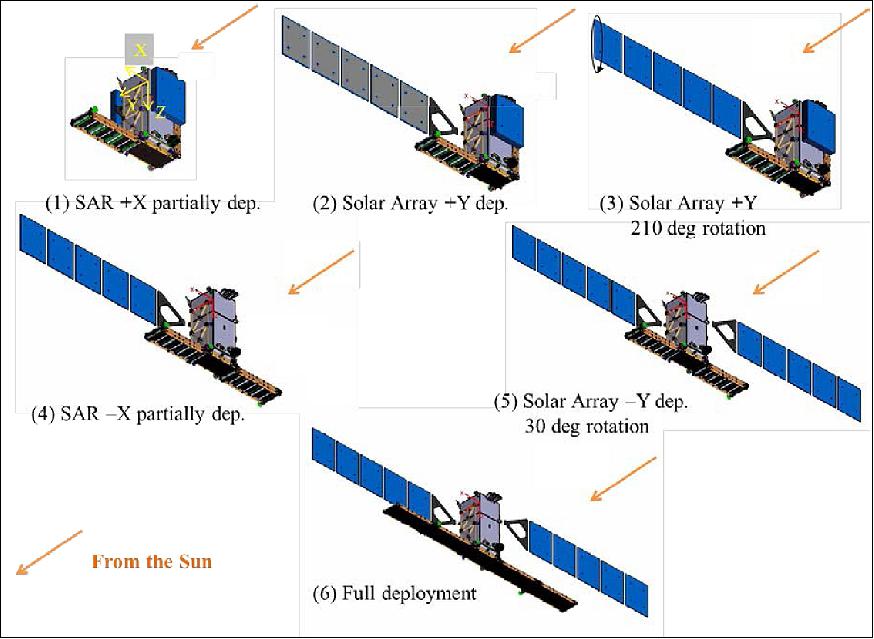
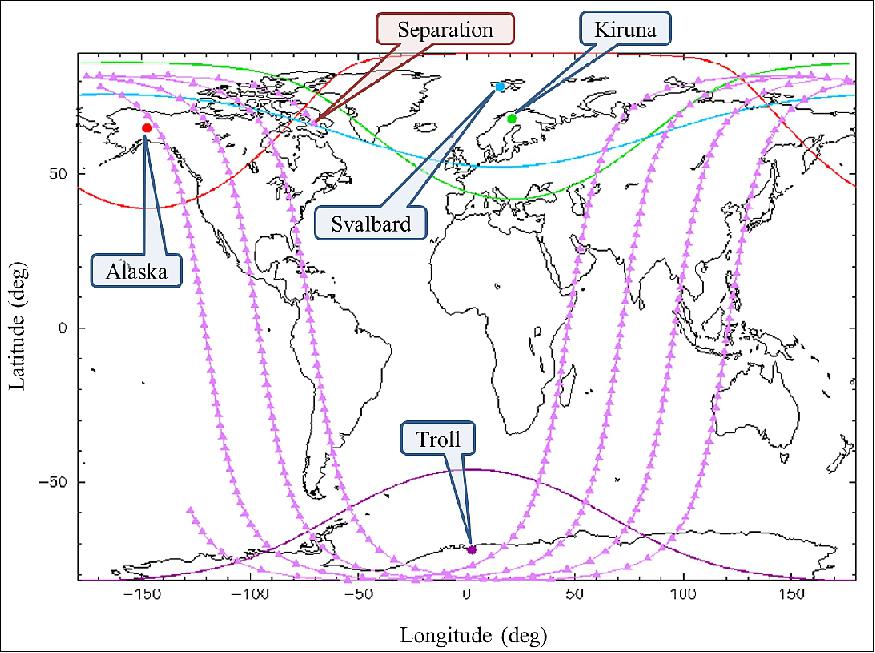
- The first step in the sequence was the SAR +X wing release by means of a pyrotechnic actuator. This event was noticeable in TM as a small oscillation in the S/C rates. The partial deployment was not commanded until the following ground pass over Svalbard-Alaska at MET 03:36 h. The deployment was successfully completed by the time the S/C entered visibility from Troll at MET 04:28 h. During this pass the SAR –X wing release (not partial deployment yet) was commanded. The +Y Solar Array deployment was telecommanded at the next contact with the S/C from Kiruna-Svalbard-Alaska at MET 05:13 h. The 210 º +Y Array rotation required to get Sun incidence which was nominally planned for this pass, but was actually commanded and monitored at the next ground pass over Troll at MET 06:04 h, at which point Power Positive Status was achieved. The deployment of the +Y Solar Array was noticeable in the monitored S/C rates, which experience disturbances of up to 0.5º/s in roll and 2º/s in yaw.

• April 3, 2024: Cameras on the Soyuz Fregat upper stage, that released the Sentinel-1A spacecraft into orbit on April 3, acquired superb footage showing the Sentinel-1A satellite separating from the Fregat to start its life in orbit around Earth. The satellite separated from the upper stage 23 min 24 sec after liftoff. 173)
- Separation occurred within visibility of KSAT ground station at Svalbard and three minutes before entering visibility from the SSC/USN antenna in Alaska. Approximately one minute after physical separation, the on-board automatic sequence started, switching on the S-band transponder and setting the S/C mode to RDM (Rate Damping Mode). The first TM frames were successfully received at the Svalbard station and forwarded to ESOC at 21:27:15 UTC on April 3, 2014 (just 25 minutes after launch).