EO
ESA
Atmosphere
Cloud type, amount and cloud top temperature
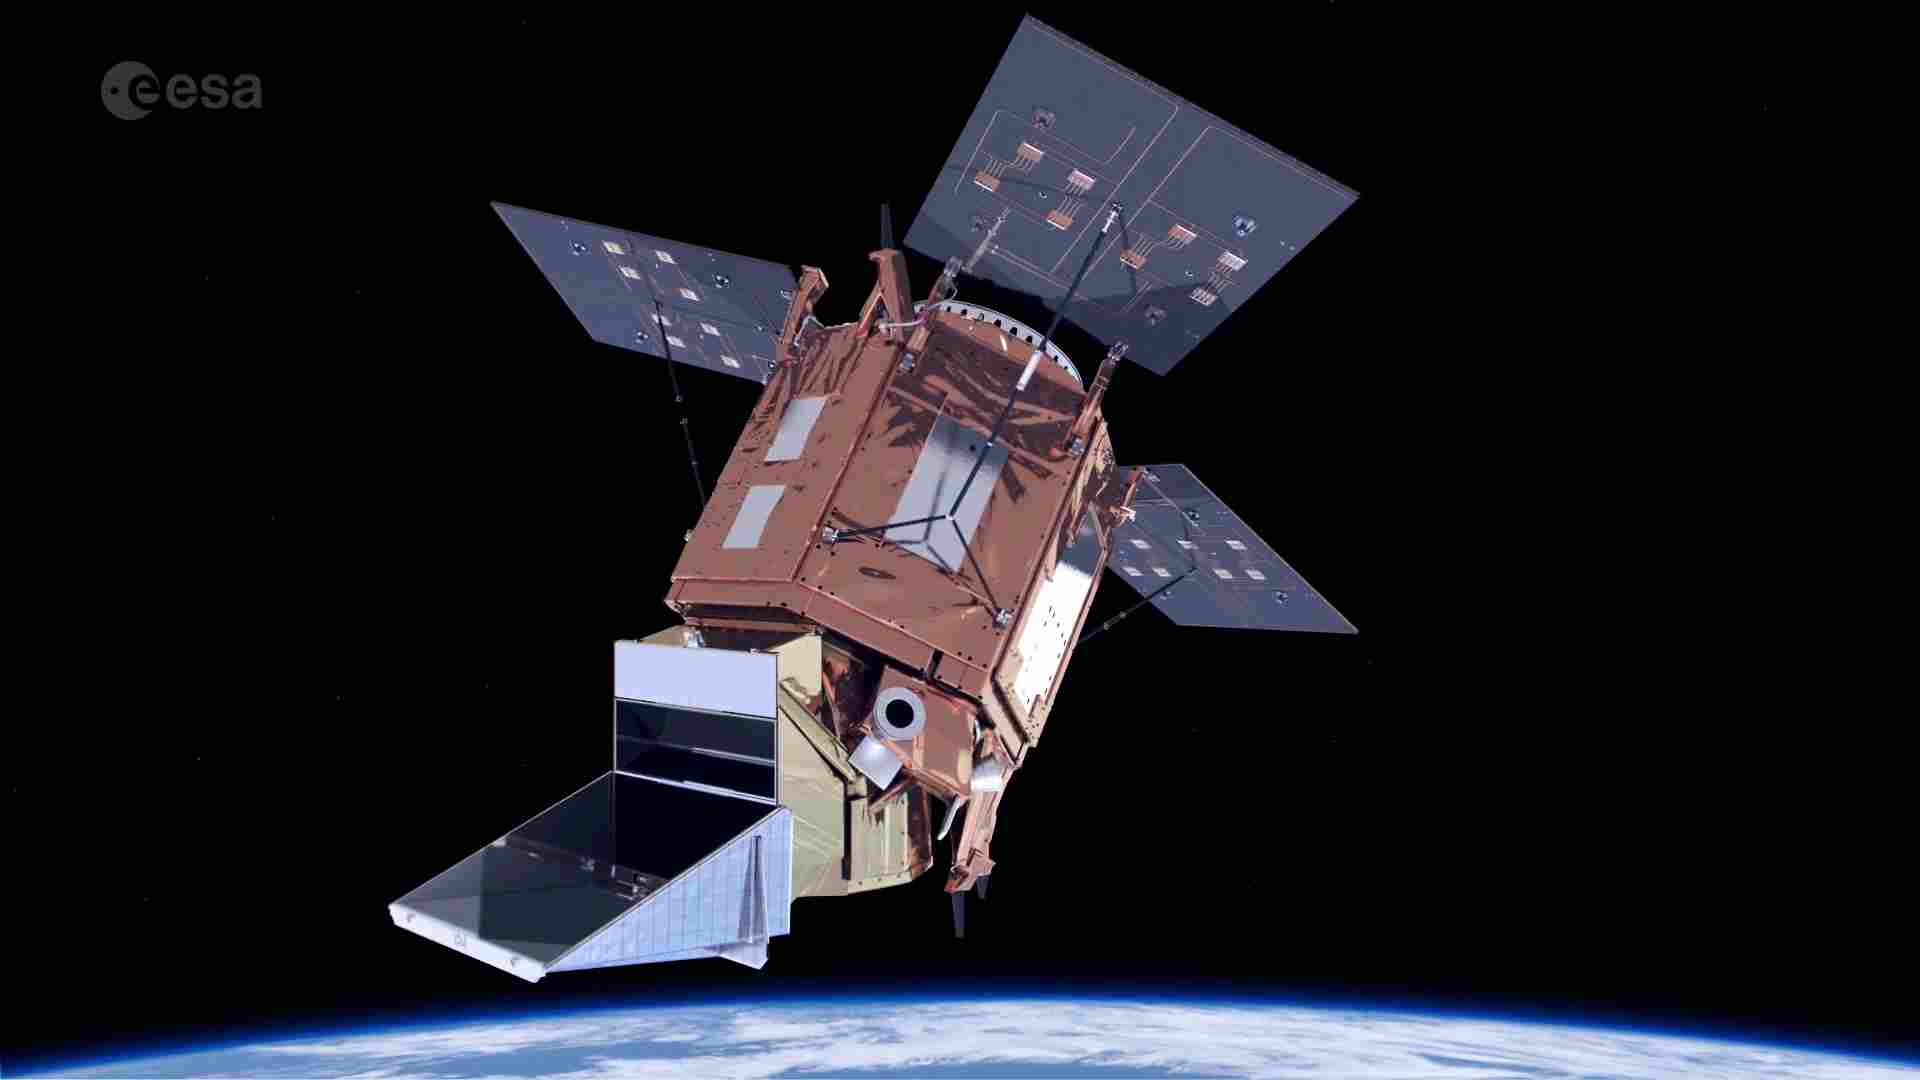
Sentinel-5P (S5P) is a satellite mission that is jointly operated by the European Space Agency (ESA) and the Netherlands Space Office (NSO), formerly the European Global Monitoring for Environment and Security program (GMES). The mission was designed to bridge the gap between atmospheric monitoring systems and to succeed the Envisat mission. The satellite launched in October 2017.
Quick facts
Overview
| Mission type | EO |
| Agency | ESA, NSO, COM |
| Mission status | Operational (nominal) |
| Launch date | 13 Oct 2017 |
| Measurement domain | Atmosphere |
| Measurement category | Cloud type, amount and cloud top temperature, Aerosols, Radiation budget, Atmospheric Humidity Fields, Ozone, Trace gases (excluding ozone) |
| Measurement detailed | Cloud top height, Aerosol absorption optical depth (column/profile), Atmospheric specific humidity (column/profile), O3 Mole Fraction, CH4 Mole Fraction, NO2 Mole Fraction, BrO (column/profile), NO (column/profile), CO Mole Fraction, SO2 Mole Fraction, Downward short-wave irradiance at Earth surface, ClO (column/profile), HCHO Mole Fraction, SO2 Total Column, O3 Total Column, HCHO Total Column |
| Instruments | TROPOMI |
| Instrument type | Atmospheric chemistry |
Related Resources
Summary
Mission Capabilities
The Sentinel-5P mission includes the Tropospheric Monitoring Instrument (TROPOMI) which is a passive grating pushbroom imaging spectrometer. The TROPOMI was designed to support atmospheric composition and air quality monitoring services and provide measurements of aerosols, atmospheric humidity fields, cloud types and temperature, ozone, and trace gasses.
Performance Specifications
TROPOMI is an advanced nadir-viewing Differential Optical Absorption Spectrometer (DOAS) that has a swath width of 2600 km (roughly 104° wide) with spatial sampling of 7 km x 7 km. There are four spectrometers on the instrument which are each electronically split into two bands: two in Ultraviolet (UV), two in Near Infrared (NIR), two in Short Wave Infrared (SWIR) and two in visible light (VIS). The instrument has a spectral resolution of 5 km-15km with the possibility of reaching 50km at wavelengths of <300 nm. The satellite contains spectral ranges of 270 nm - 300 nm (UV1), 300 nm - 320 nm (UV2), 310 nm - 405 nm (UVIS), 405 nm - 500 nm (VIS), 675 nm - 725 nm (NIR1), 725 nm - 775 nm (NIR2) and 2305 nm - 2385 nm (SWIR-3), which each have a spectral resolution of 0.5 nm (UV1), 0.5 nm (UV2), 0.55 nm (UVIS), 0.55 nm (VIS), 0.5 nm (NIR1), 0.5 nm (NIR2), and 0.25 nm (SWIR), respectively.
Sentinel-5P has radiometric accuracy of 1.6% in SWIR to 19% in UV of the measured Earth spectral reflectance. The satellite is in a sun-synchronous orbit at an altitude of 824 km and has an orbital period of 101 minutes with an inclination of 98.742°.
Space & Hardware Components
The Sentinel-5P satellite includes a ground segment that is broken into three units: the core ground segment, the collaborative ground segment and the Copernicus missions’ ground segment. The core ground segment has the responsibility of monitoring and controlling the Sentinel spacecraft and ensuring that data processing, acquisition, archiving and dissemination to final users are operational. The other segments work to provide specialised and technological solutions to support calibration and validation activities. Each segment has specific control functions such as data reception, data processing, and the deliverance of complimentary data to Sentinel missions.
The satellite bus is an AstroBus L 250 M that is provided by Airbus Defence and Space and has a design life of 7 years (with a reliability of 0.75). Mechanically, the spacecraft platform handles data in two distinct units: the On-Board Computer (OBC) and the Remote Interface Unit (RIU). These electrical and functional systems allow for memory functions and telemetry and telecommand handling. There are also subsystems such as the Payload Data Handling Unit (PDHU) that consists of a set of X-band transmission units that store data transmitted by high-speed links from the TROPOMI.
Copernicus: Sentinel-5P (Precursor - Atmospheric Monitoring Mission)
Spacecraft Launch Mission Status Sensor Complement Ground Segment ReferencesSentinel-5P (or S-5P, or S5P) is an approved LEO pre-operational mission within the European GMES (Global Monitoring for Environment and Security) program — a collaborative effort of ESA and NSO (Netherlands Space Office). The goal is to fill the gap between the current atmospheric monitoring instruments SCIAMACHY on ESA's Envisat satellite and OMI (Ozone Monitoring Instrument) carried on NASA's Aura mission, as these instruments come to the end of their lifetimes, and the launch of the Sentinel-5 mission is planned for the timeframe 2020. Note: The Envisat mission operations ended on May 9, 2012. 1) 2) 3) 4)
Copernicus is the new name of the former GMES program 5)
Copernicus is the new name of the European Commission's Earth Observation Programme, previously known as GMES (Global Monitoring for Environment and Security). The new name was announced on December 11, 2012, by EC (European Commission) Vice-President Antonio Tajani during the Competitiveness Council.
In the words of Antonio Tajani: "By changing the name from GMES to Copernicus, we are paying homage to a great European scientist and observer: Nicolaus Copernicus (1473-1543). As he was the catalyst in the 16th century to better understand our world, so the European Earth Observation Programme gives us a thorough understanding of our changing planet, enabling concrete actions to improve the quality of life of the citizens. Copernicus has now reached maturity as a programme and all its services will enter soon into the operational phase. Thanks to greater data availability user take-up will increase, thus contributing to that growth that we so dearly need today."
The missions Sentinel-5P (LEO), Sentinel-4 (GEO) and Sentinel-5 (LEO) will be devoted to atmospheric composition monitoring for the GMES Atmosphere Service (GAS). The objective of the Sentinel-5P mission is to provide data delivery (maintain the continuity of science data) for atmospheric services between 2015-2020. The successor Sentinel-5 payload is planned to be flown on a MetOp-SG (Second Generation) mission with a launch in 2020.
At the ESA ministerial Conference in 2008 in The Hague, The Netherlands, the Sentinel-5P mission was defined in the frame of the ESA GMES Space Component Program. This program answers to a joint initiative of the EC (European Commission) and ESA on GMES.
| UV-VIS- NIR, SWIR | TIR | |||
Orbit | LEO | GEO | LEO | GEO | |
Temporal sampling | daily | hourly | daily | hourly | |
Instrument | UVNS (UV NIR SWIR) Spectrometer | TROPOMI | UVN Spectrometer | IAS (IR Atmospheric Sounder) | IRS (IR Sounder) |
(Host) Satellite | EPS-SG | Free flyer | MTG-S | EPS-SG | MTG-S |
Synergy | VII (EPS Second Generation VIS/IR imager), | VIIRS+OMPS+CRIS/NPP, /JPSS | FCI/MTG-I (Flexible Combined Imager/Meteosat Third Generation-Imager) | VII (EPS Second Generation VIS/IR imager) | FCI /MTG-I (Flexible Combined Imager/Meteosat Third Generation-Imager) |
Sentinel-5P |
| X |
|
|
|
Sentinel-4 |
|
| X |
| X |
Sentinel-5 | X |
|
| X |
|
Spacecraft
Unlike the previous missions (Sentinel-1, Sentinel-2 and Sentinel-3), the Sentinel-4 and -5 will be in the class of "hosted payload" missions embarked on meteorological satellites and will be dedicated to atmospheric composition monitoring for the Copernicus Atmospheric Service. The mission is a single payload satellite embarking TROPOMI (Tropospheric Monitoring Instrument), a pushbroom instrument with four hyperspectral channels covering the spectrum from UV to SWIR. - On Dec. 8, 2011, ESA awarded a contract to Astrium Ltd. (Stevenage, UK) to act as prime contractor for the Sentinel-5 Precursor satellite system. 8) 9)
The satellite uses the AstroBus-L 250 M platform of Astrium and thus draws on the heritage from the SEOSat/Ingenio program of Spain, developed under the control of ESA, and from SPOT-6 and -7, two commercial imaging missions currently under development with Astrium internal funding. Including an ongoing export contract with Kazakhstan using this platform, Sentinel-5p is the 5th mission in the series and can rely on a robust and proven platform design. 10) 11)
The mechanical platform consists of a hexagonal structure supporting the platform electrical units and the TROPOMI ICU (Instrument Control Unit), and interfacing to a standard launch vehicle interface ring.
In the baseline solution, the platform equipment is distributed over the opening side panels, thus allowing easy access during integration and in case of on-ground maintenance operations.
The platform electrical/functional allocation uses a well proven classical architecture which is currently implemented in several ESA missions as well as in national and export programs. This proven architecture allows re-use of electronic equipment from several suppliers.
The core of the platform electrical/functional architecture is the data handling housed in two physically separate units, the OBC (On-Board Computer) and the RIU (Remote Interface Unit). The OBC (LEON 3) provides the processing and housekeeping memory functions and is responsible for telemetry and telecommand (TM/TC) handling, on-board time management, system re-configuration and communication with "intelligent" platform and payload units – units which communicate via a data bus. The OBC also manages the interface with the S-band transponder, which provides the RF telemetry, telecommand and ranging link to and from the ground station.
The OBC communicates with other satellite units primarily via two independent, fully redundant MIL-STD-1553B buses. All input/output interfaces to "non-intelligent" units are managed by the RIU.
The spacecraft power conditioning functions are performed autonomously by the PCDU (Power Conditioning and Distribution Unit). For robustness, these functions are implemented without the use of software. A battery and solar array sized to satisfy the mission needs complete the power subsystem.
The thermal subsystem includes heaters that are needed to maintain the thermal environment of the platform. The thermal control loops are controlled by the CSW (Central Software) resident in the OBC.
A COTS (Commercial-off-the Shelf) monopropellant propulsion module is used for orbit maintenance, mounted in the center of the lower floor. The propulsion subsystem is a hydrazine design operating in blow-down mode with 4 x 1 N thrusters configured in two redundant pairs.
The top floor accommodates the instrument and its radiator, as well as the star trackers and the X-band and S-band communication antennas. The instrument is mounted in a canted position, such that its radiator has an unobstructed field of view.
The nominal operational scenario for the payload instrument will always be nadir-pointing in the instrument imaging mode. Measurement data is collected when the SZA (Sun-Zenith Angle) is < 92º. Sun calibration can be performed close to the northern polar region when the sun enters the FOV (Field-of-View) of the sun calibration ports. Further calibration can be performed throughout the remainder of the orbit.
The PDHT (Payload Data Handling and Transmission) subsystem consists of a PDHU (Payload Data Handling Unit) and a set of X-band transmission units. The PDHU stores and handles the data transmitted by high speed links from the instrument. PUS (Packet Utilization Standard) compliant data are sent to the transponders and transmitted to ground.
The spacecraft is 3-axis stabilized, the design provides an optional yaw steering.
The main features of the FDIR (Failure Detection, Isolation and Recovery) concept are:
• A robust and qualified design coming from a high level of reuse of the standardized operations and FDIR concept already implemented in SEOSat/Ingenio
• A hierarchical architecture (from unit level to system level) where the goal is to try to recover the observed error on the lowest possible level to maximize the system availability for nominal operations.
This FDIR design guarantees:
• A high level of autonomy for the nominal mission with extended periods of time without ground intervention
• Satellite integrity in case of any failure leading to suspend the nominal mission
• Maximizes the satellite availability and autonomy while preserving a robust and failure tolerant system
• Safe operation of the satellite in case of any credible anomaly
• Geo-location performance within requirements even after a single failure: the 3 Star Tracker Optical Heads ensure that the geo-location requirements are still met with some margin after the loss of one optical head.
EPS (Electrical Power Subsystem): Three deployable solar arrays (5.4 m2) using GaAs triple-junction solar cells, supply 1500 W of average power. The two Li-ion batteries have a capacity of 156 Ah.
RF communications: The spacecraft will be equipped with S-band and X-band communication channels for uplink commanding and housekeeping telemetry downlink and for the downlink of instrument data, respectively. The X-band payload downlink rate is 310 Mbit/s. The onboard mass memory unit has a capacity of 430 Gbit using flash memory technology.
Project Development Status
• October 13, 2017: Europe's Sentinel-5P Earth observation mission will be lofted into space on a Russian rocket from Plesetsk Cosmodrome. About 93 minutes later, the satellite – having separated from the rocket and opened its solar panels – will transmit its first signals. The transmission will indicate that all has gone well with the launch and that the satellite is ready to receive instructions. 13)
- On Earth, engineers at the ground station in Kiruna, Sweden will be watching intently, with their 15 m diameter antenna pointing at the horizon, ready to catch Sentinel-5P's signal as it rises into the sky over the country. - The Kiruna station is part of ESA's global network, and it routinely supports multiple missions such as CryoSat, Integral, the Swarm trio and Sentinel.
- At the same time, 2100 km to the south, the team at ESA's mission control center in Darmstadt, Germany, will also be watching closely, because ‘acquisition of signal' will mark the moment they assume control, sending commands and downlinking data to check on the satellite's health and status.
• October 11, 2017: ESA's air-quality mission Sentinel-5P will sift through light from the atmosphere to accomplish its ambitious monitoring goals. The Agency's optics specialists helped to verify its main TROPOMI instrument would operate as planned. 14)
- Sentinel-5P is the first in a series of atmospheric chemistry missions from the European Commission's Copernicus program. It carries a single high-precision optical payload called the TROPOMI (Tropospheric Monitoring Instrument), developed jointly by the Netherlands and ESA. - Its aim is to track gradual changes in the makeup of the atmosphere, providing continuity between past missions such as ESA's Envisat and NASA's Aura and Europe's future Sentinel-4 and -5.
- Orbiting at 824 km above our heads, Sentinel-5P will map a multitude of trace gases such as nitrogen dioxide, ozone, formaldehyde, sulphur dioxide, methane, carbon monoxide and aerosols – all of which affect the air we breathe and therefore our health, and our climate.
- The optimal performance of an optical instrument in space always comes down to the combination of its individual components – coatings, filters, lenses and mirrors – in the optical chain. So back during TROPOMI's development phase, ESA's Optics Laboratory tested a number of key instrument elements.
- TROPOMI works by comparing reflected light from Earth's atmosphere with direct sunlight at various wavelengths, from infrared to ultraviolet. It uses diffraction gratings to split this light, allowing it to sift out the spectral fingerprints of its target trace gases.
- The optimal performance of an optical instrument in space always comes down to the combination of its individual components – coatings, filters, lenses and mirrors – in the optical chain. So back during TROPOMI's development phase, ESA's Optics Laboratory tested a number of key instrument elements.
- One of a suite of technical labs at ESA's technical heart in the Netherlands, the Optics Lab focused on verifying controlling unwanted ‘stray light' that might leak from the diffraction gratings. Too much stray light might make trace gas detection impossible. They performed precision measurements of prototype TROPOMI gratings to ensure any stray light remained within permissible bounds.
• October 4, 2017: As preparations for the launch of Sentinel-5P continue on track, the team at Russia's Plesetsk site has bid farewell to the satellite as it was sealed from view in the Rockot fairing. 15)
• September 25, 2017: Engineers have been at Russia's Plesetsk launch site for a month now, ticking off the jobs on the ‘to do' list so that the Copernicus Sentinel-5P satellite is fit and ready for liftoff on 13 October. With the satellite now fuelled, the team has passed another milestone. 16)
• September 4, 2017: The Sentinel-5P satellite has arrived in Plesetsk in northern Russia to be prepared for liftoff on 13 October. Built to deliver global maps of air pollutants every day and in more detail than ever before, this latest Copernicus mission will set a new standard for monitoring air quality. 17)
- Sentinel-5P is the first Copernicus mission dedicated to monitoring our atmosphere. It follows five other Sentinel satellites already in orbit and delivering a wealth of information about our planet.
• August 30, 2017: Today, Sentinel-5P was loaded on the Antonov aircraft that will take this latest Copernicus satellite to Russia to be prepared for liftoff in October. 18)
- Sentinel-5P carries the state-of-the-art TROPOMI instrument to map a multitude of trace gases such as nitrogen dioxide, ozone, formaldehyde, sulphur dioxide, methane, carbon monoxide and aerosols – all of which affect the air we breathe, our health, and our climate. With a swath width of 2600 km, it will map the entire planet every day. Information from this new mission will be used through the Copernicus Atmosphere Monitoring Service for air-quality forecasts and for decision-making.
• June 22, 2017: The Copernicus Sentinel-5 Precursor (Sentinel-5P) mission is dedicated to monitoring the composition of the atmosphere. Its data will be used largely by the Copernicus Atmosphere Monitoring Service. The mission will deliver information to monitor air quality, stratospheric ozone and will also be used for climate variables monitoring, and support European policy-making. 19)
- The Sentinel-5P mission will be the first of a series of atmospheric chemistry missions to be launched within the European Commission's Copernicus program. With the current launch window of September 2017 and a nominal lifetime of seven years, Sentinel-5P is expected to provide continuity in the availability of global atmospheric data products between its predecessor missions, SCIAMACHY (Envisat) and OMI (Aura), and the future Sentinel-4 and -5 missions.
- Sentinel-5P products will be used by Copernicus Services, namely the Atmosphere Monitoring Service (CAMS) or the Climate Change Service (C3S). These services will transform its data into high value information (for instance, forecasts of air pollution over Europe) that can be used by decision-makers to take appropriate actions on environmental policies, from which the well-being and security of EC citizens and future generations depend.
• February 6, 2016: The launch service for ESA's Sentinel-5P satellite on the Rockot launch vehicle reached an important project milestone during this week. In the frame of the satellite's test campaign at the facilities of Intespace, Toulouse, Sentinel-5P has been mated for the first time on its dedicated launch vehicle adapter. This adapter system will attach the spacecraft to the Rockot carrier during its travel into space and will eventually release the satellite into the target orbit. 20)
- The mating exercise, the so-called fit-check, aimed at verifying the mechanical and electrical interfaces between the Sentinel-5p satellite, built by Airbus DS in Stevenage, and the launcher hardware, manufactured by the rocketry company Khrunichev Research and Production Space Center. The purpose of a fit-check is ensuring a successful integration of the spacecraft onto Rockot at the launch complex and a check of the umbilical connections between the launcher and its payload. For the Sentinel-5P mission, the fit-check was further used to verify a customized purging system which was integrated into the adapter allowing the satellite customer to flush its contamination-sensitive instrument through the satellite-launcher interface during ground operations.
- The actual attachment of the Sentinel-5P satellite to its launch adapter is by means of a clamp band mechanism developed by Airbus Defence and Space in Madrid (formerly CASA Espacio). The clamp band is applied with high tension along the spacecraft-launch vehicle interface. The release of the satellite in space is achieved by firing pyro charges, which spontaneously open the clamp and hence allow separation. As the flawless functioning of the release is essential for a launch success, it was tested following the mating under recording the induced shock loads levels.
- Fit-check and release shock test have been conducted successfully on February 2nd and 3rd, respectively, in a remarkable team effort by Airbus Defence & Space, the Khrunichev Space Center, European Space Agency and Eurockot.
• July 24, 2015: The Sentinel-5 Precursor platform and the TROPOMI instrument have been integrated together to form the satellite which will be leaving the UK for testing. Airbus DS will deliver the spacecraft to Intespace in Toulouse, France, for final system level testing. 21)
Operational System/Service Allocations
• The Sentinel-5P satellite consists of the platform and the TROPOMI payload, the latter is supplied as CFI (Customer Furnished Item) to the spacecraft prime.
• The LEOP (Launch and Early Orbit Phase) ground station network will be used to control spacecraft after launch.
• Svalbard polar Earth station for spacecraft operations and data downlinking.
• The FOS (Flight Operations Segment) function will be performed by ESA/ESOC.
• The PDGS (Payload Data Ground Segment) function will be performed by DLR/EOC (Earth Observation Center), under contract to Astrium Ltd. This involves the development of PDGS to host the missions' ground processors and to distribute the resulting data to the user community.
Spacecraft launch mass | 980 kg |
Spacecraft power | 1500 W (EOL), 430 W average power consumption, battery capacity = 156 Ah |
Spacecraft platform | Astrobus L 250 M (Astrium UK) |
Onboard storage capacity | 480 Gbit (redundant) mass memory capacity) |
Science data link | 310 Mbit/s, modulation: OQPSK (Offset Quadrature Phase Shift Keying) |
Mission lifetime | 7 years with reliability of 0.75 |
|
|
TROPOMI instrument mass | 206.6 kg, plus 17.4 kg for the instrument control unit |
TROPOMI swath width | 2600 km (kept within the 3000 km VIIRS swath of Suomi NPP) |
Observation pointing | Fixed nadir pointing – accuracy requirements are easily met by typical EO satellites |
Observation periods | Observation + calibration typically 89% of orbit |
Data collected / orbit | 139 Gbit |
Data downlink | Once per orbit. No data loss if the downlink is missed for one orbit |
Spacecraft autonomy | Command loading for 7 days |
Payload thermal control | Passive, use of a 1.5 m2 radiator |
Figure 17: Sentinel-5P team set-up (image credit: Astrium)
Launch
The Sentinel-5P spacecraft was launched on October 13, 2017 (09:27 GMT) on an Eurockot Rockot/Briz-KM vehicle from the Plesetsk Cosmodrome in northern Russia. The Sentinel-5P spacecraft has a launch mass of ~ 820 kg. The first stage separated 2 min 16 sec after liftoff, followed by the fairing and second stage at 3 min 3 sec and 5 min 19 sec, respectively. The upper stage then fired twice, delivering Sentinel-5P to its final orbit 79 min after liftoff. 22) 23) 24) 25)
Orbit: Sun-synchronous orbit, altitude = 824 km, inclination = 98.74º, LTAN (Local Time on Ascending Node) = 13.35 hours, period = 101 minutes, the repeat cycle is 17 days (227 orbits).
A unique feature of the Sentinel-5P mission lies in the synergistic exploitation of simultaneous measurements of imager data from the VIIRS (Visible/Infrared Imager and Radiometer Suite), embarked on the Suomi NPP (NPOESS Preparatory Project) satellite of NASA/NOAA. NASA launched the NPP mission on October 28, 2011. The Sentinel-5P orbit is selected such that it trails behind Suomi NPP by 5 min in LTAN, allowing the Sentinel-5P observation swath to remain within the scene observed by Suomi NPP.
Note: As of June 2019, the previously large Sentinel5P file has been split into two files, to make the file handling manageable for all parties concerned, in particular for the user community.
• This article covers the Sentinel-5P mission plus the mission status in the period 2020
• Sentinel-5P Status and Imagery for the period 2019
• Sentinel-5P Mission Status for the period 2018-2017
Mission Status (2020 - 2022)
• September 10, 2024: The Global Methane Budget 2024 report reveals alarming increases in global methane emissions, with human activities now responsible for at least two-thirds of these emissions—a 20% rise over the past two decades, accelerating particularly in the last five years. Methane, being 28 times more effective than carbon dioxide at trapping heat over a century, has reached atmospheric concentrations of 1,923 parts per billion, the highest in 800,000 years. Despite international commitments, including the Global Methane Pledge for a 30% reduction by 2030, emissions continue to rise, especially from fossil fuels, agriculture, and waste management, posing significant challenges to climate goals. Key contributors include China, India, the USA, Brazil, and Russia, while Europe and Australia have seen reductions in methane emissions. 94)
In response to the growing methane crisis, ESA is leading initiatives to improve methane monitoring and mitigation. The Copernicus Sentinel-5P satellite provides vital data for tracking global methane concentrations, aiding in identifying hotspots and verifying mitigation efforts. Projects like SMART-CH4 and AI4CH4 aim to enhance detection capabilities for methane point sources using satellite imagery and AI technologies. Additionally, ESA's Regional Carbon Cycle Assessment and Processes Phase 2 (RECCAP-2) project seeks to reconcile top-down emission estimates with traditional inventories, while the CCI Greenhouse Gases project focuses on creating long-term climate data records. Through these efforts, ESA aims to support policymakers in effectively addressing global methane emissions and mitigating climate change impacts.
• June 23, 2022: In 2020, despite the global economic slowdown caused by the COVID-19 pandemic, methane levels continued to rise significantly, as observed by data from the Copernicus Sentinel-5P satellite. Scientists from the University of Leeds used this data to pinpoint regions with large surges in methane emissions, particularly in South Sudan, Uganda, Canada, and Russia. Wetlands, which contribute significantly to methane emissions, played a major role in this increase, especially with high rainfall and dam releases affecting regions like the Sudd wetlands in South Sudan. Satellite measurements confirmed the same methane increase shown in surface measurements, reinforcing the need to monitor atmospheric changes using such technology. 26) 27)
- Methane, which has both natural (40%) and anthropogenic (60%) sources, is a potent greenhouse gas with a relatively short atmospheric lifetime of nine years. Reducing methane emissions could quickly mitigate climate change. Despite the pandemic, 2020 saw the largest annual increase in methane concentrations since the 1980s, a record surpassed in 2021. Sentinel-5P data and the TOMCAT model showed that wetlands were likely significant contributors to this rise. Ongoing research aims to better understand how wetlands will respond to climate changes and how methane emissions from these regions will evolve in the future.
• May 25, 2022: At ESA's Living Planet Symposium in Bonn, discussions emphasized how Earth observation technology is already playing a critical role in supporting national climate action, particularly in emissions monitoring and adaptation. Satellites like Copernicus Sentinel-5P and the upcoming CO2M mission are increasingly being used to detect greenhouse gas emissions from human activities and natural sources, offering a global view that is essential for tracking climate trends and implementing effective climate policies. These capabilities support the goals of the Paris Agreement, especially the five-yearly Global Stocktake, which reviews global progress and raises collective ambition to mitigate climate change. 28)
- Earth observation technology also plays a key role in improving national emissions reporting, particularly in developing countries with limited in-situ measurement capabilities. ESA is pioneering new techniques, such as inverse atmospheric modeling through the RECCAP-2 project, to refine estimates of carbon surface fluxes between the atmosphere, land, and oceans. Satellites provide crucial data for developing climate adaptation strategies at the local level, such as tracking urban greening efforts to mitigate heatwaves. However, more work is needed to co-develop adaptation indicators with stakeholders to increase resilience to climate impacts.
• March 21, 2022: Data from the TROPOMI instrument on the Copernicus Sentinel-5P satellite has been used to detect methane plumes over some of Europe's largest methane-emitting coal mines, particularly in Poland’s Upper Silesian Coal Basin. Methane, a potent greenhouse gas, is released both naturally and through human activities like fossil fuel production. Between 2018 and 2020, satellite observations revealed significant methane concentrations from underground coal mines in this region, with enhancements around 20 parts per billion above background levels. These findings align with emissions reported by the European Commission and highlight the role of coal mining in contributing to global methane emissions. Efforts to monitor and manage these emissions, including the use of high-resolution sensors like GHGSat, are critical to curbing methane output, as reducing these emissions could have an immediate impact on mitigating climate change. 29)
• January 20, 2022: The Hunga-Tonga-Hunga-Ha'apai volcano erupted with immense force on January 15, 2022, marking the largest eruption in 30 years. The eruption triggered tsunami waves across the Pacific and caused sonic booms that were heard as far away as Alaska. It spewed ash, gas, and steam 30 km into the atmosphere, blanketing Tonga in hazardous ash and causing a major disaster. The eruption's impact reached global levels, with Copernicus Sentinel-5P satellite data showing a vast plume of sulphur dioxide spreading as far as Australia, over 7000 km from the eruption site, highlighting the far-reaching atmospheric effects. 30)
• November 10, 2021: High-resolution satellites have detected significant methane emissions from two adjacent landfill sites near Madrid, Spain, emitting 8800 kg of methane per hour in August 2021, the highest observed in Europe. Using data from Copernicus Sentinel-5P and GHGSat, researchers identified the methane plumes, with one site alone releasing nearly 5000 kg per hour. These emissions highlight the broader issue of methane from landfills, which account for a significant portion of anthropogenic greenhouse gases. While EU regulations require landfill operators to capture methane for energy or flaring, consistent monitoring remains a challenge. GHGSat and SRON's collaboration aims to address this through advanced satellite technology, helping authorities mitigate methane emissions and track climate progress. 31)
• September 30, 2021: Australia's 2019-2020 bushfire season was unprecedented, burning 18.6 million hectares and resulting in over 715 million tons of carbon dioxide emissions, significantly more than previous estimates of 275 million tons based on fire emission inventory datasets. Two studies published in *Nature* utilized satellite data from the Tropomi instrument on the Copernicus Sentinel-5P satellite to accurately measure carbon monoxide levels as a proxy for carbon dioxide emissions. This analysis revealed that the fires released nearly double the previously reported carbon dioxide and exceeded Australia's typical annual emissions from bushfires and fossil fuels by 80%. The findings highlight the devastating impact of the fires on both the environment and air quality, emphasizing the crucial role of satellite data in understanding the complexities of climate change. 32) 33)
• September 16, 2021: The Montreal Protocol, established in the late 1980s, successfully phased out ozone-depleting substances, leading to a gradual recovery of the ozone layer, which protects Earth from harmful ultraviolet radiation. The Copernicus Sentinel-5P satellite has played a crucial role in monitoring the ozone layer, providing timely data on ozone levels and the annual development of the ozone hole, which typically reaches its maximum size between mid-September and mid-October. This year's ozone hole over Antarctica was reported to be around 23 million square kilometers, larger than 75% of comparable holes since 1979, driven by a stable polar vortex that maintained cold temperatures. Future satellite missions, like the upcoming Altius mission in 2025, will enhance our understanding of ozone recovery by providing vertical profiles of ozone and other trace gases, supporting ongoing efforts to monitor atmospheric health and long-term climate trends. 34)
• March 15, 2021: In early 2020, satellite data revealed a significant decline in air pollution, particularly nitrogen dioxide levels, coinciding with global lockdowns aimed at curbing the spread of COVID-19. The first lockdown in China set off similar measures worldwide, leading to reduced industrial activity and traffic, which were reflected in decreased air pollutants detected by the Copernicus Sentinel-5P satellite's TROPOMI instrument. However, by February 2021, as restrictions eased, nitrogen dioxide levels rebounded to pre-COVID figures in major cities like Beijing and Chongqing, with increases expected to continue in Europe and beyond. Claus Zehner, the mission manager for Sentinel-5P, noted that while weather conditions also influence air quality, the resurgence of nitrogen dioxide is primarily linked to the resumption of human activities. The satellite's advanced capabilities enable detailed monitoring of various atmospheric trace gases, underscoring its role in assessing air quality and public health. 35)
• March 4, 2021: For the first time, scientists have utilized satellite data from the Copernicus Sentinel missions to detect individual methane plumes leaking from natural gas pipelines globally. Methane, a potent greenhouse gas with a climate impact significantly greater than carbon dioxide, is primarily emitted by the energy sector, which released over 70 million tons in 2020. A European technology start-up, Kayrros, developed a tool to accurately track these emissions using data from Sentinel-5P and Sentinel-2 missions, identifying 13 significant methane events along the Yamal-Europe pipeline and 33 along the Brotherhood pipeline between 2019 and 2020. The number of detected emission events increased by 40% in Russia from 2019, despite reduced gas exports due to the COVID-19 pandemic. Many emissions occur during routine maintenance, which could be mitigated through alternative practices. Kayrros estimated that the venting observed during this period released methane equivalent to approximately 3 million tons of carbon dioxide, highlighting the need for improved operational practices to reduce greenhouse gas emissions. The collaboration showcases how advanced satellite technology can provide critical insights for climate action. 36)
• December 14, 2020: Scientists have successfully utilized satellite data from the Copernicus Sentinel-2 mission in conjunction with the Sentinel-5P satellite to detect individual methane emissions from space, a significant advancement in tracking this potent greenhouse gas. Methane, while less abundant than carbon dioxide, is far more effective at trapping heat and primarily originates from sources like landfills, livestock farming, and the fossil fuel industry. Previously, attributing methane emissions to their sources was challenging due to limitations in spatial resolution. However, a European technology start-up, Kayrros, developed a tool that combines data from both Sentinel satellites, enabling accurate detection and quantification of methane leaks. This capability was demonstrated in September 2020 when a leak in the Permian Basin was identified, revealing that it had begun on July 4 and emitted between five and 20 tonnes of methane per hour over its duration. This innovative approach marks a major breakthrough for methane monitoring and aligns with the European Commission's Methane strategy, facilitating ongoing surveillance of oil and gas production areas worldwide. 37)
• November 9, 2020: For the first time, scientists have successfully utilized data from the Copernicus Sentinel-5P satellite to detect nitrogen dioxide emissions from individual ships from space, a significant advancement for monitoring maritime pollution. Maritime transport significantly impacts air quality in coastal cities, with shipping emissions estimated to cause around 400,000 premature deaths and 14 million childhood asthma cases annually. Efforts to regulate these emissions have intensified, including a global reduction in sulphur dioxide content in ship fuels since January 2020. Previously, satellite measurements required aggregation over long periods, limiting their utility for regulatory enforcement. However, an international research team has discovered patterns in ‘sun glint’ data—reflected sunlight off the ocean surface—allowing for the identification and attribution of emissions from individual ships. By combining these observations with ship location data, researchers were able to match emission plumes to specific vessels, particularly larger ships. This breakthrough opens new avenues for monitoring ship emissions and supporting environmental regulations, with future satellite missions expected to enhance the detection capabilities further. 38)
• October 19, 2020: This year's ozone hole over Antarctica has reached its maximum size of approximately 25 million km², as measured by the Copernicus Sentinel-5P satellite, making it one of the largest and deepest in recent years. The ozone hole typically grows from August to October, with maximum size occurring between mid-September and mid-October; however, this year's hole is notable for its rapid expansion and record-low ozone values, reaching close to 100 Dobson Units. The variability in size is influenced by strong wind bands around Antarctica, which can isolate polar air masses and enhance cooling. While the ozone hole phenomenon does not directly indicate global ozone levels, it underscores the impact of chlorofluorocarbon emissions in previous decades, leading to the Montreal Protocol's establishment in 1987, which has contributed to the recovery of the ozone layer. Scientists predict that with continued reductions in ozone-depleting substances, the global ozone layer may return to its normal state by around 2050. The Sentinel-5P satellite, launched in 2017, plays a crucial role in monitoring atmospheric gases and pollutants, enhancing our understanding of ozone dynamics from space. 39)
• September 18, 2020: Air pollution is a major environmental concern, contributing to one in eight deaths in Europe, as highlighted by a recent European Environment Agency (EEA) report. The Copernicus Sentinel-5P satellite has been instrumental in monitoring nitrogen dioxide concentrations across the continent, particularly during the COVID-19 lockdowns, which resulted in a significant reduction of air pollution—by 40-50% in southern Europe during the initial lockdowns. Research by scientists from the Royal Netherlands Meteorological Institute (KNMI) and the Royal Belgian Institute for Space Aeronomy (BIRA-IASB) indicates that while the impact of meteorology must be considered, the satellite data aligns well with ground-based measurements, enhancing the understanding of air quality changes. Notably, nitrogen dioxide levels dropped significantly in industrialized regions during lockdowns, primarily due to reduced traffic and industrial activities, though they returned closer to pre-pandemic levels by mid-2020. The Sentinel-5P satellite, equipped with the advanced TROPOMI instrument, provides accurate and high-resolution data on air pollutants, underscoring its role in ongoing air quality assessments in Europe. 40)
• September 17, 2020: The Copernicus Sentinel-5P satellite's high revisit rate, combined with GHGSat's high-resolution commercial imagery, is poised to aid landfill operators and regulators in reducing methane emissions, a significant greenhouse gas of growing concern. As the EU prepares to release a Methane Strategy targeting uncontrolled emissions from landfills, accurate measurements of methane concentrations are critical for identifying sources and implementing mitigation strategies. Collaborating with Benito Roggio Ambiental (BRA) and the Netherlands Institute for Space Research (SRON), scientists are leveraging Sentinel-5P data to guide GHGSat's high-resolution satellites, including the recently launched Iris, to measure emissions from individual waste management facilities. This collaboration aims to enhance the monitoring of methane emissions globally, enabling cost-effective inspections, emissions screening, and gas recovery opportunities. As the project progresses, BRA looks forward to integrating GHGSat's data into their operations to improve landfill gas management, while ESA supports research by making a portion of Iris's data available for studies related to waste management and other applications. 41)
• July 29, 2020: Monitoring methane emissions is crucial for combating climate change due to its significantly higher global warming potential compared to carbon dioxide. GHGSat, leveraging data from the Copernicus Sentinel-5P satellite, has developed its Claire satellite to map methane hotspots and has collected over 60,000 measurements of industrial facilities worldwide. While Sentinel-5P provides broad atmospheric data, GHGSat's Claire can pinpoint methane emissions at specific sites, helping industries like oil and gas, waste management, and agriculture address leaks and implement corrective actions. The Oil & Gas Climate Initiative (OGCI) has recognized the effectiveness of GHGSat's monitoring capabilities, investing in the initiative. GHGSat plans to expand its fleet with a constellation of satellites, including the upcoming Iris satellite, which will improve resolution to 25 meters, enhancing leak detection accuracy. As demand for analytics services grows, GHGSat aims to provide tailored solutions for asset managers focused on environmental, social, and governance (ESG) factors, while a partnership with ESA and the Canadian Space Agency will ensure that a portion of Iris's data is available for research purposes. 42)
• July 9, 2020: Every summer, the Sahara Desert sends vast amounts of dust across the Atlantic Ocean, forming the Saharan Air Layer, which peaks between late June and mid-August. This year, a particularly large and dense dust plume, referred to as ‘Godzilla,’ has been observed using data from Copernicus Sentinel satellites and ESA's Aeolus satellite. The plume is noted to be 60–70% dustier than average, making it the dustiest event recorded in two decades. Aeolus provides crucial information about the altitude and vertical extent of the dust layer, which aids air quality models in predicting its movement and effects. While this dust poses health risks and can cause air quality alerts, it also serves important ecological functions, such as supplying essential nutrients for phytoplankton and replenishing rainforest soils in the Amazon. Furthermore, the dry air from the dust layer can inhibit the development of hurricanes by disrupting the warm, humid conditions necessary for their formation. 43)
• July 1, 2020: Between April 2019 and April 2020, concentrations of sulfur dioxide in polluted areas of India decreased by around 40%, as shown by new maps produced using data from the Copernicus Sentinel-5P satellite. This decline is largely attributed to reduced human and industrial activity during the COVID-19 lockdown, which began on March 25, 2020. Historically, India has been the world’s largest emitter of anthropogenic sulfur dioxide, mainly from fossil fuel power plants, contributing to significant air pollution and health issues. The analysis utilized data from the TROPOMI instrument on the Sentinel-5P satellite, aided by an improved algorithm from the Royal Belgian Institute for Space Aeronomy, enhancing sensitivity and accuracy in detecting emissions. The results indicate substantial drops in sulfur dioxide levels over major cities like New Delhi and near large coal-fired power plants, although some plants in northeastern states continued operations. This development promises to improve the monitoring of sulfur dioxide emissions and support efforts to verify existing emission inventories. 44)
• June 11, 2020: A new online platform has been launched for tracking global air pollution, utilizing data from the Copernicus Sentinel-5P satellite to display averaged nitrogen dioxide concentrations through a 14-day moving average. This platform allows users to visualize changes in nitrogen dioxide levels over time and zoom into specific cities or regions, particularly across Europe. Nitrogen dioxide, a pollutant from power plants and vehicles, poses health risks, making such monitoring essential. The Sentinel-5P satellite, equipped with the advanced TROPOMI instrument, provides high-resolution images of atmospheric gases, facilitating accurate air quality assessments. The mapping service is part of the Sentinel-5P Product Algorithm Laboratory (S5P-PAL), funded by the European Commission, and is designed for efficient product development and global mapping. Additional functionalities, including tracking carbon monoxide and enabling time-series analysis, are in the works, with the platform also contributing to the 'Rapid Action on Coronavirus and Earth observation' (RACE) dashboard to monitor the environmental impact of COVID-19 lockdowns. 45)
• June 1, 2020: GHGSat, a Canadian company, has partnered with the Sentinel-5P team at SRON Netherlands Institute for Space Research to monitor methane emissions during the COVID-19 pandemic, highlighting methane's potency as a greenhouse gas, being about 30 times more effective at trapping heat than carbon dioxide. Utilizing data from Sentinel-5P to detect global emissions and GHGSat satellites to quantify them at specific facilities, the collaboration has uncovered new methane hotspots, such as those over a coal mine in China and the Permian Basin in the U.S. Despite a reported increase in methane concentrations in 2020 compared to 2019, the results remain inconclusive due to limited observations from Sentinel-5P. The teams continue to analyze how COVID-19 impacts emissions, emphasizing the need for high-resolution measurements for accurate facility attribution. GHGSat plans to launch additional satellites to enhance monitoring capabilities, and ESA, in collaboration with the Canadian Space Agency, is offering 5% of the upcoming Iris satellite's measurement capacity for scientific research. The Sentinel-5P satellite, equipped with the TROPOMI instrument, also maps other air pollutants, further contributing to the understanding of air quality. 46)
• May 4, 2020: A new tool to combat climate change, developed by the European technology start-up Kayrros, utilizes data from the Copernicus Sentinel-5P satellite to monitor and attribute methane emissions globally. Methane, the second most significant greenhouse gas, is currently increasing in the atmosphere at approximately 1% per year and has a greater heat-absorbing capability than carbon dioxide. By integrating Sentinel-5P data with ground sensor data, position tracking, and social media information, Kayrros can accurately identify the location, potency, and size of methane leaks worldwide, revealing around 100 high-volume leaks at any given time, with about half originating from oil, gas, and heavy industrial activities. This technology, highlighted in the International Energy Agency's recent Methane Tracker, enables real-time detection of emissions, offering a substantial improvement over previous engineering estimates and potentially transforming climate policy by allowing governments to establish accurate baselines for methane emissions and make informed decisions regarding energy policies. 49)
• April 25, 2020: A recent study published in *Science Advances* has revealed that oil and gas operations in the U.S. Permian Basin are emitting methane at twice the rate found in 11 other major oil and gas regions, as analyzed by scientists from the Environmental Defense Fund (EDF), Harvard University, Georgia Tech, and the SRON Netherlands Institute for Space Research. Utilizing 11 months of satellite data from the European Space Agency's TROPOMI instrument, the research covered 200,000 individual readings across the 160,000 km² basin, revealing that methane losses from these operations account for 3.7% of their gas production, enough to supply 2 million U.S. households. Co-author Dr. Steven Hamburg emphasized the significant contribution of these emissions to climate change, nearly tripling the 20-year climate impact of the gas produced, and highlighted the growing capability of satellite technology in tracking emissions to provide essential data for regulators and companies to address this issue. 50) 51)
- The study also underscores the advantages of using satellites for methane measurement, as they can cover vast areas more quickly and frequently than conventional methods, offering insights into gas-producing regions that are otherwise inaccessible. The TROPOMI instrument, launched in 2017, provides higher precision and better coverage, contributing to an emerging ecosystem of methane-tracking satellites. The findings validate recent ground-based measurements by EDF's PermianMAP initiative, indicating methane escaping at a rate of 3.5% in the most productive part of the basin. High leakage rates in the Permian present opportunities for significant emissions reductions through improved infrastructure, operations, and regulation. As researchers work to automate data analysis processes, future projects like MethaneSAT are expected to deliver near-real-time data on methane emissions, enhancing the ability of stakeholders to track and compare progress in reducing emissions globally.