HORYU-2 (High Voltage Technology Demonstration Satellite-2)
EO
Multi-purpose imagery (ocean)
Multi-purpose imagery (land)
Other
Quick facts
Overview
| Mission type | EO |
| Agency | KIT |
| Mission status | Operational (nominal) |
| Launch date | 17 May 2012 |
| Measurement category | Multi-purpose imagery (ocean), Multi-purpose imagery (land) |
| Instrument type | Other, Communications, Data collection, Lightning sensors |
| CEOS EO Handbook | See HORYU-2 (High Voltage Technology Demonstration Satellite-2) summary |
HORYU-2 (High Voltage Technology Demonstration Satellite-2)
HORYU-2 is a student-built technology demonstration mission of Kyushu Institute of Technology (KIT), Fukuoka, Japan. KIT is located in Kitakyushu region, about 1000 km southwest of Tokyo. 1) 2)
Note: The name HORYU comes from the symbol of Kyushu Institute of Technology. The launch of HORYU-1 was postponed in 2010 when the launch of HORYU-2 was announced by JAXA. HORYU-1 is now in storage at KIT. The HORYU-2 nanosatellite is a successor project of the HORYU-1 CubeSat project. 3)
The HORYU-2 nanosatellite has the following mission objectives: 4)
1) The development of the HORYU-2 nanosatellite is a graduate school educational program of KIT (Kyushu Institute of Technology). The goal is to obtain hands-on experience through system engineering.
2) On orbit demonstration of the nanosatellite bus technologies.
3) To safely generate a 300 V photovoltaic power in LEO (Low Earth Orbit) as a high-voltage technology demonstration. This is the primary goal of the mission. If successful, it will be the first high voltage level demonstration in the world.
Actually, the primary goal of the HORYU-2 is very apt for a small nanosatellite mission. It becomes more problematic to be implemented on a larger spacecraft, due to the risk of an electrostatic discharge that might occur during the mission, thereby jeopardizing the mission success of the other payloads.
4) Contributing to the local educational program for elementary and junior high school students through HORYU-2 ground communications and the distribution of Earth surface imagery.
Spacecraft
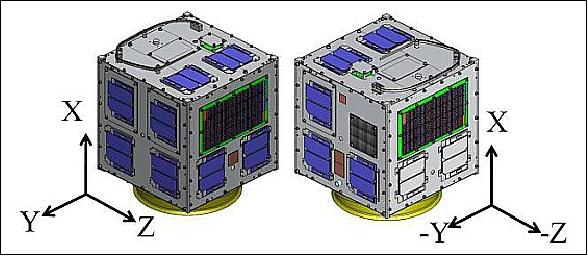
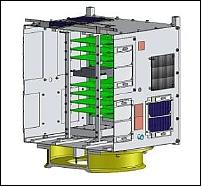
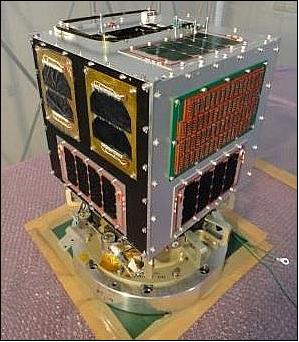
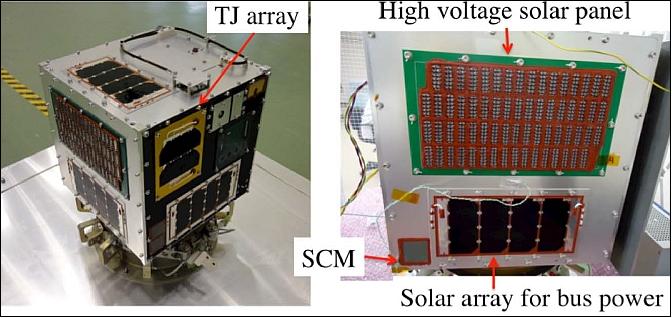
The external structure of HORYU-2 is shown in Figure 1 with a size of 350 mm x 310 mm x 315 mm (almost a cubic structure) and a launch mass of ~ 7.1 kg. The nanosatellite is designed with an area of mass (0.0186 m2/kg) that is sufficiently large to meet the de-orbit requirement within 25 years after launch. The internal structure of HORYU-2 is shown in Figure 2. The electronic boards of the mission and the bus systems are arranged in the center of a satellite. Each board is electrically connected by the bottom board located at the –Z side.
The STM (Structure Thermal Model) went through the required set of vibration tests specified by the H-IIA (JAXA launcher) users manual. It was confirmed that the lowest natural frequencies of the structure satisfies the requirement. No structural damage was observed after the tests, nor any sign of chattering of the separation switches. Due to the small spacecraft mass, its thermal capacity of the satellite is very small, posing a risk of going to very low and high temperatures in orbit. These parameters have been checked by an analysis (Figure 6).
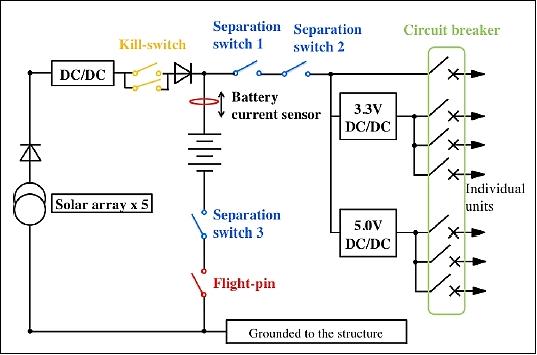
EPS (Electrical Power Subsystem)
Double junction thin film solar cells are used to provide electric power of 3.6-4 W. There are four other types of solar cells on HORYU-2: the 300 V solar array, the film solar array, the semi-conductive coating solar array, and the conventional design solar array. These four solar cell types are not used to provide the satellite power. They are separated from the bus power system and used only for the technology demonstration missions. - A NiMH (Nickel-Metal Hydride) battery is used for power storage. The rated voltage is 1.2 V. Three batteries are connected in series providing 3 parallel circuits. The voltage rating is 3.6 V and the stored power is 4200 mAh.
OBC (On-Board Computer)
The OBC consists of two H8 processors (they monitor each other). The main H8 is in charge of task management, such as operation of all the mission instruments, data conversion, and time management; the COM-H8 is in charge of the RF communication subsystems, such as CW transmission and FM reception. The main H8 has an oscillator for RTC (Real Time Clock), and makes a clock by this pulse. 5)
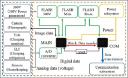
The flash memories for data storage are connected to main-H8 by SPI (Serial Peripheral Interface) transmission line. The mission data and sensor data are stored to the flash-main. The flash-share is used to relay the downlink data to COM-H8. All of the operations of mission apparatus and FM transmission are performed by commands from the ground.
RF Communications
The radio transmission mode of HORYU-2 is CW (beacon) transmission and FM transmission. The CW transmission mode provides the sensor data of the satellite health monitoring, such as power, temperature, and attitude to the ground station via the Morse code. The FM transmission mode transmits more detailed satellite information and mission data via FM packets (Ref. 5).
Parameter | CW transmit | FM transmission and reception | |
Transmission | Reception | ||
Transmission speed | 20 wpm | 1200 bit/s | |
Protocol | - | AX.25 | |
Modulation | - | FSK | |
Frequency band | UHF (437.375MHz) | UHF (437.375MHz) | VHF (144 MHz) |
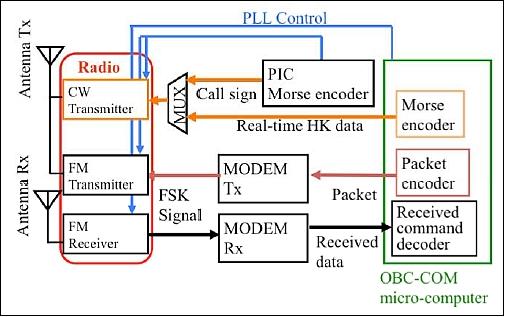
Figure 5 shows a system block diagram of communication subsystem. The PIC microprocessor generates the call sign and sends it to CW (Continuous Wave) transmitter. After the call sign is sent, PIC controls the multiplexer so that COM and the CW transmitter are connected. COM converts the real-time housekeeping data given by MAIN to Morse signal and sends it to the CW transmitter. CW transmitter is shared by COM and PIC. The multiplexer is governed by PIC, which means the project trusted PIC over COM(H8). The PIC is used for the call sign to prepare for an emergency case, where anomaly occurs on OBC. Even if something goes wrong with OBC, the satellite keeps sending the call sign so that we won’t lose the satellite. During the anomaly in orbit, this contingency mode worked and the project was able to track the satellite.
Spacecraft mass, size | 7.1 kg, 350 mm x 310 mm x 315 mm (X×Y×Z) |
Operational life time | 1 year |
Solar cells | 5 parallel strings of 4 series connected dual junction GaAs solar cells |
Battery | 3 parallel of 3 series, 1.2 V, 1900 mAh (Ni-MH), total capacity=5700mAh |
Power consumption | - Normal operation mode (CW only) = 1.13 W |
RF radio | Nishi-musen 301A |
Transmission power | ~1W |
FM Protocol & modulation | AX.25 & FSK |
Frequency | Uplink = 145 MHz, downlink = 437.375 MHz |
Data transmission rates | FM communication = 1200 bit/s, CW communication (beacon) = 20 wpm |
Attitude control | Passive control via permanent magnet and hysteresis dumper |
Thermal control | - Passive thermal control on the external surfaces |
Sensors | - Solar cell voltage & current |
Primary demonstration experiments | - 300 V photovoltaic power generation in LEO |
Auxiliary demonstration experiments | Demonstration of electron-emitting film (ELF) |
Demonstration of COTS (Commercial-off-the-Shelf) surface potential monitor, TID (Total Ionized Dose) experiment, and SEE (Single Event Effect) experiment. | |
Demonstration of debris sensor | |
Taking imagery of Earth's surface and distribution of the images for outreach |
Launch
The HORYU-2 nanosatellite was launched as a secondary payload on May 17, 2012 (UTC). The launch vehicle was the H-IIA of Japan, and the launch site is TNSC (Tanegashima Space Center), Japan. The primary payload on this flight was GCOM-W1 (Global Change Observation Mission-Water) of JAXA (nicknamed Shizuku) with a mass of ~1990 kg. 7)
The secondary payloads on this flight are: 8)
• KOMPSAT-3 (Arirang-3) of KARI (Korea Aerospace Research Institute) with a launch mass of 970 kg, Korea. KOMPSAT-3 is regarded as a co-payload in this flight.
• SDS-4 of JAXA, Japan with a mass of ~ 48 kg
• HORYU-2 of KIT, Japan with a mass of 7.1 kg.
Orbit: Sun-synchronous orbit, altitude of ~680 km, inclination = 98.19º, LTAN (Local Time on Ascending Node) at 13:30 hours.
Mission Status
• The HORYU-2 nanosatellite suffered an anomaly due to a single event latchup event for a month from June 5 to July 3, 2012. During this period, no experimentation could be done. 9)
- Based on the anomaly investigation including various ground tests, the authors judged that a single event latch-up (SEL) due to radiation was the most probable cause. SEL occurred on two microprocessors. When the second SEL occurred, the battery was depleted due to the increased current consumption. The battery’s depletion reset HORYU-2, and the satellite could be restored to its original condition. The lessons of HORYU-II suggest the needs of an environmental testing standard to improve the satellite reliability, especially at the early phase of operation in orbit.10) 11)
- The nanosatellite experienced a further latchup in December 2012 and is currently (April 2013) transmitting only a beacon signal. 12) 13)
- Prior to December 2012, several experiments were carried out.
Experimental Results
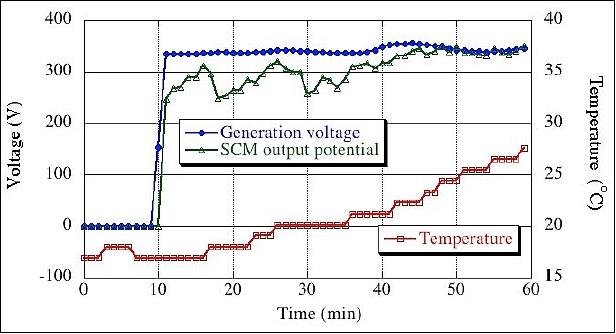
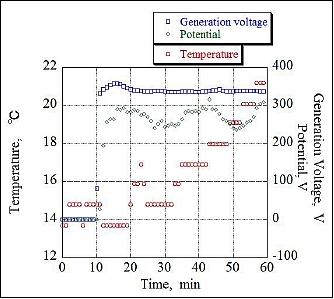
Figure 8 shows the results of the high-voltage experiment. The experiment commenced at 16:52 on Nov. 28, 2012 (UT) over New Guinea. The satellite exited the eclipse over Antarctica 10 min after the start of the experiment. It crossed the equator from south to north and the experiment was terminated over Canada at 17:52 Nov. 28, 2012 (UT). In Figure 8, the circle indicates the power generation voltage and the triangle indicates the SCM (Surface Charging Monitor) output potential. The rectangle indicates the temperature of the circuit board. The temperature data show a gradual increase in satellite temperature after the conclusion of the eclipse. All the data were taken at 1minute intervals. 14)
The maximum generation voltage was about 356 V at approximately 45 min, corresponding to the breakdown voltage of the zener diode. The SCM output potential initially shows a fluctuation between 250 and 310 V. The satellite rotation speed was less than 1º/s. The minimum resolution was 1º/s. Therefore, it is possible that the SCM output reflected the rotation of the satellite and dropped when the SCM faced the wake direction. The sampling rate of the satellite housekeeping data related to its attitude was limited to 1 sample every 10 minutes. In Figure 8, the limited data show no sign of the SCM receiving sunlight during the initial 40 minutes. After 45 minutes, the SCM output was closely matched with the power generation voltage, indicating that the experimental ground floated negatively at a voltage close to the power generation voltage. The combination of plasma density, satellite attitude, solar illumination, the presence of precipitation electrons, and other factors determines the charging of the surface insulator and the experimental ground. Due to the limited resources of the satellite, the project has little information about those parameters. The purpose of this Technical Note is to make a quick report on the world’s first 350 V power generation in space. The project will accumulate more experimental data to investigate the exact reason for the charging behavior of the experiment ground and present the results in the future.
The nanosatellite HORYU-II achieved the highest photovoltaic power generation in orbit, at 350 V, breaking the previous record from the ISS, at 160 V, by more than a factor of two. This high-voltage experiment is suitable for a micro-/nanosatellite where the high risk associated with the use of high voltages is acceptable.
The high-voltage solar array developed for HORYU-2 is suitable for other scientific experiments that make use of high voltages, such as electric propulsion, spacecraft charging, etc. onboard a micro-/nanosatellite. It is free from the electromagnetic noise associated with high-voltage DC/DC converters and robust enough to operate for a short time (HORYU-2 has already been operating high voltage solar arrays for more than 50 hours) in orbit. The experiments onboard HORYU-2 are still ongoing, including an experiment to demonstrate the effectiveness of arc mitigation design solar arrays. After enough data has been accumulated, those results will be presented in the future.
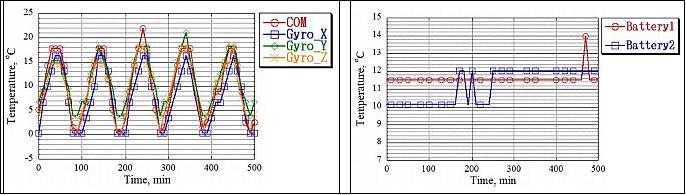
• The on-orbit temperature data of HORYU-2 is shown in Figures 9 and 10. This is the temperature data after July 7 , 2012; the attitude of HORYU-2 is stable. The temperature of external panels was measured in the center of the panel. Although the period of the temperature change for all components fundamentally matches with the orbital period, it is difficult to find a periodicity of temperature change in the Y and Z panels. Especially, a temperature change of the Y panel coated with the black paint is random. In the X panels, the temperature of the -X panel did not easily change compared with +X panel. The -X panel side is heavier than the +X panel side, because the -X panel side has the frame for the separation attachment. With the increased of weight of –X side, the heat capacitance of the -X side is larger than that of the +X side. 15)
As a result, the thermal response of -X side seems to be not fast relative to –X side. Actually, the range of temperature variation for ±X panels is almost same. From this result, we expect that the heat input to -X panel is larger than to +X panel. With respect to the inside temperature of HORYU-2, the temperature range was stable between 0 and 18ºC and was within the operating temperature of onboard equipments. This result shows that the thermal design of HORYU-2 is appropriate. The temperature of the battery is measured by two adjoining sensors and is also stable between 10 and 12ºC.

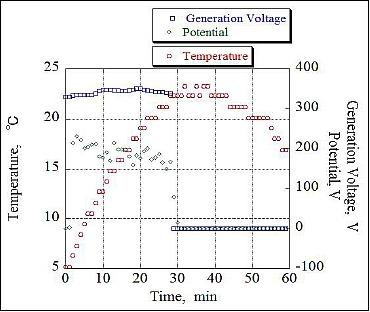
• On July 8, 2012, HORYU-2 successfully demonstrated for the first time a 300 V power generation test on orbit. The result of the 300 V photovoltaic voltage generation during one-hour operation is shown in Figure 11. 16) 17)
The generation voltage is above 300 V. Therefore, it is confirmed that HORYU-2 successfully generated the highest photovoltaic voltage in space, for the first time in the world. However, the potential measured by the SCM (Surface Charging Monitor) was only near 200 V. The following points are considered as possible reasons to the difference (Ref. 16):
- The SCM capacitance is large and the plasma density was very low.
- The SCM may have been at the wake side of the satellite.
So far, not all mission modes have been demonstrated, such as arc detection on nominal design solar cells, the Trek potentiometer, and the debris experiments.
• Shortly after launch, amateur stations around the world reported a reception of the CW beacon on 437.375 MHz. 18)
Experiment Complement
The primary goal of HORYU-2 is to demonstrate new solar array designs that can generate power, free of ESDs (ElectroStatic Discharges), by producing 300 V via a specially designed solar array itself, not via a conventional DC/DC converter. If successful, HORYU-2 will become the first spacecraft in the world that achieved 300 V photovoltaic power generation in space. 19)
High Voltage Technology Demonstration and Ground Test Verification
Background
The application spectrum of some future missions in planning is getting larger and so is their power level requirement. The use of high-power requires in turn high-voltage photovoltaic generation to reduce the losses in the onboard power transmission lines. At high bias voltage, however, severe interaction occurs between the spacecraft and the ionospheric plasma, making the conductive surfaces highly negative with respect to the surrounding plasma potential.
So far, the highest voltage generation level in a LEO spacecraft is installed in the ISS (International Space Station) mission at a nominal generation voltage of 160 V (transmission voltage of 120 V). On orbit, in particular in LEO missions, high-voltage (> 200 V) systems generally induce ESDs resulting in power failures or a complete destruction of a system. The most spectacular form of an ESD is the spark (arcing), which occurs when a heavy electric field creates an ionized conductive channel in air.
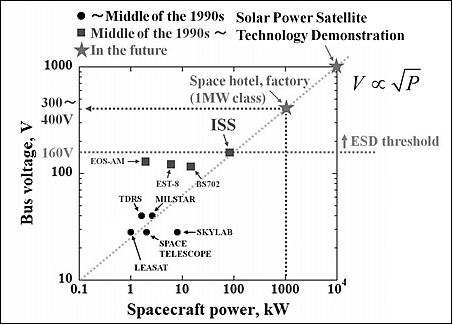
Figure 14 presents the power levels and the bus voltages of some past spacecraft and of future missions. The spacecraft with the highest voltage generation installed in LEO is the ISS mission (100 kW-class), generating 160 V. A future 1 MW-class spacecraft will require a voltage of about 300 - 400 V. However, as the voltage exceeds 200 V in LEO, the probability of arcing increases dramatically, which was the reason why NASA limited the voltage of ISS to 160 V. In the future, larger space systems such as a space hotel, a space factory and a technology demonstration of solar power satellite will require the high-voltage technologies to operate at a voltage higher than 160 V.
Charging and Discharging Mechanisms in LEO
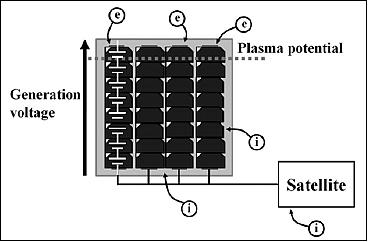
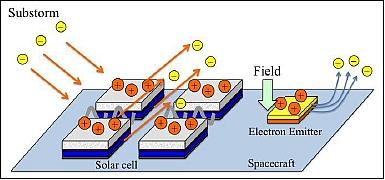
The plasma density in LEO is generally in the range of 109 to 1012 m-3. The interaction between the high-voltage solar array and the ionospheric plasma leads to charging. The spacecraft collects electrons and ions from the ambient plasma (Figure 15).
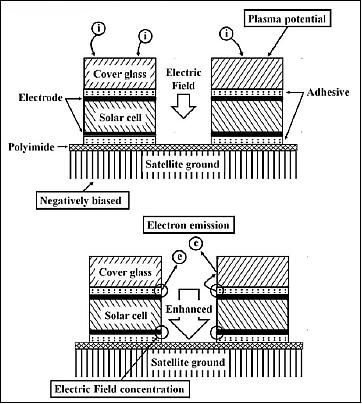
Since the potentials of dielectric surfaces, for example coverglass, are almost equal to the ambient plasma, a strong electric field is formed between the metallic surface and dielectric surface near triple junction solar cells as shown in Figure 16. This strong electric field induces EFEE (Enhanced Field Electron Emission). EFEE enhances the electric field, providing a positive feedback mechanism. This finally leads to an ESD.
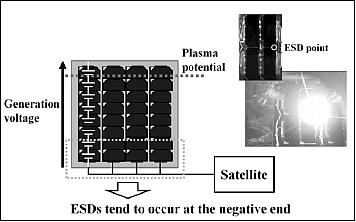
ESDs tend to occur at the negative end of the solar arrays because the end has the most negative potential (Figure 17). A discharge image acquired in a ground testing is shown in Figure 17.
The High-Voltage (300 V) Array of HORYU-2
In the HORYU-2 mission, the high-voltage array is used not for orbital demonstration itself, nor as a power supply to the satellite bus system, but for the purpose to create a discharge environment. Figure 18 provides an illustration of the high-voltage (300 V) array.
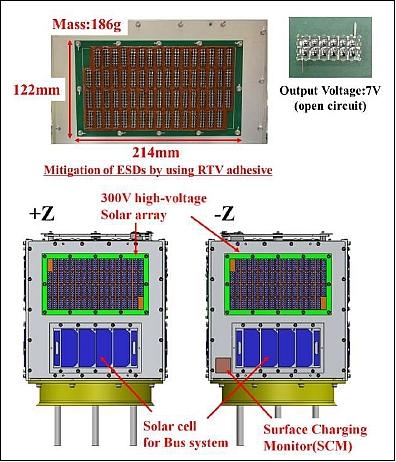
The solar cell array size is 122 mm x 214 mm and the mass is 186 g. Conductive surfaces of the 300 V high-voltage array are covered with RTV (Room Temperature Vulcanization) adhesive to prevent arcing. At thermal cycle test, simulating thermal environment of LEO (-100 to +70ºC, 15 cycles, N2 atmosphere) showed no crack in the RTV adhesive.
The high-voltage solar array consists of spherical solar cells made by Kyosemi Co., Ltd. The generation voltage per spherical solar cell F12 module (spherical cell module) is approximately 7V (open circuit voltage, room temperature). HORYU-2 mounts two high-voltage solar arrays connected in series. The high-voltage solar arrays are mounted on each panel symmetrically as shown in Figure 19. Each high-voltage solar array consists of 66 spherical cell modules in series. If all modules generate at the open circuit voltage, the maximum generation voltage of this high-voltage array is approximately 900 V. The high-voltage solar array was designed to have sufficient margin against partial breakages at launch, degradation due to thermal cycle and other environmental factors. Note that the generation voltage of the high-voltage solar array is regulated up to 350 V by Zener diodes.
Mass, size | 108 g, 92 mm x 113 mm |
Supply voltage | 5 V |
Dissipation | 2.3 W |
Operating temperature range | -20ºC to +60ºC |
CPU | PIC16F877A |
Number of ADCs (Analog Digital Converters) | 5 |
Resolution of ADCs | 8 bit |
Measurement rage of ADC | 0 - 4.096 V |
Number of arcing detection circuits | 2 (three redundant) |
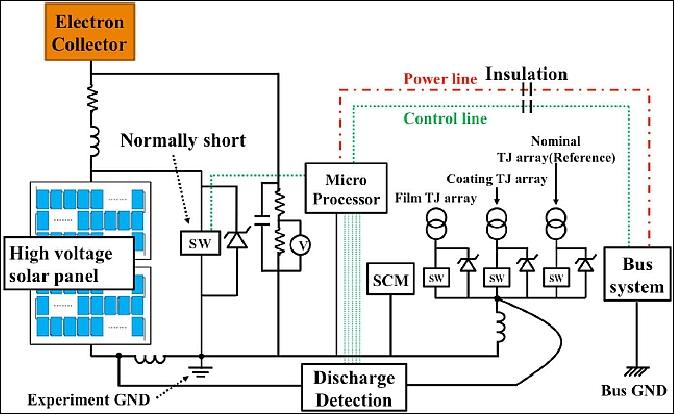
The mission payloads related to high-voltage and discharge are completely insulated from the bus system for safety reasons. An insulated DC/DC convertor is used as the power supply and magnetic couplers are inserted in the control signal transmission line.
After receiving test commands from the onboard computer of the bus system, the 300 V system CPU turns on the short-circuited switch connected parallel to the high-voltage solar array. Then, the high-voltage solar array starts generating as they are illuminated by the sunlight. During the test, the AD convertors of the 300 V system CPU measure the photovoltaic generation voltage, the potential of the 300 V system and the board’s temperature.
The SCM (Surface Charging Monitor) is used for the measurement of the potential. The SCM is based on a surface charging sensor developed by Lockheed Martin and the Jet Propulsion Laboratory, which has already been flown in space. The SCM is composed of flour-polymer resin over a copper substrate. The SCM measures the voltage across the flour-polymer resin and the ground (300 V system ground) via division of capacitances. Since both the surface of the flour-polymer resin and an electron collector are almost equal to the plasma potential, the potential of the 300 V system is acquired by the measurement of the voltage between the surface and the ground of the 300 V system.
To evaluate the tolerance against the space environment of state-of-the-art arcing mitigation methods, the project used three types of solar array as test specimen. Each solar array consists of two series-connected conventional GaAs/InGaP/Ge multi-junction solar cells. One [nominal TJ (Triple Junction) array] of the solar arrays is used as a reference and free of the arcing mitigation method. Two (film TJ array and coating TJ array) of the solar arrays, on the other hand, are arranged for each arcing mitigation. The TJ arrays are connected via the switches (MOSFET, for biasing) to the negative end of the high-voltage solar array, where arcs tend to occur. Discharge test will be performed on each TJ array when the biasing switch is activated.
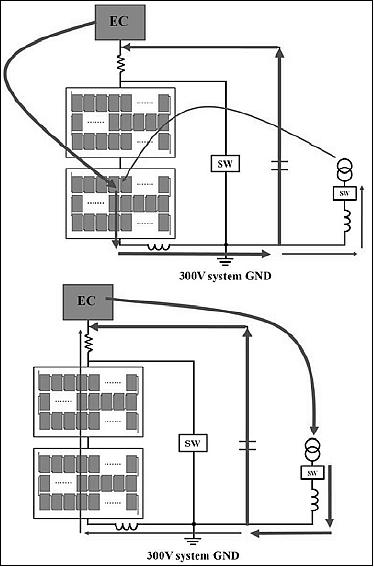
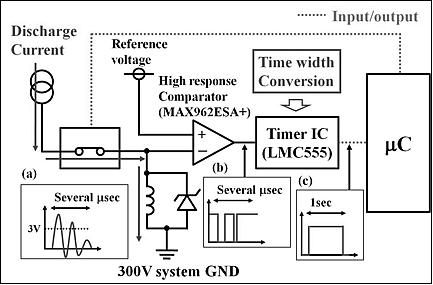
Figure 21 shows each current path of the arcing on the high-voltage solar array and the TJ arrays. Electrical charges stored in the capacitor basically flow from an arcing point to the electron collector via the ambient plasma. Arcing current induces a voltage across the inductor. An arcing detection circuit is triggered by this voltage and counts the number of arcs. Since the capacitance deciding a magnitude of arcing is very small for safety reasons, the time variation of arcing current (dI/dt) is detected by the inductor.
The design placed each inductor at the negative end of the high-voltage solar array and the end of the TJ arrays. However, even though arcing occurs on one of the arrays, the arcing current flows through both of the inductors. Under this condition, it is impossible to distinguish arcs on the high-voltage solar array from the TJ biased ones. In order to solve this problem, it is necessary to make sure that arcs will not occur on the high-voltage solar array. Therefore, the conductive surfaces of the high-voltage solar array were completely covered with RTV adhesive.
In addition, the project confirmed experimentally, that not any single arc had occurred on the high-voltage solar array for a duration of three hours in the plasma environment. Note, that the array after thermal conduction, vibration, and shock testing, was used in this test. - In orbit, the project must confirm initially that the arcs do not occur on the high-voltage array. In the next step, the TJ array will be biased. If arcs occur on the high-voltage array, this step will not be performed until the arc frequency on high-voltage solar array decrease to a significantly lower value.
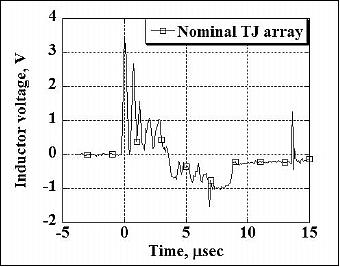
When the voltage across the inductor appears as shown in Figure 22(a), the high-response comparator will send a voltage waveform signal as shown in Figure 22(b). Since the output voltage repeats High/Low in periods of several microseconds (µs), the CPU of the 300 V system cannot detect the arcs. However, the timer IC can detect the waveform and convert to one pulse lasting one second as shown in Figure 22(c). Subsequently, the CPU of the 300 V system will detect the pulse and counts the number of arcs.
Arcing Mitigation Methods
The project selected two arcing mitigation methods: film and semi-conductive coating. During the mission, the evaluation of the tolerance against the LEO environment of the arcing mitigation methods will be performed as one of the objectives of the payload. The mechanism and the advantages of each mitigation method are as follows:
1) ETFE (Ethylene-Tetra Fluoro Ethylene) Film
The ETFE film covers the entire TJ array as shown in Figure 23. The film can isolate ions and mitigate charging at the side surface of coverglass near the triple junction. Wrinkles appear in the film as shown in Figure 23 due to the thermal cycle test (-100 to +70ºC, 15 cycles, N2 atmosphere). The film repeats expansion and shrinkage alternately under the thermal cycle environment. The film is fixed at the back of the TJ array not to tear due to the thermal cycle.

The ETFE film exhibits the following advantages
• It is not necessary to change the conventional solar array design. The arcing mitigation is realized just by covering the array with the film.
• No cracks can occur due to the thermal cycle, since the film does not stick to solar array.
• The arcing is stopped completely. No arcing on the solar array occurred in the ground tests, which were biased at 800 V.
2) Semi-conductive coating
Semi-conductive coating is sprayed on the entire TJ array surface, including the ground of the 300 V system. The coating releases charges stored on the front surface of coverglass to the ground (Figure 24). In addition, the coating can prevent concentration of electric field at triple junctions. The coating will be sprayed not to reduce the photovoltaic power generation efficiency of the TJ array.
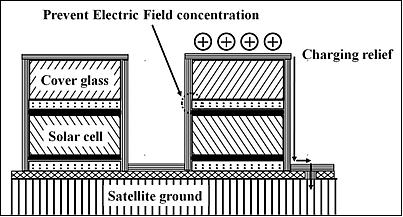
An advantage of the coating is that it is not necessary to change the conventional solar array design - as has to be done for the ETFE film. The coverglasses of scientific satellite were grounded by ITO coating to mitigate the charging completely. However, it costs enormously to ground each coverglass by hand. Semi-conductive coating, on the other hand, is expected to be sprayed only on the whole solar array after its manufacture. The coating leads to significant cost savings.
Plan for In-Orbit Testing of the High-Voltage Solar Array
The mission success requires that the high-voltage solar array provides a stable power generation of 300 V with no arcing. To fulfill the requirements, the generation voltage of the high-voltage solar array and the potential of 300 V system will be monitored. The measurements will be performed every minute as well as prior to an arcing event. In addition, the monitoring of arc detection will be performed every second. The arcing data will be saved only when an arcing event is detected.
There are three test modes as listed in Table 4. The test time is one hour for each test mode so that HORYU-2 is illuminated by the sunlight whenever the test starts. For the evaluation of the tolerance against the LEO environment of arcing mitigation, each TJ array will be biased in turn, and then the numbers of arcing will be compared among the three TJ arrays.
Mode | Biased array | Test time |
300 V generation mode | - | 60 minutes |
Nominal TJ array mode | Nominal TJ array | 60 minutes |
Film TJ array mode | Film TJ array | 60 minutes |
Discharge Tests of the Solar Array Performed on the Ground
The project performed the discharge tests under the simulated LEO environment to confirm that the mission payloads will operate nominally on orbit. The tests included the following verification requirements:
1) Measure the generation voltage of the high-voltage solar array
2) The array potential is measurable, when the 300 V system reaches a sufficiently negative potential (i.e., when the value is close to the generation voltage of the high-voltage array).
3) Monitoring of the 'no arcing condition' inside the satellite.
4) Monitoring of the 'no influence condition' on the bus system.
5) Monitoring of any arcing detection on the high-voltage solar array and the TJ arrays.
6) The CPU of the 300 V system must recover from a malfunction due to arcing.
7) Extensive verification of the effectiveness of the arcing mitigation measures.
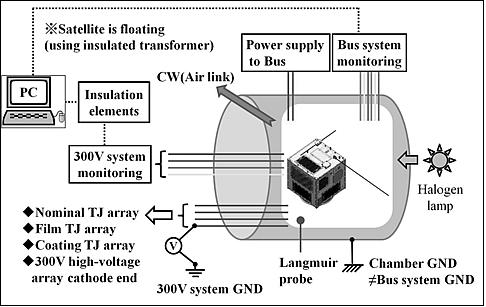
Test setup: Figure 25 illustrates the overall test configuration. The vacuum chamber was a cylinder made of stainless steel with 1.2 m in length and 1 m in diameter. Xe plasma was generated by an ECR (Electron Cyclotron Resonance) plasma source to simulate the LEO plasma environment.
The tests were conducted in an environment with the following parameters:
- Back pressure: 1 x 10⁻³ Pa
- Plasma density: 1.3 x 10¹² m-3
- Electron temperature: 1.0 eV.
Test Results
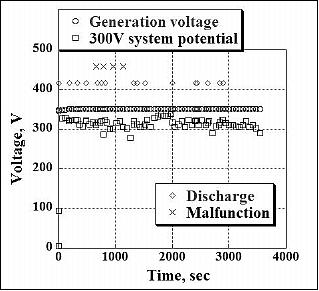
• Verification of requirements (1) and (2): Figure 26 shows the graph acquired by monitoring the 300 V system CPU on a PC. In this setup, the “300 V system potential” refers to the potential of the 300 V system with respect to the ambient plasma, which was in fact of a negative value. The project confirmed that the 300 V system CPU could normally measure the generation voltage and the potential. In addition, the negative potential was close to the generation voltage.
• Verification of requirement (3): Many arcs occurred in the satellite during the test. The project suspected that the place where arcs occurred was the 300 V system circuit board. When the circuit board was covered with polyimide sheet, the project was able to solve this problem. As a consequence, the flight model 300 V array system board will be covered with the polyimide sheet.
• Verification of requirement (4): The arcs of a relatively large scale level (the induced voltage across the inductor was > 5 to 6 V) led the 300 V system to a malfunction. The bus system, such as the OBC (On-Board Computer) and the CW communications system, however, did not experience any malfunctions at all. Hence, the project concluded that there was no influence on the bus system due to arcing.
• Verification of requirement (5): Figure 27 shows the waveform results of the arc on the nominal TJ array. When the waveform was acquired by the insulated oscilloscope, the arc monitoring circuit was able to detect the arc simultaneously, which was observed by monitoring the 300 V system CPU. Hence, the project concluded that the arc monitoring circuit worked nominally. In addition, the project confirmed that the monitoring circuit could detect the arc on the high-voltage solar array. When a simulated coupon, where an arc occurs easily, was connected with the cathode end of the high-voltage solar array, the project received the same waveform as in the nominal TJ array configuration; and the detection circuit could count the number of arcs.
• Verification of requirement (6): The arcs with the relatively large scale voltage level caused malfunctions in the 300 V system as described in the verification requirement (4). However, the project confirmed that the 300 V system CPU was able to recover from the malfunctions by reading the state prior to the arcing event from the flash memory, where the payload data and operating state were stored.
• Verification of requirement (7): Table 5 shows the results of the effectiveness of arcing mitigation. Each TJ array had been biased twice by the high-voltage solar array for one hour. There are arcs on nominal TJ array, while there was no arc on the film and coating TJ array. The project concluded that the ETFE film and the semi-conductive coating had the capability to mitigate arcing under a LEO plasma environment.
Configuration | Number of arcings encountered during the ground tests | Effectiveness | |
Nominal TJ array | 20 | 5 | Bad |
Film TJ array | 0 | 0 | Good |
Semi-coating TJ array | 0 | 0 | Good |
Auxiliary Demonstration Experiments
Demonstration of Electron-Emitting Film (ELF)
The ELF experiment aims at mitigation of spacecraft charging, especially charging of a satellite body with respect to the surrounding plasma (absolute charging). ELF phenomena have been studied at KIT for the past five years. The potential difference occurs between the satellite chassis and the insulator of the ELF by energetic electrons, such as aurora electrons. A strong electric field is developed at the conductor surface of the ELF near its triple junction by this potential difference. The charging is mitigated because electrons are emitted from the conductor surface (Figure 28).
When a satellite is charged, the electrons are automatically emitted from ELF. On HORYU-2, the electron current is measured. At the same time, the insulator surface potential is measured by a SCM (Surface Charging Monitor) to detect the change on the insulator potential due to the electron emission.
Demonstration of COTS Surface Potential Meter in Space (Trek)
This experiment demonstrates a surface potential meter in space. The potential meter has been developed by TREK Inc., aiming for terrestrial commercial applications. It is a contact type potential meter with extremely large input impedance so that the contact does not affect the charging state of the specimen. KIT has been working with TREK Inc., to convert the potential meter for extreme environments such as space or a plasma processing chamber. The in-orbit demonstration is a part of the joint research program. To put the COTS device on HORYU-2, the electronics board and the power consumption of the device have been reduced significantly.
When HORYU-2 passes through an auroral zone, differential charging may develop between the insulator surface and the satellite chassis. The potential meter will measure the potential of the insulator that is the same material to be used for SCM. The two measurements are compared to validate against each other.
Debris Observation with a Debris Sensor
The experiment aims at detecting the micro-debris impact on the surface of HORYU-2. Space debris has become a serious threat to satellites on orbit. Observation of micro debris less than 1mm in diameter has been very difficult so far.
The debris sensor consists of many conductive thin wires laid out in parallel in a detection area of 8 cm x 8 cm in size. Upon impact, some of the wire lines are cut causing the resistance to become infinite. It has been verified in the laboratory that the collision is detected once the lines are cut by the impact of hyper-velocity projectiles.
On-Orbit Demonstration of SCAMP (Surrey Camera Payload)
The HORYU-2 mission aims at taking snapshots of some Earth targets using a small CMOS SCAMP camera. The camera was developed at the University of Surrey, UK. A sister school, KIT. SCAMP, takes a picture in a JPEG format of 640 x 480 pixels. From an altitude of 700 km, one pixel corresponds to 1.6 km in side length.
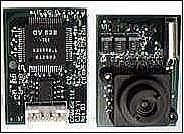
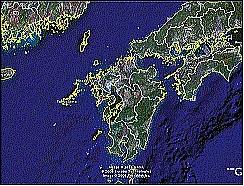
Figure 30 shows an expected image of Kyushu island with a 1.6 km resolution. The shutter of SCAMP is activated by a signal from the OBC. To observe arbitrary target areas of the Earth, a command is sent from the ground station that tells when HORYU-2 takes a snapshot. When the event approaches, HORYU-2 will judge the moment when the camera is facing the Earth from the readings of the current sensors attached to solar arrays on the five panels. Once it judges the camera facing the Earth, the shutter is opened.
References
1) Tomida Kenta, Hirokazu Masui, Mengu Cho, “Structural Design and Environment Test of High Voltage Demonstration Satellite HORYU-II,” Proceedings of the 28th ISTS (International Symposium on Space Technology and Science), Okinawa, Japan, June 5-12, 2011, paper: 2011-s-04
2) Hiroki Nishimura, Mengu Cho, HORYU-2 development team, “Development of High Voltage Technology Demonstration Satellite, HORYU-2,” URL: http://kitsat.ele.kyutech.ac.jp/Documents/Nano-satellite-symposium-Final-paper_nishimura.pdf
3) Information provided by Mengu Cho of KIT
4) HORYU-2 homepage, URL: http://kitsat.ele.kyutech.ac.jp/index_e_new.html
5) Hiroki Nishimura, Mengu Cho, and HORYU-2 development team, “Development of High Voltage Technology Demonstration Satellite, HORYU-2,” The paper is an updated version of Ref. , URL: http://kitsat.ele.kyutech.ac.jp/Documents/Nano-satellite-symposium-Final-paper_nishimura_v2.pdf
6) “High Voltage Technology Demonstration Satellite “HORYU-2”, KIT, March 13, 2012, URL: http://kitsat.ele.kyutech.ac.jp/HORYU2_2012_03_13_Presentation_english_v2.pptx
7) “Launch Result of the Global Changing Observation Mission 1st - Water "SHIZUKU" (GCOM-W1) and the Korean Multi-purpose Satellite 3 (KOMPSAT-3) by H-IIA Launch Vehicle No. 21,” JAXA, May 18, 2012, URL: http://www.jaxa.jp/press/2012/05/20120518_h2af21_e.html
8) “Overview of Co-payload and Secondary Payloads,” JAXA, URL: http://www.jaxa.jp/countdown/f21/overview/payload_e.html
9) Information provided by Mengu Cho, Laboratory of Spacecraft Environment Interaction Engineering, KIT (Kyushu Institute of Technology), Fukuoka, Japan
10) Yuki Seri, Hirokazu Masui, Mengu Cho, “Mission Results and Anomaly Investigation of HORYU-II,” Proceedings of the 27th AIAA/USU Conference, Small Satellite Constellations, Logan, Utah, USA, Aug. 10-15, 2013, paper: SSC13-X-8, URL: http://digitalcommons.usu.edu/cgi/viewcontent.cgi?article=2984&context=smallsat
11) Hirokazu Masui, Toru Hatamura and Mengu Cho, “Testing of Micro/Nano Satellites and Their On-orbit Performance,” Proceedings of the 27th AIAA/USU Conference, Small Satellite Constellations, Logan, Utah, USA, Aug. 10-15, 2013, paper: SSC13-WK-8, URL: http://digitalcommons.usu.edu/cgi/viewcontent.cgi?article=2908&context=smallsat
12) Mengu Cho, Hirokazu Masui, and the KIT Satellite Project, “Test and Verification of Nanosatellite HORYU-II and Orbital Anomaly Investigation,” Proceedings of the 29th ISTS (International Symposium on Space Technology and Science), Nagoya-Aichi, Japan, June 2-8, 2013, paper: 2013-f-19
13) Shunsuke Iwai, Kyutech Satellite Project, Hirokazu Masui, Minoru Iwata, Kazuhiro Toyoda, Mengu Cho, “Results of 300V Photovoltaic Power Generation Mission Onboard HORYU-II, Proceedings of the 29th ISTS (International Symposium on Space Technology and Science), Nagoya-Aichi, Japan, June 2-8, 2013, paper: 2013-s-80-r
14) Mengu Cho, Hirokazu Masui, Shunsuke Iwai, Tatsuya Yoke, Kazuhiro Toyoda, “350-V Photovoltaic Power Generation in Low Earth Orbit,” Technical Note of KIT, provided by Mengu Cho in April 2013
15) Yuki Seri, Akimitsu Hamada, Hirokazu Masui, Mengu Cho, “On-Orbit Thermal Analysis of High Voltage Technology Demonstration Satellite, HORYU-2,” Proceedings of the UN/Japan Workshop and The 4th Nanosatellite Symposium, Nagoya, Japan, Oct. 10-13, 2012, paper: NSS-04-0207
16) Akitoshi Takahashi, Arifur Rahaman Khan, Hirokazu Masui, Minoru Iwata, Kazuhiro Toyoda, Mengu Cho, “Preliminary Report on On-orbit Experiment on High Voltage Technology Demonstration Satellite, HORYU-II,” Proceedings of the 63rd IAC (International Astronautical Congress), Naples, Italy, Oct. 1-5, 2012, paper: IAC-12-D5.3.13
17) Akitoshi Takahashi, Arifur Rahaman Khan, Hirokazu Masui, Minoru Iwata, Kazuhiro Toyoda, Mengu Cho, “On-orbit Demonstration Satellite ‘HORYU-II’ - A High Voltage Technology Mission,” Proceedings of the UN/Japan Workshop and The 4th Nanosatellite Symposium, Nagoya, Japan, Oct. 10-13, 2012, paper: NSS-04-0216
18) May 18, 2012, Southgate Amateur Radio News, URL: http://www.southgatearc.org/news/may2012/horyu2_telemetry_competition.htm?utm_source=feedburner&utm_medium=feed&utm_campaign=Feed%3A+AmateurRadioNews29
19) Tatsuya Yoke, Arifur Rahaman Khan, Hirokazu Masui, Minoru Iwata, Kazuhiro Toyoda, Mengu Cho, “Development of Mission Payloads onboard High Voltage Technology Demonstration Satellite HORYU-2,” URL: http://kitsat.ele.kyutech.ac.jp/Documents/Development%20of%20Misson%20PayloaRYU-II_aiaa.pdf
The information compiled and edited in this article was provided by Herbert J. Kramer from his documentation of: ”Observation of the Earth and Its Environment: Survey of Missions and Sensors” (Springer Verlag) as well as many other sources after the publication of the 4th edition in 2002. - Comments and corrections to this article are always welcome for further updates (eoportal@symbios.space).