ISS: EMIT (Earth surface Mineral dust source InvesTigation)
EO
Atmosphere
Radiation budget
NASA
Launched in July 2022, Earth Surface Mineral Dust Source Investigation (EMIT) was developed by the National Aeronautics and Space Administration (NASA) to help researchers model climate effects from measurements of the world’s mineral-dust sources. Hosted onboard the International Space Station (ISS), the EMIT spectrometer collects data on the composition of minerals that become airborne dust with the aim to expand our knowledge on these fine particles from Earth’s deserts and ultimately how they affect climate.
Quick facts
Overview
| Mission type | EO |
| Agency | NASA |
| Mission status | Operational (nominal) |
| Launch date | 14 Jul 2022 |
| Measurement domain | Atmosphere |
| Measurement category | Radiation budget, Trace gases (excluding ozone) |
| Measurement detailed | Short-wave Earth surface bi-directional reflectance, CH4 Mole Fraction, CO2 Mole Fraction |
| Instruments | EMIT |
| Instrument type | Hyperspectral imagers |
| CEOS EO Handbook | See ISS: EMIT (Earth surface Mineral dust source InvesTigation) summary |
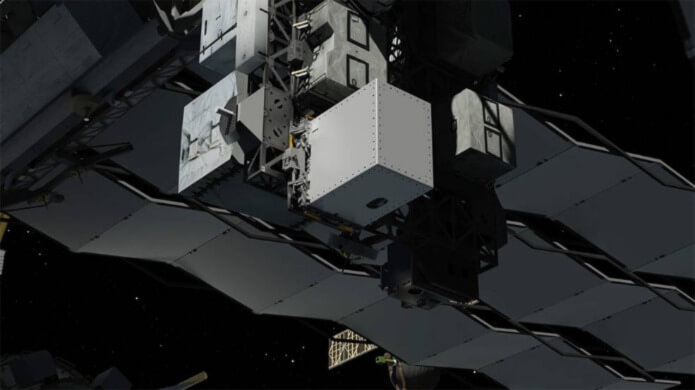
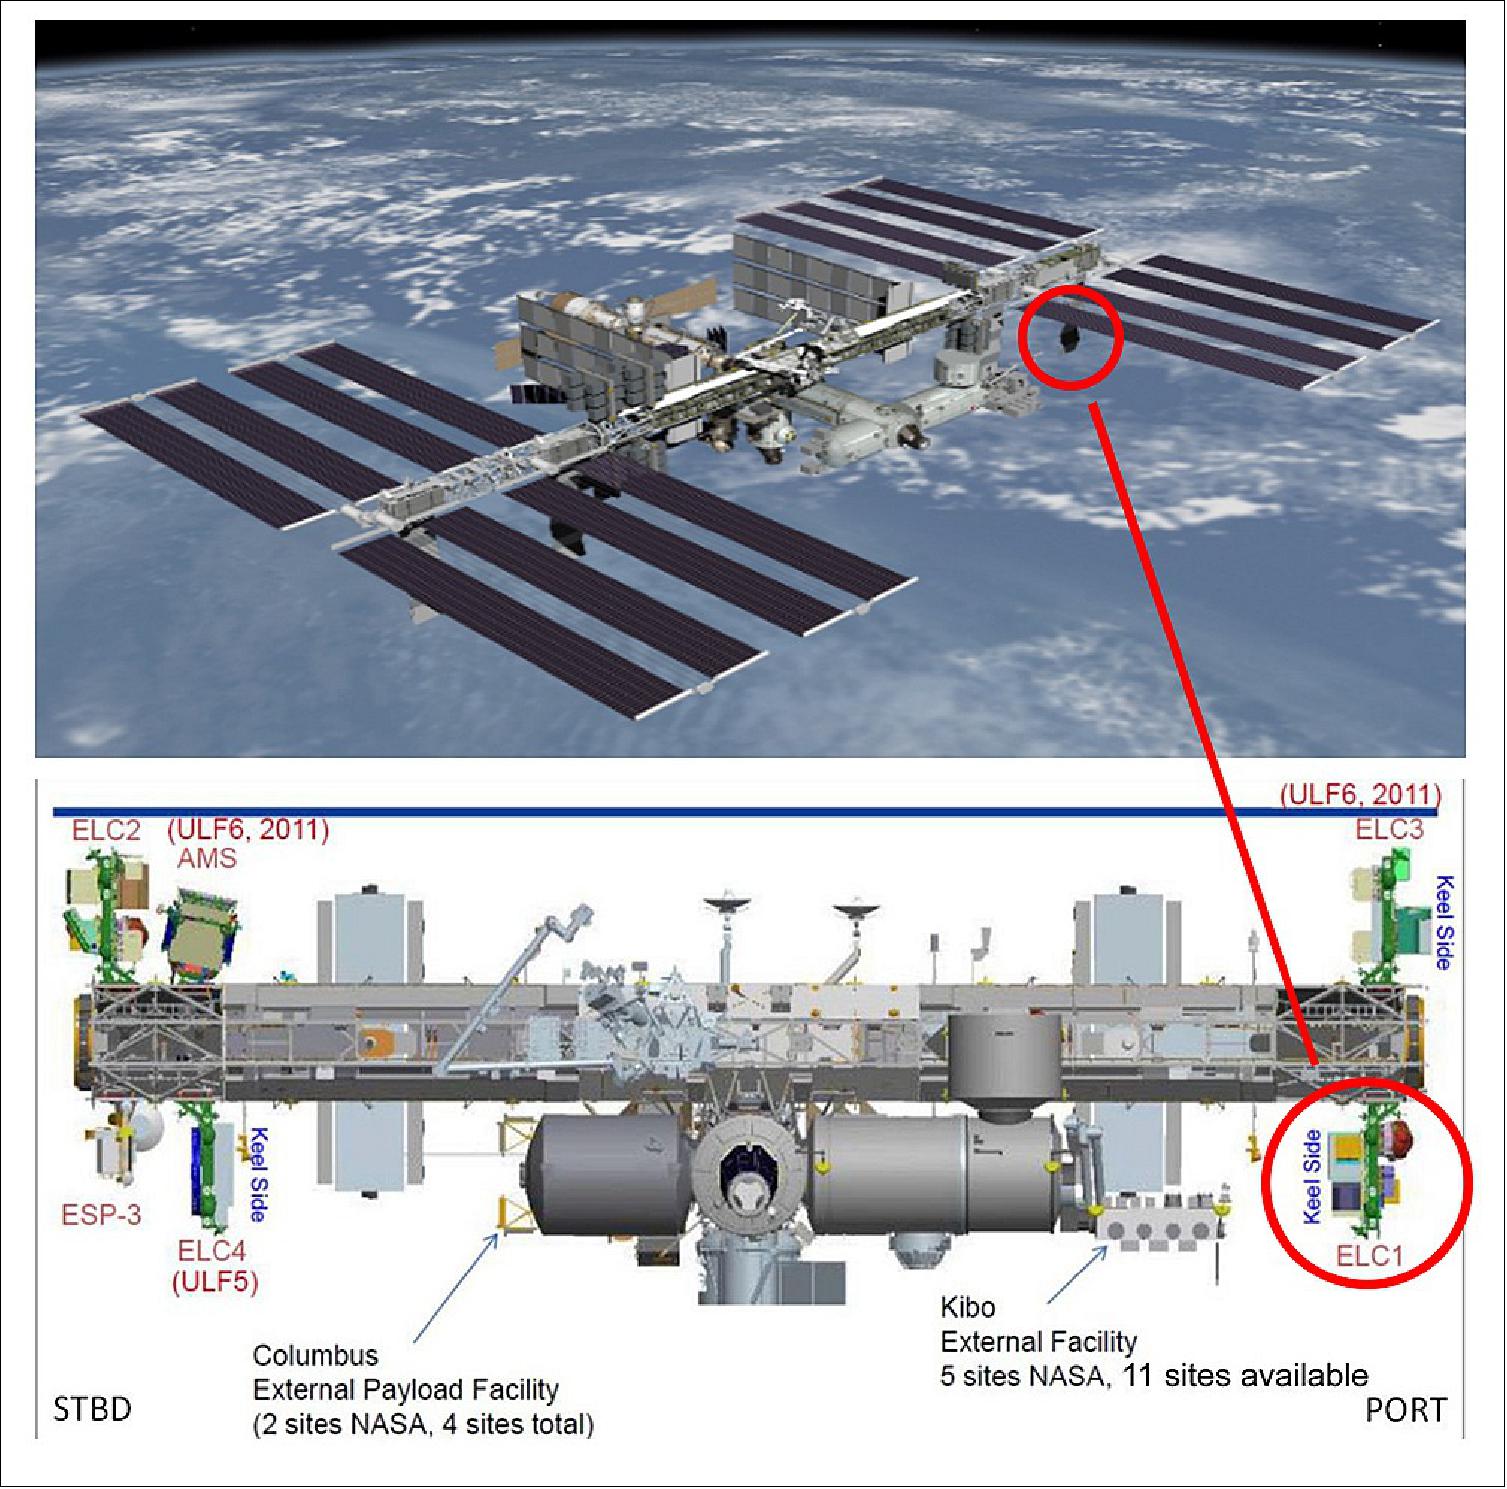
Illustration of NASA’s EMIT instrument attached to Express Logistics Carrier 1, a platform on the International Space Station for external science instruments. (Image credit: NASA/JPL-Caltech)
Summary
Mission Capabilities
EMIT uses an advanced imaging spectrometer instrument that measures a spectrum of sunlight reflected from minerals on the Earth’s surface. EMIT dust source minerals have a unique spectral signature which is calibrated to spectral radiance and then corrected and analysed to determine the mineral composition. This data is used to determine how the particles interact with Earth’s atmosphere, land, water and organisms including how dust heats and cools the planet and how this may change under future climate scenarios. Other applications of this data include use in the analysis of the correlation between dust and cloud formation, air quality, human health and blooms of microscopic algae.
Performance Specifications
EMIT plans to deliver more than 1 billion new measurements during its mission, with the precision of these observations making the instrument one of the most sophisticated Earth-facing imaging spectrometers ever put in space. The EMIT spectrometer observes within a spectral range of 380 - 2500 nm, with spectral sampling every 7.4 nm. It has an Instantaneous Field Of View (IFOV) of 155 x 74 microradians with a cross-track Field Of View (FOV) of 11°, with each column of the detector array recording the spectrum for a sample of 1240 cross-track swaths. The instrument’s detectors can scan a strip of land 80 km wide, at a rate of 7 km each second.
EMIT is situated onboard the ISS on one of the station’s four primary hubs for externally-mounted instruments. ISS undergoes an inclined non-sun-synchronous orbit at an altitude of 407 km and inclination of 51.6°. It has a period of 93 minutes gathering information about particle colour and composition as it orbits over sparsely vegetated regions.
Space and Hardware Components
ISS-EMIT plans to study Earth’s mineral dust source regions over a 12 month period. The optical elements of the EMIT telescope and spectrometer are contained within the Optical Bench Assembly (OBA) on ISS. The electronics are contained within the Electronics Baseplate (EB) where they receive, amplify and digitise the weak analog signals from the detector array. The high rate data are compressed and stored on a digital recorder for replay to the ISS for transmission to the ground. EMIT also utilises a thermal control system that is required to measure signals in the infrared spectrum and for optomechanical stability.
ISS: EMIT (Earth surface Mineral dust source InvesTigation)
Winds kick up dust from Earth’s arid regions and transport the mineral particles around the world. The dust can influence the radiative forcing – or the balance between the energy that comes toward Earth from the Sun, and the energy that Earth reflects back out into space – hence the temperature of the planet’s surface and atmosphere. Darker, iron-laden minerals tend to absorb energy, which leads to heating of the environment, while brighter, clay-containing particles scatter light in a way that may lead to cooling. In addition to affecting regional and global warming of the atmosphere, dust can affect air quality and the health of people worldwide, and when deposited in the ocean, can also trigger blooms of microscopic algae. 1)
The goal of the Earth Surface Mineral Dust Source Investigation (EMIT) mission is to map where the dust originates and estimate its composition so that scientists can better understand how it affects the planet. Targeted to launch in 2022, EMIT has a prime mission of one year and will be installed on the International Space Station. EMIT will use an instrument called an imaging spectrometer that measures visible and infrared light reflecting from surfaces below. This data can reveal the distinct light-absorbing signatures of the minerals in the dust that helps to determine its composition.
“EMIT will close a gap in our knowledge about arid land regions of our planet and answer key questions about how mineral dust interacts with the Earth system,” said Dr. Robert O. Green, EMIT principal investigator at NASA’s Jet Propulsion Laboratory in Southern California.
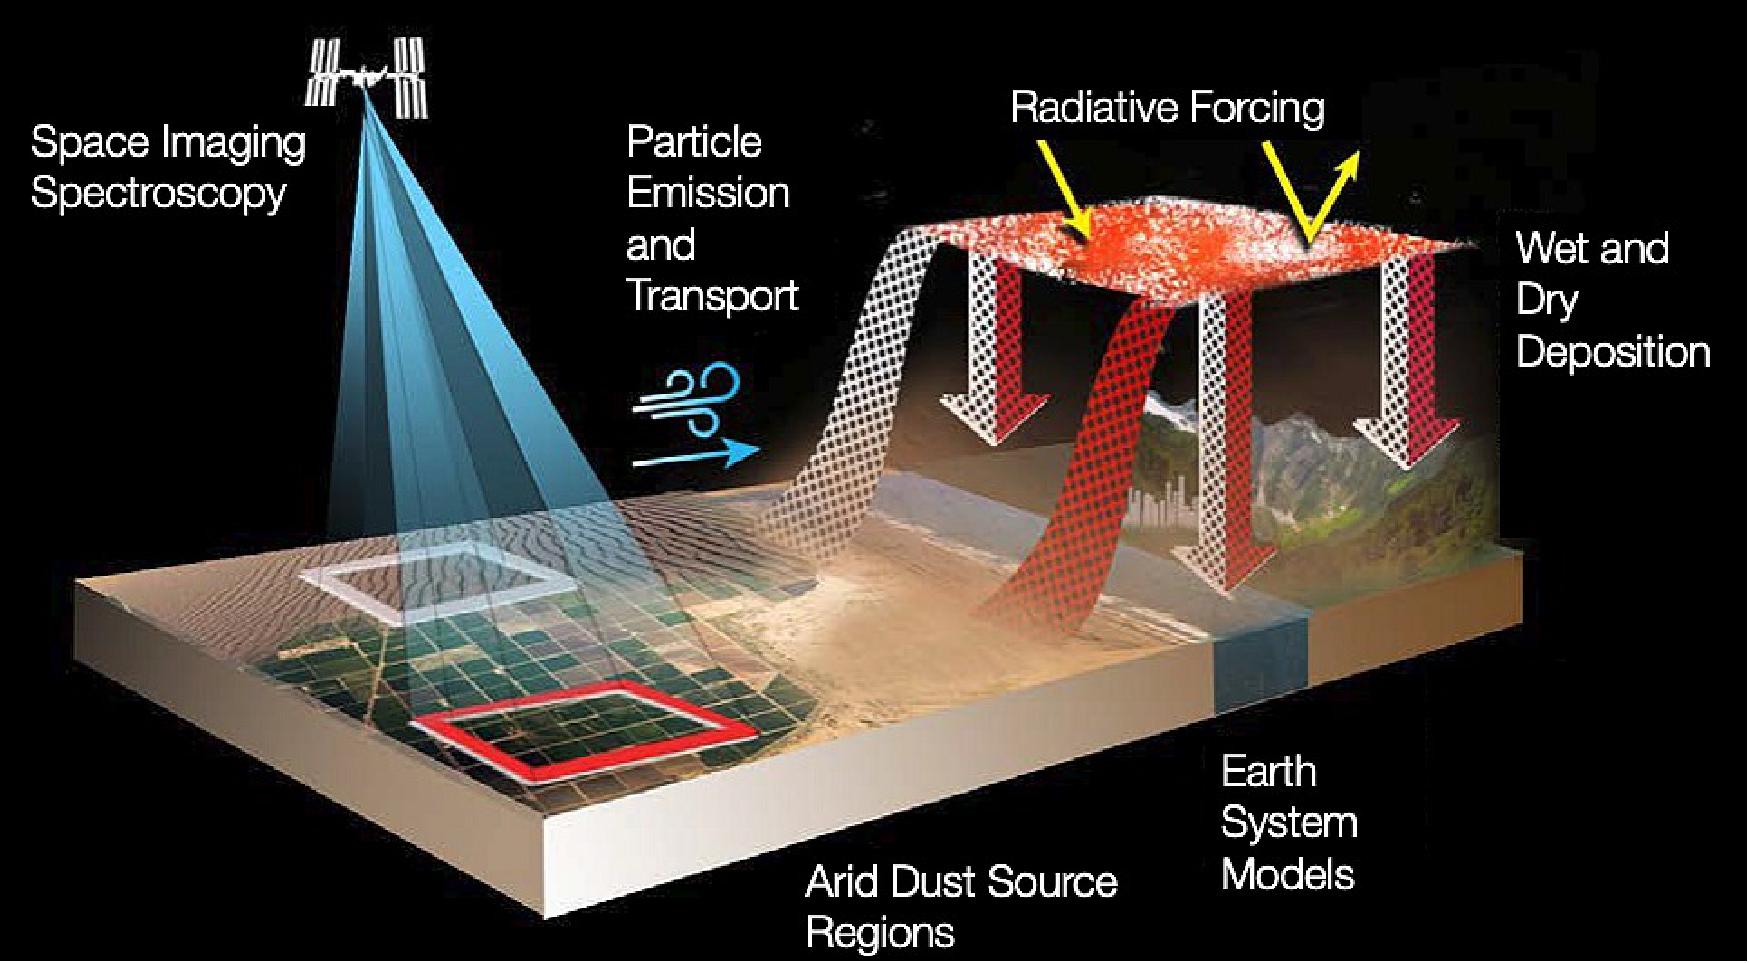
Mineral dust has many other effects on our planet. It can help form clouds or change atmospheric chemistry. When the dust settles in water or on land it can provide nutrients for ecosystem growth. If it falls on snow or ice, mineral dust can increase sunlight absorption and accelerate melting. Mineral dust in the air can reduce visibility or harm human health.
Scientists know that most of the mineral dust transported in Earth’s atmosphere comes from arid, or dry, regions around the globe. But they aren’t certain what types of minerals the wind carries from those regions. Different minerals affect the environment in different ways. So scientists need to know what minerals are in dust source regions if they’re going to better understand how the dust is affecting the Earth. EMIT will provide this missing dust source information.
The data will allow scientists to create a new mineral map of Earth’s dust-producing regions. The map will improve computer models that scientists will use to assess the regional and global heating and cooling effects of mineral dust today and in the future.
Science Objectives
When strong winds on one continent stir up mineral rock dust (such as calcite or chlorite), the airborne particles can travel thousands of miles to affect entirely different continents. Dust suspended in the air can heat or cool the atmosphere and Earth's surface. This heating or cooling effect is the focus of NASA’s Earth Surface Mineral Dust Source Investigation (EMIT) mission. 2)
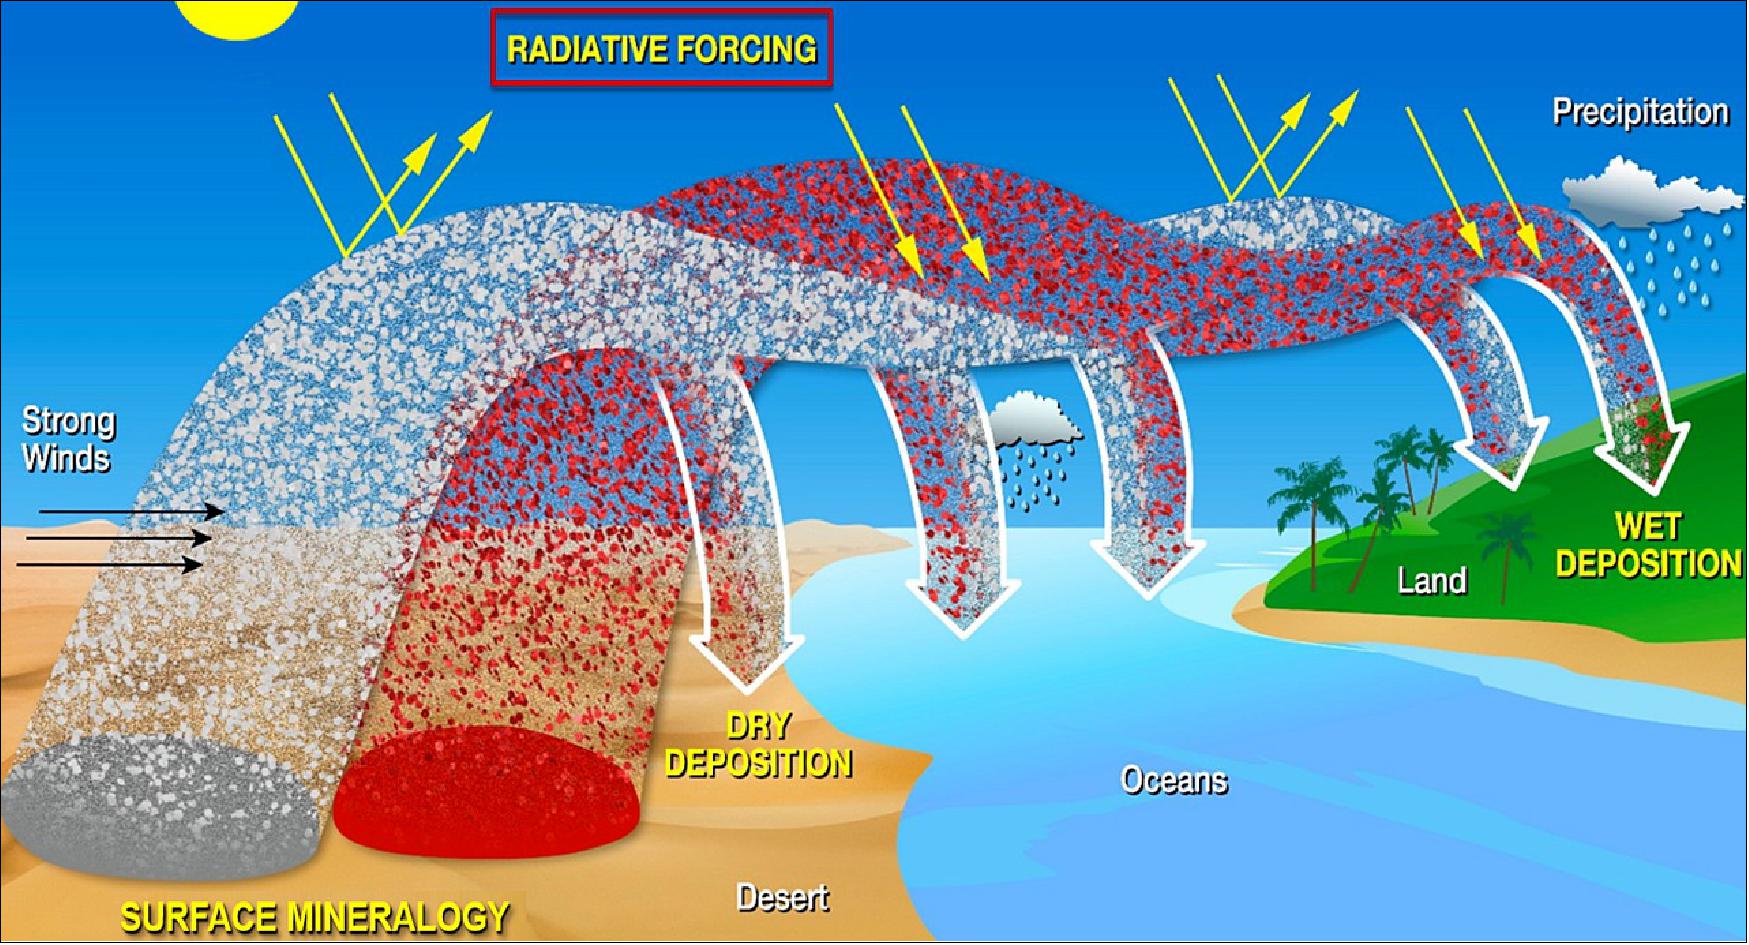
For the first time, the NASA Earth Surface Mineral Dust Source Investigation (EMIT) mission will comprehensively measure the mineral composition of Earth’s dust source regions to help scientists understand how they heat or cool our planet. EMIT’s science objectives are specifically focused on better understanding this heating and cooling effect, which is called radiative forcing. The first objective is to deliver a new improved assessment of the heating and cooling effects of mineral dust in the Earth’s atmosphere. The second objective is to predict how future climate scenarios might change the amount and type of mineral dust emitted into the Earth’s atmosphere.

The EMIT science team will use the mission’s new maps to initialize advanced Earth System Models. The updated models will help scientists better understand the effect of mineral dust composition, and allow them to reduce uncertainty in dust-related heating and cooling effects on Earth. Researchers will also run the models for future climate scenarios to assess how dust sources could change, which will help them understand how dust’s heating and cooling effects might change as well.
Development Status
• June 19, 2020: The NASA-NOAA’s Suomi NPP satellite observed a huge Saharan dust plume streaming over the North Atlantic Ocean, beginning on June 13. Satellite data showed the dust had spread over 2,000 miles. 3)
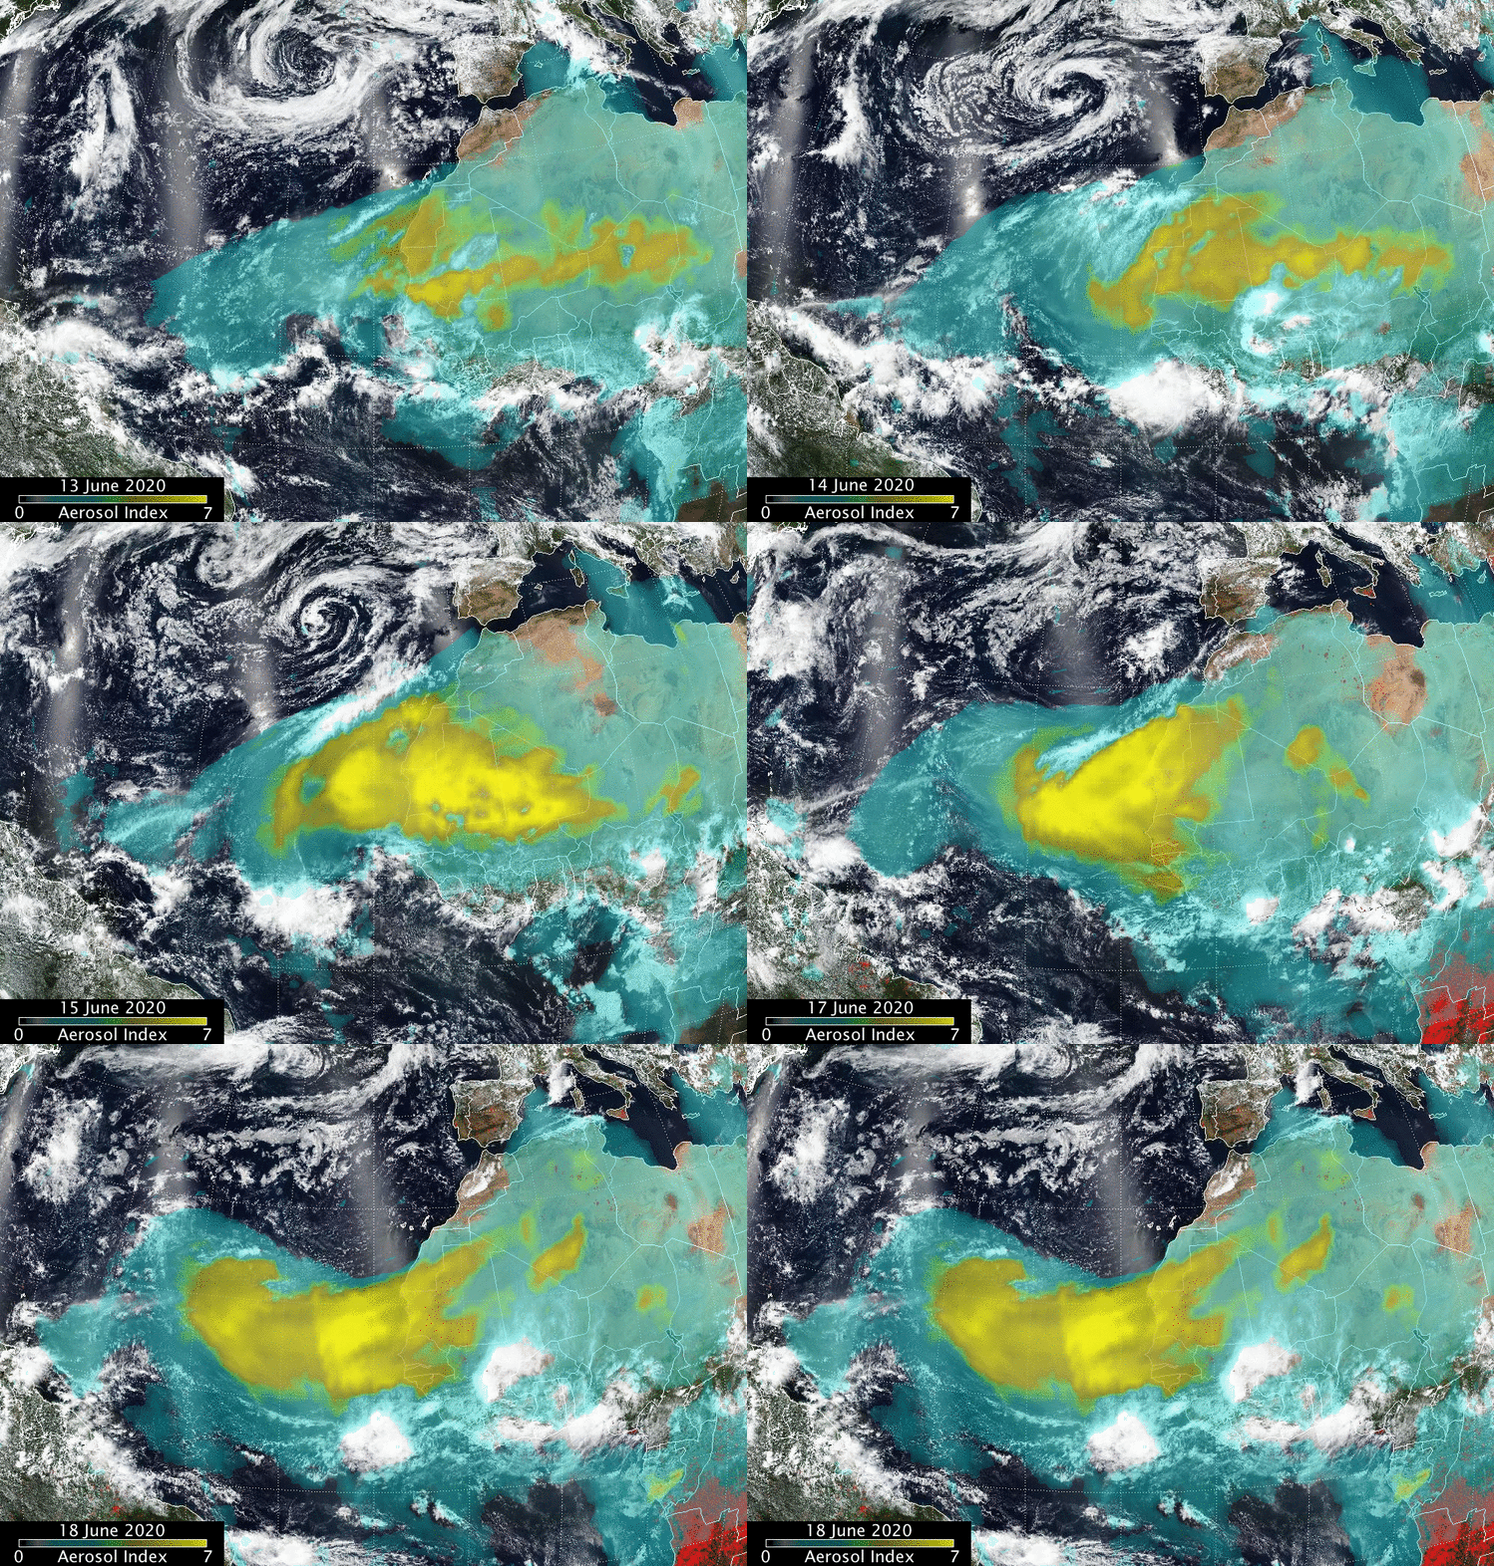
- At NASA’s Goddard Space Flight Center in Greenbelt, Maryland, Colin Seftor, an atmospheric scientist, created an animation of the dust and aerosols from the plume using data from instruments that fly aboard the Suomi NPP satellite.
- “The animation runs from June 13 to 18 and shows a massive Saharan dust cloud that formed from strong atmospheric updrafts that was then picked up by the prevailing westward winds and is now being blown across the Atlantic and, eventually over North and South America,” Seftor said. “The dust is being detected by the aerosol index measurements from the Suomi-NPP Suomi NPP satellite’ s Ozone Mapping and Profiler Suite (OMPS) data overlaid over visible imagery from the Visible Infrared Imaging Radiometer Suite (VIIRS).”
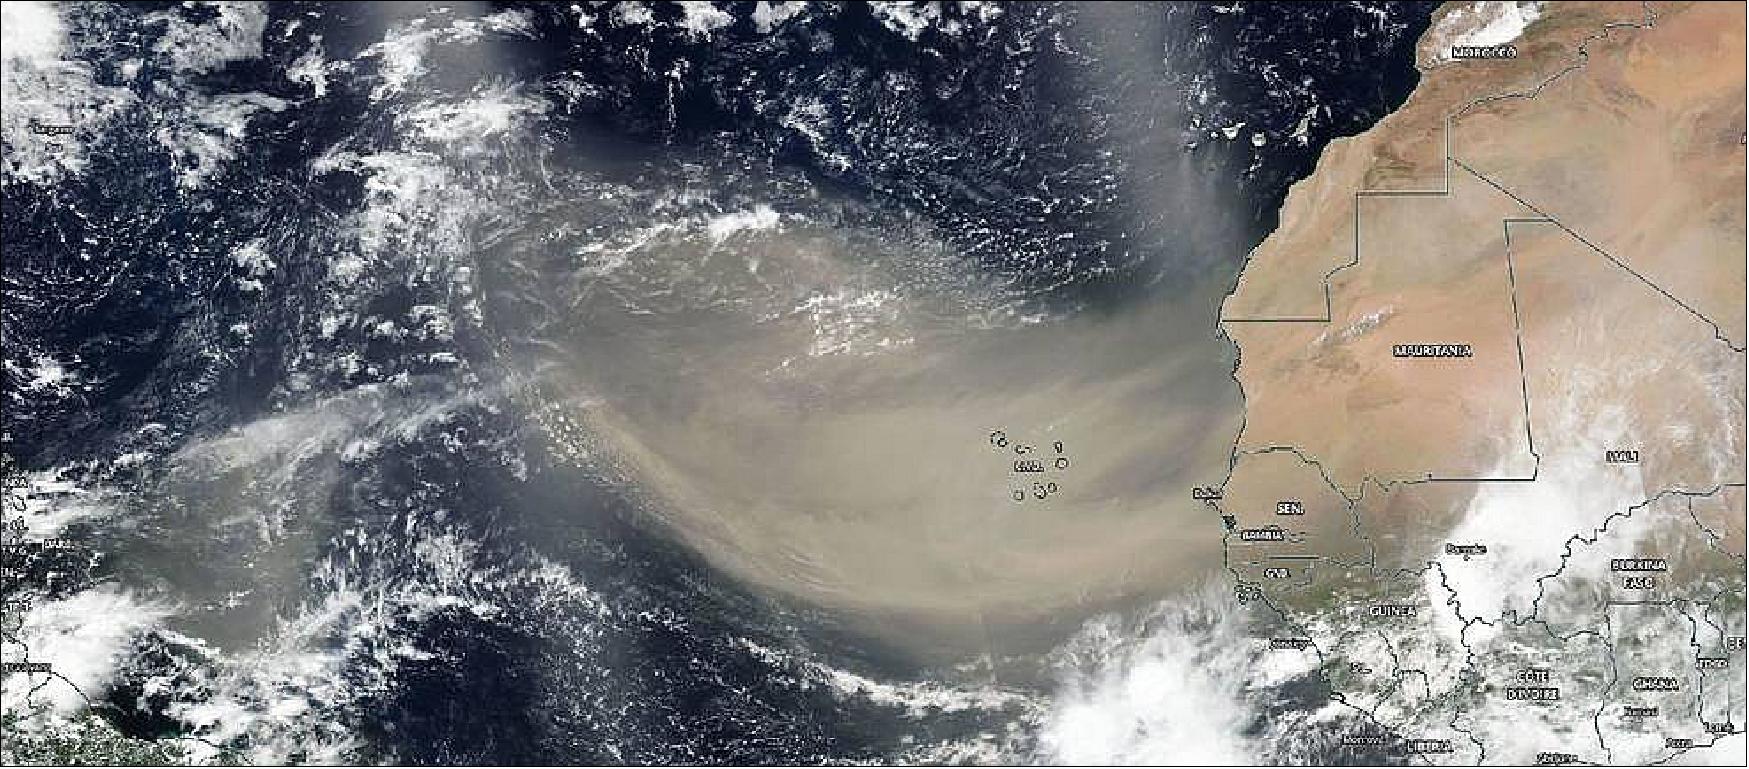
- On June 18, 2020, the VIIRS instrument aboard NASA-NOAA’s Suomi NPP satellite captured a visible image of the large light brown plume of Saharan dust over the North Atlantic Ocean. The image showed that the dust from Africa’s west coast extended almost to the Lesser Antilles in the eastern North Atlantic Ocean. The image showed that the dust had spread over 2,000 miles across the Atlantic.
- Normally, hundreds of millions of tons of dust are picked up from the deserts of Africa and blown across the Atlantic Ocean each year. That dust helps build beaches in the Caribbean and fertilizes soils in the Amazon. It can also affect air quality in North and South America.
- NASA continues to study the role of African dust in tropical cyclone formation. In 2013, one of the purposes of NASA’s HS3 field mission addressed the controversial role of the hot, dry and dusty Saharan Air Layer in tropical storm formation and intensification and the extent to which deep convection in the inner-core region of storms is a key driver of intensity change.
- Suomi NPP represents a critical first step in building the next-generation Earth-observing satellite system that will collect data on long-term climate change and short-term weather conditions. NPP is the result of a partnership between NASA, the National Oceanic and Atmospheric Administration, and the Department of Defense.
- For more than five decades, NASA has used the vantage point of space to understand and explore our home planet, improve lives and safeguard our future. NASA brings together technology, science, and unique global Earth observations to provide societal benefits and strengthen our nation. Advancing knowledge of our home planet contributes directly to America’s leadership in space and scientific exploration.
• March 2020: The Earth Surface Mineral Dust Source Investigation, EMIT, is planned to operate from the International Space Station starting no earlier than the fall of 2021. EMIT will use visible to short wavelength infrared imaging spectroscopy to determine the mineral composition of the arid land dust source regions of the Earth to advance our knowledge of the radiative forcing effect of these aerosols. Mineral dust emitted into the atmosphere under high wind conditions is an element of the Earth system with many impacts to the Earth's energy balance, atmosphere, surface, and oceans. 4)
- The Earth's mineral dust cycle with source, transport, and deposition phases are studied with advanced Earth System Models. Because the chemical composition, optical and surface properties of soil particles vary strongly with the mineral composition of the source, these models require knowledge of surface soil mineral dust source composition to accurately understand dust impacts on the Earth system now and in the future. At present, compositional knowledge of the Earth's mineral dust source regions from existing data sets is uncertain as a result of limited measurements.
- EMIT will use spectroscopically-derived surface mineral composition to update the prescribed boundary conditions for state-of-the-art Earth System Models. The EMIT-initialized models will be used to investigate the impact of direct radiative forcing in the Earth system that depends strongly on the composition of the mineral dust aerosols emitted into the atmosphere. These new measurements and related products will be used to address the EMIT science objectives and made available to the science community for additional investigations.
• In February 2018, NASA selected proposals for innovative research projects that aim to answer two unknown atmospheric questions: Does mineral dust have a warming or cooling effect on Earth’s atmosphere, and why is the Arctic warming more quickly than other areas of the planet? 5)
NASA has selected two new, creative research proposals to develop small, space-based instruments that will tackle these fundamental questions about our home planet and its environment. NASA/JPL (Jet Propulsion Laboratory) in Pasadena, California, is a key participant on both instruments.
1) EMIT will use a sensor mounted to the exterior of the ISS (International Space Station) to determine the mineral composition of natural sources that produce dust aerosols around the world. By measuring in detail which minerals make up the dust, EMIT will help to answer the essential question of whether this type of aerosol warms or cools the atmosphere. Robert Green of NASA/JPL is the principal investigator.
2) PREFIRE (Polar Radiant Energy in the Far Infrared Experiment) will fly a pair of small CubeSat satellites to probe a little-studied portion of the radiant energy emitted by Earth for clues about Arctic warming, sea ice loss and ice-sheet melting. Tristan L'Ecuyer of the University of Wisconsin, Madison, is the principal investigator.
These two instruments were competitively selected from 14 proposals considered under NASA's fourth EVI (Earth Venture Instrument) opportunity. Earth Venture investigations are small, targeted science investigations that complement NASA's larger missions. The National Research Council recommended in 2007 that NASA undertake this type of regularly solicited, science-based, quick-turnaround projects. The council's recently released decadal survey recommended the continuance of the program.
PREFIRE will be described in a separate file on the eoPortal.
EMIT will use a hyperspectral instrument to measure the different emitted wavelengths of light from dust sources. Its sensor technology was based partially on the NASA M3 (Moon Mineralogy Mapper) instrument, featured on the Indian Space Research Organization's Chandrayaan-1 spacecraft.
Launch
EMIT was launched to the ISS on a resupply mission by SpaceX on July 14, 2022. The instrument was mounted on the ExPRESS Logistics Carrier 1 (ELC1) - one of the station's four primary hubs for externally-mounted instruments, where it will study the Earth's mineral dust source regions for 12 months. 8)
The instrument was removed from the SpaceX Dragon capsule and installed on the ISS using the seven-jointed, 55-foot Canadarm-2.
Once it begins operation, EMIT data will be delivered to the NASA Land Processes Distributed Active Archive Center (DAAC) for use by other researchers and the public.
Mission Status
- April 27, 2023: The International Space Station (ISS) partners have agreed to extend the operational period of the ISS. The United States, Japan, Canada and participant European Space Agency (ESA) countries will support operations until 2030, while Russia has committed to continuing station operations until 2028. 13)
- February 18, 2022: NASA released the first 5000 spectral image cubes measured by EMIT.
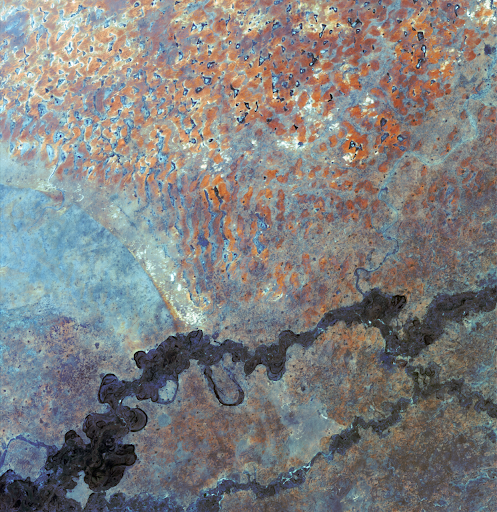
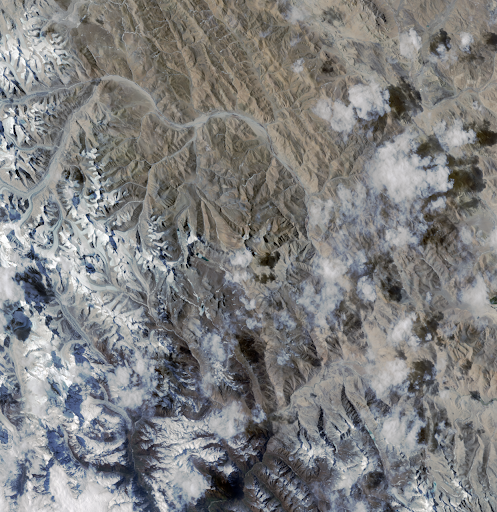
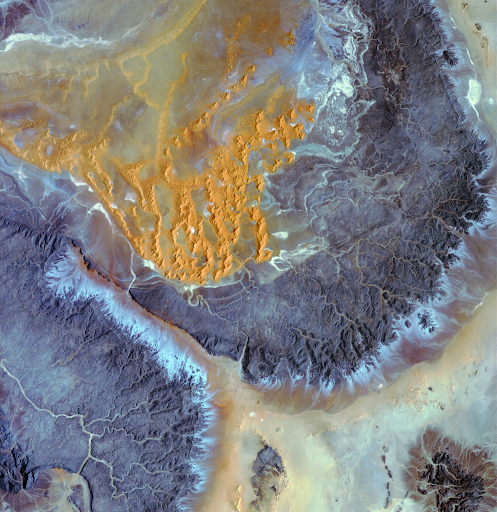
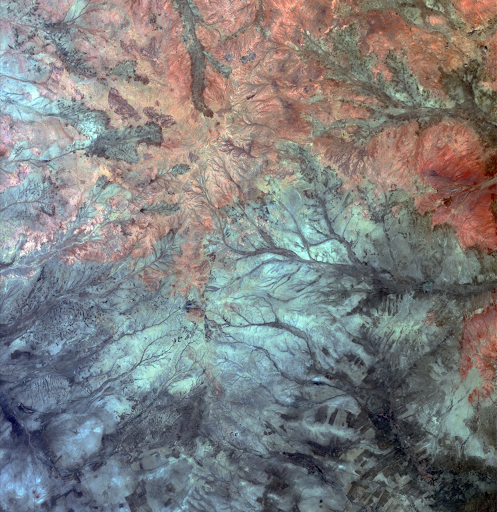
Spectral image cubes measured by EMIT are available through the Land Processes Distributed Active Archive Center (LP DAAC). (here)
An EMIT data access and usage tutorial series is available through NASA’s EMIT website. (here)
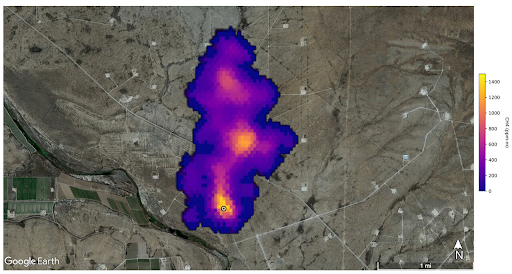
- October 25, 2022: Since EMIT was installed on the ISS in July, the science team has identified over 50 super-emitters of methane in Central Asia, the Middle East, and the South-West United States. This ability will help researchers pinpoint methane leaks, as well as provide insight on how they can be addressed quickly. EMIT’s imaging spectrometer can recognise methane’s spectral fingerprint (light absorption pattern) with high accuracy and precision, as well as for Carbon Dioxide. 10)
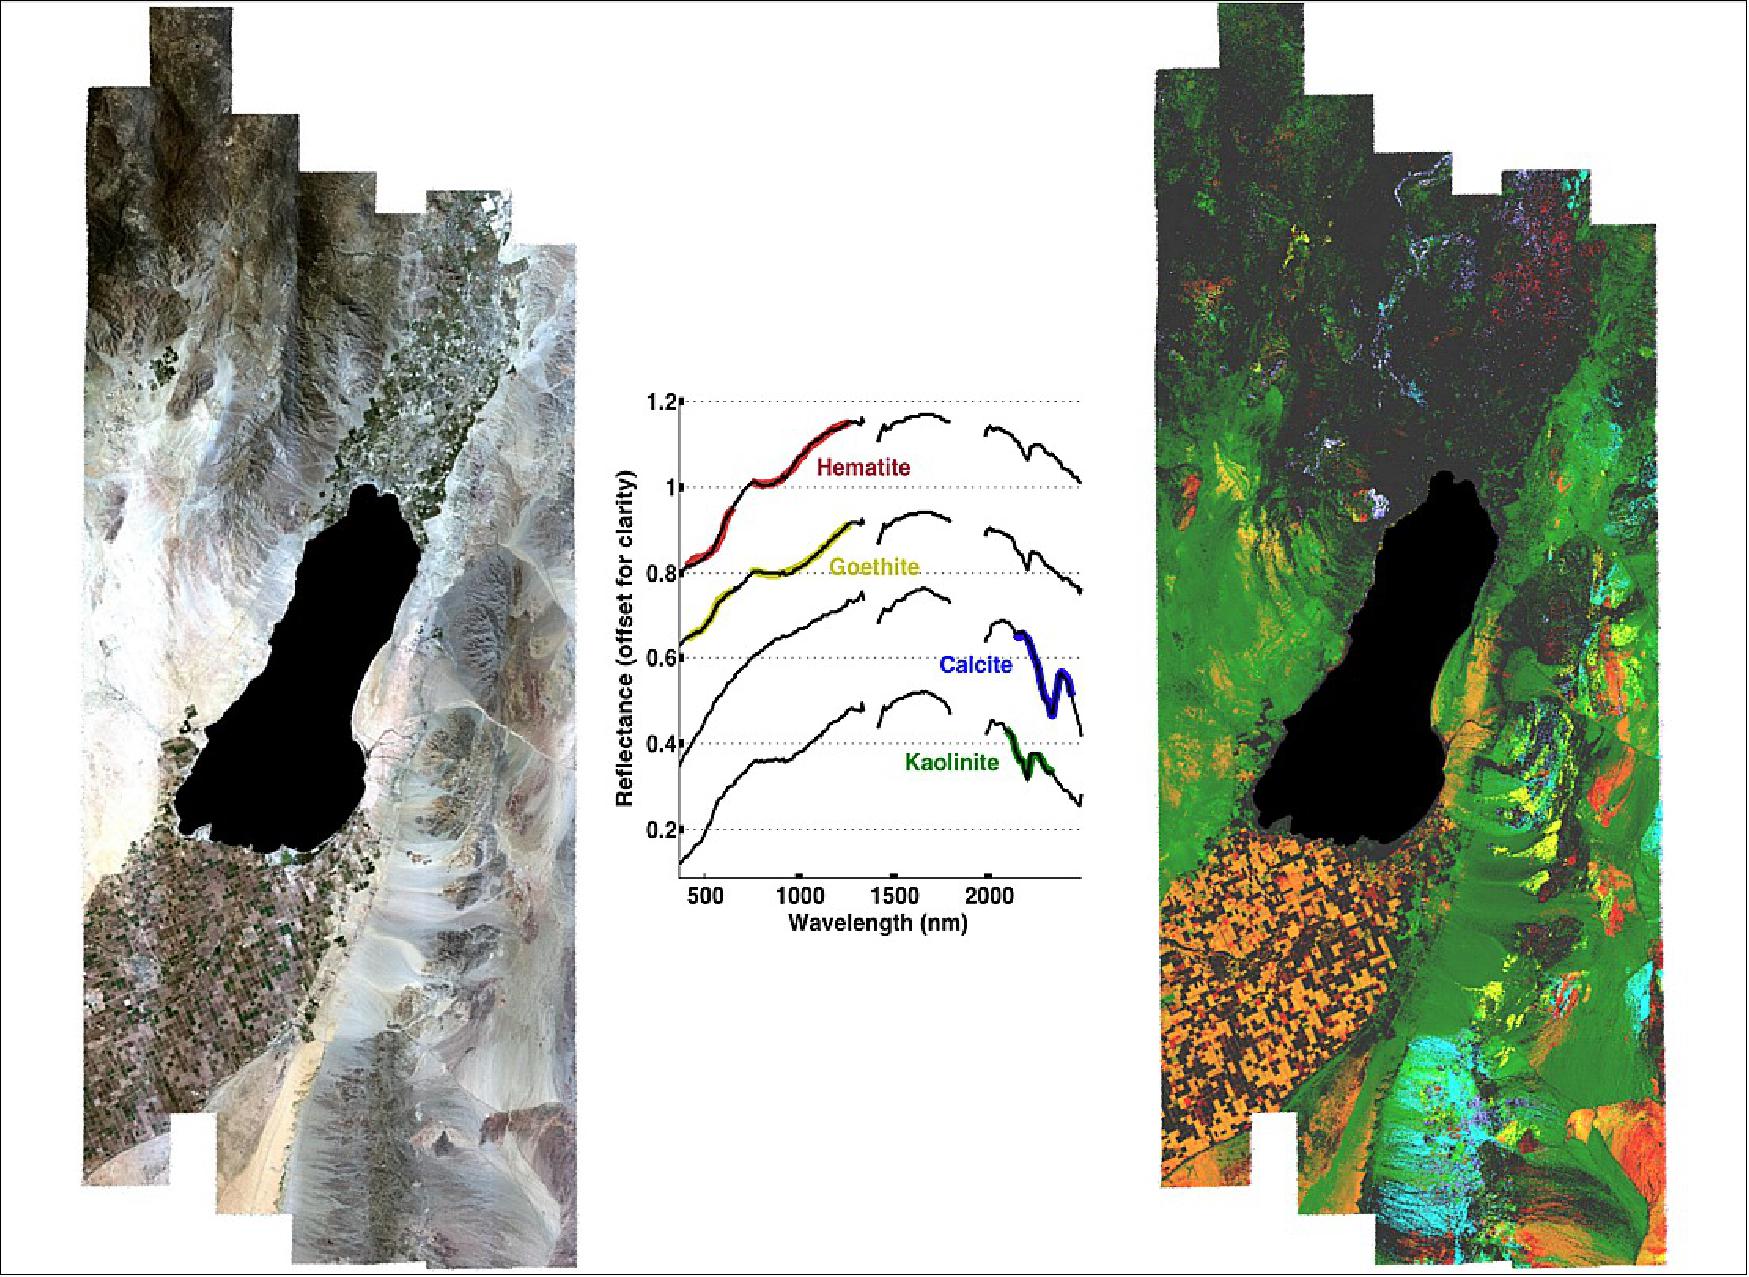
- October 12, 2022: EMIT produced its first mineral maps, providing detailed images that show the surface composition in regions of North-West Nevada and Libya in the Sahara Desert. 11)
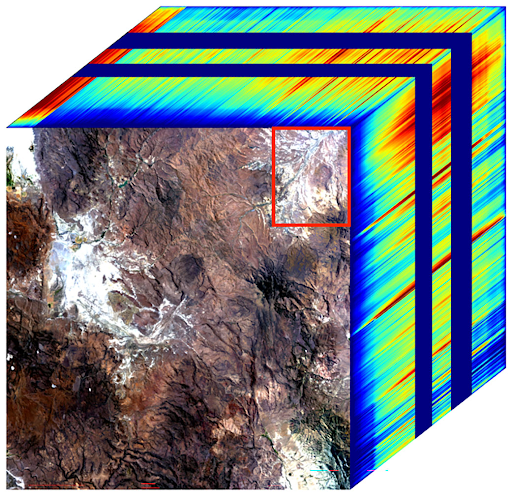
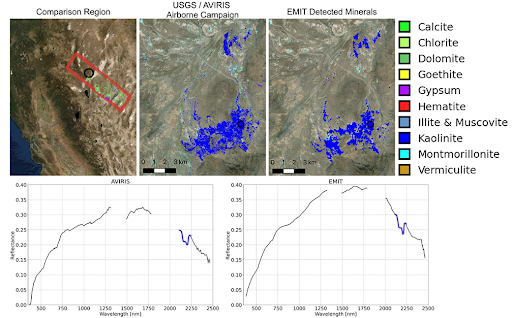
Figure 15 shows the mineral spectra gathered by EMIT in North-West Nevada match what NASA’s AVIRIS instrument found in 2018, providing validation of EMIT’s accuracy. Both instruments found areas dominated by kaolinite, a reflective clay material whose airborne particles can cool the air.
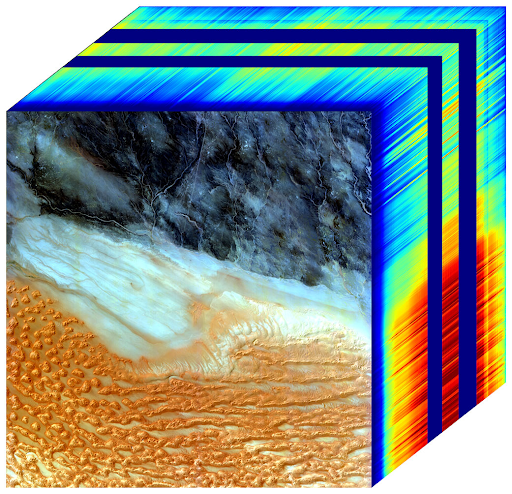
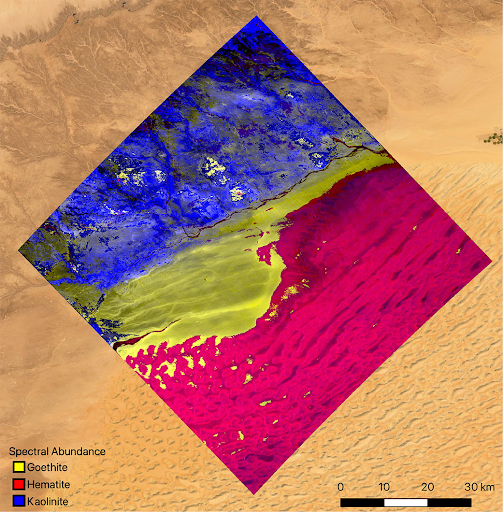
Legend to Figure 17: The mineral map shows areas dominated by kaolinite, a light-scattering clay material, and goethite and hematite, iron oxides that absorb heat and warm the surrounding air.
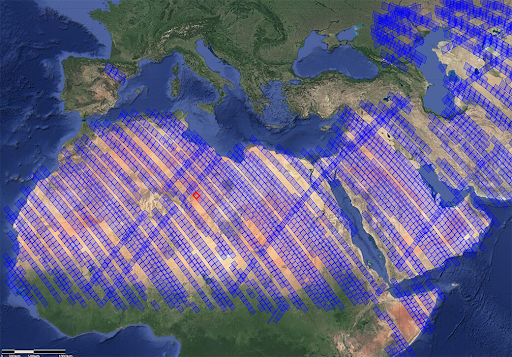
- September 30, 2022: EMIT joined the Geological Earth Mapping Experiment (GEMx) by NASA and the U.S. Geological Survey (USGS) to map areas of the South West of the United States for critical minerals and how they heat and cool the planet. The experiment will also use NASA’s Airborne Visible/Infrared Imaging Spectrometer (AVIRIS) and Hyperspectral Thermal Emission Spectrometer (HyTES) instruments onboard NASA’s ER-2 and Gulfstream V aircraft, and will collect data over arid and semi-arid regions including areas in California, Nevada, Arizona, and New Mexico. 12)
- July 27, 2022: NASA’s mineral dust detector began to gather data, with the ‘first light’ occurring when the ISS passed over Western Australia. Ground controllers used the Canadarm2 to install EMIT from a SpaceX Dragon spacecraft to the outside of the station, over a period of 40 hours. On July 24 EMIT was powered on, and then cooled to its operating temperature over 72 hours. The EMIT team then collected their first measurements, creating an ‘image cube’ shown below.
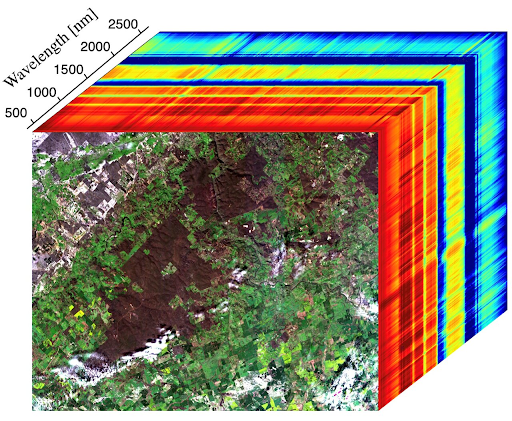
Figure 19 shows the front face of the spectral cube with a mix of materials in Western Australia, including exposed soil (brown), vegetation (dark green), agricultural fields (light green), a river, and clouds. The adjacent faces of the cube show the spectral fingerprints from corresponding areas in the front-facing image.
EMIT Instrument
The EMIT instrument is an imaging spectrometer — a NASA invention widely used in the agency’s space missions — that will measure light in visible and infrared wavelengths. When the various wavelengths of light – the spectrum – are distributed across the instrument’s detector, they display unique spectral signatures indicating the mineral composition of the surface. EMIT will acquire over 100,000 such spectra every second, mapping the composition of minerals on Earth’s surface. 6)
Sunlight reflected from minerals on the Earth’s surface is imaged by a telescope and spectrometer system onto a detector area array that is sensitive from the visible to short wavelength infrared portion of the electromagnetic spectrum. The EMIT dust source minerals have distinct spectral signatures in this wavelength range. Each column of the detector array records the spectrum for a sample of 1240 cross-track EMIT instrument swath. The along-track dimension of the image is built up with the forward motion of the ISS. The imaging spectrometer measured image cubes are calibrated to spectral radiance, then atmospherically corrected and analyzed to determine the mineral composition that is required to achieve the EMIT science objectives.
F-number | F/1.8 |
Cross-track FOV (Field of View) | 11º |
IFOV (cross-track x along-track) | 155 x 71 µrad |
Focal length | 193.5 mm |
Entrance pupil aperture | 110 mm |
Spectral range | 380 – 2500 nm |
Spectral sampling | 7.4 nm |
Optical Configuration of the EMIT Imaging Spectrometer Instrument
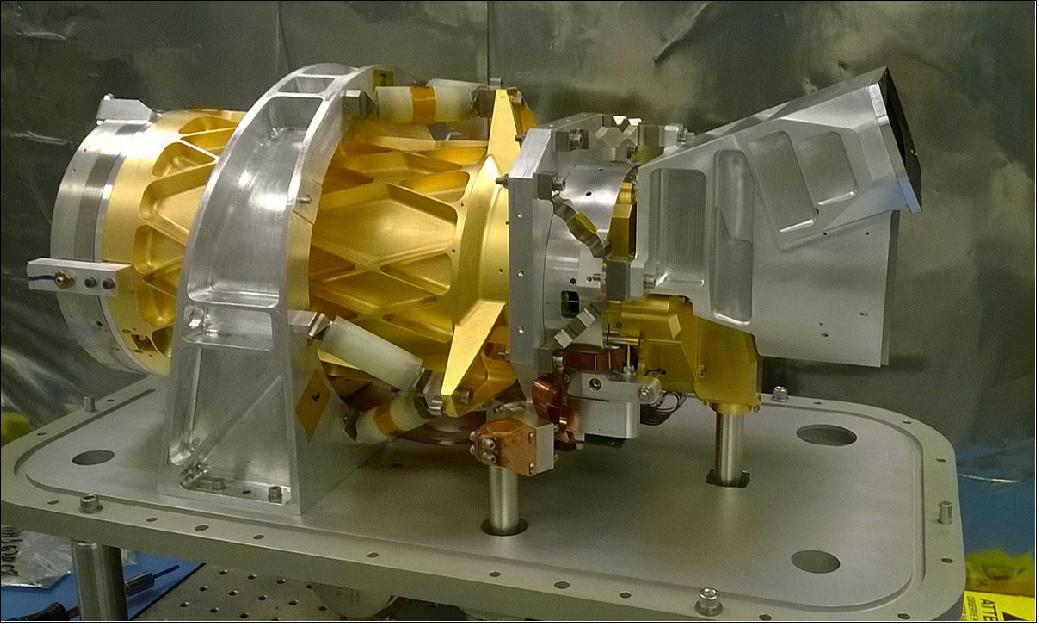
EMIT uses an advanced two mirror telescope and high throughput F/1.8 Dyson imaging spectrometer. The telescope focuses light entering EMIT on the spectrometer slit where it passed through calcium fluoride crystal refractive element to the grating. The concave grating has a structured blaze written by electron beam lithography to optimize the diffraction efficiency over the full spectral range. After being dispersed into the spectrum by the grating, light passes back through CaF2 block to the order sorting filter and detector array. 7)
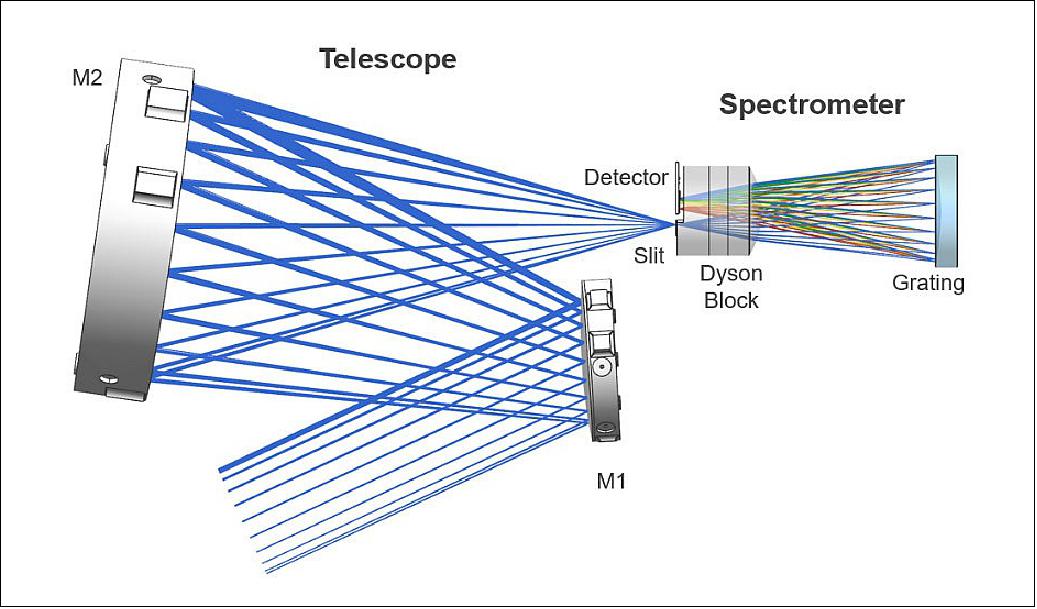
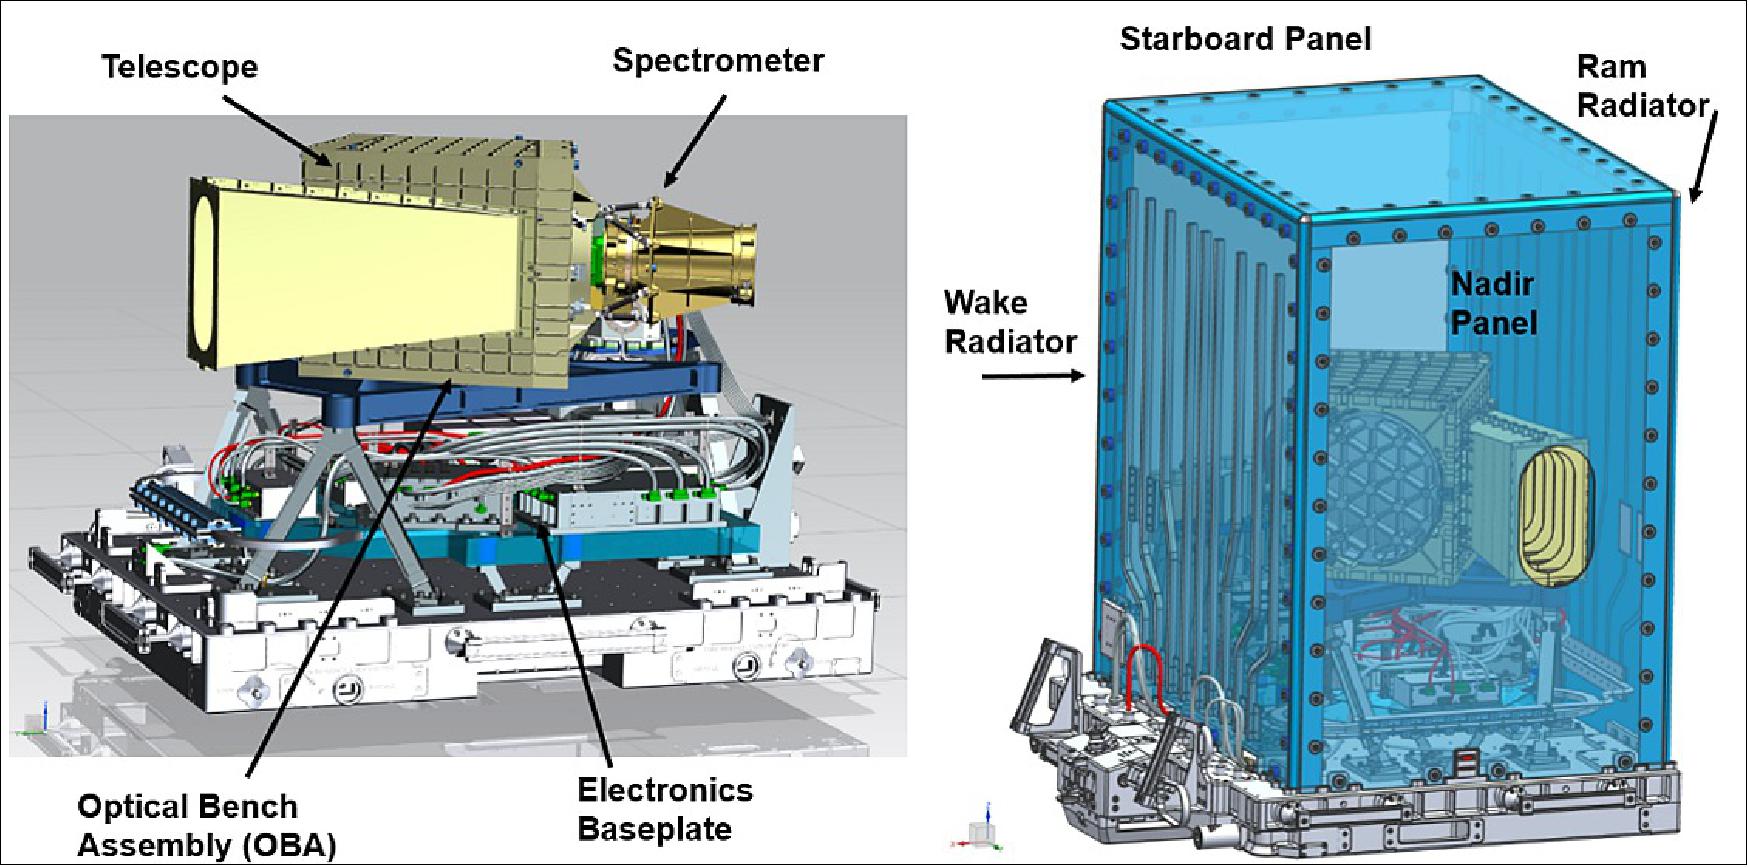
This is the EMIT instrument configuration for operation on the ISS. The optical elements of the telescope and spectrometer are contained within the Optical Bench Assembly (OBA). The electronics are contained within the Electronics Baseplate (EB). The electronics receive, amplify, and digitize the weak analog signals from the detector array. These high rate data are compressed and stored on a digital recorder for replay to the ISS for transmission to the ground. EMIT also includes a sophisticated thermal control system that is required to measure the signals in the short wavelength (infrared) region of the spectrum and for optomechanical stability. Heat generated within EMIT is radiated to space to maintain thermal balance.
EMIT Destination
The EMIT instrument will operate from one of the most exclusive research laboratories in the solar system: the International Space Station (ISS). 8)
The ISS has hosted a continuous human presence in space for more than 20 years. At a given time, the pressurized modules where astronauts live and work are home to as many as two dozen laboratory experiments. Additionally, the ISS can carry up to about 20 experiments at a time on the outside of the station, which is where EMIT will catch a ride.
Once mounted on the ExPRESS Logistics Carrier 1 (ELC1) — one of the station’s four primary hubs for externally-mounted instruments — EMIT will begin to map the surface composition of Earth’s arid land mineral dust source regions. From there, the instrument will study our planet’s mineral dust source regions for 12 months.
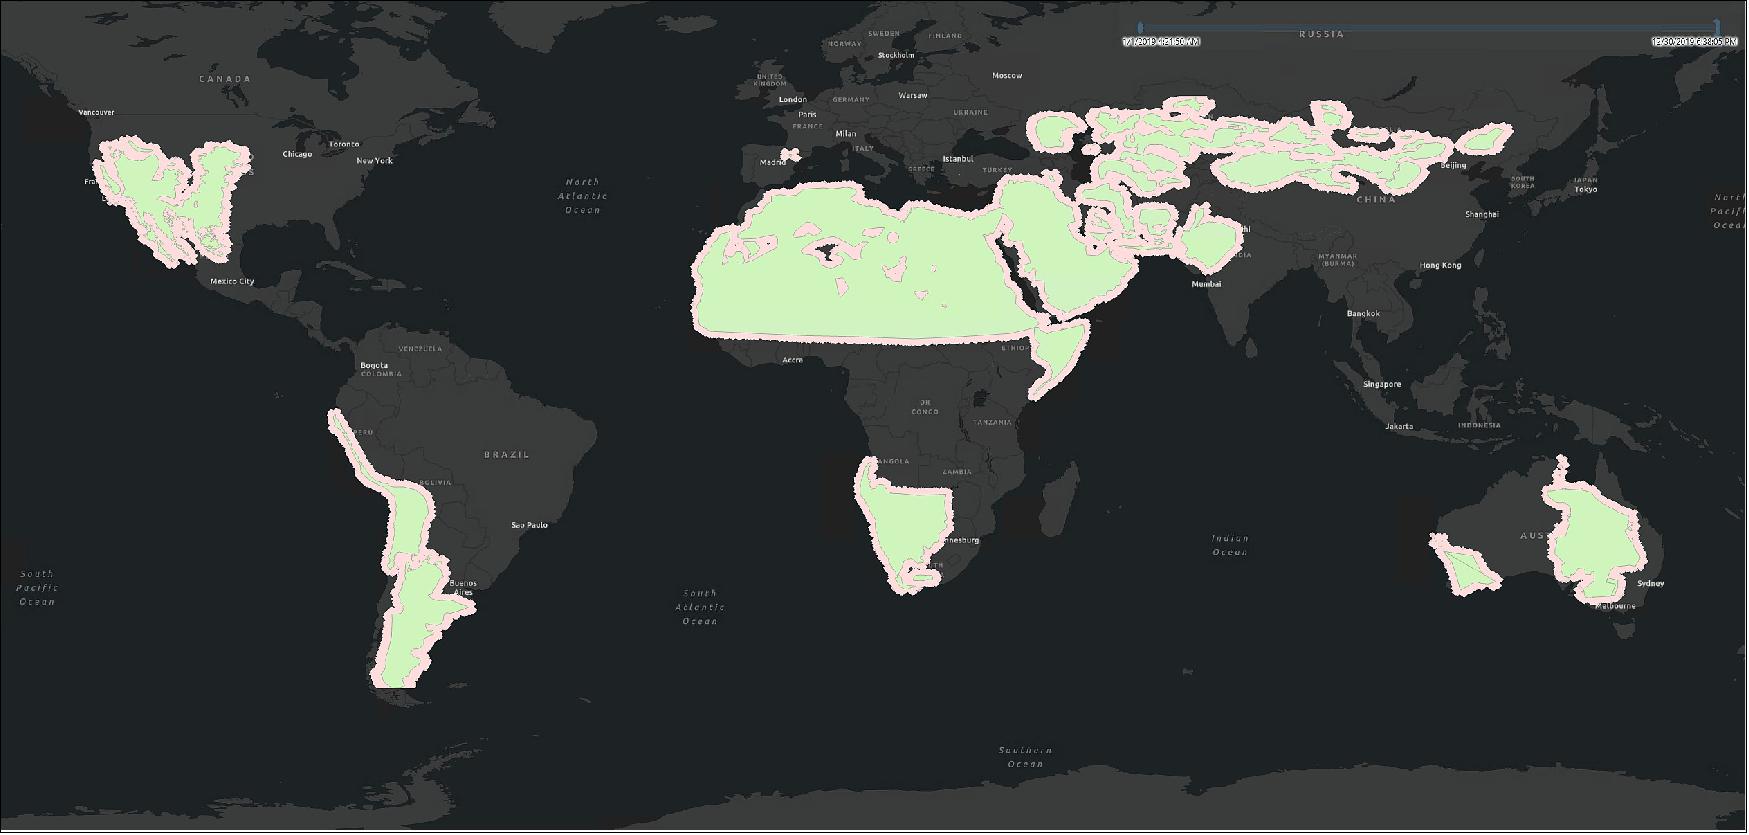
EMIT will be the first mineral dust source observation experiment on the station and the only instrument flown on any spacecraft to date designed to exclusively study this part of the Earth’s mineral dust cycle. While riding on the ISS, the instrument will travel 5 miles per second (8 km/s), orbiting Earth about once every 90 minutes and completing about 16 orbits per day.
EMIT will be removed from the SpaceX Dragon capsule and installed on the ISS using the seven-jointed Canadarm-2. The state-of-the-art instrument will be operated by engineers and scientists on Earth.
EMIT Operations
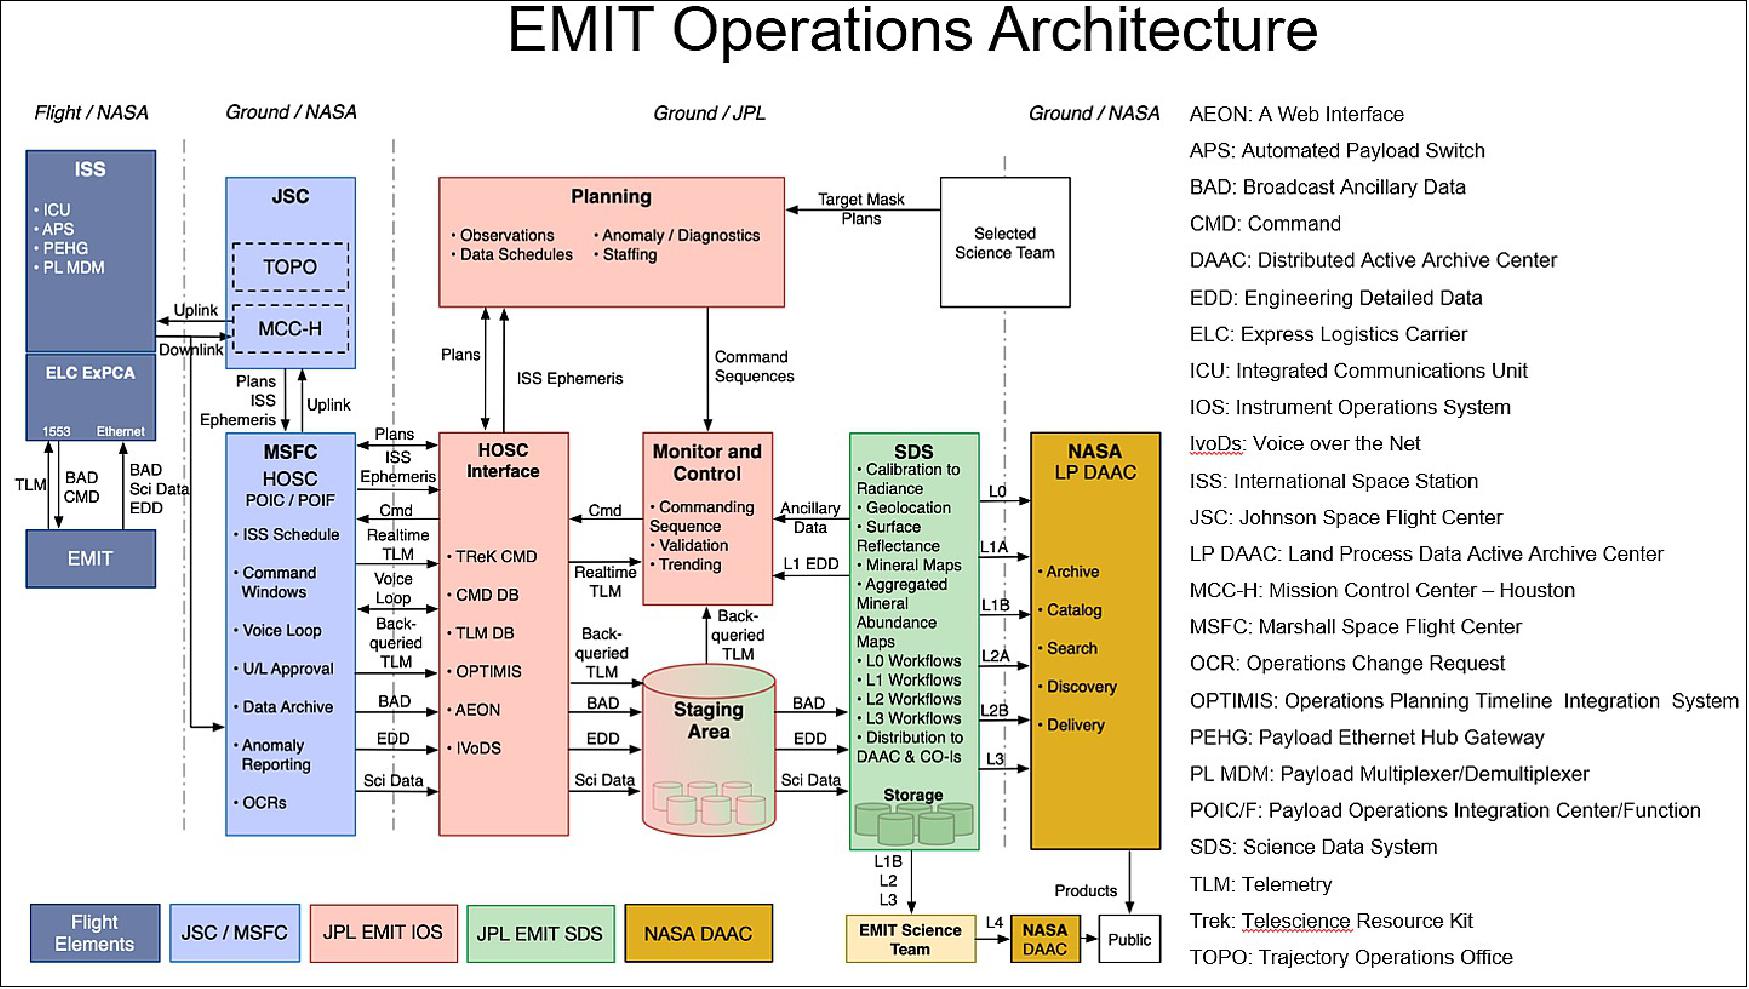
When complete, the EMIT imaging spectroscopy measurements will be acquired over the full target area. EMIT will collect extra measurements around the periphery to assure full coverage. EMIT will collect multiple acquisitions over the target areas to allow for periodic cloud obscuration. All of these measurements will be processed through the EMIT science data system to deliver mineral composition maps for the initialization of the Earth System Model to achieve the EMIT science objectives. EMIT measurements and products will be archived at the NASA Land Processes (LP) Distributed Active Archive Center (DAAC) for use by the full science and applications community.
References
1) ”Studying Mineral Dust,” NASA/JPL News, 13 December 2021, URL: https://www.jpl.nasa.gov/news/nasa-to-launch-4-earth-science-missions-in-2022
2) https://earth.jpl.nasa.gov/emit/mission/about/
3) ”NASA Observes Large Saharan Dust Plume Over Atlantic Ocean,” NASA Feature, 19 June 2020, URL: https://www.nasa.gov/feature/goddard/
2020/nasa-observes-large-saharan-dust-plume-over-atlantic-ocean
4) Robert O. Green, Natalie Mahowald, Charlene Ung, David R. Thompson, Lori Bator, Matthew Bennet, Michael Bernas, Natalie Blackway, Christine Bradley, et al., ”The Earth Surface Mineral Dust Source Investigation: An Earth Science Imaging Spectroscopy Mission,” Big Sky Conference, 7-14 March, 2020, published in IEEEXplore on 21 August 2020, https://doi.org/10.1109/AERO47225.2020.9172731
5) ”New NASA Space Sensors to Address Key Earth Questions,” NASA/JPL News, 5 Feb. 2018, URL: https://www.jpl.nasa.gov/news/news.php?feature=7054
6) ”Overview of the EMIT instrument,” NASA/JPL, URL: https://earth.jpl.nasa.gov/emit/instrument/overview/
7) ”EMIT instrument specifications,” NASA/JPL, URL: https://earth.jpl.nasa.gov/emit/instrument/specifications/
8) "EMIT Mission Destination," NASA/JPL, URL: https://earth.jpl.nasa.gov/emit/mission/destination/
9) ”EMIT Operations,” NASA/JPL, URL: https://earth.jpl.nasa.gov/emit/instrument/operations/
10) ”Methane ‘Super-Emitters' Mapped by NASA's New Earth Space Mission,” NASA/JPL, October 25, 2022, URL: https://earth.jpl.nasa.gov/emit/news/23/methane-super-emitters-mapped-by-nasas-new-earth-space-mission/
11) ”NASA Dust Detective Delivers First Maps From Space for Climate Science, NASA/JPL, October 12, 2022, URL: https://earth.jpl.nasa.gov/emit/news/21/nasa-dust-detective-delivers-first-maps-from-space-for-climate-science/
12) ”NASA, USGS Map Minerals to Understand Earth Makeup, Climate Change, NASA/JPL, September 30, 2022, URL: https://earth.jpl.nasa.gov/emit/news/20/nasa-usgs-map-minerals-to-understand-earth-makeup-climate-change/
13) Garcia, Mark. “Partners Extend International Space Station for Benefit of Humanity – Space Station.” NASA Blogs, 27 April 2023, https://blogs.nasa.gov/spacestation/2023/04/27/partners-extend-international-space-station-for-benefit-of-humanity/
The information compiled and edited in this article was provided by Herbert J. Kramer from his documentation of: ”Observation of the Earth and Its Environment: Survey of Missions and Sensors” (Springer Verlag) as well as many other sources after the publication of the 4th edition in 2002. - Comments and corrections to this article are always welcome for further updates (eoportal@symbios.space).