Landsat-9
EO
Atmosphere
Ocean
Cloud type, amount and cloud top temperature
Launched in September 2021 as a collaboration between the National Aeronautics and Space Administration (NASA) and United States Geological Survey (USGS), Landsat-9 continues the Landsat program to monitor, understand and manage land resources crucial for sustaining human life. Landsat-9 mission objectives include the collection and archival of moderate-resolution multispectral data, to be made freely available to worldwide users.
Quick facts
Overview
| Mission type | EO |
| Agency | NASA, USGS |
| Mission status | Operational (nominal) |
| Launch date | 27 Sep 2021 |
| Measurement domain | Atmosphere, Ocean, Land, Snow & Ice |
| Measurement category | Cloud type, amount and cloud top temperature, Ocean colour/biology, Multi-purpose imagery (ocean), Radiation budget, Multi-purpose imagery (land), Surface temperature (land), Vegetation, Albedo and reflectance, Ocean topography/currents, Sea ice cover, edge and thickness, Snow cover, edge and depth, Inland Waters |
| Measurement detailed | Ocean imagery and water leaving spectral radiance, Ocean chlorophyll concentration, Cloud cover, Cloud imagery, Land surface imagery, Fire temperature, Vegetation type, Fire fractional cover, Earth surface albedo, Short-wave Earth surface bi-directional reflectance, Leaf Area Index (LAI), Land cover, Land surface temperature, Sea-ice cover, Snow cover, Normalized Differential Vegetation Index (NDVI), Iceberg fractional cover, Bathymetry, Fraction of Absorbed PAR (FAPAR), Glacier motion, Glacier cover, Sea-ice surface temperature, Above Ground Biomass (AGB), Active Fire Detection, Long-wave Earth surface emissivity, Permafrost, Evapotranspiration, Cloud mask, Surface Water Extent, Mineral Type |
| Instruments | TIRS-2, OLI-2 |
| Instrument type | Imaging multi-spectral radiometers (vis/IR) |
| CEOS EO Handbook | See Landsat-9 summary |
Summary
Mission Capabilities
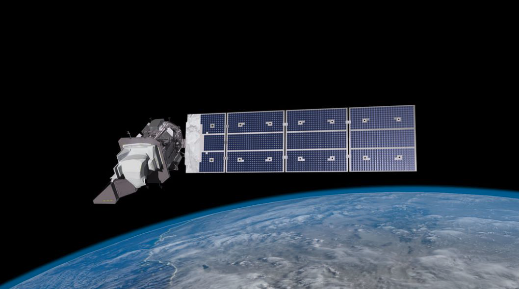
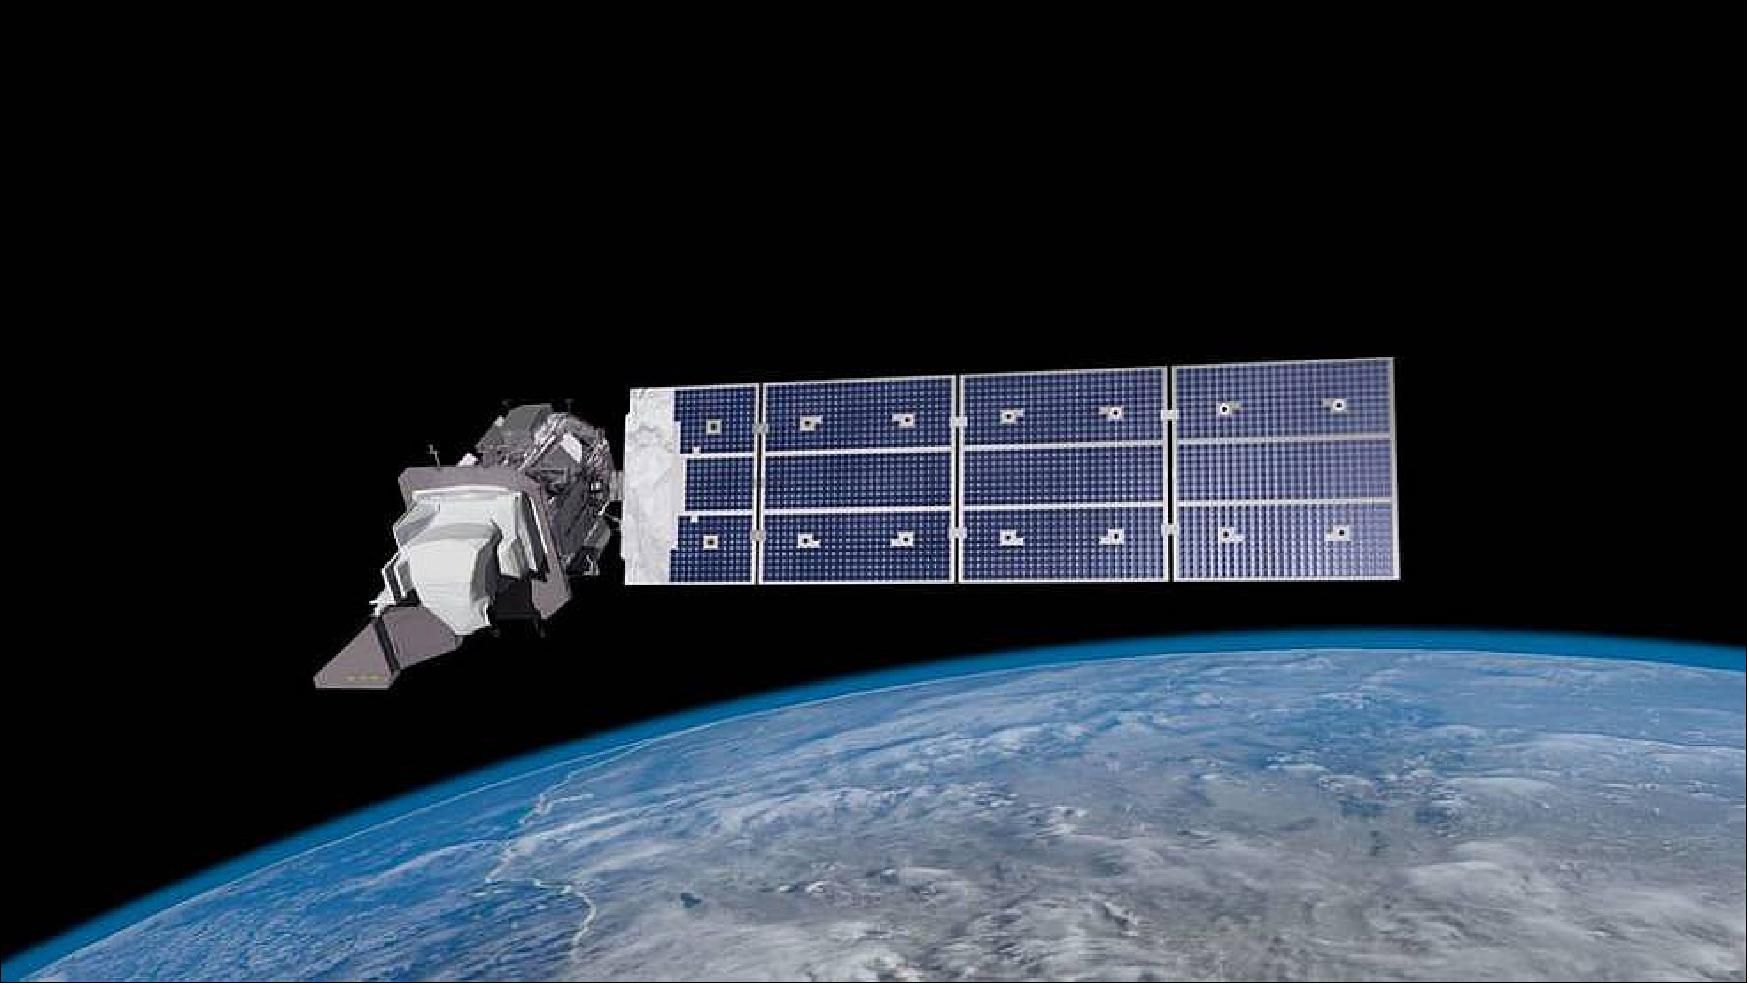
The sensors found on Landsat-9 include the Operational Land Imager-2 (OLI-2) and the Thermal Infrared Sensor-2 (TIRS-2). OLI-2 is an identical sensor to OLI flown on Landsat-8, to allow for data continuity and reduce the risk of failure. TIRS-2 is near-identical to TIRS (on Landsat-8), with minor improvements in redundancy in electronics.
OLI-2 is a pushbroom sensor that images in the visible, near-infrared (NIR) and shortwave infrared (SWIR) portions of the electromagnetic spectrum, with spectral bands allowing OLI-2 to monitor coastal waters and detect cirrus clouds in the atmosphere. TIRS-2 is a pushbroom thermal-imaging sensor that houses three modules with Quantum Well Infrared Photodetectors (QWIP) arrays to capture evapotranspiration data and map urban heat fluxes.
Performance Specifications
Providing data continuity across both sensors, OLI-2 and TIRS-2 both have a swath width of 185 km across-track, made possible using a 15° Field Of View (FOV). Landsat-9 images in 11 different bands, with two bands being thermal bands. TIRS-2 is limited to a spatial resolution of 100 m. OLI-2 images in all bands with a spatial resolution of 30 m except for the panchromatic band, which images at a spatial resolution of 15 m at nadir.
Landsat-9 operates in a near-polar sun-synchronous orbit at an altitude of 705 km, and an inclination of 98.2°. The orbital period is 99 minutes, with a revisit time of 16 days. Landsat-9 operates in a coplanar orbit with Landsat-8 (180° apart), which allows for the revisit time to be halved to 8 days.
Space and Hardware Components
Landsat-9 was constructed at Northrop Grumman Innovation Systems, based on the LEOStar-3 platform, which is also found on Landsat-8. With a design life of five years and onboard consumables sufficient to support it up to ten years, almost all control electronics onboard have a backup for redundancy purposes, should components become inoperable in orbit.
Landsat-9 has a comprehensive ground segment that consists of the Mission Operations Centre (MOC), Flight Operations Team (FOT), Data Processing and Archive System (DPAS) and Ground Network Element (GNE). MOC is used to send commands to the satellite, as well as receive telemetry data, FOT plans missions and monitors the status of the satellite, as well as maintaining orbit and attitude, DPAS is used to assess and process images for storage and distribution, and GNE communicates with the satellite through the use of X-band and S-band frequency.
Landsat-9
Landsat-9 — a partnership between NASA and USGS (U.S. Geological Survey) — continues the Landsat program’s critical role in monitoring, understanding and managing the land resources needed to sustain human life. Today’s increased rates of global land cover and land use change have profound consequences for weather and climate change, ecosystem function and services, carbon cycling and sequestration, resource management, the national and global economy, human health, and society. 1) 2)
Landsat is the only U.S. satellite system designed and operated to repeatedly observe the global land surface at a moderate scale that shows both natural and human-induced change.
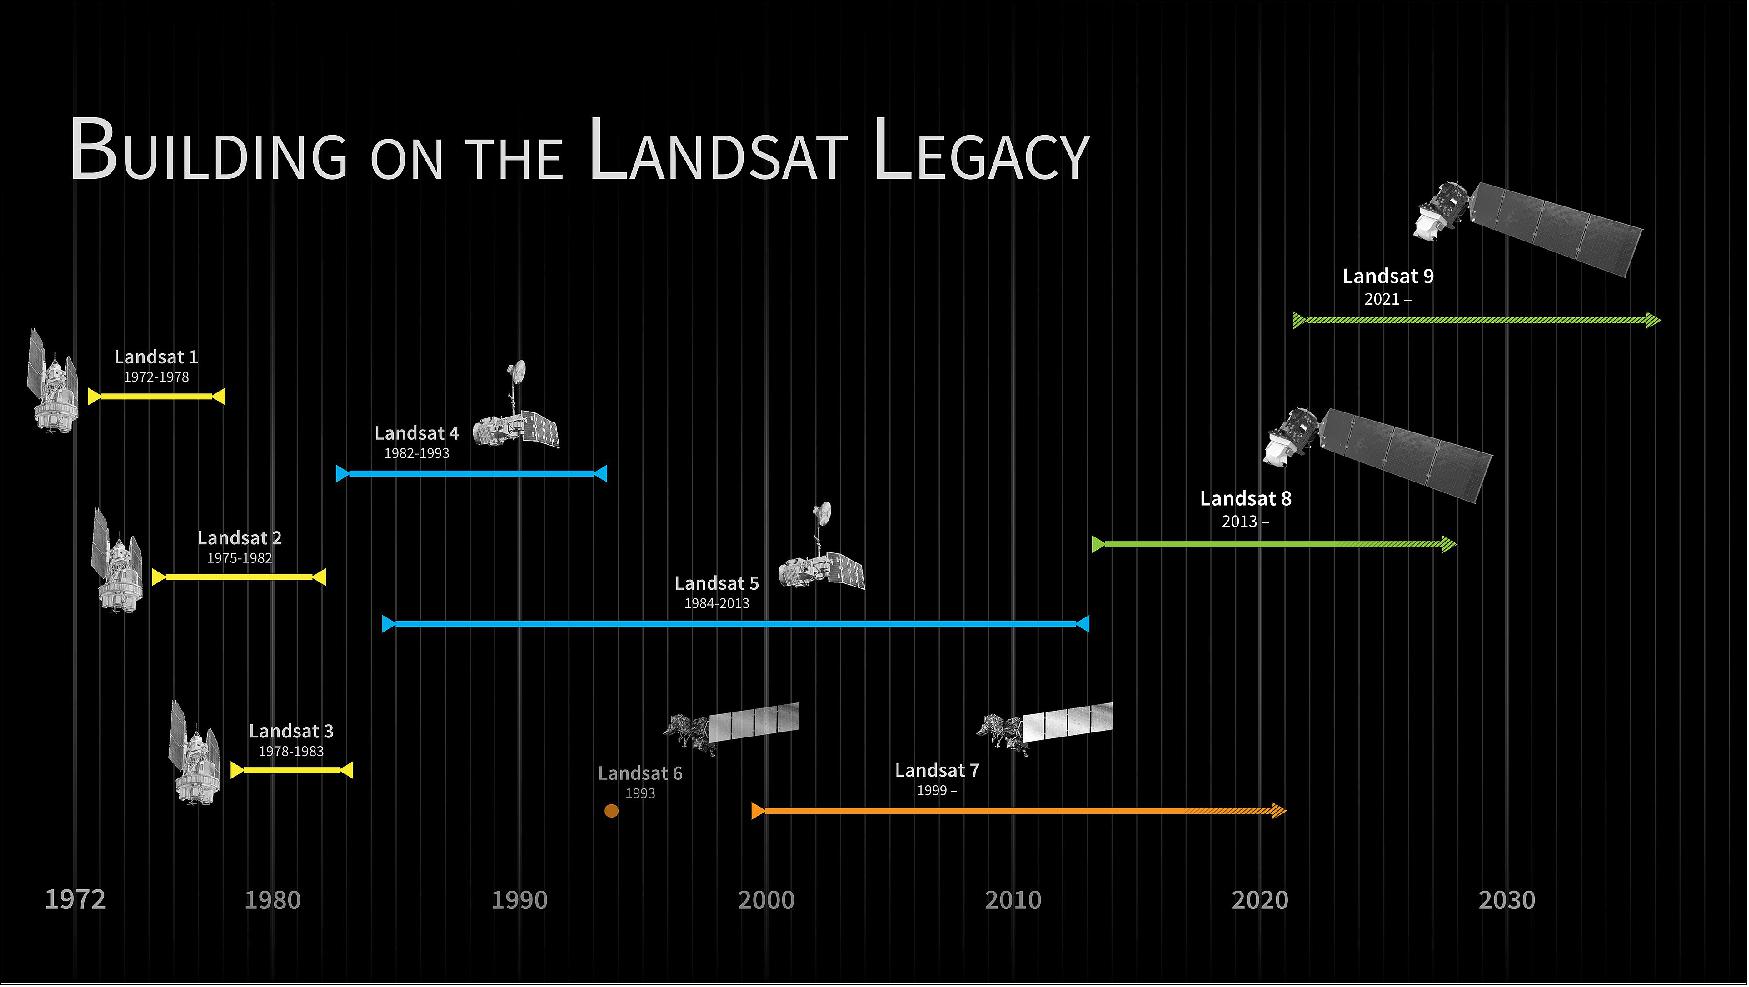
• In 2016, the Landsat-9 project was fast-tracked for a December 2020 launch (initially planned for 2023) .The risk reduction of a Landsat data gap was a high priority of the U.S. Sustainable Land Imaging Program. Landsat-9 is a rebuild of Landsat-8 so it can be launched as soon as possible. 3)
- Hence, NASA HQ amended direction in response to FY16 appropriations and associated congressional language targeting a 2020 launch.
- In January 2016, the project was directed to pursue the earliest possible launch date within the spending authority provided in FY16.
- Project had $100M in Congressionally directed spending authority for FY16: $58M of unspent carryover from FY15, $42M in new FY16 funding.
- Substantial progress in FY16 was required for maintaining CY2020 LRD (Launch Readiness Date).
According to Jeff Masek, the project scientist: “With a launch in 2020, Landsat-9 will propel the program into the next half-century of global observations. That’s the hallmark of Landsat: the longer the satellites view the Earth, the more phenomena you can observe and understand.”
Landsat-9, like Landsat-8, has a higher imaging capacity than past Landsat missions, allowing more valuable data to be added to the Landsat’s global land archive.
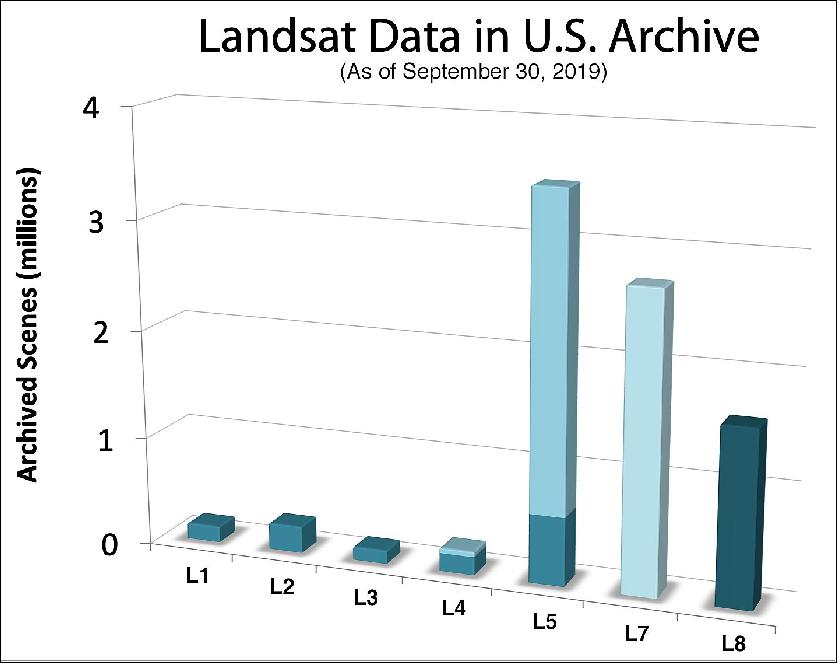
Landsat-8, after collecting data for 3.5 years, has already added over 827,000 images to the archive—this represents 12.5 percent of the entire 44-year Landsat data collection—and each day Landsat-8 adds another ~700 new scenes. Landsat-9, like Landsat-8, are both radiometrically and geometrically better than earlier generation Landsats.
Landsat-9 is Essential for Informed Land Use Decisions
Landsat-9 extends our ability to measure changes on the global land surface at a scale where we can separate human and natural causes of change. When land use and resource availability issues arise, Landsat-9 helps decision makers make informed management decisions. Landsat-9 thus contributes a critical component to the international strategy for monitoring the health and state of the Earth.
Landsat users can take advantage of more frequent observations (every 8 days using two satellites). Applications such as weekly tropical deforestation alerts, water quality monitoring, and crop condition reports are feasible with the constellation.
With increased activity in international and commercial remote sensing, Landsat has emerged as a cornerstone of the global constellation of imagers. The science quality of the Landsat archive, including careful calibration, allows it to serve as a “gold standard” for studies harmonizing multiple sources of satellite imagery.
Landsat-9 will Enable Informed Decision Support for Key Areas
• Tropical deforestation and global forest dynamics: the Landsat archive provides an impartial and unbiased record of Earth’s forests for world governments and resource organizations to verify claims of environmental protection and carbon storage.
• Urban expansion: the Landsat record helps us visualize the impact of humankind’s convergence on urban centers and to understand the environmental consequences.
• Water use: Landsat-9 is an invaluable tool for managing water in areas such as the Western U.S. where water is scarce and water usage between agriculture, industry, and residential needs is very competitive.
• Coral reef degradation: Landsat has helped enable global monitoring of Earth’s reefs.
• Glacier and ice-shelf retreat: the Landsat archive chronicles changes to 98 percent of Earth’s glaciers, and Landsat-9 will continue monitoring them into the future.
• Natural and man-made disasters: Landsat data is regularly used as part of the International Disaster Charter, mapping disaster impacts to save lives.
• Climate change: Landsat data provides a direct view of how almost five decades of climate change have affected Earth’s surface and biology.
Some background: NASA and the U.S. Geological Survey (USGS) started work on Landsat-9 in April 2015, which launched in September 2021, to extend the Earth-observing program’s record of land images to half a century. 4)
Landsat is a remarkably successful partnership," said Sarah Ryker, USGS deputy associate director for climate and land use change, Reston, Virginia. "Last year the White House found that GPS, weather satellites, and Landsat are the three most critical types of Earth-orbiting assets for civil applications, because they're used by many economic sectors and fields of research. Having Landsat-9 in progress, and a long-term commitment to sustainable land imaging, is great for natural resource science and for data-driven industries such as precision agriculture and insurance."
NASA’s Goddard Space Flight Center in Greenbelt, Maryland, led the development of the Landsat-9 flight segment. Goddard also built the TIRS-2 (Thermal Infrared Sensor-2), which is similar to the TIRS that the center built for Landsat-8. The new improved TIRS has a five-year design lifetime, compared to the three-year design lifetime of the sensor on Landsat-8.
With decades of observations, scientists can tease out subtle changes in ecosystems, the effects of climate change on permafrost, changes in farming technologies, and many other activities that alter the landscape.
SLI (Sustainable Land Imaging) 2016-2035
President Obama's NASA budgets of FY14 and FY15 called for design and initiation of an affordable, sustained, Land Imaging Satellite System (with USGS) to extend the Landsat data record for decades –not just the “next mission”. 5)
The SLI program enables the development of a multi-decade, spaceborne system that provides users worldwide with high-quality, global, land-imaging measurements that are compatible with the existing 44-year Landsat data record. Landsat-9 is the latest satellite in the Landsat series — it continues Landsat’s irreplaceable record of Earth’s land surface upon its 2020 launch. To reduce the build time and a risk of a gap in observations, Landsat-9 largely replicates its predecessor Landsat-8.
Landsat Program on-orbit Status as of July 2015
Landsat-7
• Launched in 1999
• Scan Line Corrector instrument hardware failure in 2003 resulted in a loss of 22% of each Landsat-7 scene
• Collecting ~475 scenes per day; ~22% of pixels missing per scene (faulty scan-line corrector)
• LS-7 collection strategy modified to concentrate on continental coverage(L8 capturing islands and reefs)
• Expected to be decommissioned in 2020 (potential extension by an additional 24 months beyond 2020 if science is still valuable from data acquired earlier than 09:30 MLT).
Landsat-8
• Launched in February 2013
• OLI (Operational Land Imager); the 30 m resolution, multispectral instrument) is operating superbly
• TIRS (Thermal Infrared Sensor) is experiencing a stray light problem in one of two channels; also now operating on redundant hardware
• Currently collecting 725 scenes/day (exceeding the requirement of 400 scenes/day)
• Fuel could last ~20 years based on operational consumption to date.
Legend to Figure 1:
- a) Limited data of Landsat-4 due to transmitter failure soon after launch. Only 45,172 Landsat-4 TM (Thematic Mapper) scenes from 1982-1993 are available for science users ~10 scenes/day (versus 725 scenes/day from Landsat-8)
- b) Data coverage of Landsat-5 is limited to CONUS (Continental US) and international ground station sites after a transmitter failure in 1987; the MSC (Multispectral Scanner) turned off in August 1995.
- c) Degraded performance due to SLC (Scan Line Corrector) failure in May 2003.
Landsat-9 Mission Objectives
• Collect and archive moderate-resolution, reflective and emissive multispectral image data affording seasonal coverage of the global land mass for a period of no less than five years.
• Ensure that Landsat-9 data are sufficiently consistent with data from the earlier Landsat missions, in terms of acquisition geometry, acquisition rates, calibration, coverage characteristics, spectral and spatial characteristics, output product quality, and data availability to permit studies of land cover and land use change over multi-decadal period.
• Distribute standard Landsat-9 data products to users on a nondiscriminatory basis and at no cost to the users.
Spacecraft
The Landsat-9 satellite was constructed at Northrop Grumman Innovation Systems (formerly Orbital ATK in Gilbert, AZ), NASA awarded a contract in October 2016. 6) Landsat-9 was based on the company’s LEOStarTM-3 platform, the medium-class LEO (Low Earth Orbit) spacecraft successfully flown on Landsat-8 and NASA’s Fermi and Swift Gamma-ray astrophysics observatories. Landsat-9 was designed, manufactured and tested by Orbital ATK’s Space Systems Group at its facilities in Gilbert, Arizona, the same location and production team that executed the Landsat-8 program. Orbital ATK also supported launch, early orbit operations and on-orbit check-out of the observatory, which was scheduled for launch in December of 2020. 7) 8)
Project Development Status
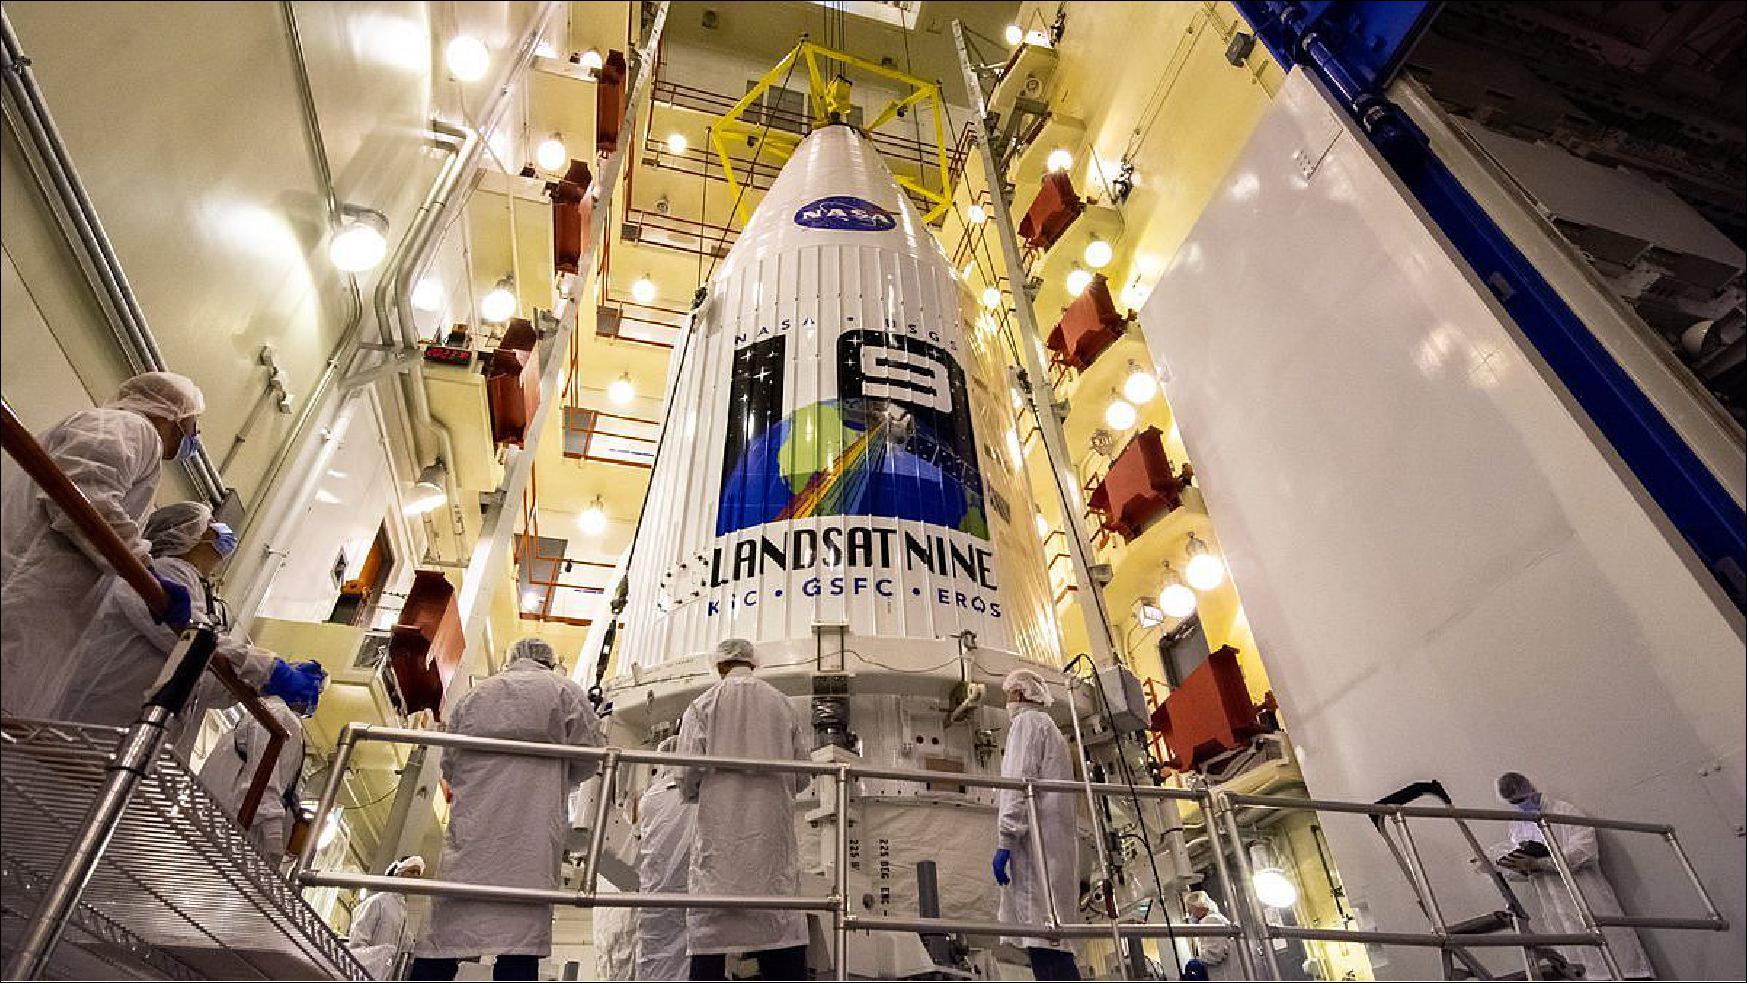
• September 21, 2021: The Landsat-9 observatory was mounted on top of a United Launch Alliance Atlas 5 rocket in California for liftoff Sept. 27, continuing an unbroken record of Earth observations to track urban sprawl, water usage, tropical deforestation, retreating glaciers, and more over the last half-century. 9)
• August 31, 2021: A one-week delay in the launch of the next Landsat satellite on an Atlas 5 was the result of a ripple effect in the supply chain caused by increased demand for liquid oxygen to treat COVID-19 patients. 10)
- NASA announced Aug. 27 that the launch of Landsat 9 on an Atlas 5 from Vandenberg Space Force Base in California had slipped a week, from Sept. 16 to no earlier than Sept. 23, because “pandemic demands for medical liquid oxygen have impacted the delivery of the needed liquid nitrogen supply.” Liquid nitrogen, or LN2, is used to create gaseous nitrogen needed to support launch site activities.
- During an Aug. 31 virtual news briefing about the launch, Del Jenstrom, NASA Landsat-9 project manager, said the issue was not an overall lack of liquid nitrogen but instead a transportation issue.
- “There’s plenty of liquid nitrogen in the Los Angeles area. The problem is they need some trucks to bring it up to Vandenberg,” he said. “Because of the pandemic, from what we understand, liquid oxygen deliveries have been paying much higher premiums than liquid nitrogen deliveries, and LN2 trucks have been converted to carry liquid oxygen.”
- Jenstrom said that the Defense Logistics Agency (DLA) informed the project Aug. 23 that liquid nitrogen supplies at the base were “critically low” and could not support prelaunch test activities or the launch itself. That prompted NASA Deputy Administrator Pam Melroy to contact senior DLA officials to discuss ways to restore the base’s nitrogen supply.
- Airgas, the company that handles the nitrogen supply at Vandenberg, is bringing in “a dozen or so” liquid nitrogen tankers from the Gulf Coast temporarily to increase deliveries. “We’re seeing a substantial increase of the number of LN2 deliveries to the base right now,” he said, “and as far as we know, based on latest reports, we’re on track to support our launch on Sept. 23.”
- Supply chain issues related directly or indirectly to liquid oxygen, which is used by hospitals as the oxygen source for ventilators, came to light recently when Gwynne Shotwell, president and chief operating officer of SpaceX, mentioned them during a panel discussion at the 36th Space Symposium in Colorado Springs Aug. 24.
- “We’re actually going to be impacted this year with the lack of liquid oxygen for launch,” she said. “We certainly are going to make sure the hospitals are going to have the oxygen that they need, but for anybody who has liquid oxygen to spare, send me an email.”
- At that time, Tory Bruno, chief executive of United Launch Alliance, hinted at a problem getting liquid nitrogen to Vandenberg to support the Landsat-9 launch. “Working that situation now,” Bruno said.
- The next launch planned for Vandenberg was not the Atlas 5 launch of Landsat-9. Instead, Firefly Aerospace had scheduled the inaugural launch of its Alpha rocket from the base on Sept. 2, during a four-hour window that opened at 9 p.m. Eastern. Company spokesperson Kim Jennett told SpaceNews Aug. 31 the launch remains on schedule and is not affected by any liquid nitrogen or other supply issues.
- Liquid oxygen supply chain problems extend beyond the United States. Dmitry Rogozin, head of Roscosmos, tweeted Aug. 29 that Roscosmos had for months been transferring “almost all” of the oxygen produced by its various enterprises to hospitals. That has postponed testing of rocket engines, he claimed.
• August 16, 2021: Landsat-9, a joint NASA and U.S. Geological Survey satellite mission, is scheduled to launch Thursday, Sept. 16, from Vandenberg Space Force Base in California. To help the media and public learn more about the project and its near 50-year history, NASA launched a new interactive website: http://www.nasa.gov/landsat9 11)
- The Landsat Program missions changed the field of Earth science when the Landsat 1 satellite launched in 1972. In 2008, the program created new opportunities for research around the world when it made decades of Landsat data available to the public for free.
- The Landsat-9 satellite continues the program's critical role in monitoring, understanding, and managing land resources – agricultural crops, water, and forests – needed to sustain human life.
- Landsat’s data of Earth’s surface as seen from space have transformed scientists’ understanding of regional, national, and global-scale changes in land use and land cover, providing information for sectors including agriculture, forestry, urbanization, hydrology, and homeland security and disaster mitigation. Landsat-9 continues this record of monitoring key natural and economic resources, as well as global environmental changes into the future.
- Once fully commissioned in orbit after launch, Landsat-9 replaces Landsat-7 and joins its sister satellite, Landsat-8. Together, they will collect images that capture Earth’s land surfaces every eight days.
- Landsat-9 uses similar instrument technology to Landsat-8. Carrying two sensors, the Operational Land Imager-2 (OLI-2), built by Ball Aerospace & Technologies Corporation, and the Thermal Infrared Sensor-2 (TIRS-2), built at NASA’s Goddard Space Flight Center in Greenbelt, Maryland, it detects the reflected light and heat emitted from Earth’s surface across the visible, near infrared, shortwave infrared, and thermal infrared wavelengths.
- The instruments capture more than 700 new images daily across 11 wavelengths at 30-meter resolution. This resolution is fine enough to detect even small agricultural fields, buildings, forest stands, and lakes, while still providing a broad enough swath to cover large areas of terrain. With its 11 wavelengths, the instruments capture information about Earth, including data related to coastal waters, forests, healthy and unhealthy plants, and wildfire scars in the visible light to thermal infrared ranges.
- United Launch Alliance is the spacecraft provider for Landsat-9’s launch. Northrop Grumman built the Landsat-9 spacecraft, integrated it with instruments, and tested the observatory.
- The U.S. Geological Survey Earth Resources Observation and Science Center will operate the mission and manage the ground system, including maintaining the Landsat archive.
- To date, more than 18,000 peer-reviewed research papers have used Landsat data, and many public and private programs use it to support agriculture, forest management, urban development, wildfire-damaged vegetation recovery, and many more applications.
• August 1, 2021: Landsat-9 was in its final preparations for launch from Vandenberg Space Force Base on 16 September 2021. It completed its environmental testing at Northrop Grumman Space (NGSP) in Gilbert, Arizona and was transported to its California launch site. It was launched into a 705 km orbit replacing Landsat-7 to provide 8-day Earth land mass coverage in concert with Landsat-8. Landsat-8 carried the first Operational Land Imager (OLI) and the Thermal Infrared Sensor (TIRS); Landsat-9 carries the second of each: OLI-2 and TIRS-2. It undertook a 90-day activation, checkout, characterization and calibration, a.k.a. commissioning phase before transitioning to operations. For a several-day period during this commissioning phase, Landsat-9 under-flew Landsat-8, allowing near simultaneous data collection by both sensors of common Earth targets. These data were used to compare the radiometric calibrations of the instruments and allow for adjustments of processing parameters to provide more consistent data products. 12)
• August 14, 2020: Landsat is the only U.S. satellite system designed and operated to repeatedly observe the global land surface at a moderate scale that shows both natural and human-induced change. 13) 14)
- Since reducing the risk of a Landsat data gap is a high priority of the U.S. Sustainable Land Imaging Program, Landsat-9 has a design very similar to Landsat-8’s; allowing the Landsat-9 build and launch to be expedited.
- Landsat-9, launched in September 2021, joined Landsat-8 in orbit; the satellite orbits are 8 days out of phase. Landsat 9 replaced Landsat-7 (launched in 1999), taking its place in orbit (8 days out of phase with Landsat-8). The combined Landsat-8 + Landsat-9 revisit time for data collection is every 8 days, like it currently is for Landsat-8 + Landsat-7.
- Landsat-9, like Landsat-8, has a higher imaging capacity than past Landsats, allowing more valuable data to be added to the Landsat’s global land archive.
- Landsat-8, after collecting data for 7 years, has added over 1.6 million images to the archive and each day Landsat-8 adds another ~700 new scenes.
- Landsat-9, like Landsat-8, are both radiometrically and geometrically better than earlier generation Landsats.
• April 3, 2020: Landsat-9 successfully passed its Mission Operations Review. Together, NASA and USGS demonstrated that the Landsat-9 ground system and mission operation preparations are highly mature. The maturity of the Landsat-9 ground system and mission operation development significantly exceeds the requirements of the Mission Operations Review, putting the Landsat-9 mission well on track to complete remaining preparations prior to launch. 15) 16)
- The Mission Operations Review panel lauded the Landsat-9 mission for the excellent joint agency teamwork between NASA and USGS, the exceptional quality of presentation materials, and the team’s creative and flexible responses in the face of major challenges, including the COVID-19 pandemic.
- Both Landsat-9 Project Managers, Del Jenstrom (NASA) and Brian Sauer (USGS), extended their praise and appreciation to the Landsat-9 ground system and mission operations readiness team for their work that led to a highly successful review performance.
- The joint NASA/USGS Landsat 9 mission continues the nearly 50-year Landsat data record, providing actionable information to resource managers and policymakers around the world. In 2021, Landsat-9 will join Landsat-8 in orbit and the two satellites will work together to record the condition of Earth’s ever-changing land surface, enabling scientists and others to monitor crops and algal blooms, to assess deforestation trends and urban growth, and to aid disaster management.
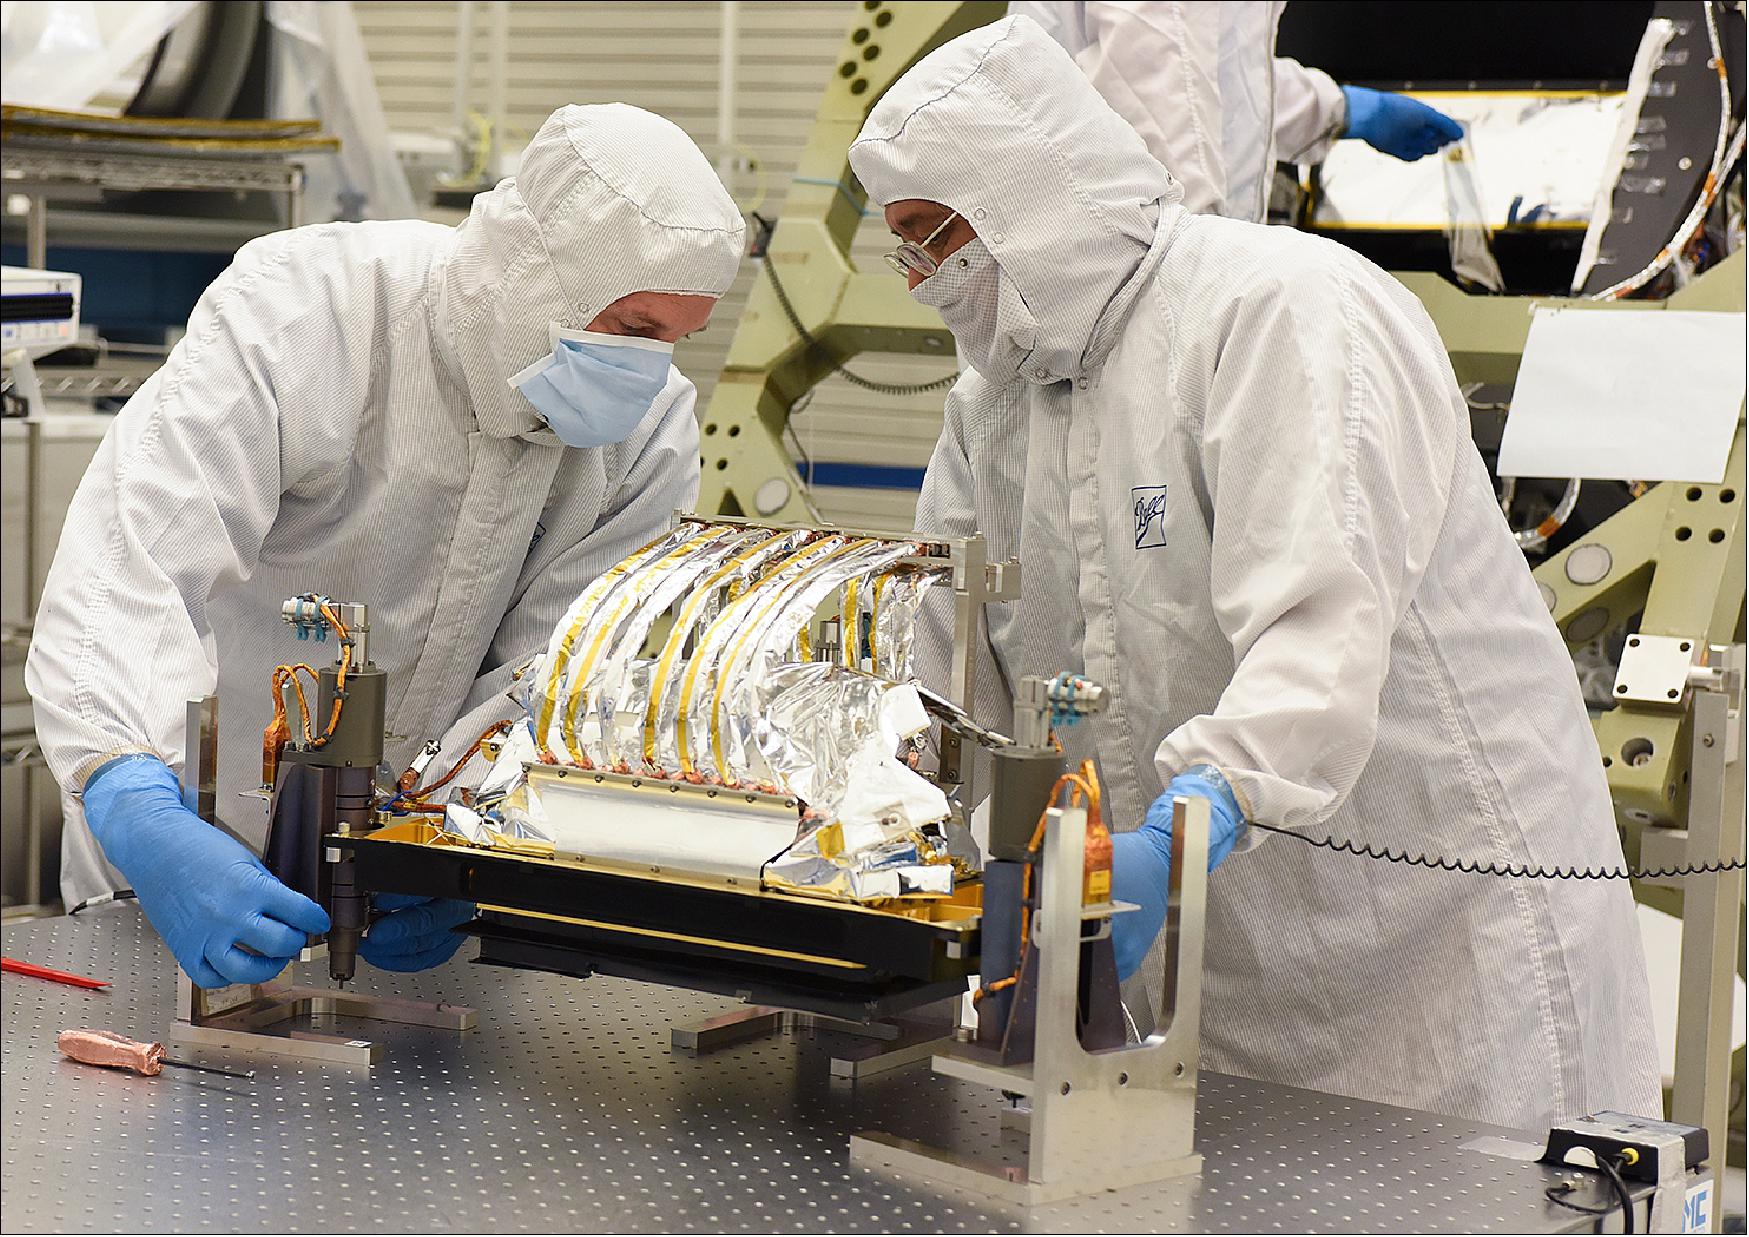
• January 9, 2020: Landsat 9’s two science instruments were attached to the spacecraft, bringing the mission one step closer to launch. In late December, the Operational Land Imager 2 (OLI-2) and the Thermal Infrared Sensor 2 (TIRS-2) were both mechanically integrated on to the spacecraft bus at Northrop Grumman in Gilbert, Arizona. 17)
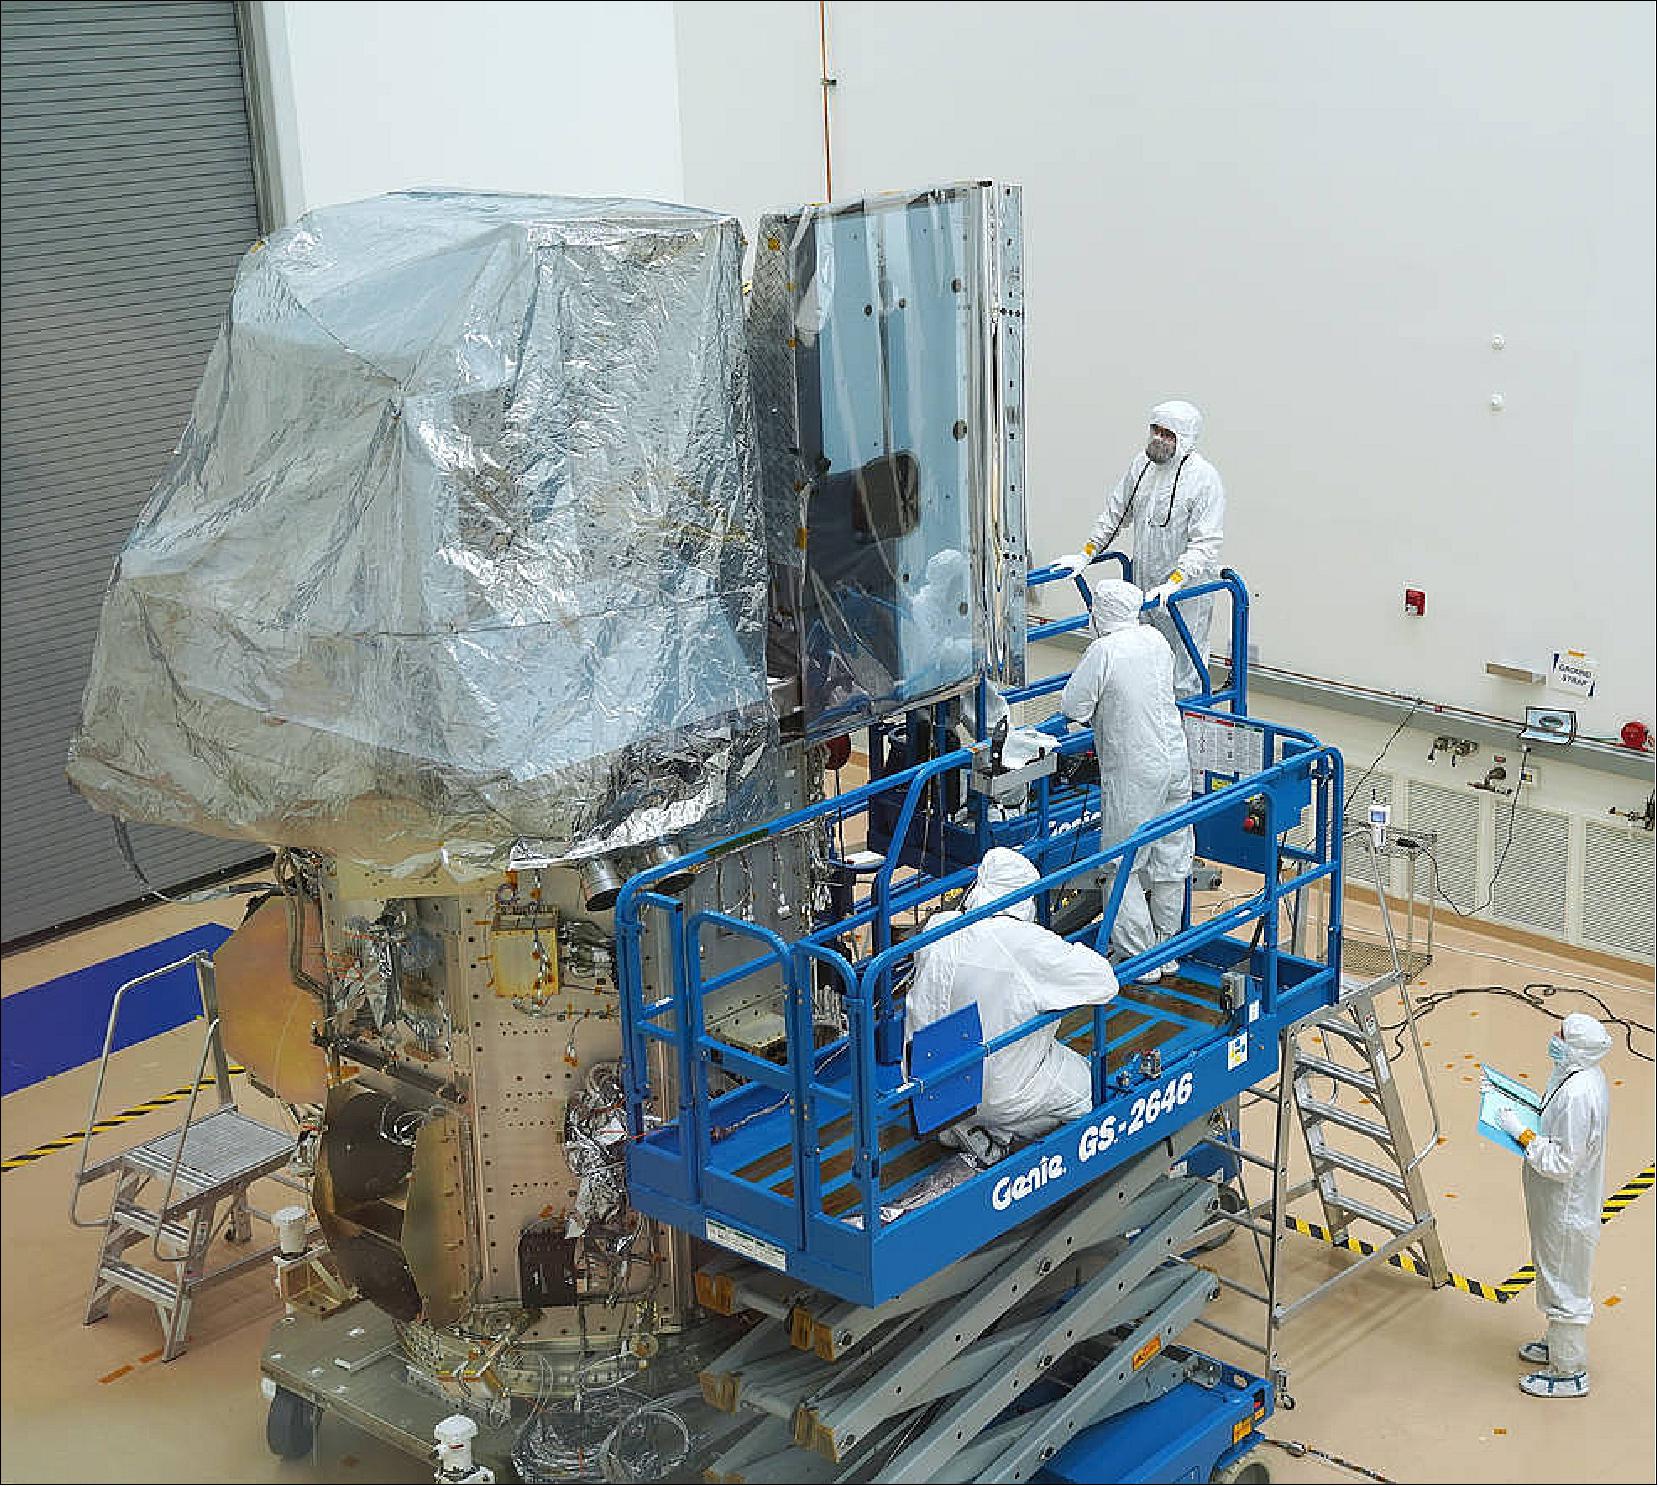
- Engineers will next work on the electrical integration of the instruments, which includes getting power to the instruments and incorporating the satellite’s data-handling hardware.
• September 27, 2019: The Landsat-9 instrument that will help scientists detect deforestation, monitor crops and track potentially toxic algal blooms, among many other uses, is now built, tested, and in place to be assembled onto the spacecraft. 18)
- OLI-2 (Operational Land Imager 2) detects visible and infrared light from Earth’s surface, providing data on our changing planet. Like its predecessor that launched in 2013 on the Landsat-8 satellite, OLI-2 contains thousands of sensors that view a swath of Earth’s surface in nine spectral bands, optimized to detect different features on the surface.
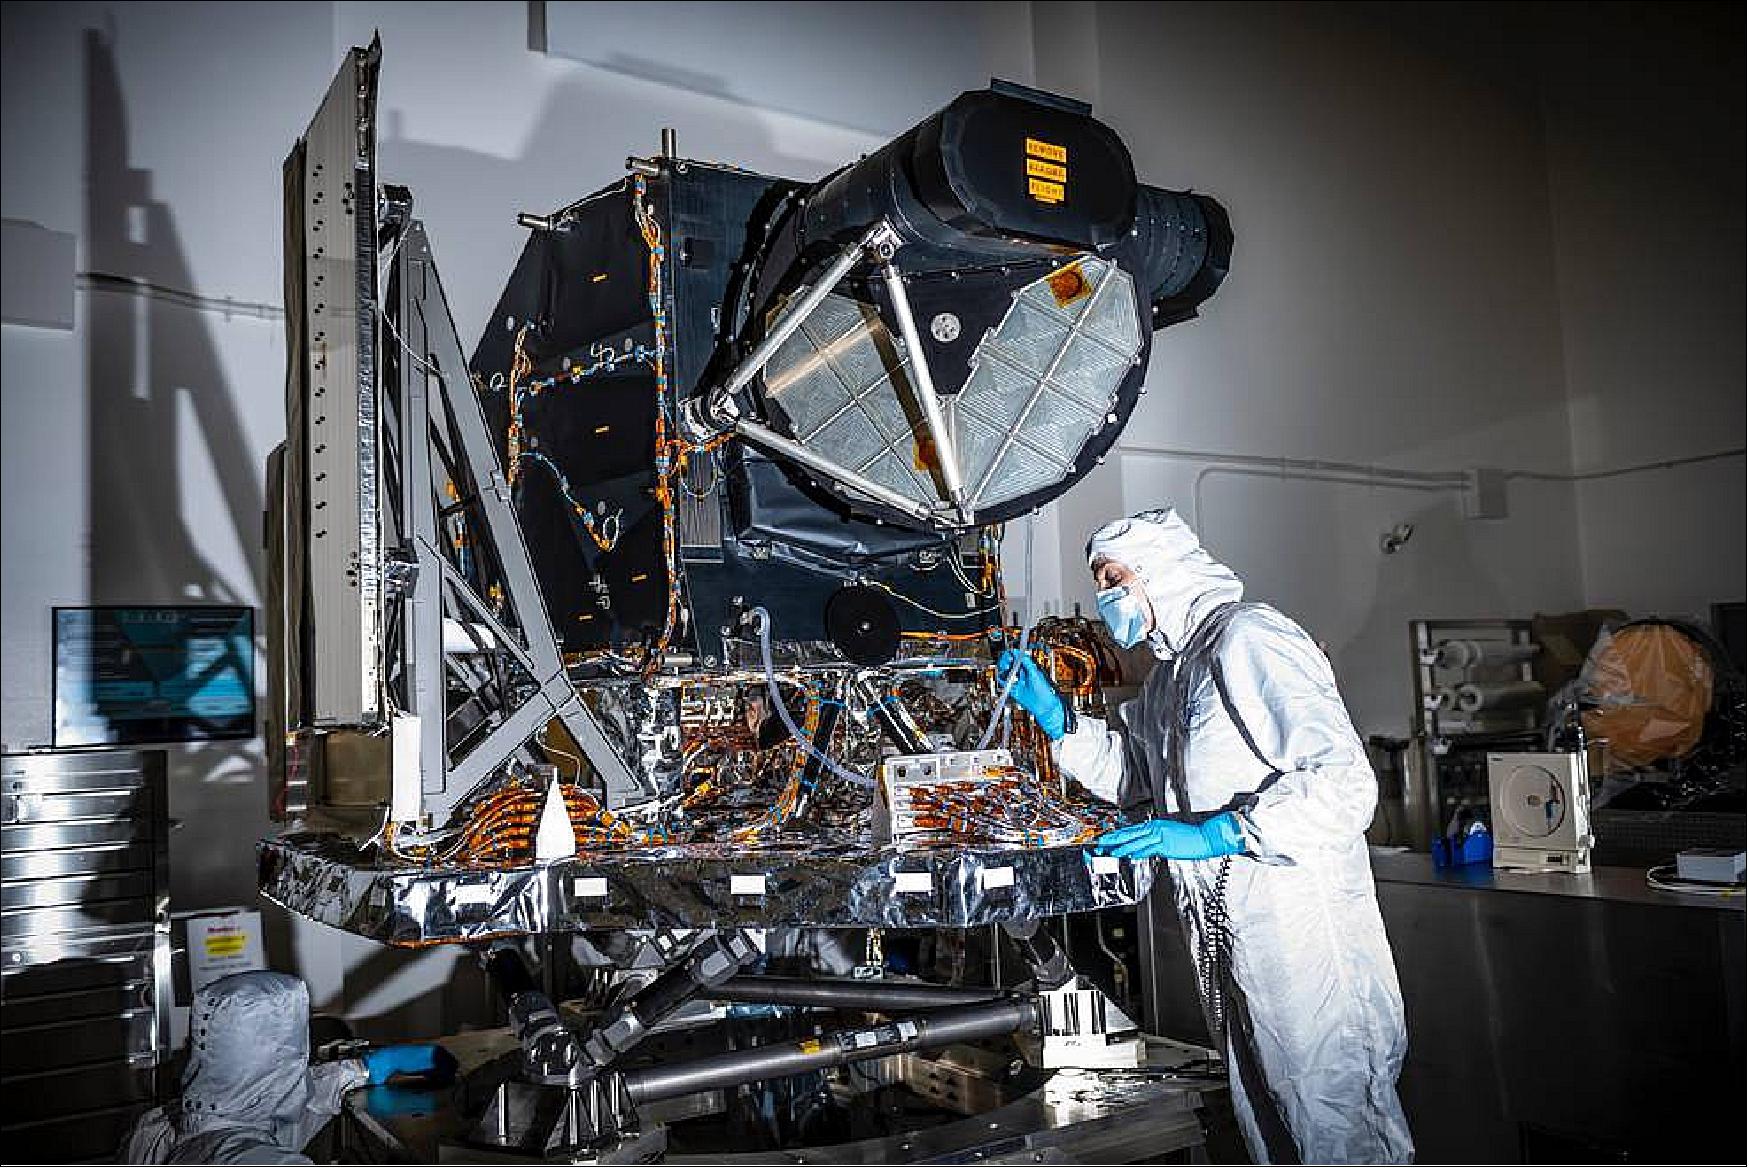
• August 23, 2019: This month, TIRS-2 successfully passed the stringent 12-week testing process at NASA's Goddard Space Flight Center in Greenbelt, Maryland. It was shipped to Northrop Grumman’s facility in Arizona, where it and the OLI-2 (Operational Land Imager-2) are assembled onto the Landsat-9 spacecraft. Landsat-9 is a joint effort of NASA and the U.S. Geological Survey. 19)
- Like digital cameras on a smart phone, the TIRS-2 instrument is an imager, said Joel McCorkel, the instrument’s deputy project scientist. But while a camera detects light reflected off an object, TIRS-2 detects the thermal energy that an object emits. The hotter a surface is, the more energy the instrument will detect. And since TIRS-2 is a highly-calibrated scientific instrument, not a camera, it provides data that researchers can use to investigate key questions about our home planet.
- TIRS-2 is designed to work in the same way as the first TIRS instrument, which launched on Landsat-8 in 2013 and is still collecting important data on Earth’s surface temperature. But the latest version has a couple improvements.
- “The beauty of TIRS-2, is that we had TIRS data from up in orbit and were able to look at what worked, and how we could mitigate what didn’t work,” said Melody Djam, TIRS-2 instrument deputy project manager at Goddard.
- The TIRS-2 team incorporated a new optical component to shield the instrument’s sensor from stray light that had caused problems on the original instrument, requiring software fixes. The first TIRS was also designed, constructed, and integrated in less than three years – which is an incredibly quick turnaround for a satellite’s instrument – and so it was only required to last three years. TIRS-2, however, was designed with redundant electronics and other components in order to last at least five years.
- IRS-2 has about 10 main components, and each one was built and tested individually before engineers brought everything together to ensure the instrument worked, Djam said. The engineering team, which included as many as 250 people, then tested the whole instrument both in the clean room, as well as in environmental chambers that simulate the launch and space environments.
- With round-the-clock shifts and successful tests, the team delivered the instrument more than two weeks ahead of its target date. TIRS-2 passed its pre-ship review on Aug. 12 and was trucked to Gilbert, Arizona in two shipments. At the Northrop Grumman facility, the team will reassemble it, test it, and make sure everything is ready to integrate the instrument with the Landsat 9 spacecraft this fall.
Taking Earth’s temperatures from orbit
- Landsat satellites have been observing Earth since 1972, building the longest continuous record from space of the planet’s forests, farms, cities, and other surfaces. Starting with Landsat-4 and continuing through the first TIRS instrument on Landsat-8, the satellites have carried instruments that can detect thermal energy as well as visible and infrared light – and water managers and others have put these observations to work.
- “Landsat’s thermal data is critical for tracking water use in the western United States, where rainfall can be short in supply and managing water resources is critical to ensuring a sustainable supply for farmers, cities, and natural ecosystems,” said Bruce Cook, Landsat-9 deputy project scientist at Goddard.
- When plants take up water from the soil, they ‘sweat’ it out as they undergo transpiration, cooling them down just as sweating cools people down. By measuring the temperature of growing plants and soils that are cooled by transpiration and evaporation, respectively, Landsat users can create maps that quantify water use and consumption. The accuracy of these maps is increased by TIRS’ two thermal bands, which allows researchers to subtract out the effect of atmospheric constituents better than with the single-band thermal data from previous Landsat instruments.
- TIRS also works “behind the scenes” to detect clouds that are difficult to sense with visible data alone, which makes it an important filter for scientists constructing Landsat time series to record disturbances and changes in land cover over time.
- “With TIRS, scientists can better identify clouds, remove those data, and focus on the real land surface,” said McCorkel. “This increases the efficiency of their study and the accuracy of their science, whether they’re looking at a plot of land or a continent.”
• On June 6, 2018, Northrop Grumman Corporation announced it has closed the acquisition of Orbital ATK Inc. (“Orbital ATK”), a global leader in aerospace and defense technologies. Orbital ATK is now Northrop Grumman Innovation Systems, a new, fourth business sector. — Hence, the Landsat-9 spacecraft development news are reported under the label of Northrop Grumman. 20)
• May 23, 2018: Landsat-9 continues the Landsat program’s critical role in monitoring, understanding and managing the land resources needed to sustain human life. To do so, Landsat-9 carries two science instruments: the Operational Land Imager 2 (OLI-2) and the Thermal Infrared Sensor 2 (TIRS-2). 21)
• April 25, 2018: The Landsat-9 Mission Critical Design Review was held April 17-20, 2018 at NASA/GSFC (Goddard Space Flight Center), Greenbelt, MD. NASA and USGS scientists and engineers provided the Standing Review Board (SRB) a status on all segments including the spacecraft, instruments, launch vehicle, and ground system to date. 22)
- The SRB had high praise for the accomplishments and the strengths of the Landsat-9 project team. Highlights noted included the high degree of experience and expertise throughout the project, the close working relationship among agency team members, the project’s strong technical maturity, the cost and schedule performance to date, the maturity of plans going forward, and exemplary use of lessons learned. The SRB assigned one request for action (RFA) related to USGS funding reserve levels.
• April 10, 2018: The USGS and NASA held a Landsat-9 Ground System Preliminary Design Review (GPDR) on March 20-22, 2018 in Sioux Falls, South Dakota. The GPDR, which contained the Data Processing and Archive System (DPAS), Ground Network Element (GNE) and Landsat Multi-Satellite Operations Center (LMOC) components, demonstrated that the proposed design of each component satisfied the required functional and performance requirements to continue the Landsat-9 development process. 23)
- With the GPDR a success, the Ground System proceeded to the Critical Design Review, which was planned for Fall 2018 – which ensured the Landsat-9 mission remained on schedule for a launch readiness date of December 2020.
• March 15, 2018: Northrop Grumman (former Orbital ATK) had been given approval to begin building the NASA Landsat-9 spacecraft after completing a comprehensive design review of the mission. Northrop Grumman designed and manufactured the satellite, integrating two science instruments, and supporting launch, early orbit operations and on-orbit check-out of the observatory. 24)
- Representatives from NASA and Northrop Grumman successfully completed a rigorous Critical Design Review (CDR) demonstrating that the program met all technical performance measures and requirements. The execution of the design review enabled the program to effectively transition into manufacturing and prepare for the assembly, test and launch operations phase of the mission. The Landsat-9 spacecraft was manufactured and tested at the company’s Gilbert, Arizona, facility and was planned for launch in late 2020. The spacecraft is operated by the U.S. Geological Survey whilst in orbit.
- The Critical Design Review took place February 26 through March 1 at Northrop Grumman’s facility in Gilbert, Arizona. Landsat-9 extends the length of the overall Landsat series to half a century, providing the longest continuous record of the Earth’s surface as seen from space. Northrop Grumman has built three other Landsat satellites, including Landsat-8, which was launched in 2013, and is providing high quality images in quantities that surpass mission requirements.
• February 14, 2018: Ball Aerospace delivered the TIRS-2 Flight Cryocooler for the Landsat-9 TIRS-2 (Thermal Infrared Sensor-2) instrument ahead of schedule to NASA/GSFC (Goddard Space Flight Center). Achieving this milestone early allows GSFC additional time and options during the instrument integration and test phase. 25)
- For more than 45 years, Landsat Earth-observing satellite missions have gathered multispectral imagery from space, helping scientists understand the impacts of human activity and natural events on our planet through constant monitoring of land changes. The TIRS-2 instrument aboard Landsat-9 will provide two-band thermal imaging data to measure surface temperature and track land and water usage. The Ball-built cryocooler on the instrument enables TIRS-2 to cool the focal plane and the surrounding enclosure to maintain the sensitivity needed for imaging.
- The TIRS-2 Flight Cryocooler is based upon a Ball family of Stirling Cryocoolers, which are the nation's largest capacity, highest efficiency cryocoolers on orbit to date. The two-stage Flight Cryocooler consists of two CCEs (Cryogenic Control Electronics), one RSE (Redundancy Switch Electronics), a TMU (Thermo Mechanical Unit) and a flight harness set. For TIRS-2, Ball developed redundant electronics and incorporated many design and manufacturing improvements to simplify the fabrication and assembly process.
• December 19, 2017: The USGS and NASA selected a new Landsat science team, whose primary responsibility was to conduct Landsat-based scientific research and engineering studies, develop useful data products and applications and share the results of its work with the USGS, NASA and others — members serve a five-year term from 2018 to 2023. 26) 27)
- The new team conducted scientific research on technical issues critical to the success of the overall Landsat mission, including topics related to data acquisition, product access and formats, new science datasets, practical data applications to be derived from an operational system and other science opportunities for new and past-generation Landsat data.
- Members evaluate the quality of data after Landsat 9's launch, which was estimated for December 2020, and help ensure that Landsat 9 data can be successfully integrated into the overall Landsat record. They will also be on the ground floor of discussions for future Landsat missions. In addition, the new team may be called on to assess the viability of Landsat 7 data for scientific or operational purposes as the satellite nears its nineteenth year in orbit. They will also be responsible for looking at opportunities to develop new and advanced applications of Landsat data.
- Previous Landsat Science Teams helped increase the ease of use and expand the utility of Landsat data for users across the nation; greatly increased the size of the Landsat archive by transferring historical data held by international cooperators; and advanced the breadth and accuracy of applications of the 45-year Landsat record
The 2018-2023 USGS-NASA Landsat Science Team members and their areas of study
- Dr. Martha Anderson and Dr. Feng Gao, USDA Agricultural Research Service — Characterizing crop water use, phenology and yield at field scales using multi-sensor data fusion
- Mr. Noel Gorelick, Google — Driving cloud-based usage of Landsat with Google Earth Engine
- Dr. Matthew Hansen, University of Maryland — Generating time-series maps that accurately reflect land change area: A strategy for global land monitoring
- Dr. Sean Healey, U.S. Forest Service — Landsat science and applications in the U.S. Forest Service
- Dr. Patrick Hostert, Humboldt University of Berlin — Synergies between future Landsat and European satellite missions, from land cover to land use
- Dr. Justin Huntington, Desert Research Institute — Towards the development and integration of Landsat evapotranspiration ensembles and climate data for enhanced water and land management decision support
- Mr. David Johnson, USDA National Agricultural Statistics Service — Leveraging analysis ready Landsat products for use in crop production estimation
- Dr. Leo Lymburner, Geoscience Australia — Digital Earth Australia
- Dr. Alexei Lyapustin, NASA Goddard Space Flight Center — Advanced atmospheric correction of Landsat 8/Sentinel 2 data using algorithm Multiangle Implementation of Atmospheric Correction
- Dr. Nima Pahlevan, Science Systems and Applications, Inc. — Landsat-Sentinel-2 constellation for monitoring aquatic systems across the United States
- Mr. Jean-Francois Pekel and Dr. Peter Strobl, European Commission Joint Research Centre — Copernicus Landsat convergence, architecture and applications
- Dr. Volker Radeloff, University of Wisconsin — Landsat data for biodiversity science and conservation
- Dr. David Roy, South Dakota State University — Pathfinding near real time moderate resolution land surface monitoring, looking forward to an operational Landsat 9/10 Sentinel 2A/2B era
- Dr. Ted Scambos, University of Colorado — Landsat and the cryosphere: Tracking interactions between ice, snow and the earth system
- Dr. Crystal Schaaf, University of Massachusetts, Boston — Global 30 m snow and snow-free land surface albedo from Landsat and Moderate Resolution Imaging Spectroradiometer/Visible Infrared Imaging Radiometer Suite
- Dr. Eric Vermote, NASA Goddard Space Flight Center — Maintenance and refinement of the Land Surface Reflectance Code for Landsat and Sentinel 2
- Dr. Curtis Woodcock, Boston University — New opportunities using the Landsat temporal domain: Monitoring ecosystem health, condition and use
- Dr. Michael Wulder, Canadian Forest Service — Integrating time and space with Landsat to learn from the past, monitor the present and prepare for the future
- Dr. Zhe Zhu, Texas Tech University — Toward near real-time monitoring and characterization of land surface change for the conterminous United States
• December 7, 2017: Landsat-9 entered its implementation phase, or “Phase C” of its project lifecycle after successfully passing Key Decision Point C (KDP-C). The Landsat-9 project team garnered high praise from NASA Headquarters’ APMC (Agency Program Management Council) for the project’s exemplary mission formulation performance and for the lockstep collaboration with its partner agency, the U.S. Geologic Survey. 28)
- The implementation phase of the Landsat-9 project lifecycle was dominated by the fabrication and testing of the Landsat-9 instruments and spacecraft; this phase lasted approximately 24 months and was followed by the observatory integration phase.
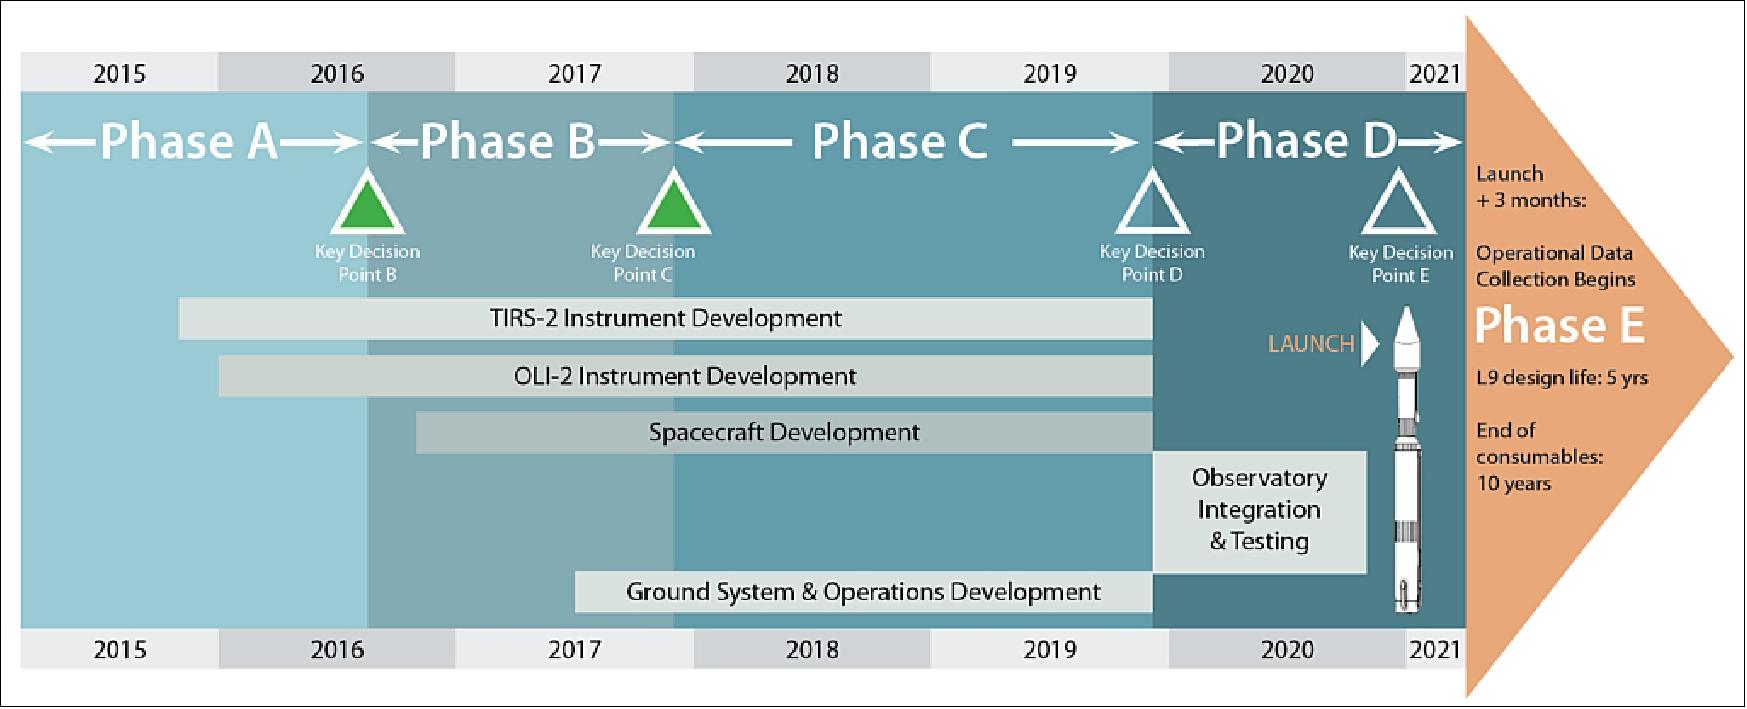
Mission Schedule and Lifecycle (Figure 11): NASA-managed satellite builds have a mission lifecycle that is divided into incremental phases. Phase A is concept and technology development; Phase B is preliminary design and technology completion; Phase C is final design and fabrication; Phase D is system assembly, integration/testing, and launch readiness; Phase E starts after on-orbit operational checkout and ends at the mission’s operational end. 30)
• September 24, 2017: The USGS awarded the prime contract to General Dynamics Mission Systems, with a.i. solutions as one of the subcontractors. Under this contract, General Dynamics continues to operate Landsat-8 from the existing mission operations center at the GSFC (Goddard Space Flight Center) and will begin design and integration of a new Landsat Multi-satellite Operations Center at GSFC. 31)
- Under the requirements of the contract, a.i. solutions will provide key flight dynamics and mission planning for the ongoing Landsat-8 mission, develop the flight dynamics component of the ground system that will launch and operate on Landsat-9 as well as transition Landsat-8 to the new flight dynamics system once complete.
• September 18, 2017: The Landsat-9 satellite mission team completed a successful Mission PDR (Preliminary Design Review) last week. During the review, the mission team demonstrated to an independent Standing Review Board that all design plans for the Landsat-9 mission are both sound and well integrated. - The PDR is the last milestone before the major Key Decision Point C, scheduled for December 2017, after which the mission officially enters its implementation phase. The review took place from September 12-15 at NASA’s Goddard Space Flight Center in Greenbelt, Maryland. 32)
• August 10, 2017: The Landsat-9 spacecraft passed an important progress evaluation milestone in mid-July. The PDR (Preliminary Design Review) for the Orbital ATK-sourced spacecraft was held from July 18–20 in Gilbert, Arizona at the satellite fabricator’s facility. 33)
- NASA concluded that the Landsat 9 spacecraft is on track and meeting all of the system and schedule requirements needed for the mission’s planned December 2020 launch.
• February 28, 2017: The Landsat-9 TIRS-2 (Thermal Infrared Sensor-2) team at the NASA/GSFC (Goddard Space Flight Center) successfully completed their ICDR (Instrument Critical Design Review). 34)
• February 27, 2017: USGS and NASA officials participated in the Landsat-9 SSRR (Spacecraft System Requirements Review) February 28 and March 1 at the Orbital ATK facility in Gilbert, Arizona. 35)
- An independent panel reviewed the work of the spacecraft vendor to understand system requirements in a number of areas, including being able to control the orientation of Landsat 9 through attitude control, how much redundancy is built into the spacecraft, and how much fuel is onboard.
- Reviewers also look at fault management capabilities, which include hardware and software features used to address any potential problems that may arise in orbit. This was the final such review before full-scale spacecraft design and development begins.
• On November 30 – December 1, 2016, USGS EROS hosted the Landsat-9 GSRR (Ground System Requirements Review) in Sioux Falls, SD. This was the first in a series of major project reviews for Landsat-9, which was scheduled for launch December 2020. The GSRR included presentations given to a joint NASA/USGS review panel on the proposed components of the Landsat-9 Ground System. At the conclusion of the review, the panel approved the Landsat-9 Ground System team to proceed to the PDR (Preliminary Design Review) stage. 36)
• Oct. 25, 2016: NASA awarded a delivery order under the Rapid Spacecraft Acquisition III (Rapid III) contract to Orbital ATK for the Landsat 9 spacecraft. The contract was a 5-year, firm fixed-price delivery order for the purchase of the Landsat-9 spacecraft in the amount of $129.9 million. Orbital designed and fabricated the spacecraft, integrated the mission’s two government-furnished instruments, and conducted satellite-level testing, in-orbit satellite checkout, and mission operations support. The work was performed at the contractor’s facilities and at the launch site at Vandenberg Air Force Base in California. 37)
• May 17, 2016: NASA awarded a sole source contract to BATC (Ball Aerospace and Technology Corporation) of Boulder, Colorado, for the TIRS-2 (Thermal Infrared Sensor-2) instrument Cryocooler for Landsat-9. 38) — TIRS-2 was upgraded to a Class B instrument, with additional steps being taken to fix the straylight issue affecting the Landsat-8 TIRS instrument.
• On March 4, 2015, the Landsat-9 project was officially directed to initiate activities with strong support from Administration, Congress, NASA, and USGS.
What Makes Landsat-9 a Science-Grade Satellite?
Scientific studies rely on science-grade instruments—instruments that record information reliably and accurately. Studying long-term changes to Earth’s surface requires carefully calibrated observations to measure subtle changes occurring over decades. The Landsat-9 mission extends the data record of Earth observations and advance the scientific study of land change and land use into the next half-century. Consistency in Landsat’s spatial resolution, calibration, and spectral characteristics over four decades allows long-term, consistent comparisons of historical and current data.
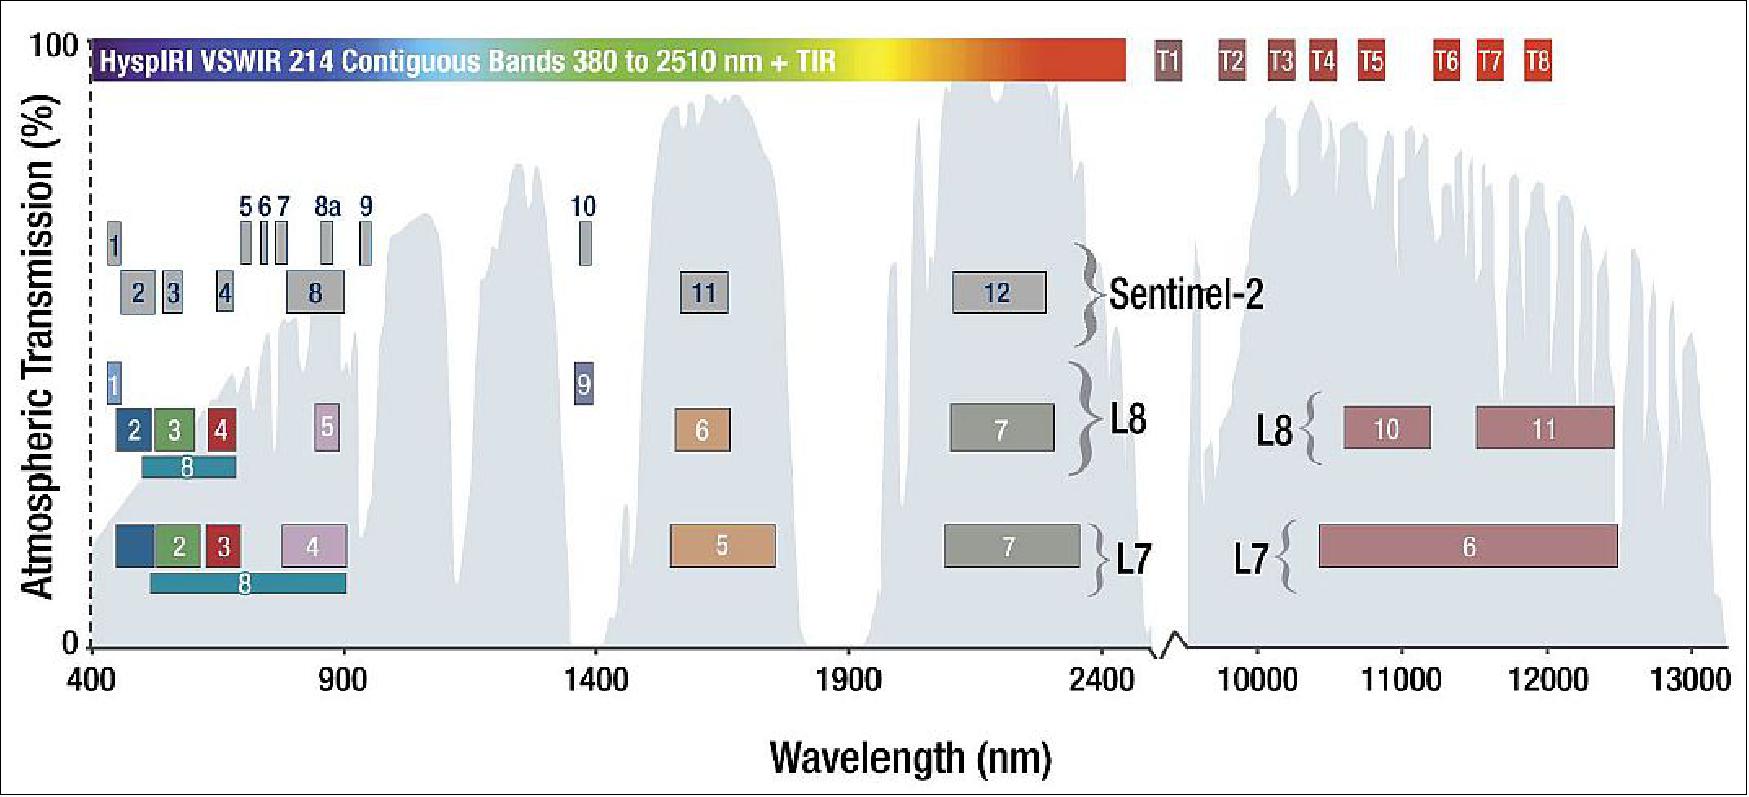
1) Spectral Coverage: For a science-grade instrument, the ability to have broad spectral coverage—the ability to see parts of the light spectrum beyond the visible and VNIR (Near Infrared ) — is essential. Landsat-9 collects data in three shortwave infrared bands and two thermal infrared bands, in addition to VNIR. These longer wavelength bands play a vital role in water use measurements (evapotransporation), fire scar mapping, volcanic lava flow mapping, and other indices used for land use monitoring.
Because of optical diffraction, the ability to image features at longer wavelengths requires progressively larger telescope apertures. In addition, multiple types of detectors (or even separate instruments) may be required to cover the full spectral range. Thermal detectors must be cooled to very low temperatures (-150º C) in order to be sensitive to the low radiance levels emitted at normal Earth temperatures, which in turn necessitates coolers that can cool to cryogenic temperatures.
2) Accuracy: Radiometric resolution and geometric fidelity: We use the term “science-grade” a lot when describing Landsat’s instruments. What we mean by this is that the data collected by Landsat satellites have very strict levels of accuracy that they must live up to—the radiation measurements must be reliable for each of the Landsat spectral bands.
This reliability is what makes comparisons of Landsat data day-to-day, year-to-year and sensor-to-sensor possible. To do scientific research you need to know you can make accurate comparisons.
Radiometric resolution is the ability to measure small differences in radiation over a wide range of brightness levels and geometric fidelity is the ability to know exactly where any given pixel is located. Large optics help by mitigating stray light and ensuring focal plane uniformity (i.e. sameness across the field of the tens-of-thousands of detectors which the telescope focuses light on) to avoid skewed measurements.
The Landsat-9 instruments provide radiometric calibration via onboard sources (blackbody, lamps) and a solar-diffuser system for the reflective bands. Additionally, every full Moon, Landsat-9 (like Landsat-8) will be turned toward the Moon to scan the distant lunar surface multiple times. Since the Moon has no atmosphere, it is the perfect consistent source of light to measure–like a gray card for calibrating a camera’s exposure. Data from the Moon is used to both complement and corroborate the results from the other on-board calibration activities.
3) Redundancy: Live long and be precise: Landsat-9 has sufficient redundancy to ensure the collection of science-grade data over a 5-year mission life. This means that many critical components have a redundant counterpart to minimize the risk of a single point failure. For example, Class B missions like Landsat-9 typically have two of almost every kind of electronics on board (e.g., spacecraft computers, communications electronics, attitude control electronics, instrument control electronics), extra reaction wheels, and extra thrusters. In the event that some primary piece of equipment on the satellite experiences an anomaly that impacts its performance, ground controllers switch over to the backup unit on the satellite to do the job. But implementing redundancy comes at the expense of higher cost and longer development time, and it also tends to make things bigger and heavier. So a critical element of mission design is performing detailed reliability and risk assessments to determine where redundancy might be most beneficial, and then implementing redundancy as efficiently as possible to provide the needed level of reliability.
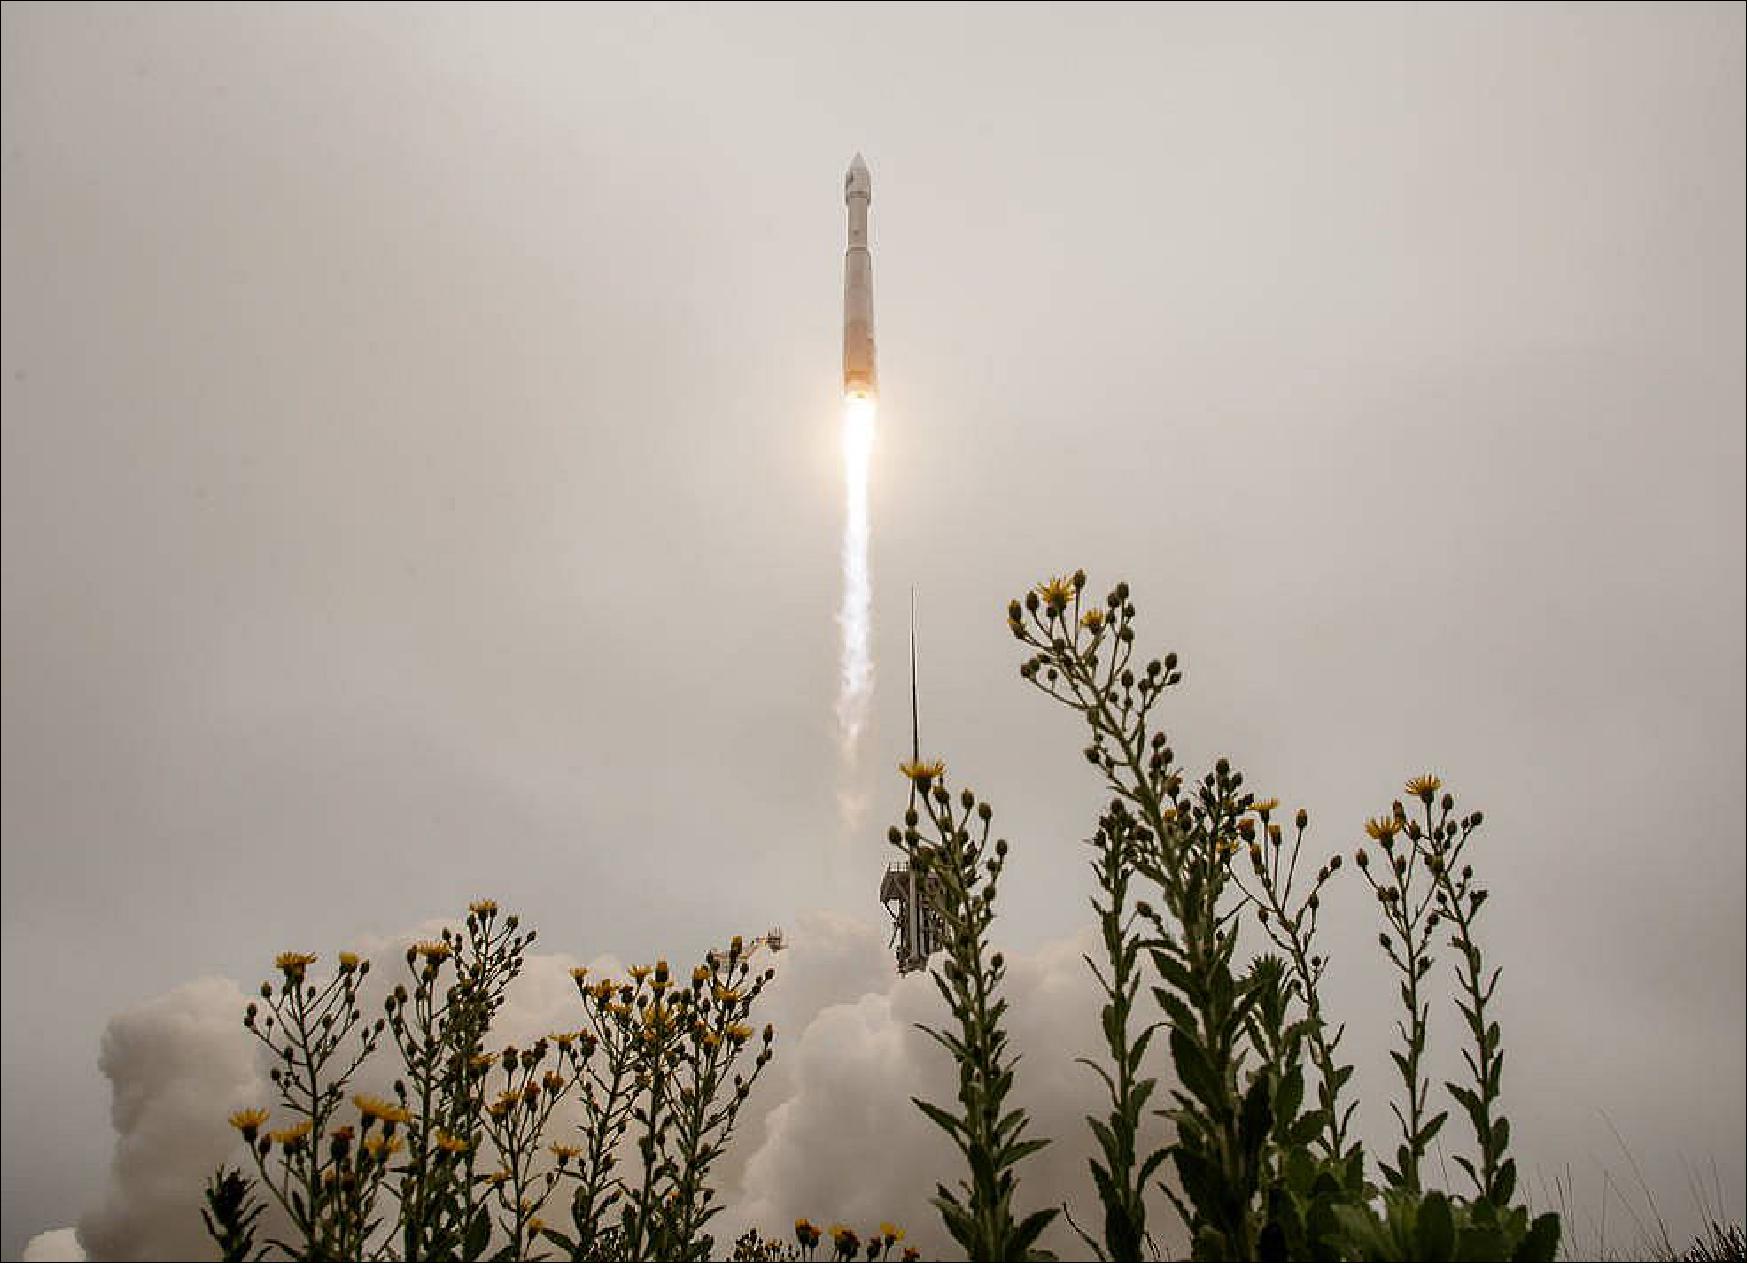
Launch: Landsat-9, a NASA satellite built to monitor the Earth’s land surface, successfully launched on 27 September 2021 at 2:12 p.m. EDT (18:12 UTC) from Vandenberg Space Force Base in California. 39)
A joint mission with the U.S. Geological Survey (USGS), Landsat-9 lifted off on a United Launch Alliance Atlas V rocket from Vandenberg’s Space Launch Complex 3E. Norway’s Svalbard satellite-monitoring ground station acquired signals from the spacecraft about 83 minutes after launch. Landsat-9 is performing as expected at its final orbital altitude of 438 miles (705 km).
“Today’s successful launch is a major milestone in the nearly 50-year joint partnership between USGS and NASA who, for decades, have partnered to collect valuable scientific information and use that data to shape policy with the utmost scientific integrity,” said Secretary of the Interior Deb Haaland. “As the impacts of the climate crisis intensify in the United States and across the globe, Landsat 9 will provide data and imagery to help make science-based decisions on key issues including water use, wildfire impacts, coral reef degradation, glacier and ice-shelf retreat, and tropical deforestation.”
Secondary (or rideshare) payloads: Four CubeSats for NASA’s 37th Educational Launch of Nanosatellites (ELaNa 37) mission and the Mission Manifest Office at the U.S. Space Force Space Systems Command separated from Centaur at approximately T+plus 2 hours, 14 minutes. The CubeSats were carried on the Evolved Expendable Launch Vehicle Secondary Payload Adapter (ESPA) Flight System, or EFS. It is a ring positioned below the Landsat-9 and above the top of Centaur which carried the four science and national security CubeSats. 40)
ULA's four-meter-diameter metallic payload fairing, built at the company's facility in Harlingen, Tex., protects Landsat-9 and the CubeSats during ascent through Earth's atmosphere. The longest of available Atlas V four-meter fairings will be used, known as the Extra Extended Payload Fairing (XEPF).
• CUTE (Colorado Ultraviolet Transit Experiment), a 6U CubeSat astronomy mission of the University of Colorado at Boulder, Boulder, Colorado.
• CuPID (Cusp Plasma Imaging Detector), a 6U CubeSat space weather science mission of Boston University, Boston Massachusetts.
• CM1 (Cesium Mission 1) of CesiumAstro with two 6U CubeSats (CM1 and CM2), a technology demonstration mission.
Orbit of Landsat-9: Sun-synchronous near-circular orbit, altitude = 705 km, inclination = 98.2º, period = 99 minutes, repeat coverage = 16 days. The Landsat-9 satellite is in coplanar orbit with Landsat-8, 180º apart. This reduces the repeat coverage to 8 days.
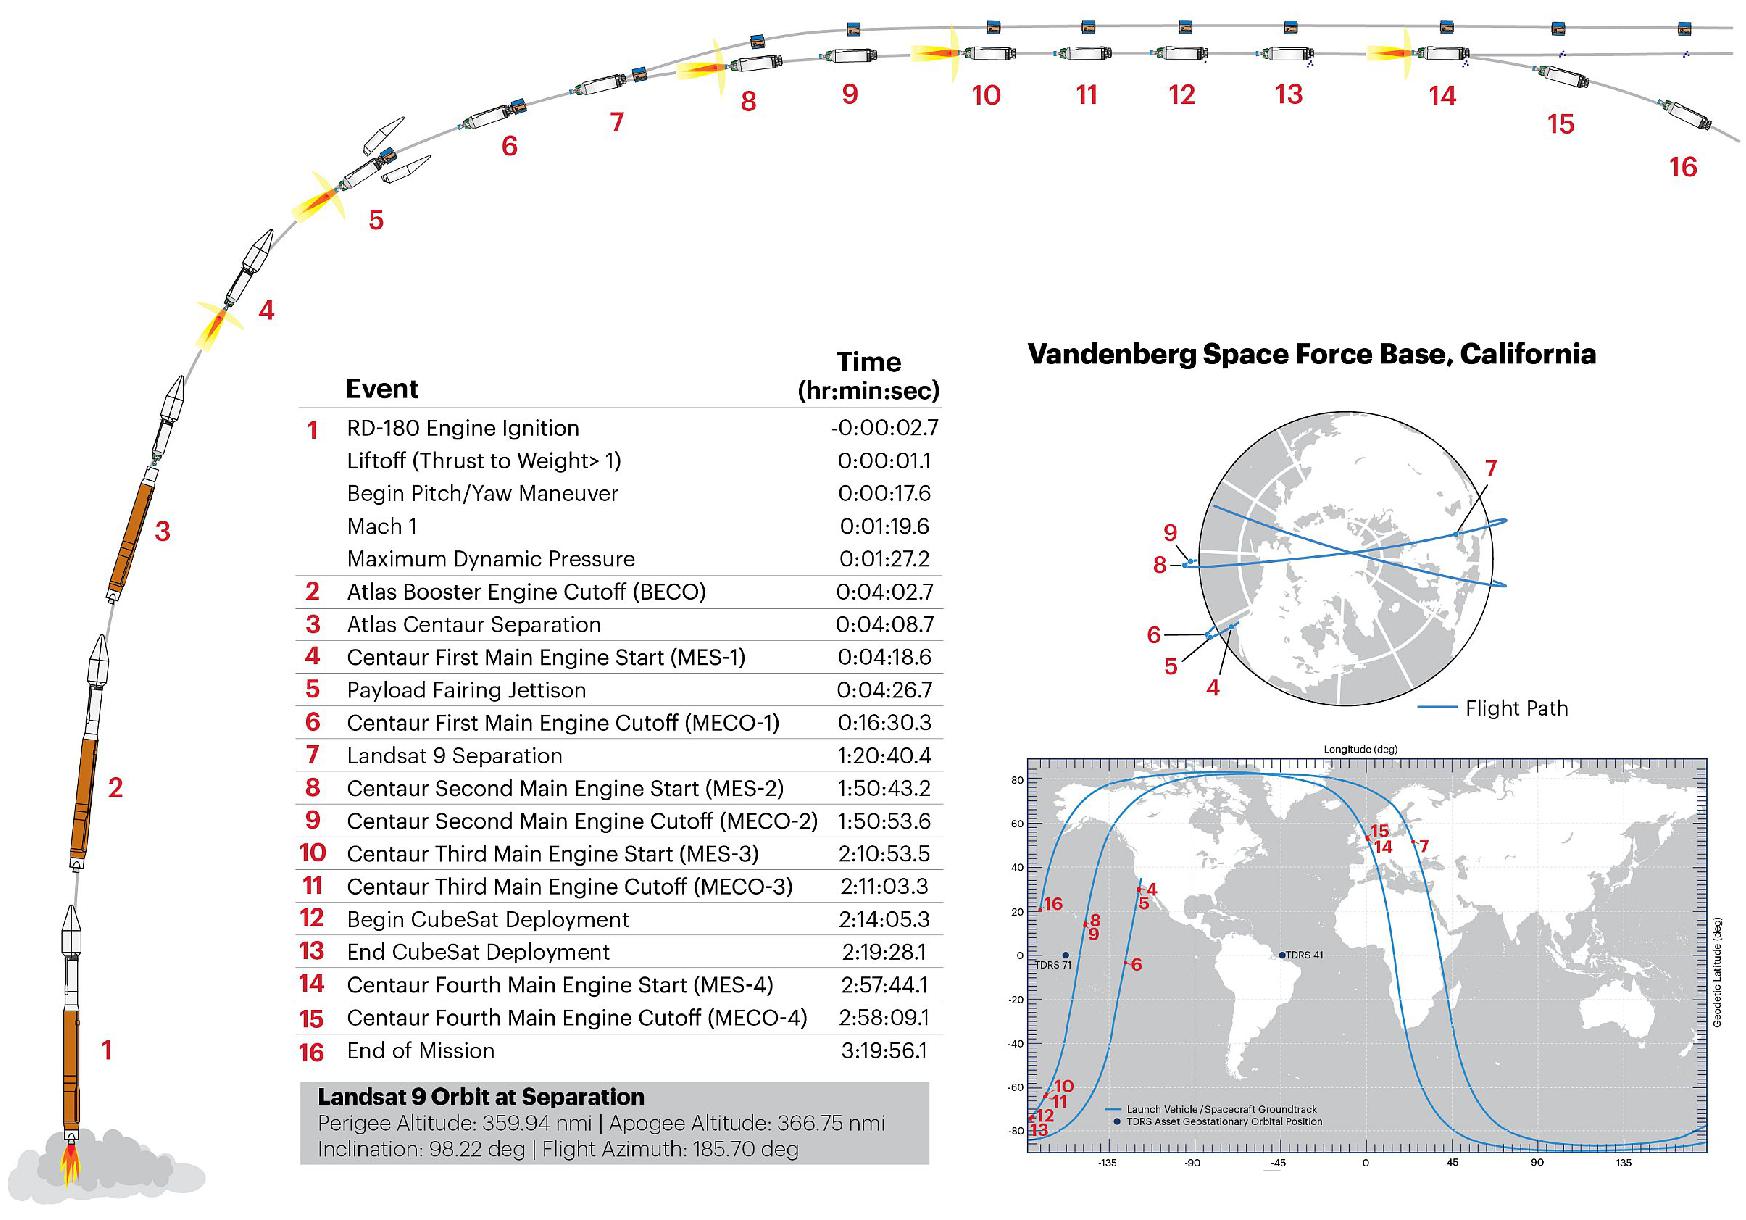
Orbit of secondary (or rideshare) payloads: After deployment of Landsat-9, the Centaur stage reignited its engine two times to maneuver into a different orbit for separation of four small CubeSat rideshare payloads. The CubeSats were delivered into a near-circular sun-synchronous orbit of 550 km altitude with an inclination of 97.6º.
After launch, Landsat-9 moved into the current orbit of Landsat-7, which had sufficient fuel to operate into 2021, and was subsequently decommissioned. Landsat-9 images the Earth every 16 days in an 8-day offset with Landsat-8. Landsat-9 collects as many as 750 scenes per day, and with Landsat-8, the two satellites add nearly 1,500 new scenes a day to the USGS Landsat archive. Landsat-9 increases the volume of the USGS archive by imaging all global landmasses and near-shore coastal regions, including islands at solar elevation angles greater than 5º that were not always routinely collected prior to Landsat-8 (Ref. 29).
Mission Status
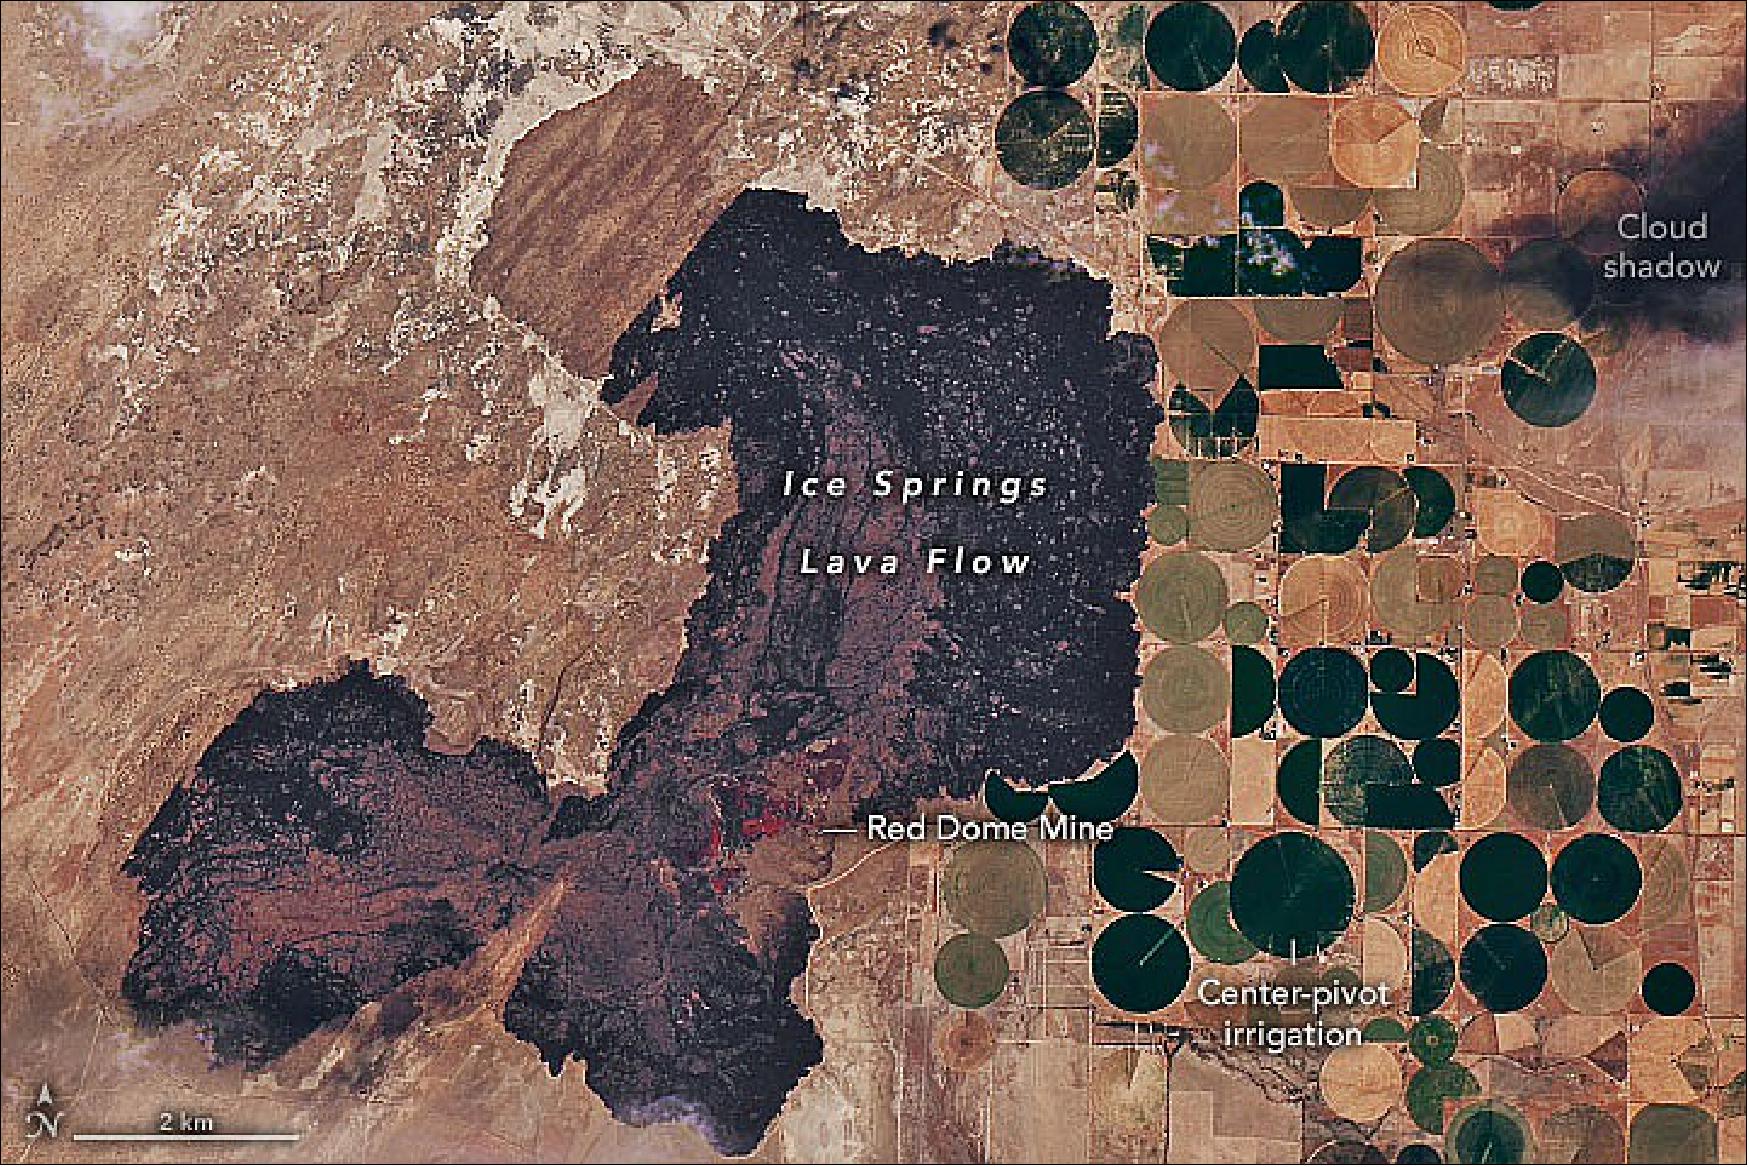
• July 18, 2022: The Ice Springs lava flow lies about 10 miles (16 km) west of the town of Fillmore, Utah, in the Black Rock Desert. It was named for the icehouse conditions found within its natural cavities, where year-round ice provided natural cold storage for farmers in the days before refrigeration. The 17-square-mile (45 km2) Ice Springs lava flow erupted onto older lava flows, which erupted on the shores and under the surface of ancient Lake Bonneville. The darker brown areas in the image are older lava flows, along with the sediments deposited atop them when they sat at the bottom of Lake Bonneville. In some places, the contact between the younger and older lava flows appears almost linear; this is where the lava flowed up against a fault scarp. The lightest brown areas are more recent sand dunes.
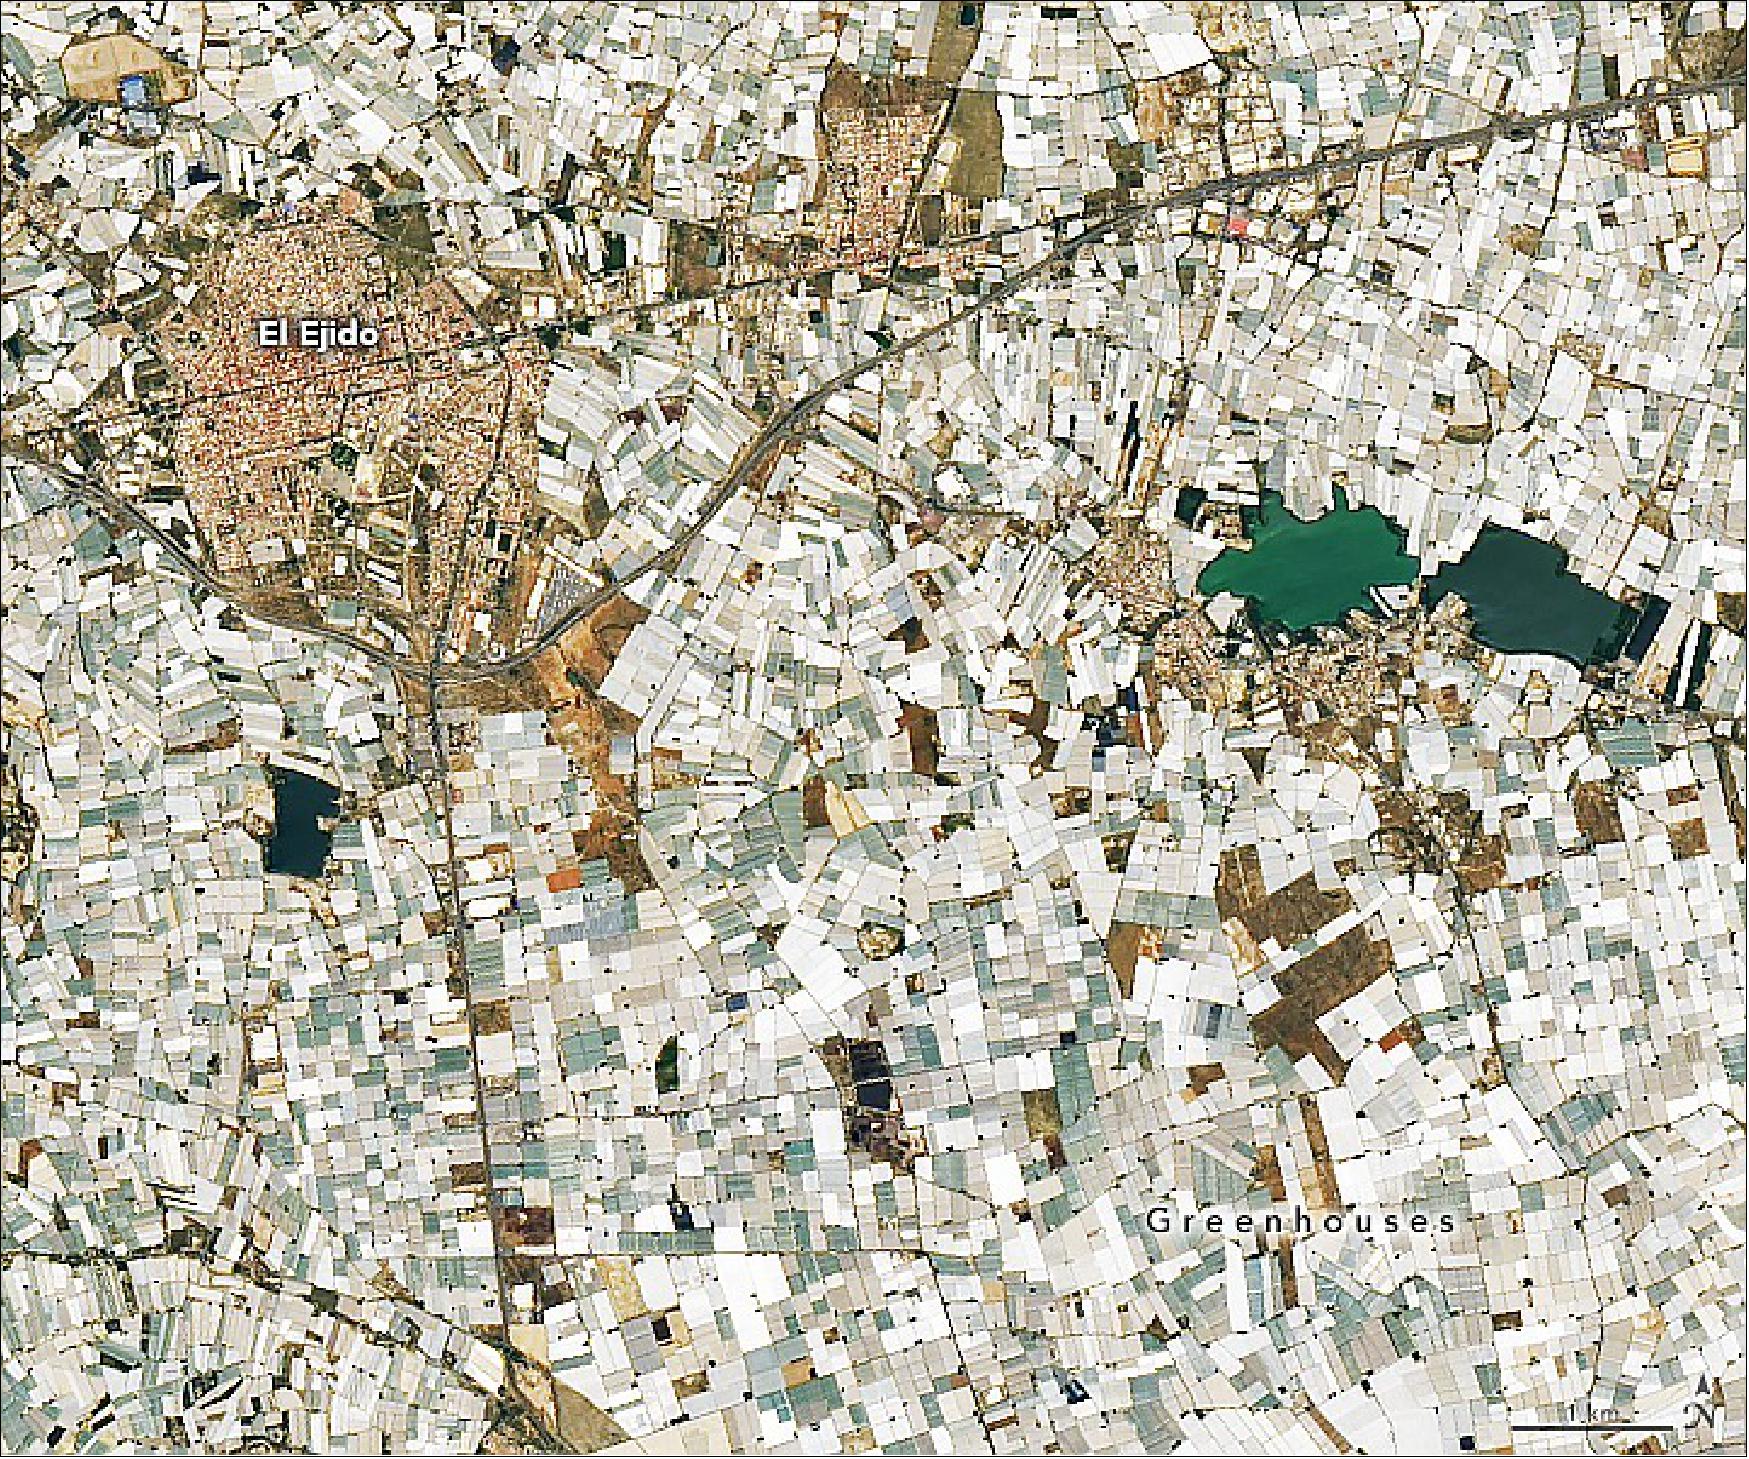
• July 11, 2022: The province of Almería in southeastern Spain has some of the driest conditions in Europe. Yet with access to groundwater and an abundance of sun, it has become a major hub of greenhouse agriculture.44)
- Using observations from the MODIS sensors on NASA’s Aqua and Terra satellites, University of Almería calculated that Almería’s surface albedo increased by nearly 10 percent between 1983 and 2006 because of the high reflectivity of the greenhouses. They concluded that this likely contributed to a cooling effect of 0.3°C (0.5°F) per decade in Almería compared to a 0.5°C increase per decade in the region.

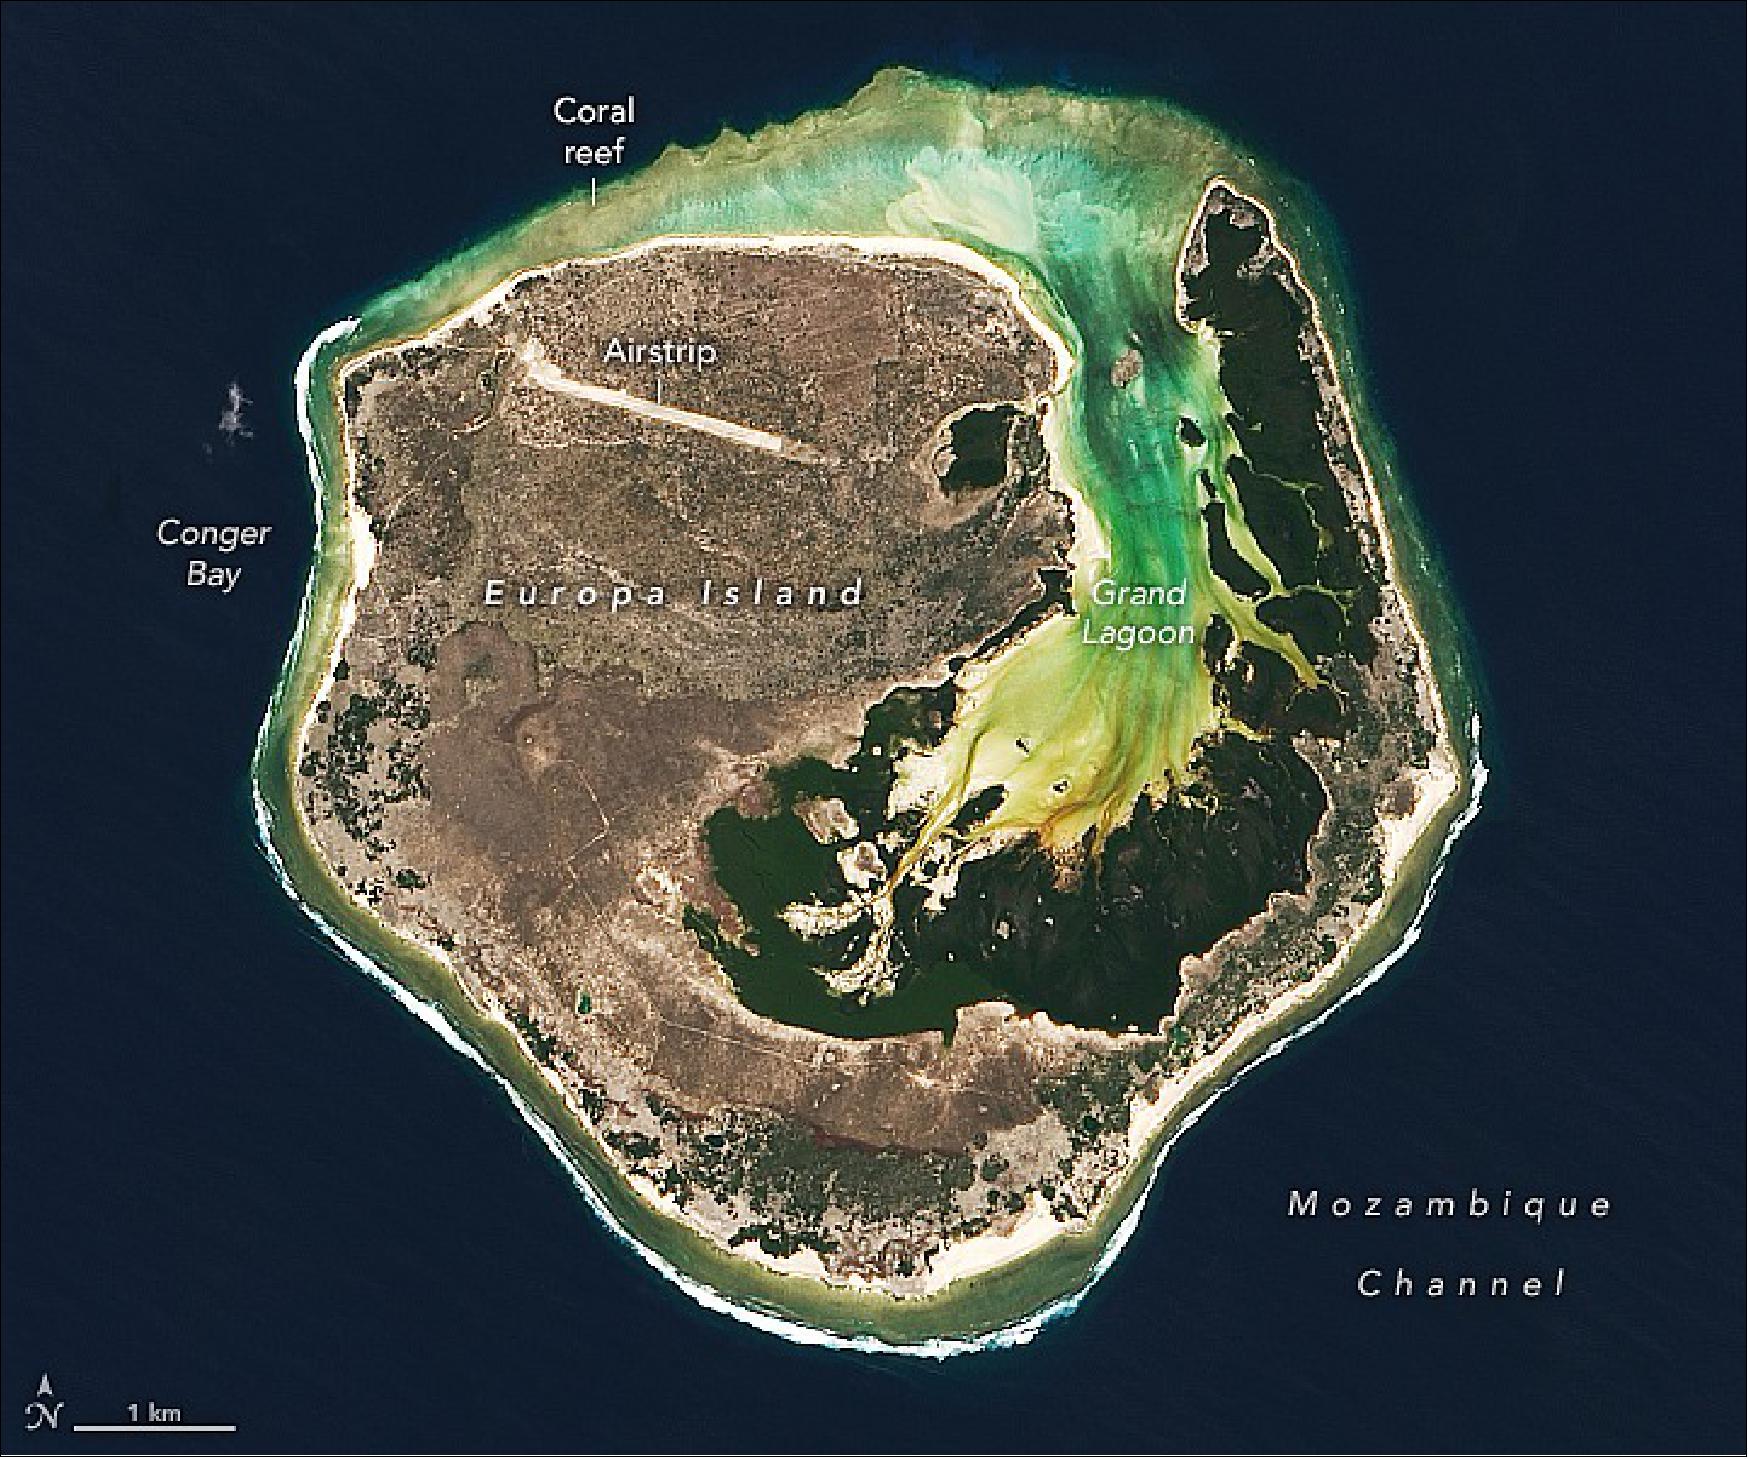
• June 26, 2022: Several volcanic seamounts and hundreds of volcanic cones rise above the floor of the southern Mozambique Channel. A few of the larger volcanic features are capped with flat expanses of carbonate that breach the water’s surface, forming low-lying coralline islands. Europa is one such island. 46) Europa Island spans about 28 km2, making it the largest of the Îles Éparses. It was initially an atoll that became exposed at the sea surface around 90,000 years ago. The atoll progressively filled in, and it slowly transformed into the island we know today.
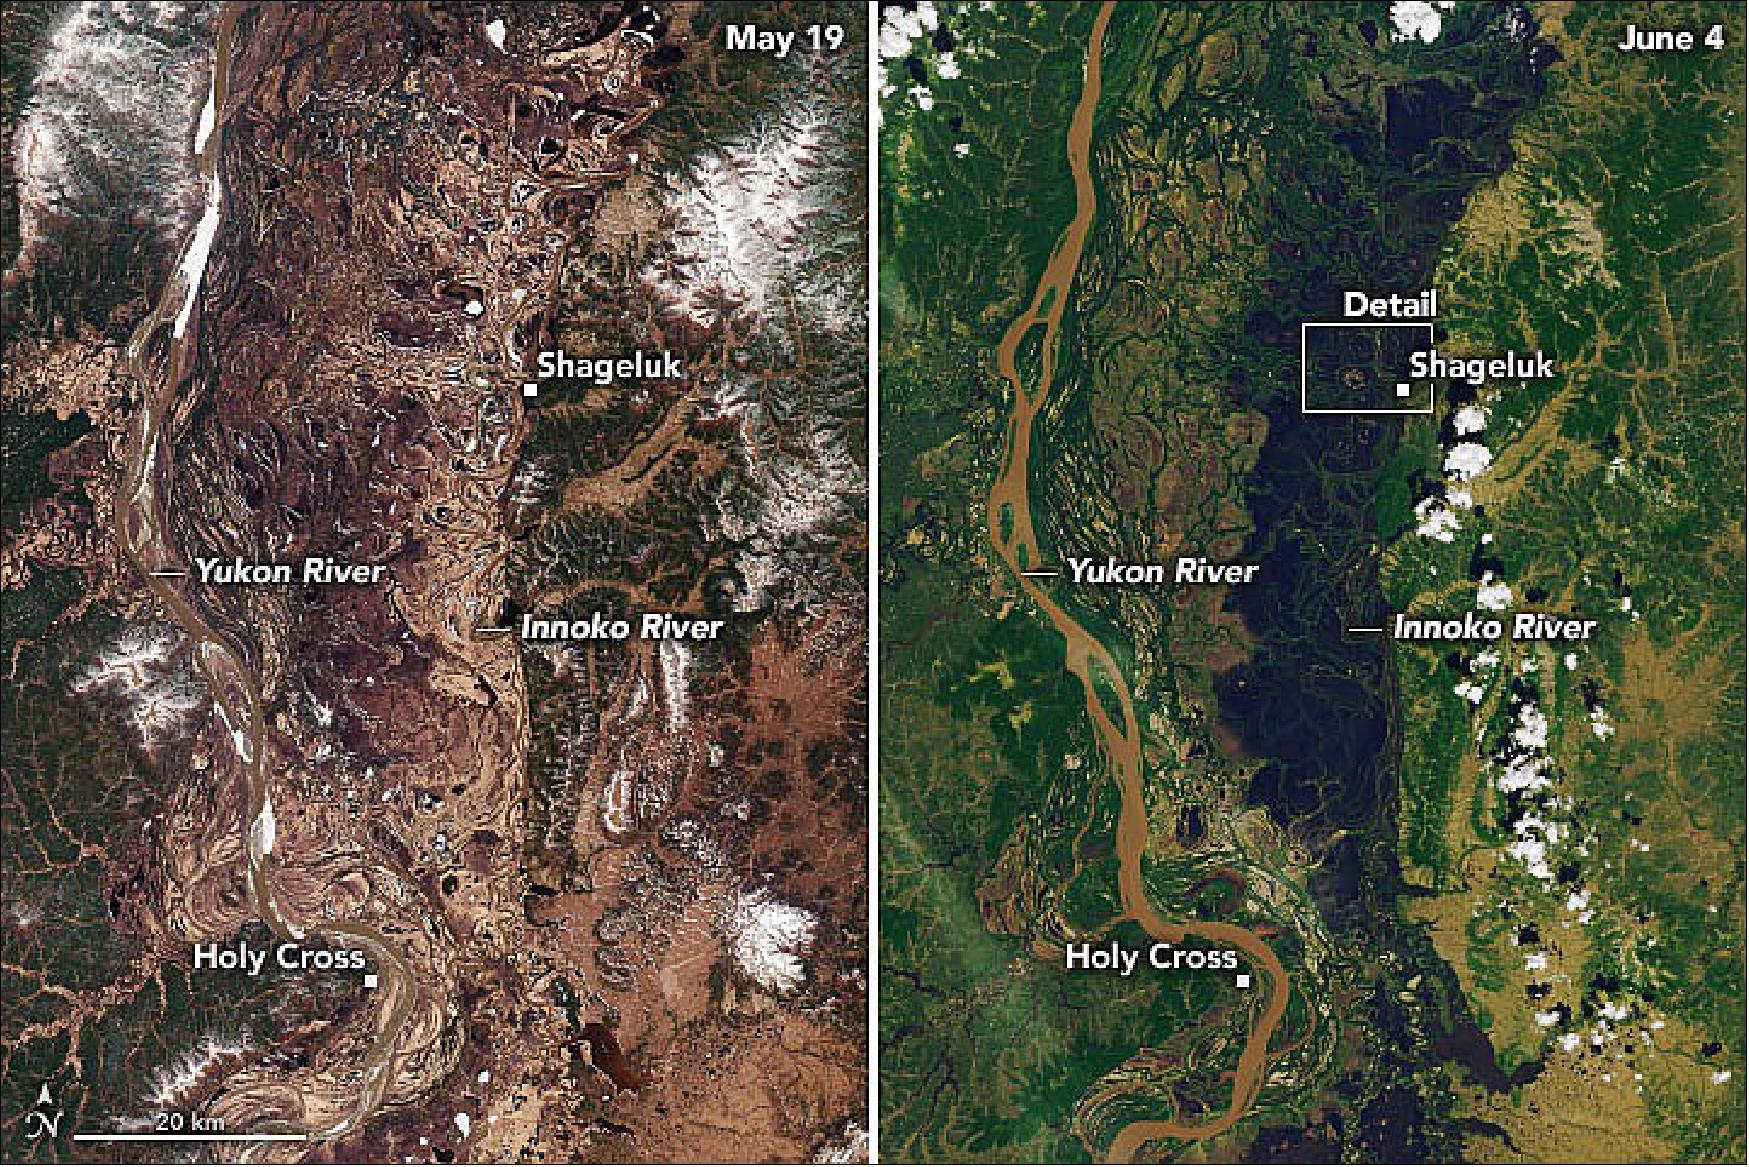
• June 20, 2022: Spring is a time of major transformation across interior Alaska, as snow melts off the land and ice breaks up along the rivers. The transition is especially apparent within the Innoko Lowlands, a group of vast, flat floodplains traversed by the Yukon and Innoko rivers. Seasonal melting here can lead to flooding so widespread that it is visible from space. 47)Some of the flooding was likely caused chunks of river ice that blocked the flow of water—a phenomenon known as an ice jam that can cause rivers and their tributaries to rise and spill over their banks. On May 21, 2022, the National Weather Service issued a flood watch due to an ice jam for parts of the Yukon and for the Innoko River from Shageluk to 20 miles (32 km) upstream. But according to Christopher Arp, a scientist at the University of Alaska Fairbanks, the melting of deep snowpack from this winter likely contributed, too.
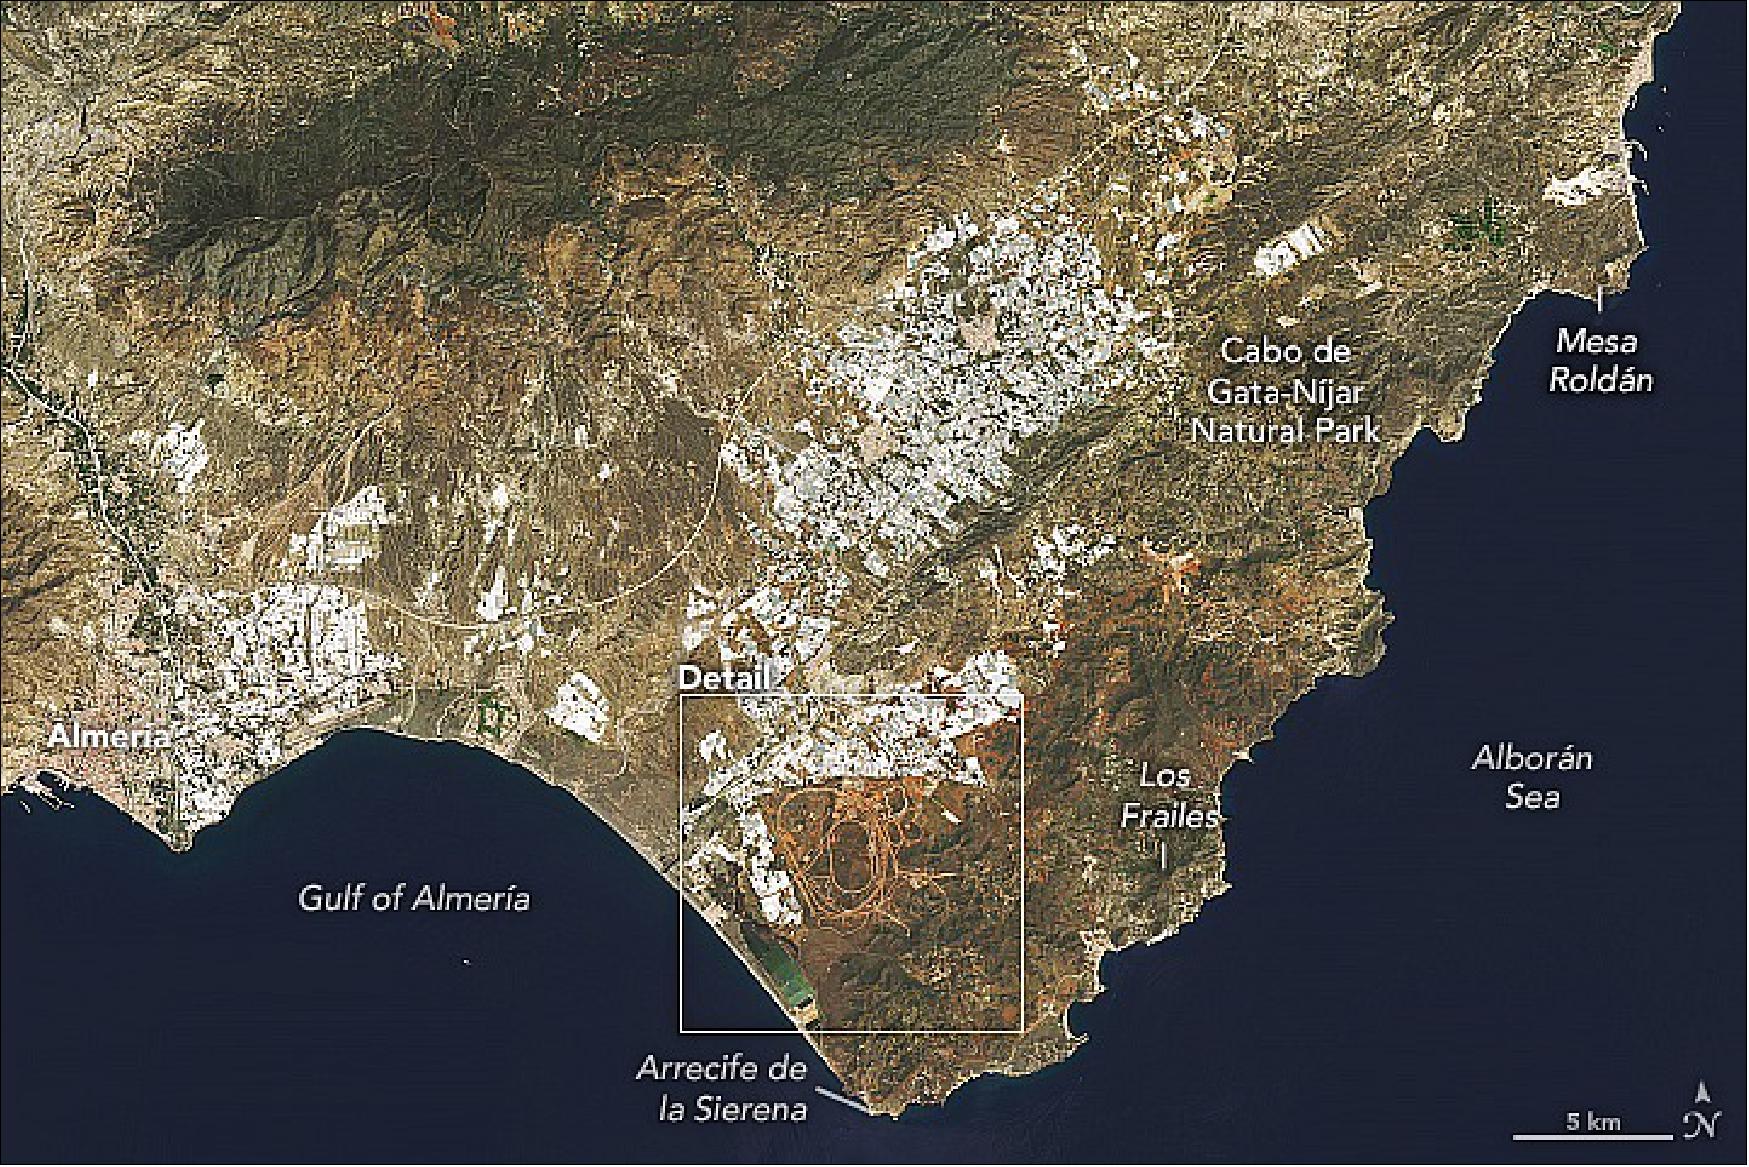
• May 21, 2022: The Tabernas Desert in southeastern Spain has been called mainland Europe’s only desert. But just 30 km away, Cabo de Gata-Níjar Natural Park is nearly as dry. The park’s semi-arid climate and volcanic features contribute to the peculiar landscape along more than 60 km of the Mediterranean coastline. 50)Both the desert and the park are part of Spain’s Almería Province, the driest area of Europe. The region receives just 20 cm (8 inches) of rain per year, though the coastal areas are somewhat more humid. There is enough moisture to support nearly 1,000 species of plants, such as the European fan palm and a thorny shrub known as jujube. When viewed from orbit, the park’s most obvious features are volcanic—that is, the 5 percent of the volcanic complex that rises above the water. The remaining 95 percent is hidden from view below the sea’s surface. Other structures just offshore have partially crumbled away. Within the volcanic range, Los Frailes is the tallest peak. Freshwater for growing produce primarily comes from groundwater. Notice the blocky pattern of white structures next to the lagoon and track. These are mostly greenhouses set up to take advantage of the abundant sunshine. Even more greenhouses crowd a small coastal plain 30 km southwest of Almería.
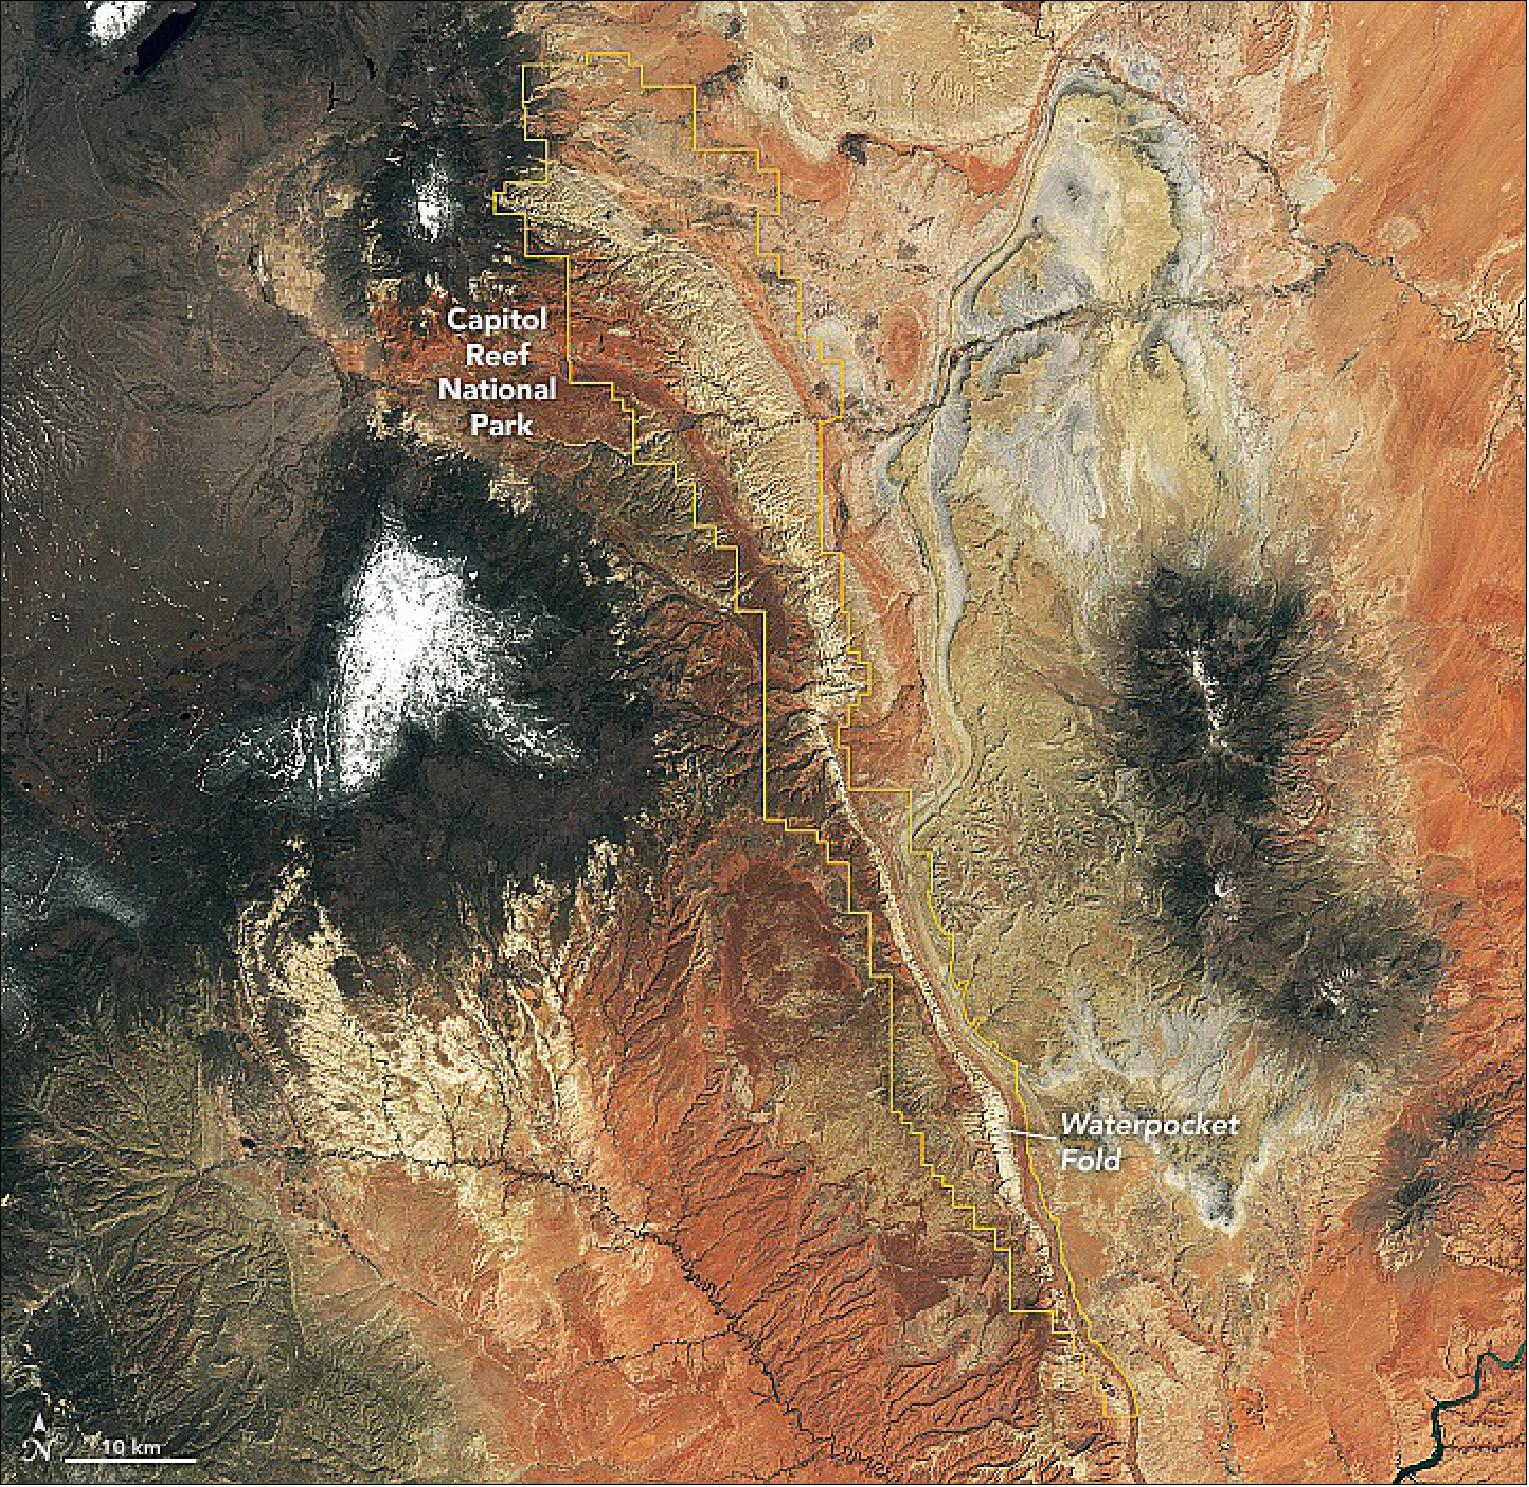
• May 20, 2022: Capitol Reef National Park in south-central Utah is neither home to a capitol, nor a reef. It was named instead for two geologic features: the prominent white domes of Navajo Sandstone, which reminded early settlers of the Capitol Building in Washington, D.C.; and a formidable ridge of rocky cliffs that presented a barrier to travel. The settlers (some likely traveling in prairie schooners) likened it to the maritime navigational hazard of an ocean reef. 51)
- Geologically, Waterpocket Fold is a monocline, a structure in which the rock layers have been folded up or down on one side. (Structures in which the rock layers are folded on both sides—either bent up like a U-shaped smile or down like frown—are called synclines and anticlines, respectively.) Between 75 million and 35 million years ago, the tectonic forces that uplifted the Rocky Mountains also buckled older rocks below Capitol Reef. The park boasts a nearly complete series of rock layers spanning from the late Permian Period (about 290 million years ago) to the end of the Mesozoic Era (66 million years ago). Deposited along and in a shallow sea and ancient delta, these rocks hold a nearly continuous record of life and environments here from before the rise of the dinosaurs through their demise (fossil megatracksite). Today, they are some of the most well-known rocks of the Colorado Plateau, including the Moenkopi, Chinle, Navajo, Entrada, and Dakota formations. These are mostly trace fossils, or ichnofossils, found in the Moenkopi Formation, which formed in the Early Triassic Period, about 240 million years ago. Many of the trackways at Capitol Reef were formed when fish dragged their fins or reptiles scraped their feet, toes, or claws as they swam along an ancient shoreline or traversed a tidal mudflat.
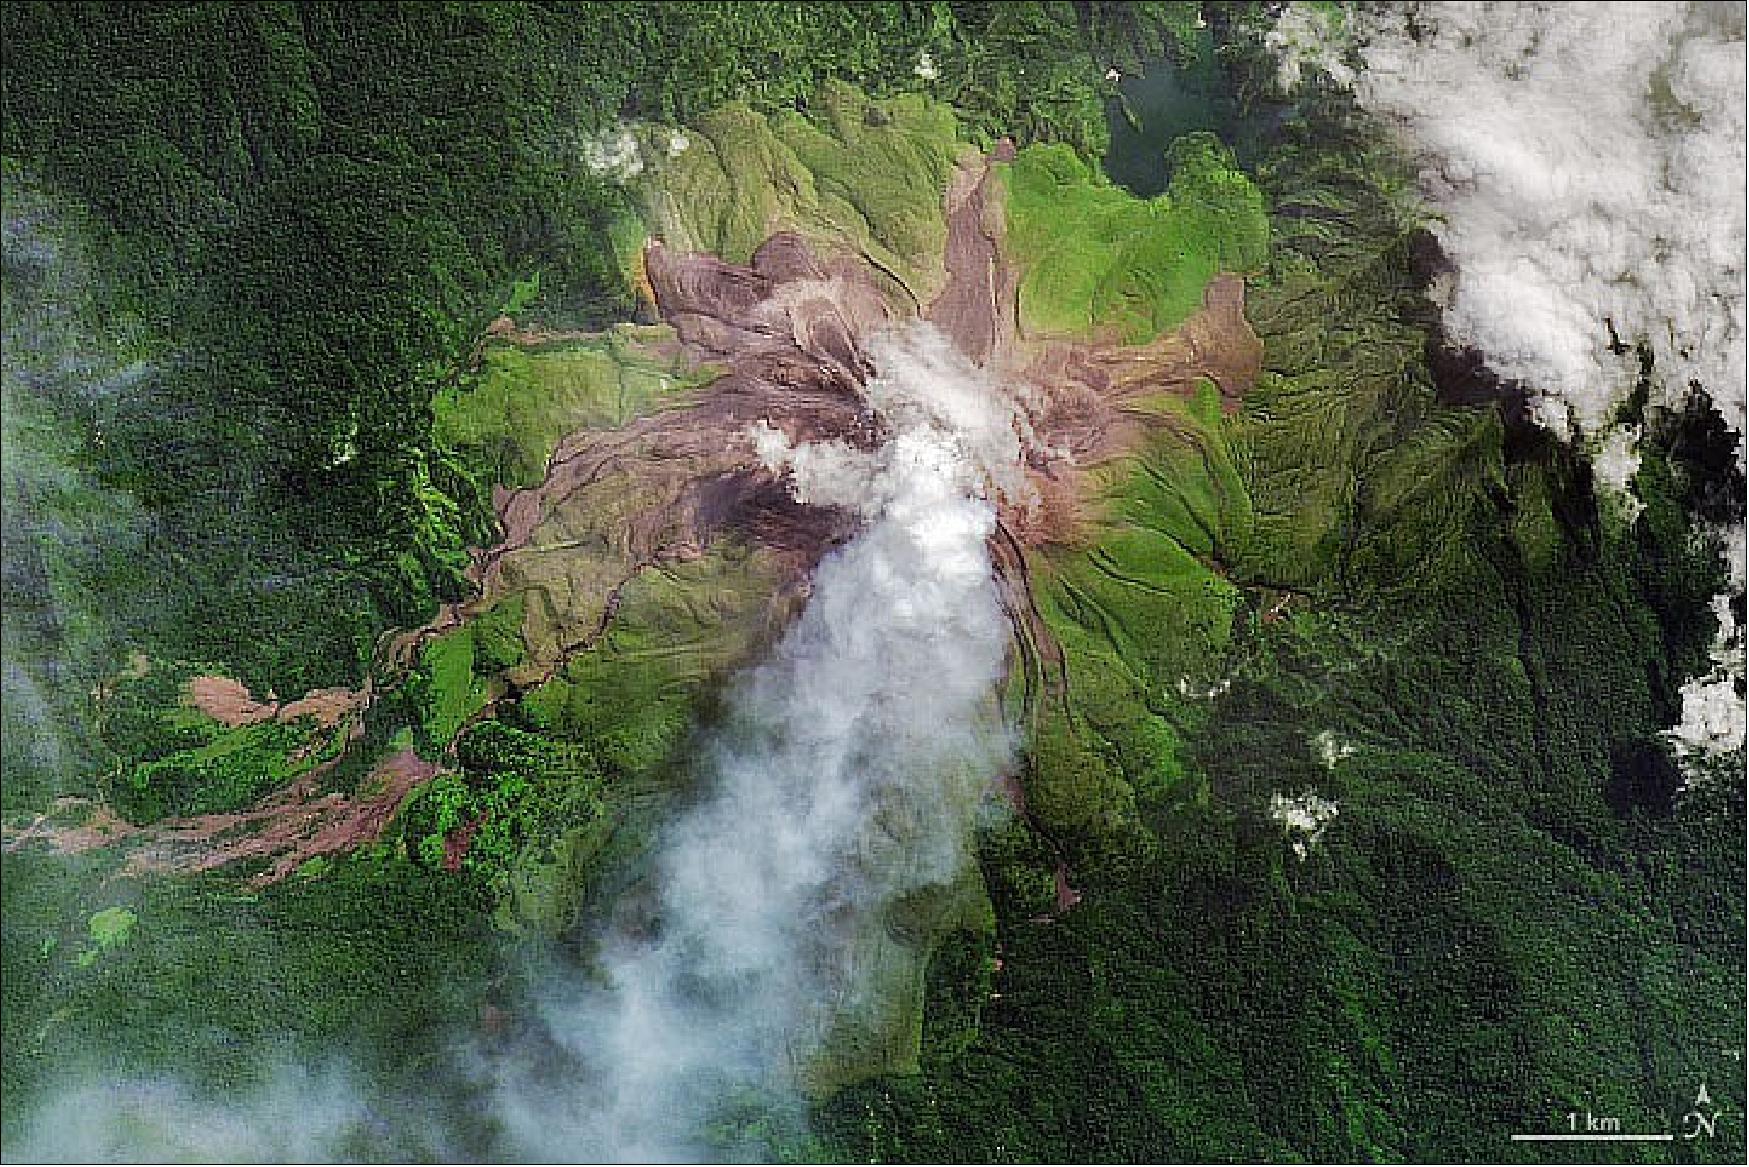
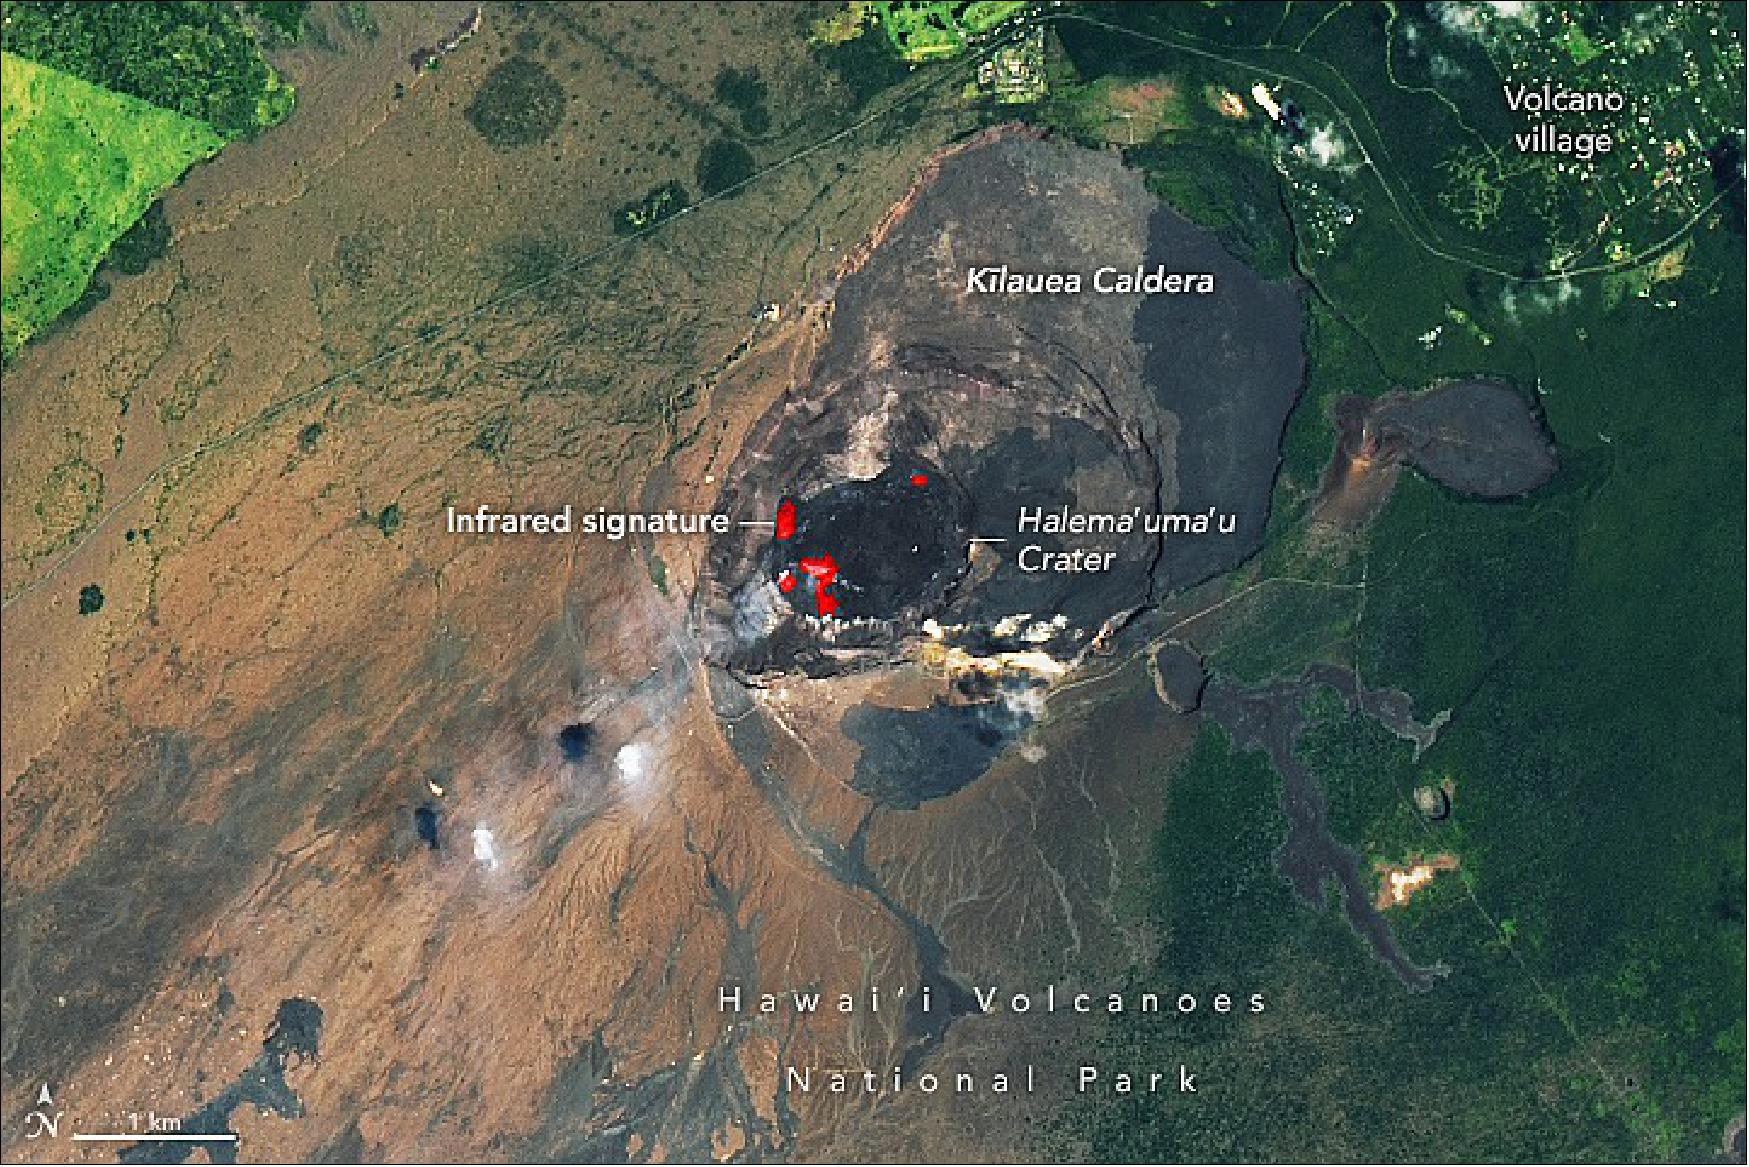
• May 11, 2022: Four years ago prior, Hawaii’s youngest and most active volcano experienced its biggest eruption in at least 200 years. The Lower East Rift Zone (LERZ) eruption at Kilauea, which began on May 3, 2018, destroyed 700 buildings and prompted the evacuation of thousands of residents. Scientists are still studying the eruption and its effects. 53) The 2018 eruption was large on a global scale, not just for Hawaii. Kilauea emitted up to 1.4 km3 (about 0.34 cubic miles) of lava in just four months. The lava lake was replaced by a water lake in July 2019, an event unprecedented in the historic record. Over the next year and a half, water slowly filled the crater to a depth of about 50 meters (160 feet). The water lake was of special interest to scientists because Kilauea has an unusual history of both effusive and explosive eruptions. However, in December 2020, a new phase of eruptive activity began with an influx of lava into the crater that boiled off the water lake in a few hours. That eruption started a new lava lake and continued until May 2021. OLI-2 captured images and heat signature data for the region.
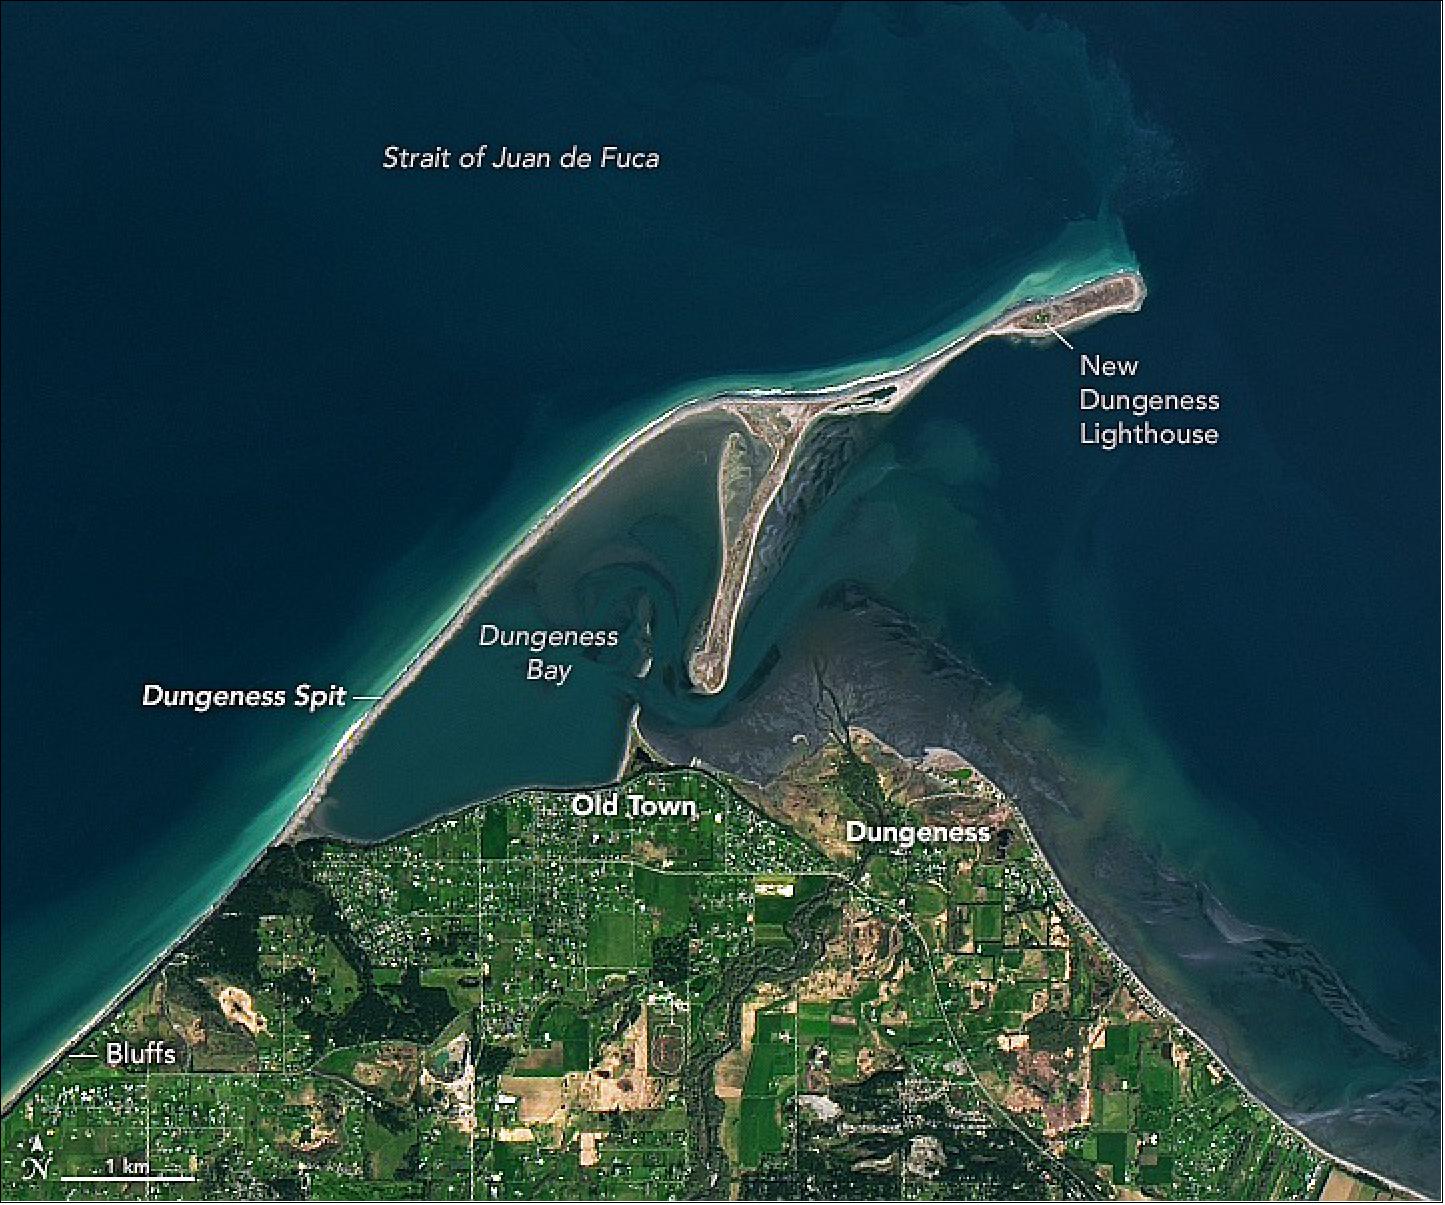
• April 13, 2022: Dungeness, a small town on the north coast of the Olympic Peninsula, is the site of the longest sand spit in the United States. Its image was captured by OLI-2. 54)
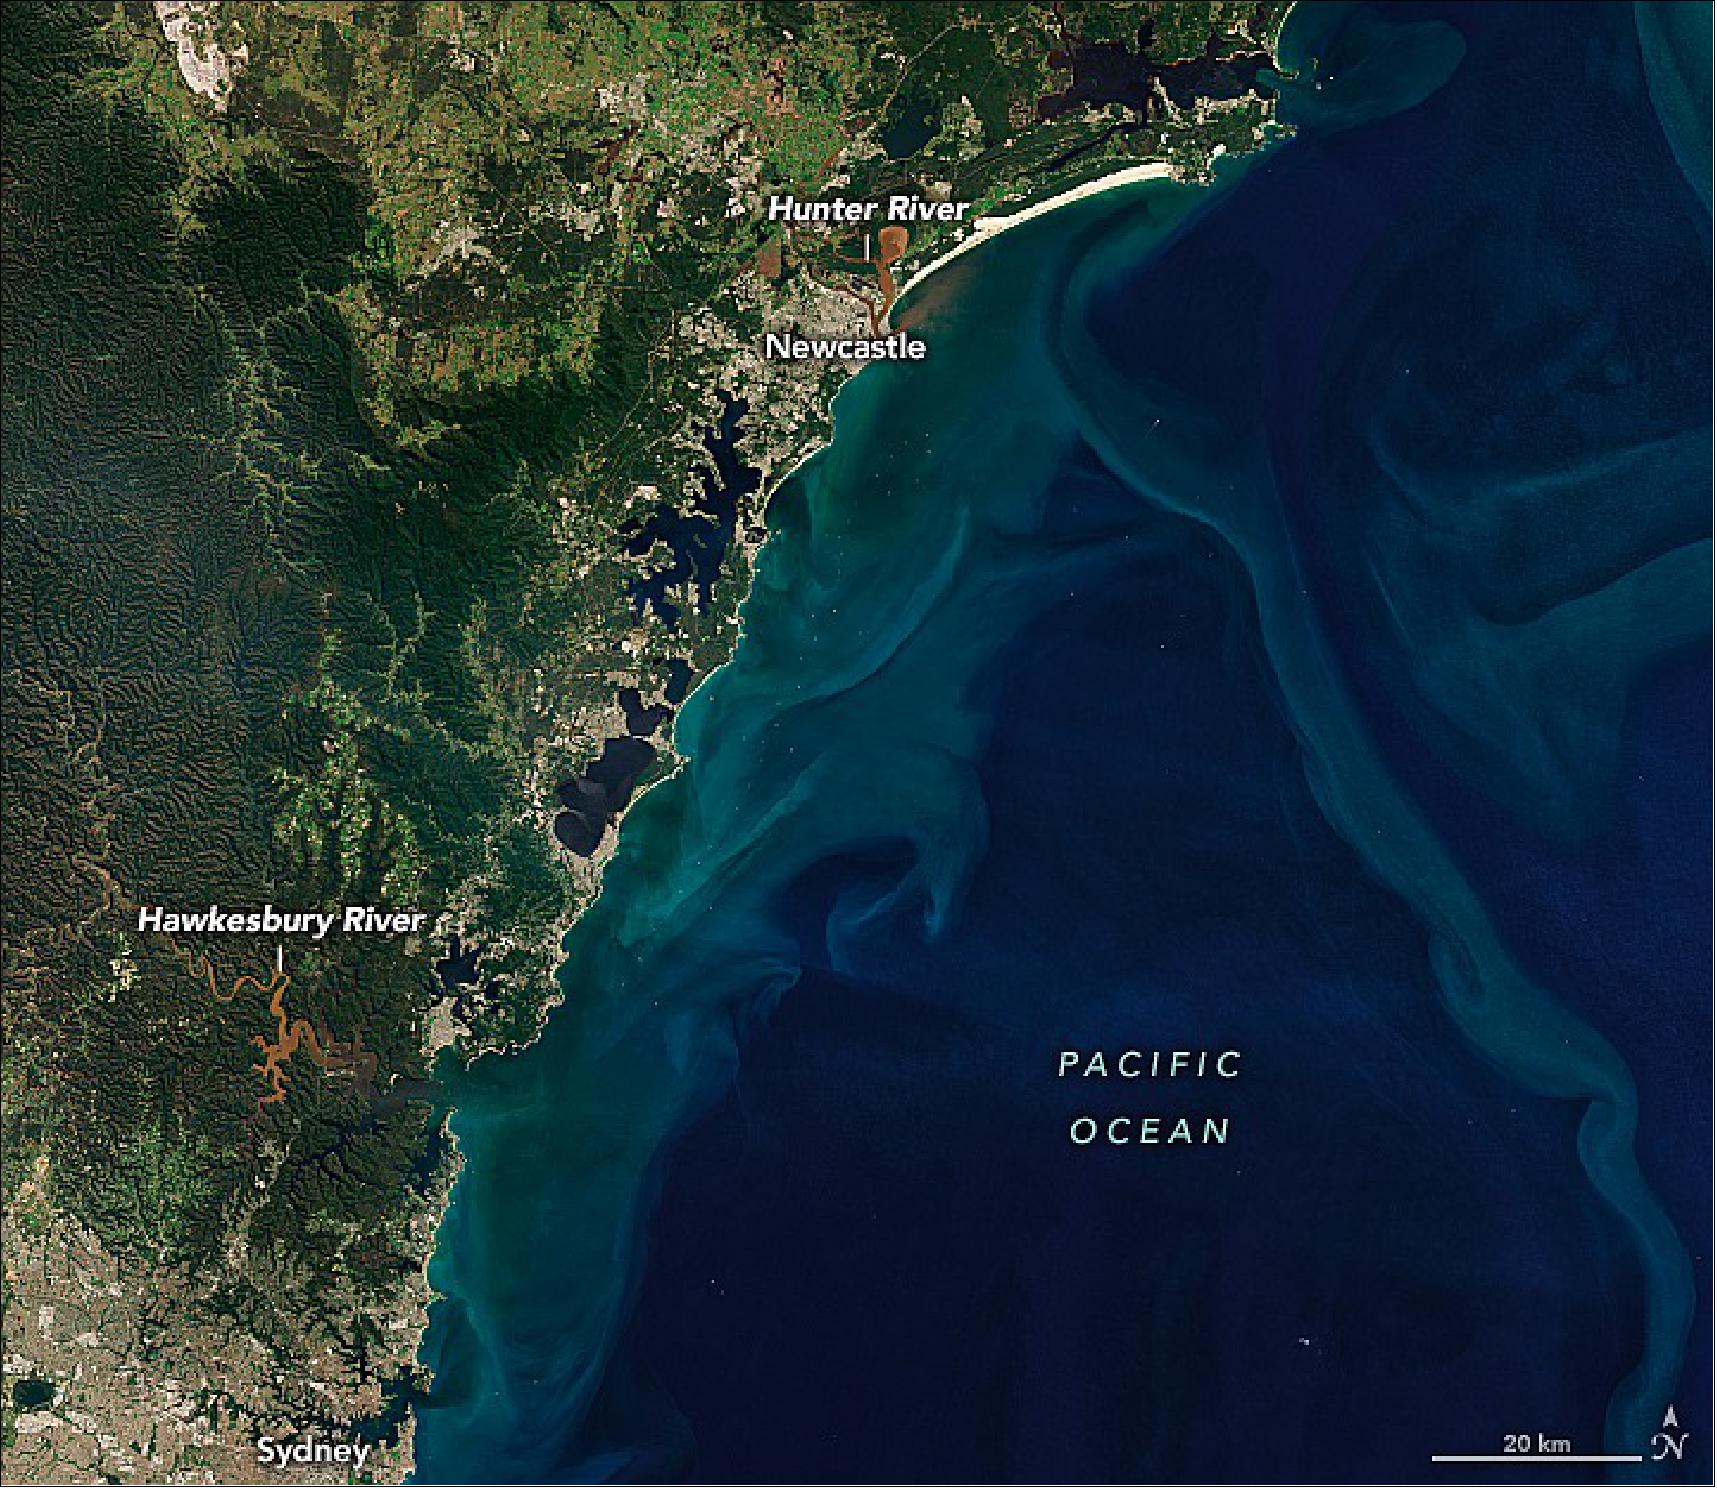
• April 11, 2022: Just over three months into 2022, Sydney, Australia, has already received a year’s worth of rain. The recent deluge brought more flooding to the already rain-soaked southern and central coasts of New South Wales, prompting evacuations. 55) The excessive rain began in late 2021 with the rainiest November on record. It continued with more rain and flooding in February and March 2022. On March 9, Australia declared a national emergency. Operational Land Imager-2 (OLI-2) on Landsat-9 acquired the below image. Near the top of the below image, north of Newcastle, a large lobe of brown floodwater has inundated the Hunter Wetlands. A plume of sediment can also be seen discharging from the mouth of the Hunter River and flowing along the beach in Worimi National Park. Sydney and its harbor can be seen at the bottom left of the image. North of Sydney are the brown, sediment-laden waters of the Hawkesbury River.
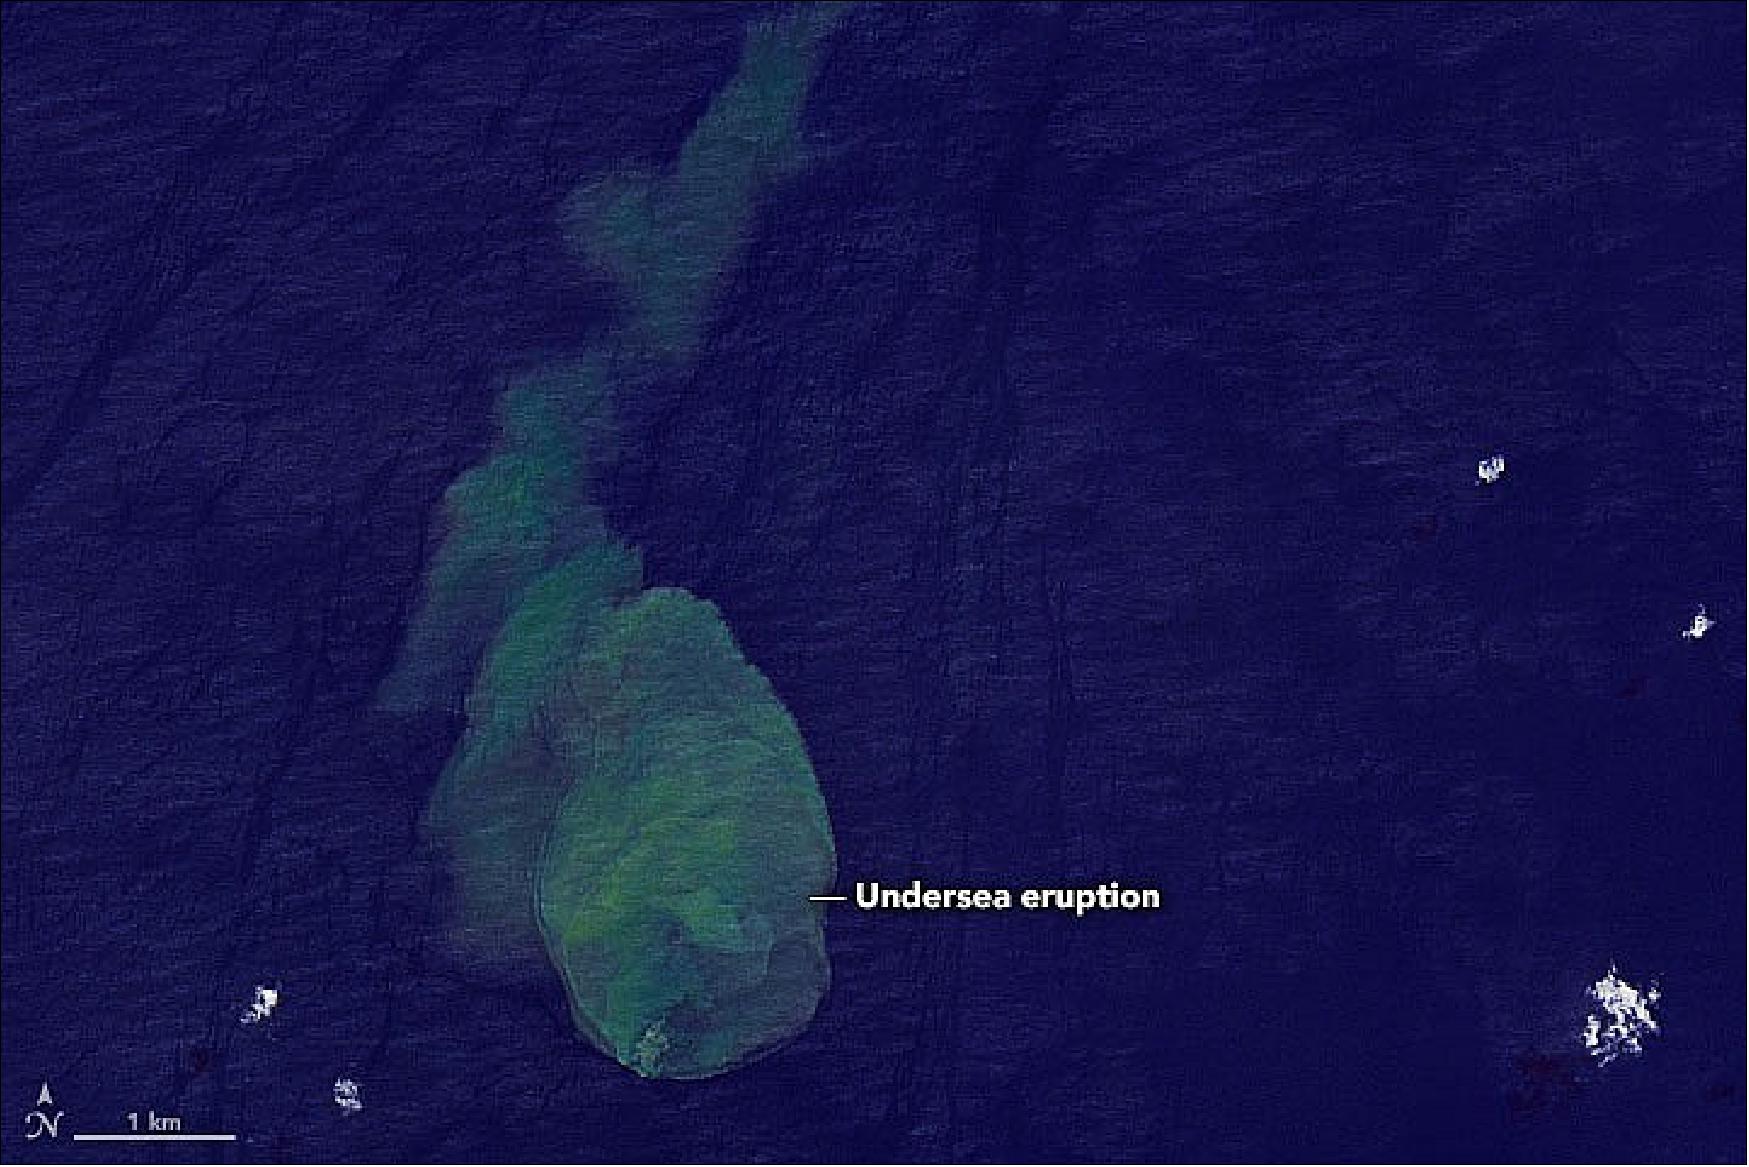
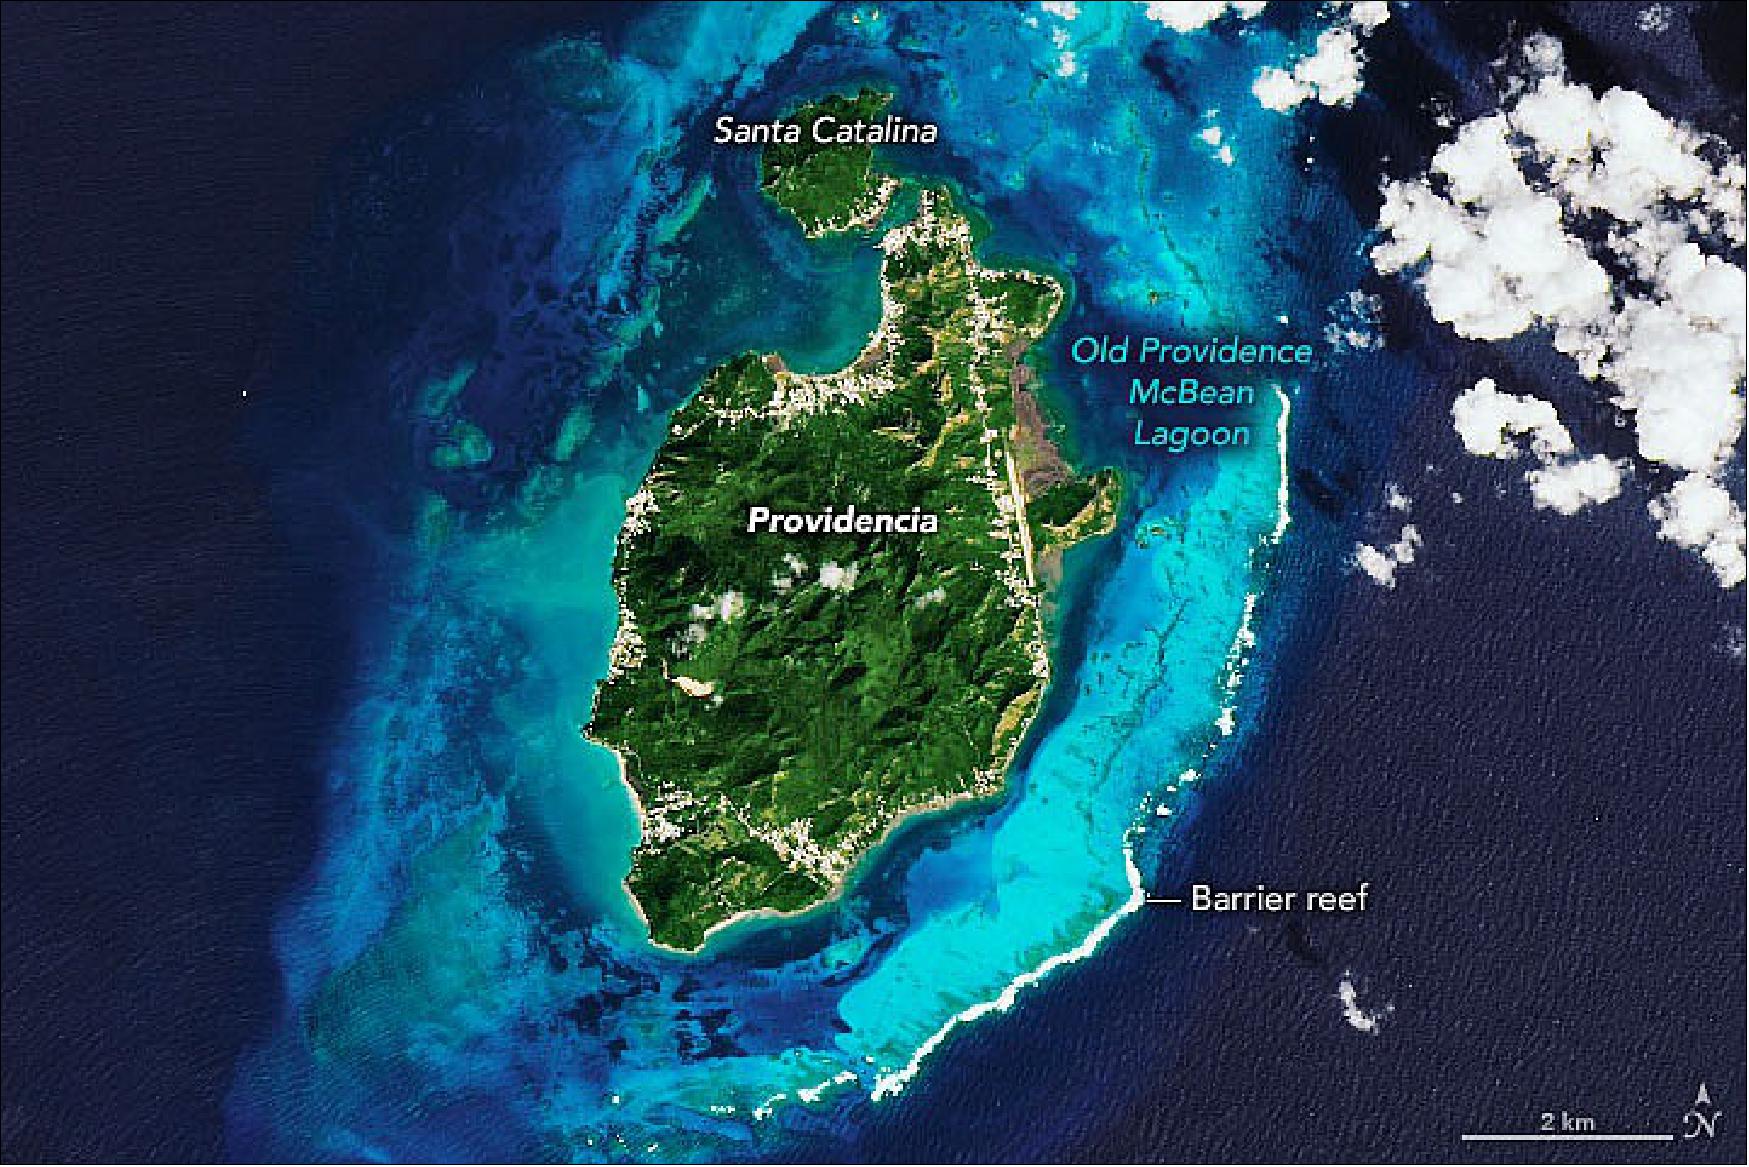
• March 27, 2022: Providencia is officially a territory of Colombia, though it sits closer to the Nicaraguan coast. Spanning about 17 square kilometers (7 square miles), the island is part of the San Andres archipelago; a small footbridge connects neighboring Santa Catalina Island. The island is one of the centerpieces of the Seaflower Biosphere Reserve, a UNESCO Marine Protected Area noted for its marine biodiversity. The peaks at the center of the island are remnants of an ancient volcano. 56 Images of the reef were captured by OLI-2.
• March 21, 2022: For at least a thousand years, humans have been the biggest agent of geologic change on the planet. Through agriculture and mining—and the resultant erosion they cause—humans move more earth than all natural agents of erosion (wind, water, and ice) combined. 57)In Scotland’s West Lothian region, roughly halfway between Edinburgh and Glasgow, the effects of more than a century of mining are still highly visible in the form of 19 large spoils heaps. Locally called bings, these piles of waste rock are remnants of shale mining that occurred between 1851 and 1963. The tallest bing rises 95 meters (310 feet) above the surrounding land. Construction of the Five Sisters, also called the Westwood Bing, began during World War II. It owes its large size and unique five-fingered shape to the introduction of motorized conveyor belts and carts on rails to haul and tip the spoils. This mechanization produced longer, higher, and steeper bings. The Operational Land Imager-2 (OLI-2) on Landsat 9 acquired the image that can be seen below.

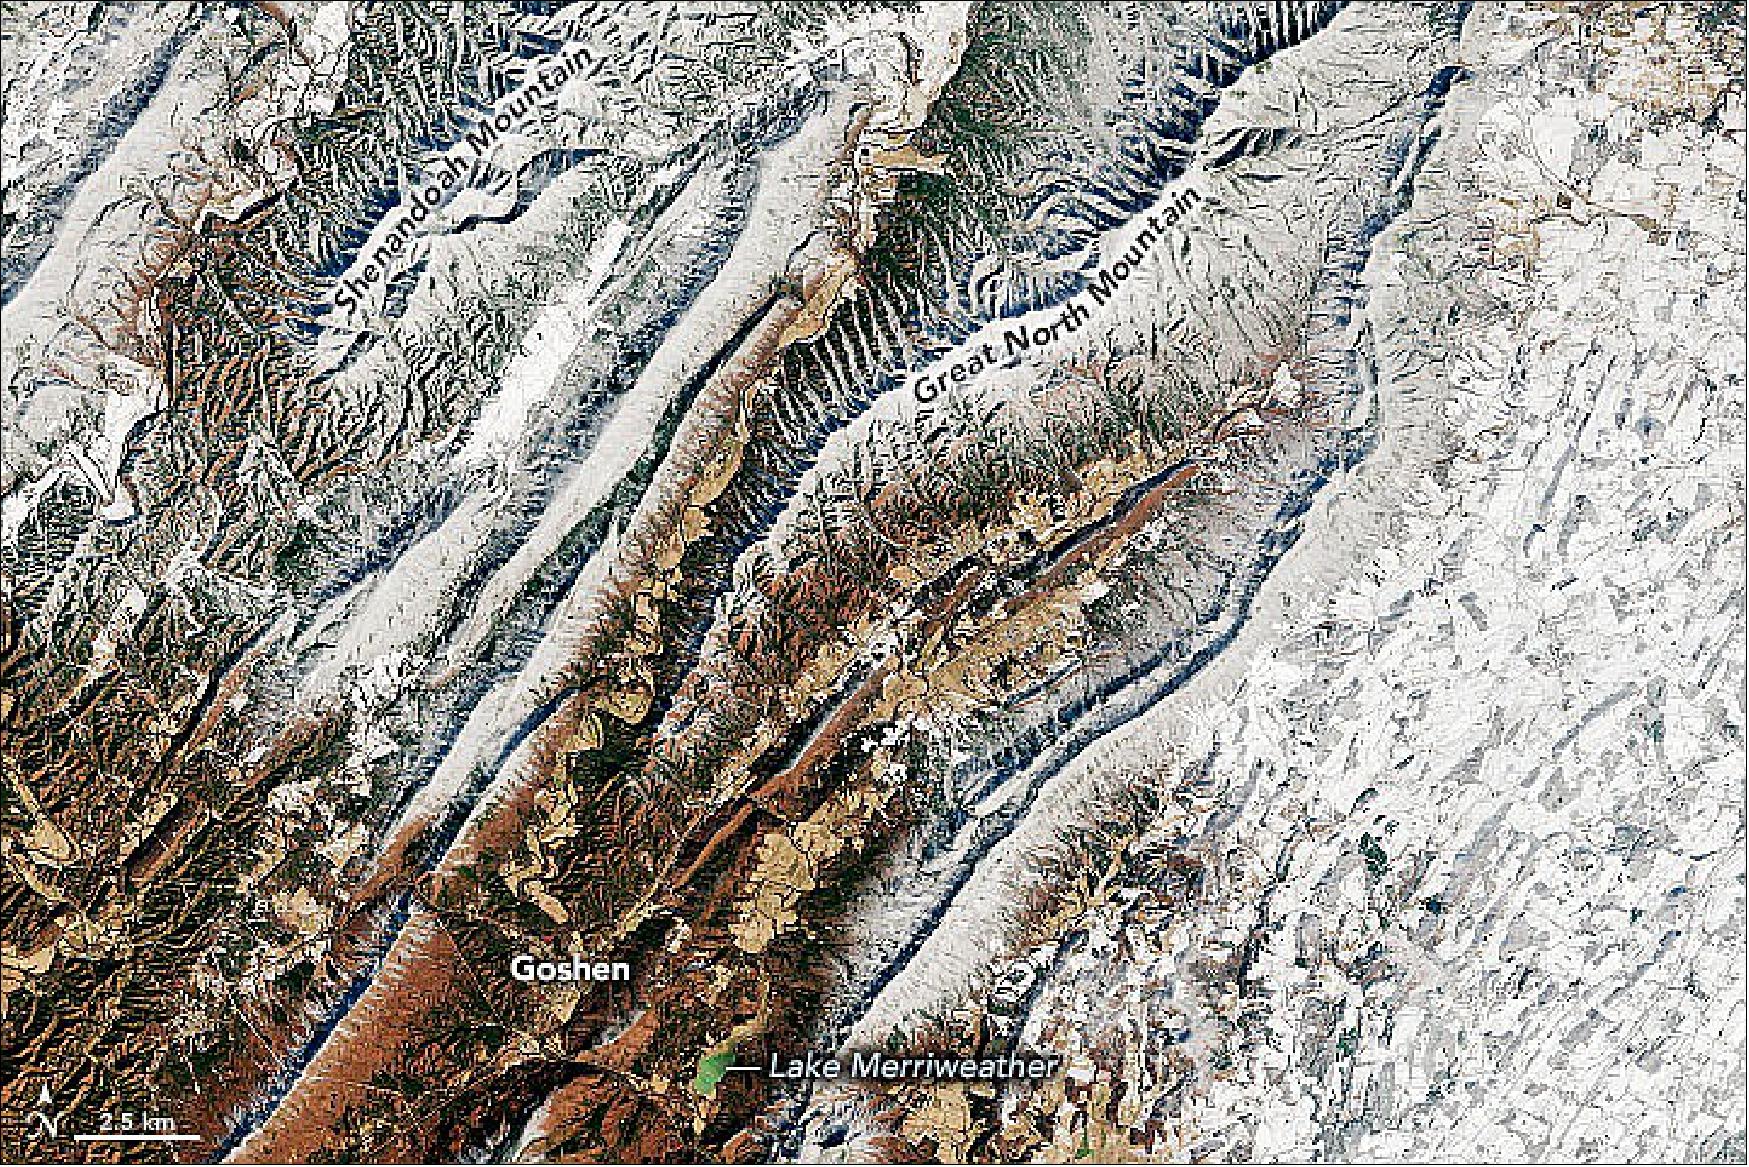
• February 25, 2022: Another blast of winter weather passed over the eastern United States in mid-February 2022. Though the storm was less substantial than the north eastern one in January, it managed to drop enough snow to accent parts of the Appalachian Mountains. 58) According to the National Weather Service, snowfall on February 13 was the heaviest in Rockbridge and Bath counties, where as much as 5 inches (13 cm) had accumulated. Warm ground caused some of the snow to melt away by the afternoon, but cold air temperatures over the next few days helped some snow persist through February 15, when Landsat 9 passed over. The ground appears bare in the town of Goshen and along some of the river valleys.
• February 25, 2022: To celebrate the recent data release from Landsat-9, this week we take a closer look at a part of Washington state – the northwesternmost state of the US – through the lens of Landsat-9. 59) Data from Landsat-9, which was launched in September 2021, is publicly available for users and researchers across the world. The satellite will continue the programme’s critical role in monitoring, understanding and managing the land resources needed to sustain human life. A partnership between NASA and the US Geological Survey, the satellite carries two science instruments, the Operational Land Imager 2 (OLI-2) and the Thermal Infrared Sensor 2 (TIRS-2). The OLI–2 captures observations of the Earth’s surface in visible, near-infrared, and shortwave-infrared bands, and TIRS-2 measures thermal infrared radiation, or heat, emitted from Earth’s surface.
- Columbia River, the largest river in the Pacific Northwest, is visible in the top of the image in black. As water absorbs a fair amount of radiation, water bodies, such as the Columbia River, appear black in the image. However certain icy water bodies dotted in the left of the image can be seen in turquoise as ice reflects less in the near-infrared channel than in the visible part of the spectrum. The Landsat series is part of ESA’s Third-Party Missions programme which consists of almost 50 satellite missions, and also forms part of ESA’s Heritage Space programme.
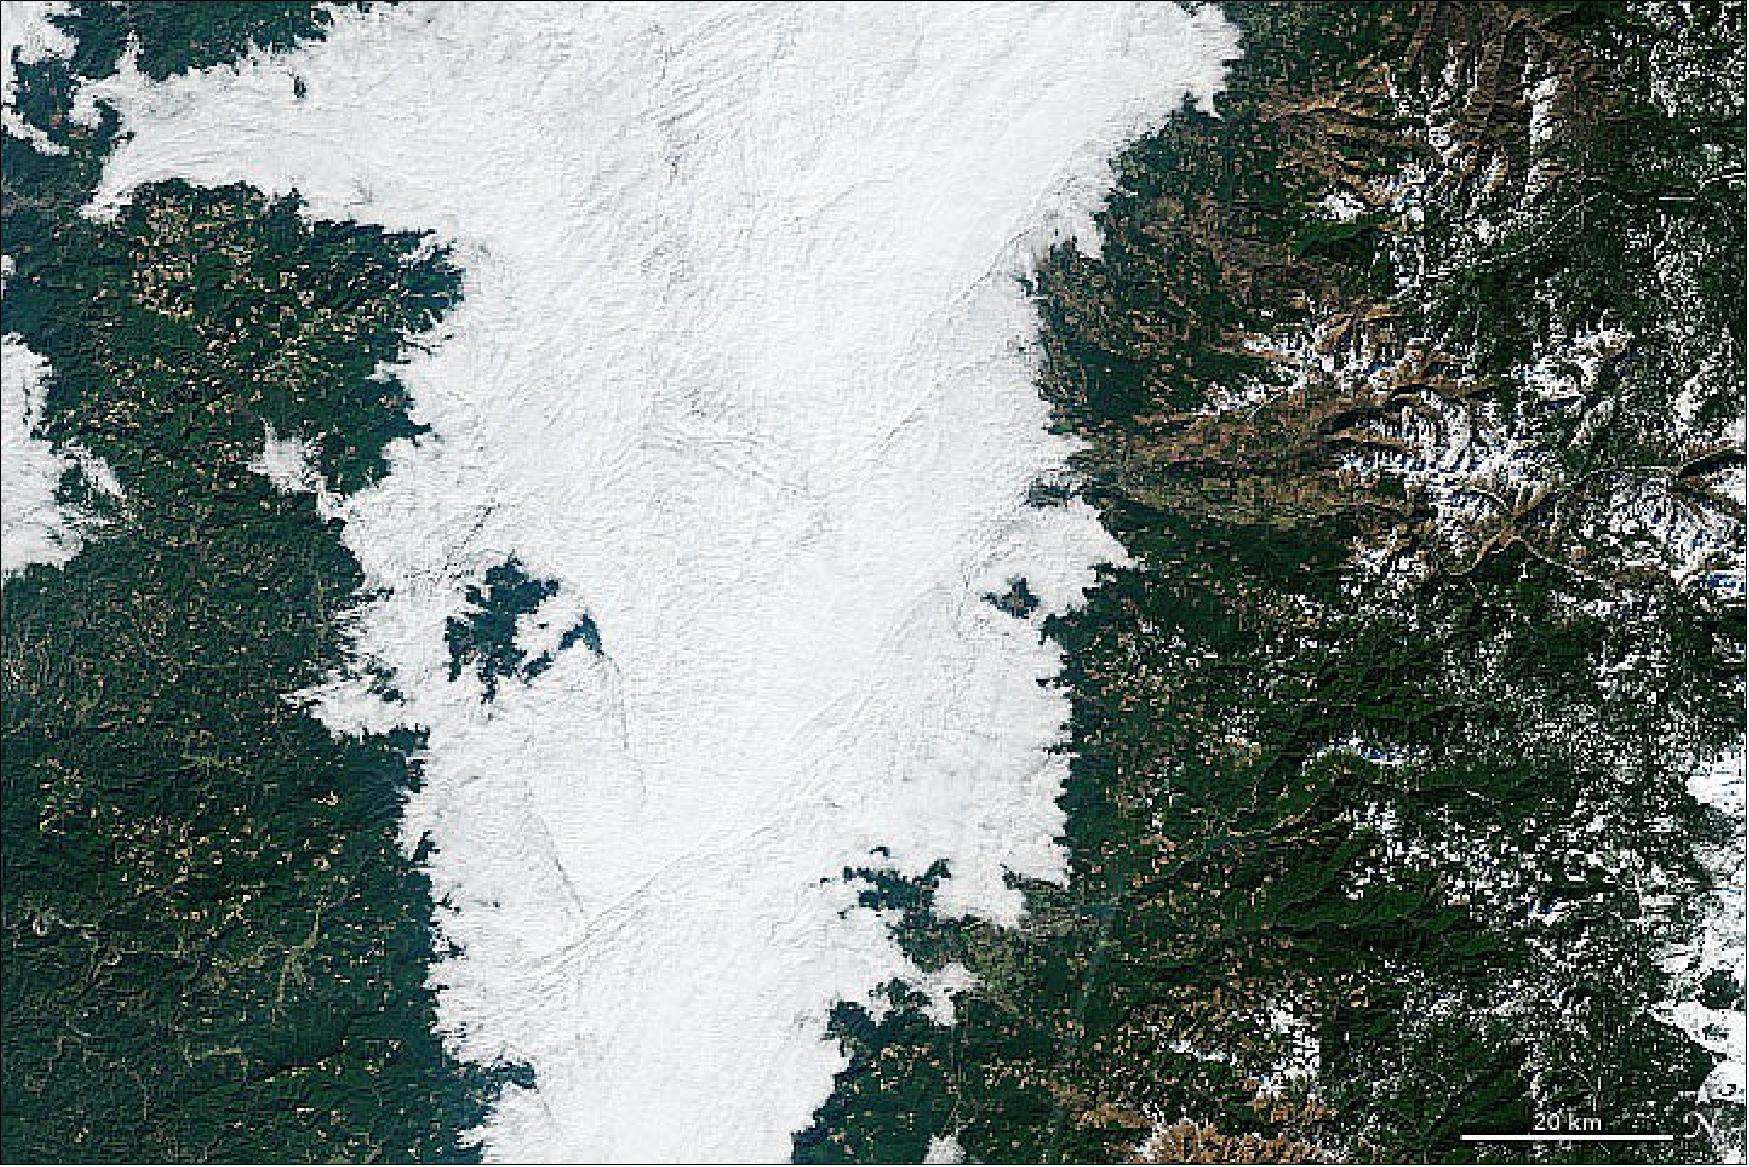
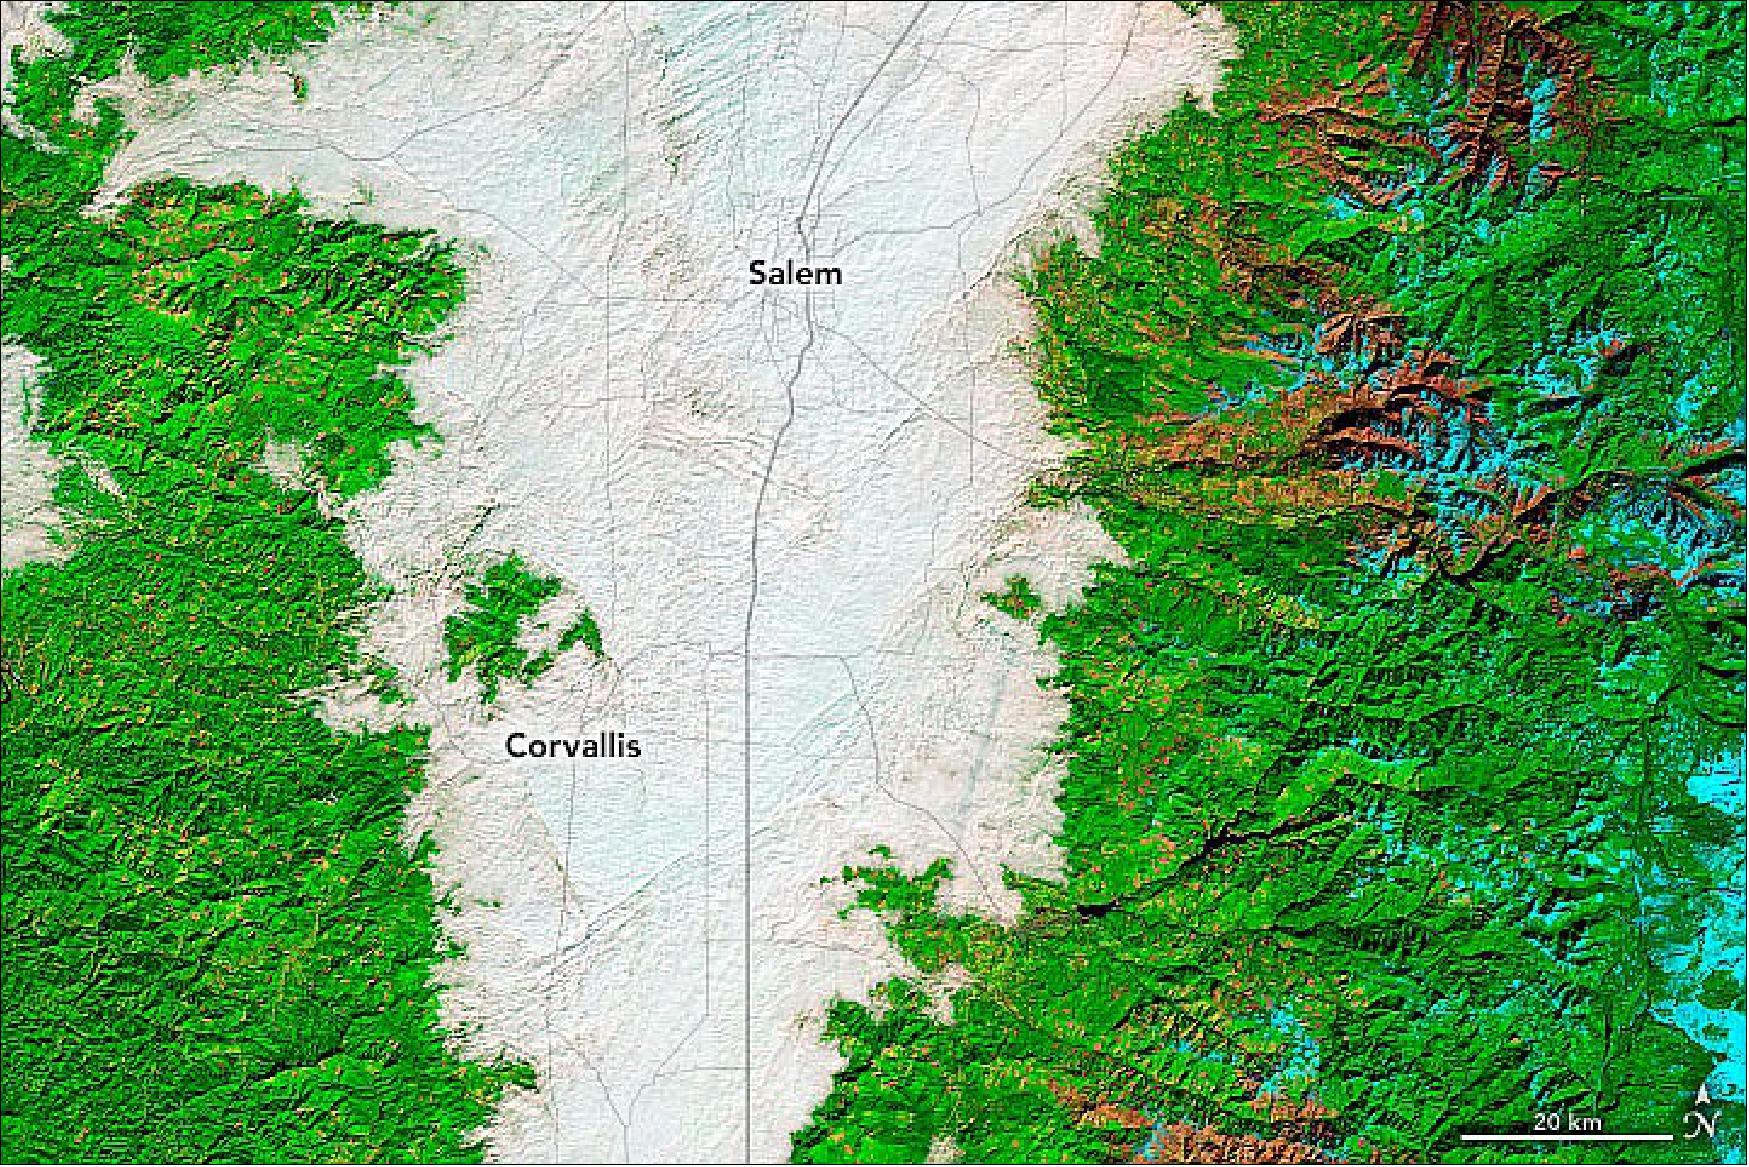
• February 20, 2022: The Willamette Valley in Oregon is rich with farms and orchards, home to 70 percent of the state’s population, and dotted with more than 500 wineries. But all of that can disappear under a blanket of white when the valley fills in with fog, as it has several times in recent weeks. 60) Fog is common in the region in the autumn and winter, as moist Pacific air moves inland, cools, and sinks into the vast valley between the Cascade Mountains and the Oregon Coast Range. As that air gives up its heat to the upper atmosphere, the layer near the surface becomes saturated and essentially forms clouds at ground level. Such fog has been locked in the Willamette Valley for several long stretches in January and February 2022 due to temperature inversions, where warm air high in the atmosphere moved in over the cooler, denser air in the lowlands. Oregon has already seen at least three extended periods of valley fog in 2022, as observed by the Moderate Resolution Imaging Spectroradiometer (MODIS) on NASA’s Terra satellite from February 8-12, January 22-29, and January 14-17. OLI-2 captured both natural and false colour images of the region's fog.
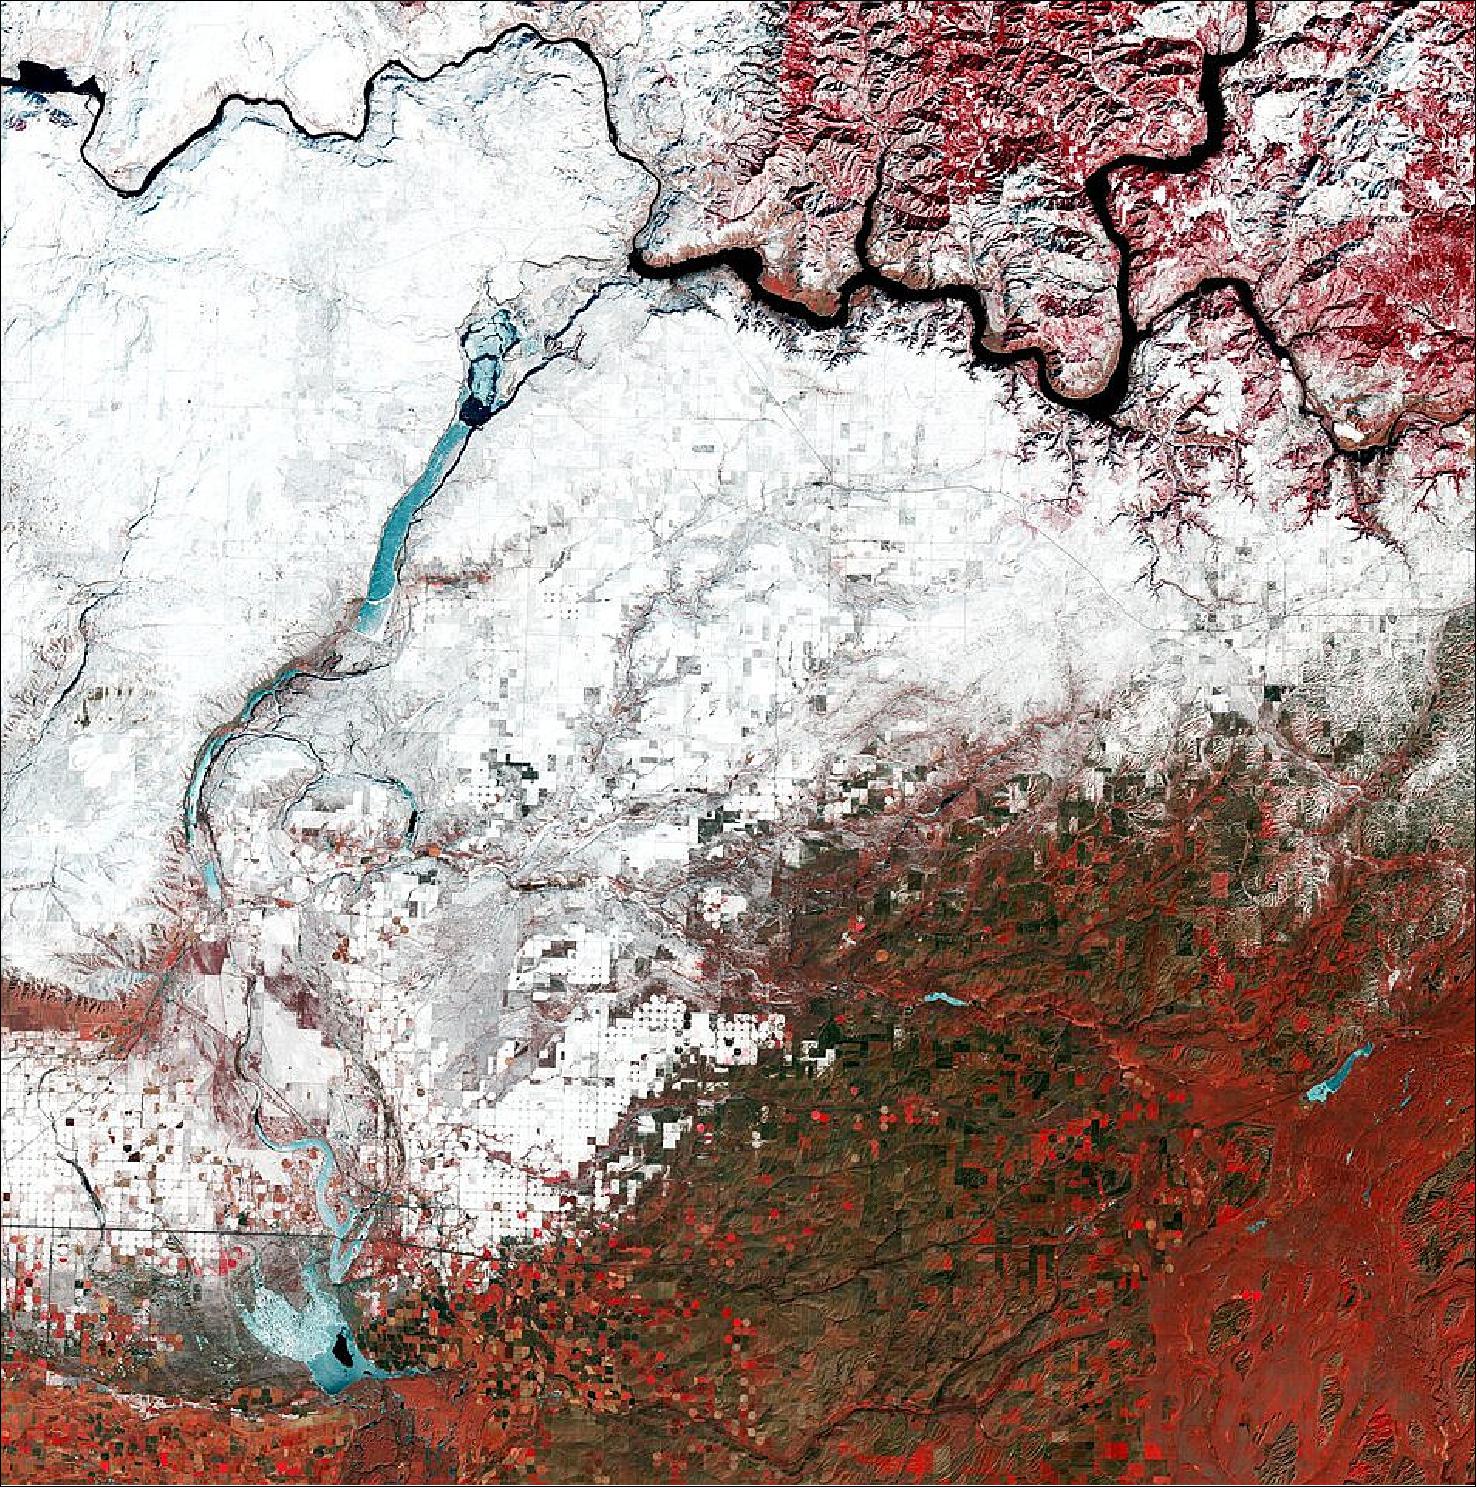
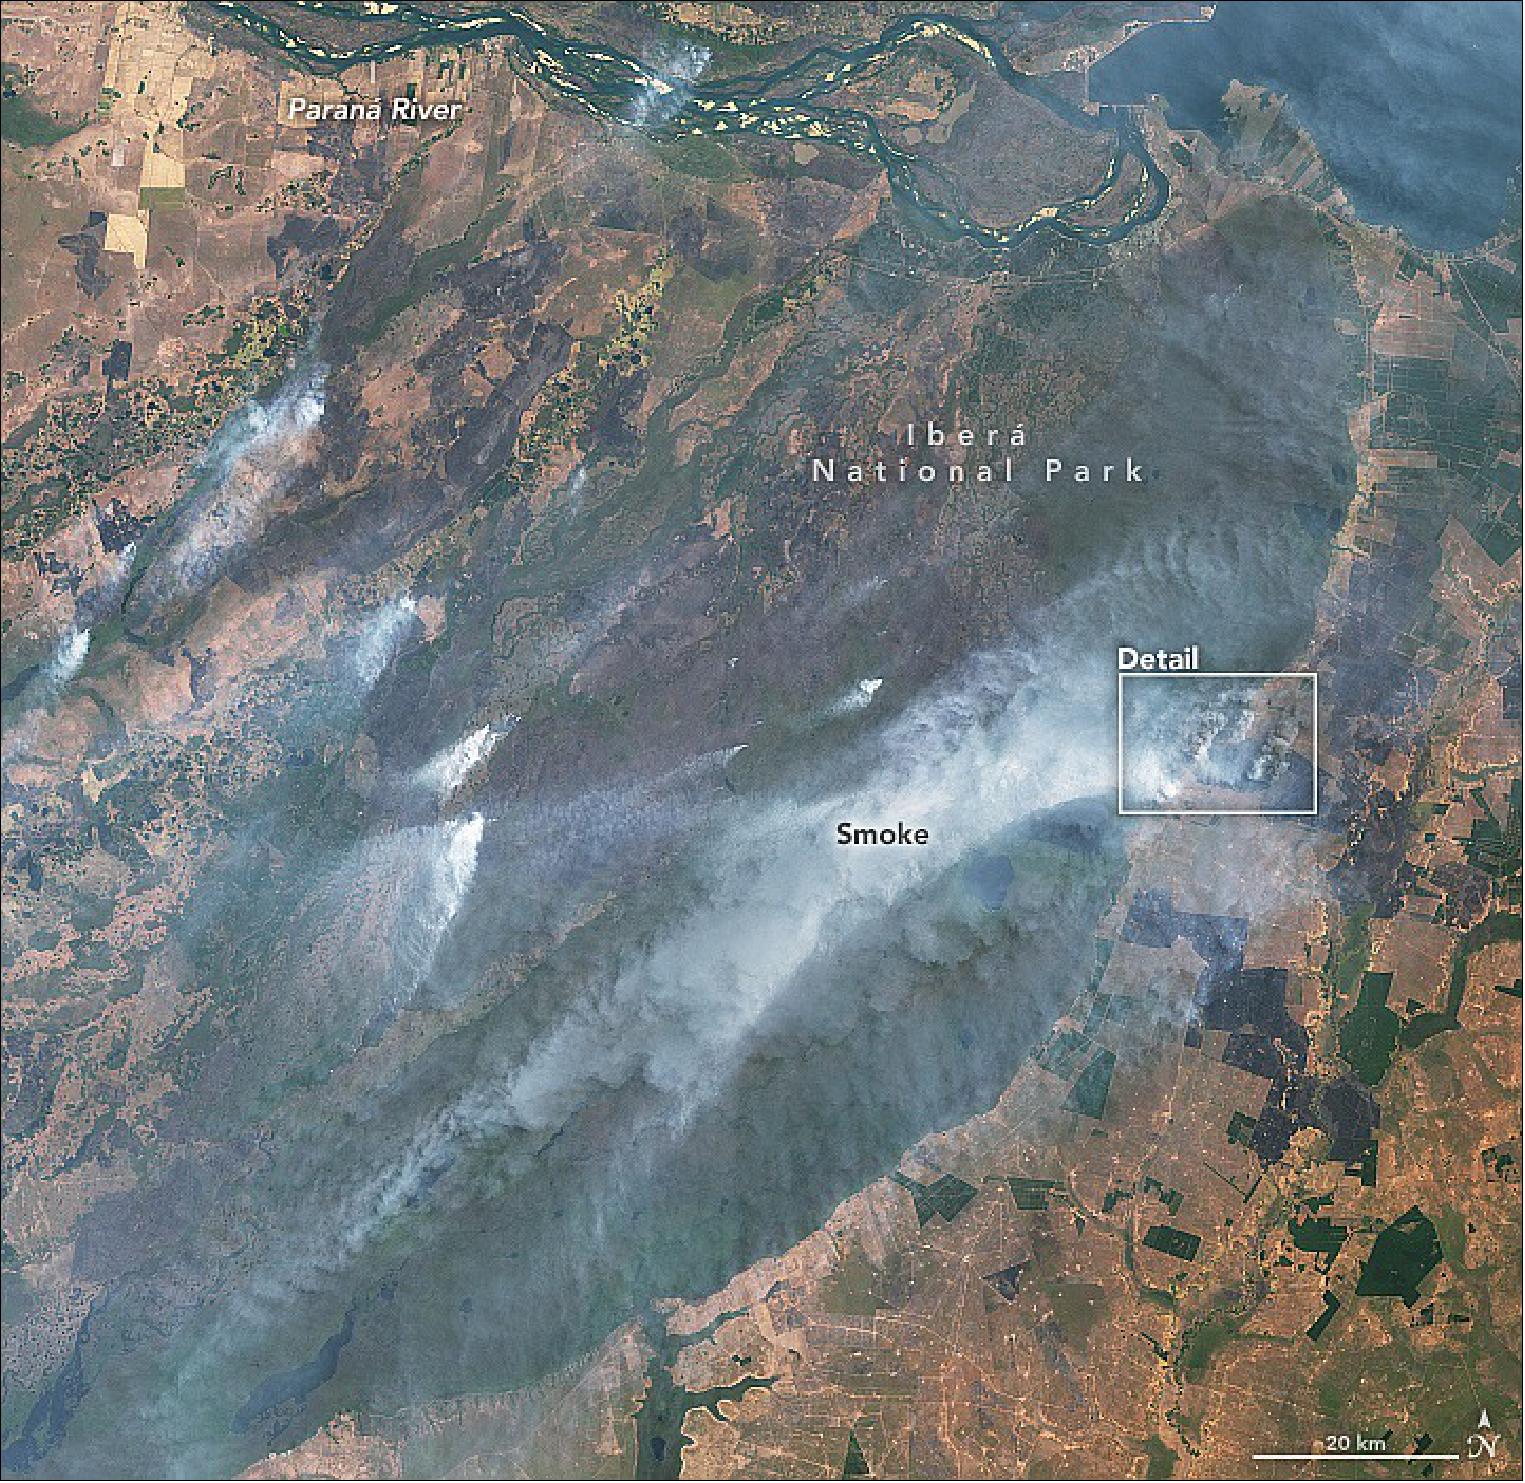
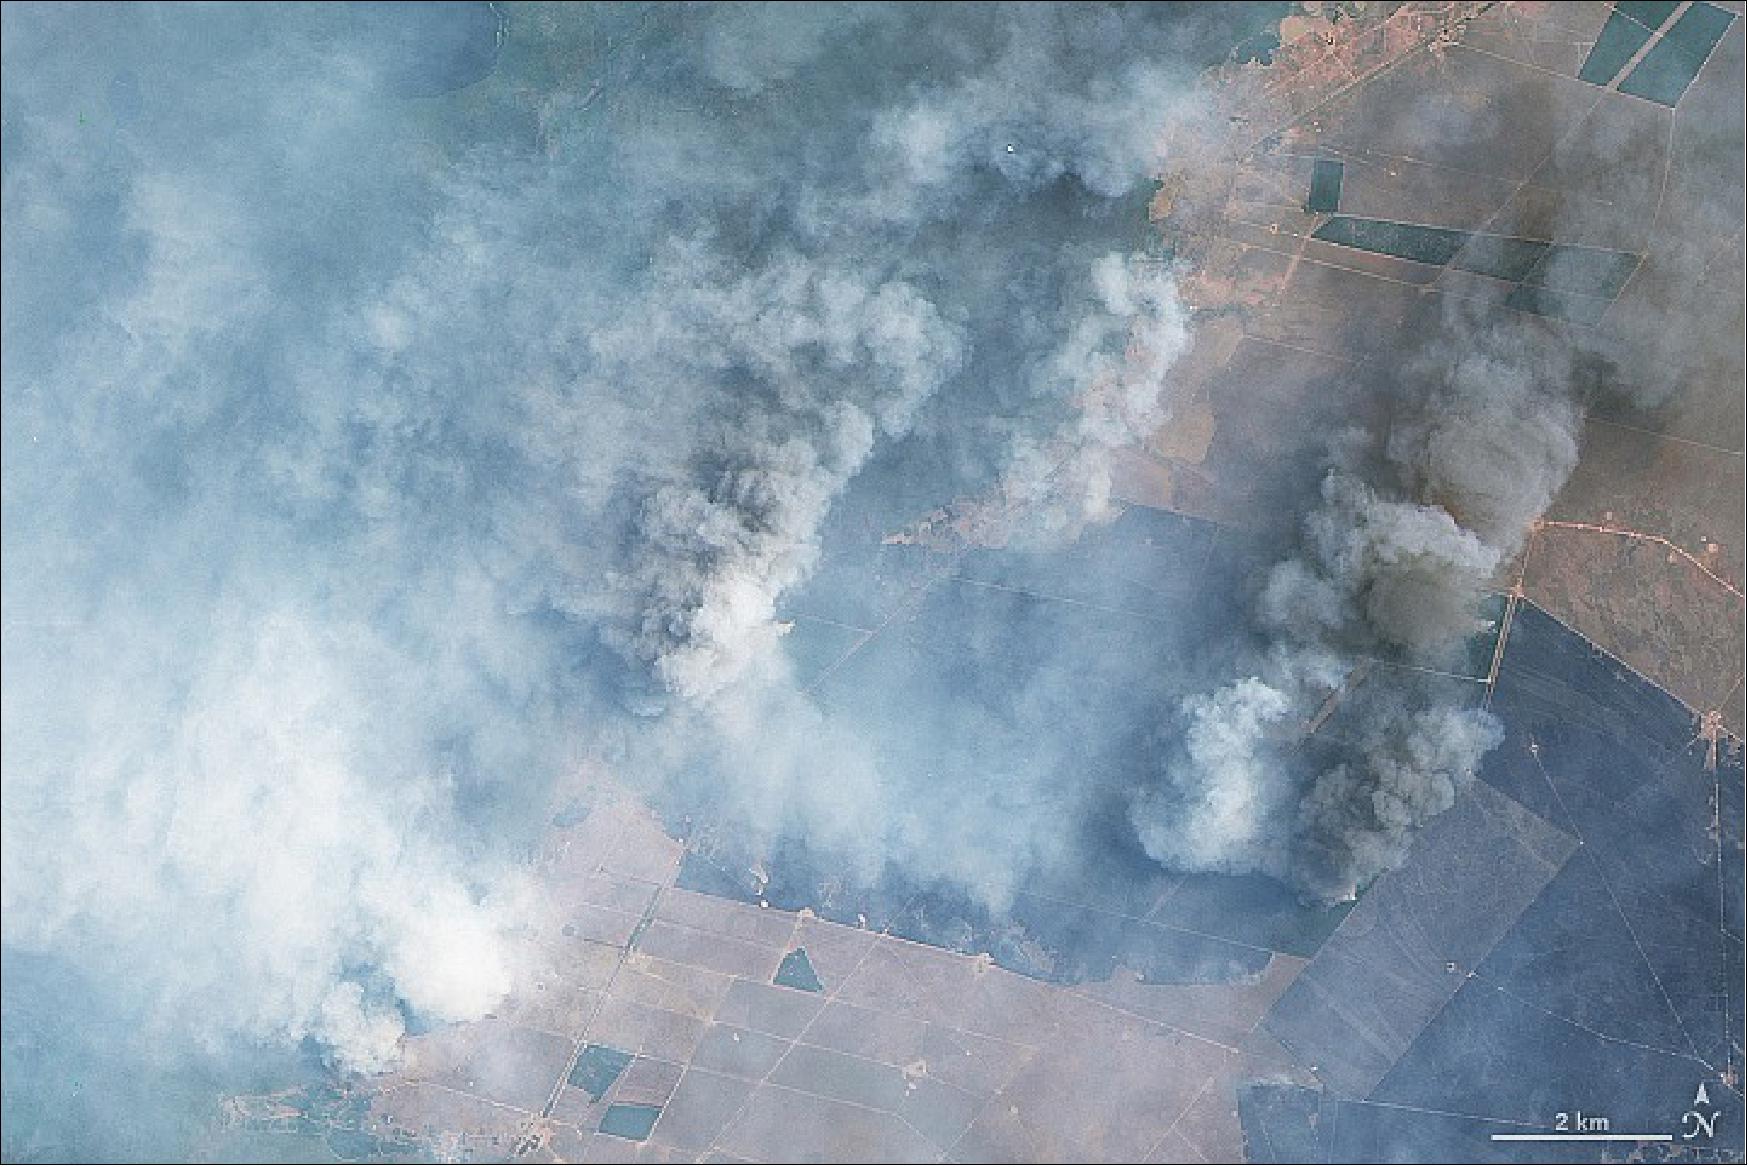
• February 18, 2022: Amidst a record-setting heatwave and ongoing drought, northeastern Argentina has been experiencing widespread wildfires. In late January 2022, more than a thousand fires were burning around Corrientes province, a predominantly rural and agricultural region that has seen little to no rain in two months. Since the fires began in December, more than 520,000 hectares (1.3 million acres) have burned, killing wildlife and livestock, decimating pasturelands, and destroying crops such as yerba mate and rice. 61) Landsat-9's OLI-2 captured images of the region for the duration of the wildfires.
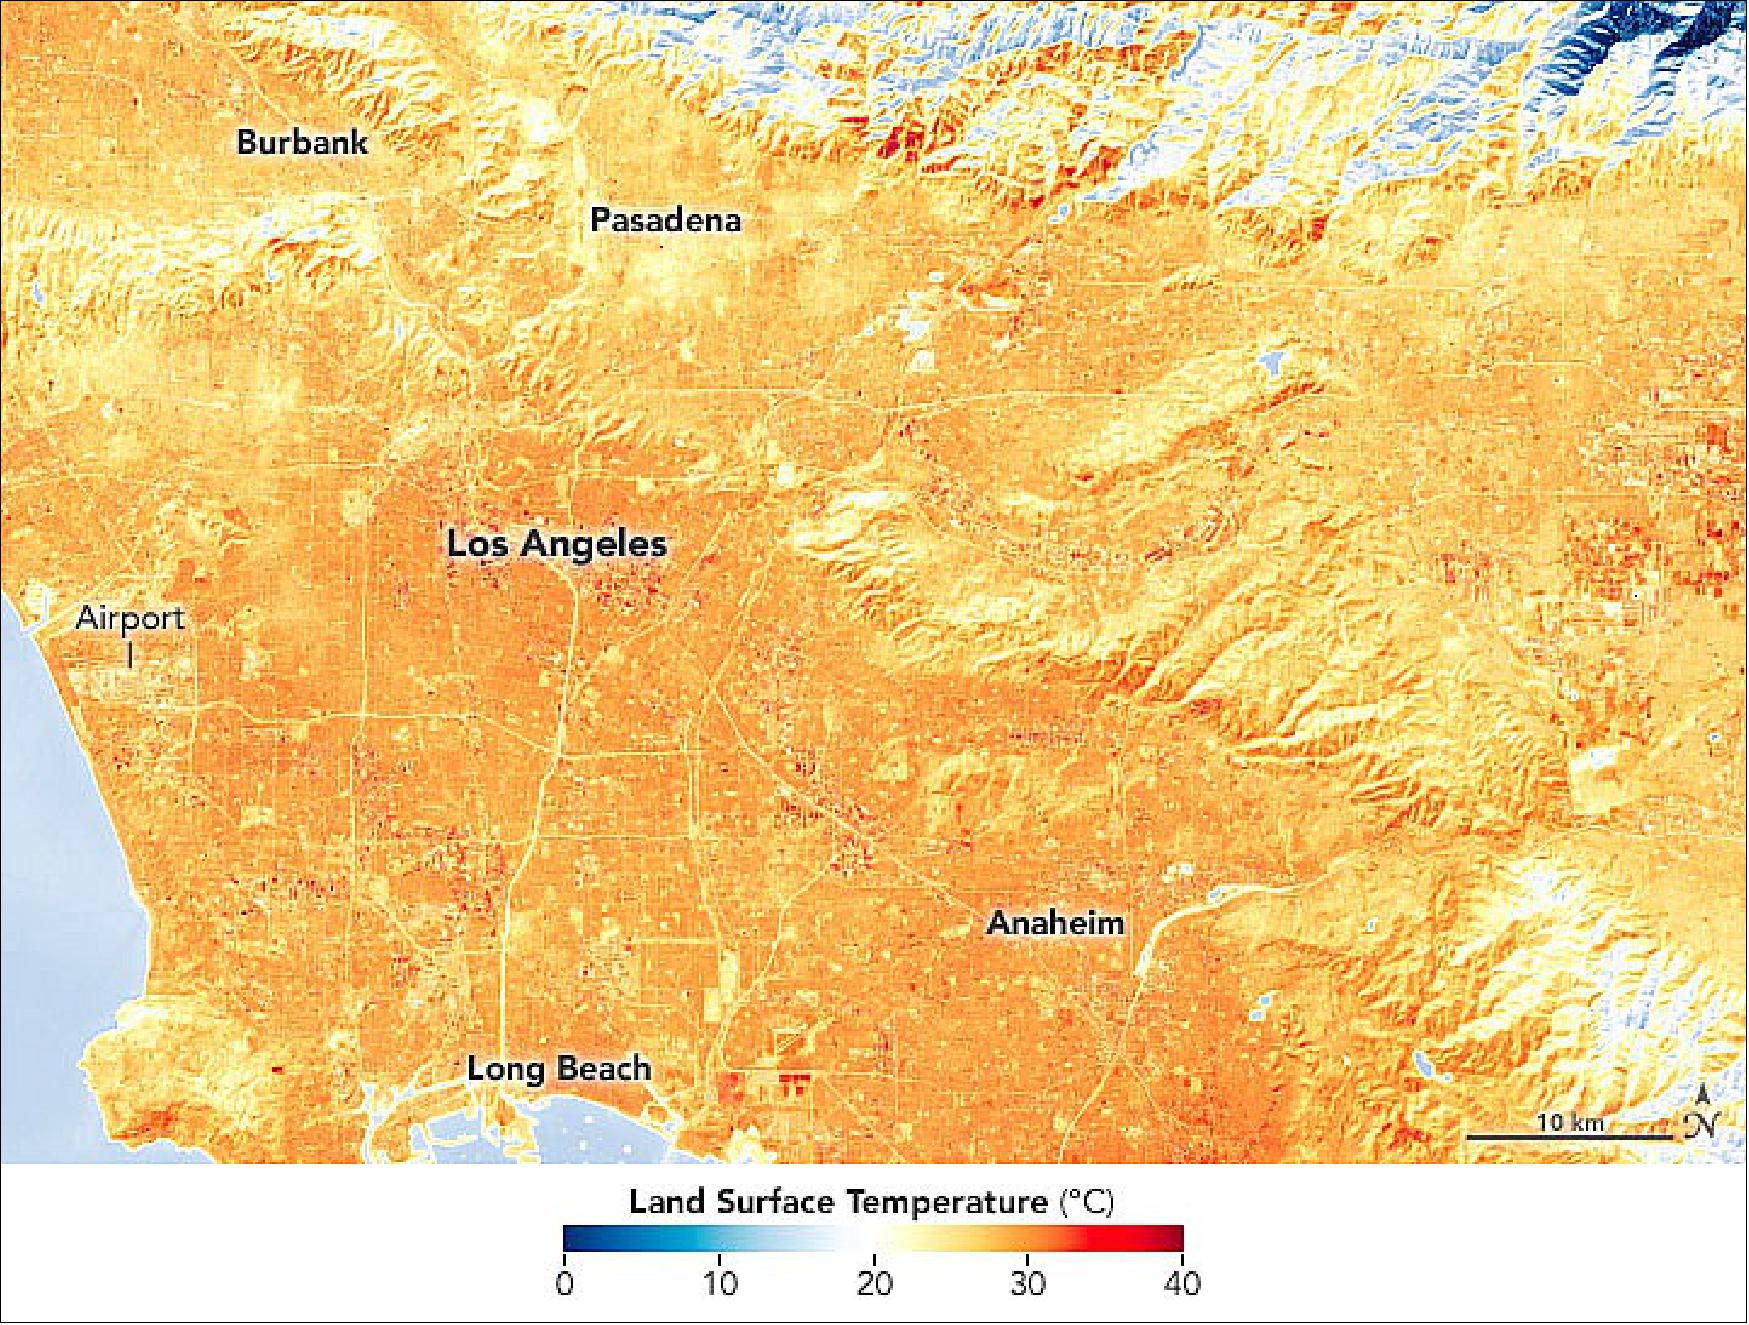
• February 12, 2022: NASA launched Landsat-9 in September 2021 from the Vandenberg Space Force Base, about 150 miles (240 km) from Los Angeles. The satellite took its first light images on October 31, and mission operators have since been testing the satellite’s systems and subsystems and calibrating its instruments. In late January 2022, NASA transferred operation of Landsat-9 to the U.S. Geological Survey (USGS). Landsat-9 data is now available for free download from EarthExplorer, Machine to Machine (M2M), and LandsatLook. From October 31, 2021 until this point, Landsat 9 has collected more than 57,000 images of Earth. The images will be processed, archived, and distributed from the USGS Earth Resources Observation and Science Center.
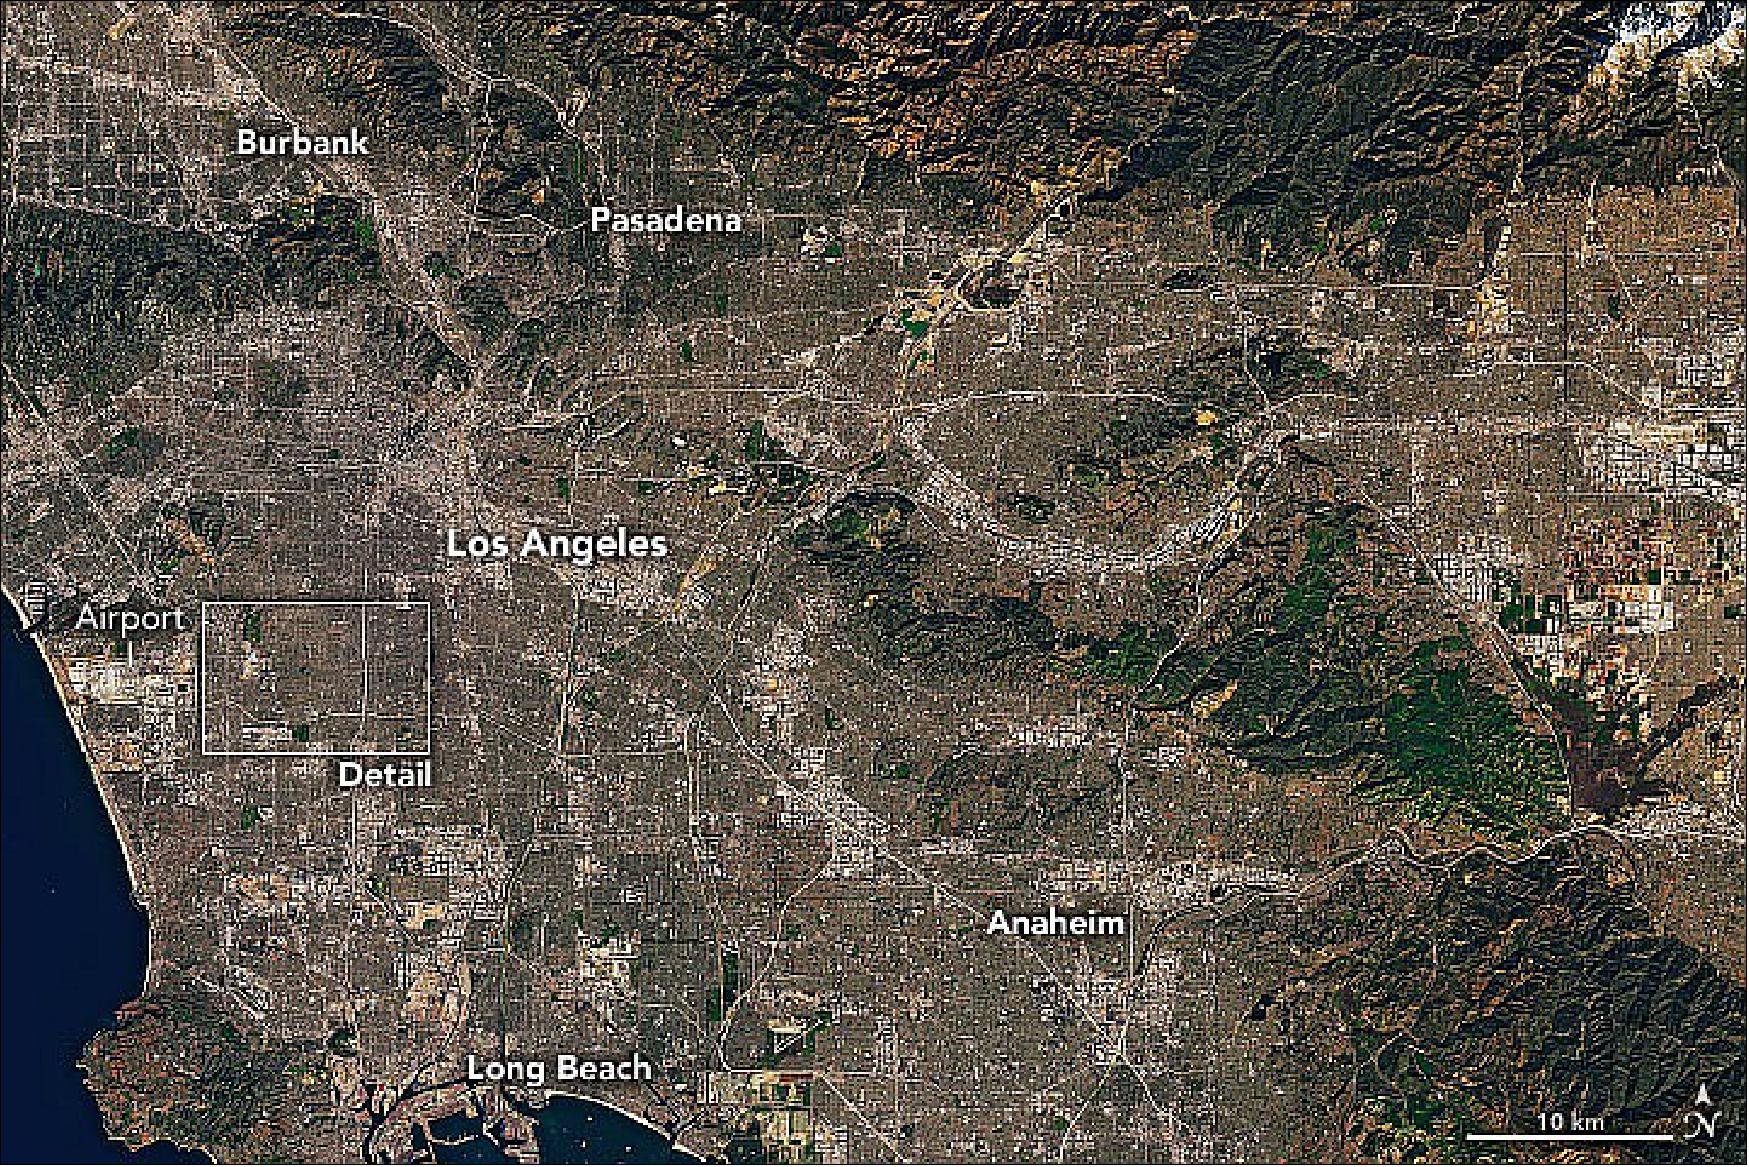
- Landsat-9 carries two main instruments: OLI-2, which detects visible, near-infrared, and shortwave-infrared light in nine wavelengths, and the Thermal Infrared Sensor 2 (TIRS-2), which detects thermal radiation in two wavelengths used to measure Earth’s surface temperatures. The new satellite and instruments are quite similar in design to Landsat 8, which was launched in 2013 and remains in orbit. Together the satellites will collect approximately 1,500 images of Earth’s surface every day, observing the entire planet every eight days. Landsat-9 features higher radiometric resolution, allowing OLI-2 to detect more subtle differences in surface features, especially over darker areas like water or dense forests. With 14-bit radiometric resolution, Landsat 9 can differentiate more than 16,000 shades of a given wavelength; Landsat-8 provides 12-bit data and 4,096 shades. Landsat-7, the satellite being replaced, detects only 256 shades with its 8-bit resolution.
• November 5, 2021: Landsat-9, a joint mission between NASA and the U.S. Geological Survey (USGS) that launched Sept. 27, 2021, has collected its first light images of Earth.63)The images, all acquired Oct. 31, are available online. They provide a preview of how the mission will help people manage vital natural resources and understand the impacts of climate change, adding to Landsat’s unparalleled data record that spans nearly 50 years of space-based Earth observation. These first light images shows Detroit, Michigan, with neighboring Lake St. Clair, the intersection of cities and beaches along a changing Florida coastline and images from Navajo Country in Arizona that will add to the wealth of data helping us monitor crop health and manage irrigation water.
- Landsat-9 is similar in design to its predecessor, Landsat-8, which was launched in 2013 and remains in orbit, but features several improvements. The new satellite transmits data with higher radiometric resolution back down to Earth, allowing it to detect more subtle differences, especially over darker areas like water or dense forests. For example, Landsat-9 can differentiate more than 16,000 shades of a given wavelength color; Landsat-7, the satellite being replaced, detects only 256 shades. This increased sensitivity will allow Landsat users to see much more subtle changes than ever before. Landsat 9 carries two instruments that capture imagery: OLI-2 (Operational Land Imager- 2 ), which detects visible, near-infrared and shortwave-infrared light in nine wavelengths, and TIRS-2 (Thermal Infrared Sensor-2), which detects thermal radiation in two wavelengths to measure Earth’s surface temperatures and its changes.
- These instruments will provide Landsat-9 users with essential information about crop health, irrigation use, water quality, wildfire severity, deforestation, glacial retreat, urban expansion, and more. NASA’s Landsat-9 team is conducting a 100-day check-out period that involves testing the satellite’s systems and subsystems and calibrating its instruments in preparation for handing the mission over to USGS in January. USGS will operate Landsat-9 along with Landsat-8, and together the two satellites will collect approximately 1,500 images of Earth’s surface every day, covering the globe every eight days. Teams from NASA’s Goddard Space Flight Center in Greenbelt, Maryland, also built and tested the TIRS-2 instrument. NASA’s Launch Services Program, based at the agency’s Kennedy Space Center in Florida, managed the mission’s launch.

Sensor Complement
The two NASA science instruments are OLI-2 and TIRS-2. OLI-2 was constructed by BATC (Ball Aerospace & Technology Corp.), while TIRS-2 was developed by NASA’s Goddard Space Flight Center.
Landsat-9 flies near-identical copies of the OLI (Operational Land Imager) and TIRS (Thermal Infrared Sensor) instruments that were flown on Landsat-8. The TIRS instrument was upgraded to a risk class B implementation, whereas no changes were applied for OLI. With respect to the Landsat-9 project, these instruments are referred to as OLI-2 and TIRS-2.
In the four+ decades since Landsat-1 launched, the spectral bands of the Landsat satellites have evolved. Landsat-9, like Landsat-8, has the most evolved of the Landsat spectral bands. 64)
In 1972, Landsat-1 launched with a three-band RBV (Return Beam Vidicon) camera system and a secondary four-band digital MSS (Multispectral Scanner System). The MSS with its scanning mirror whisking back and forth to create an image, seemed to many researchers of the period the antithesis of the high quality camera systems traditionally used in aerial studies. But the secondary MSS instrument proved itself the imaging powerhouse producing superior data. But the four-band MSS was spectrally coarse; it essentially mimicked the color infrared films that became widely used during WWII (World War II).
For follow-on sensors, Landsat management brought together scientists from diverse fields to discuss and recommend spectral channels most useful for answering questions in their research areas. These discussions informed the more sophisticated TM (Thematic Mapper) sensor with its seven spectral bands that flew on the Landsat missions-4 and -5. The Landsat TM band placement has subsequently guided all successive Landsat sensors and is is also echoed in almost all modern passive remote sensing systems—domestic, international, public, commercial, and even those circling about other planets.
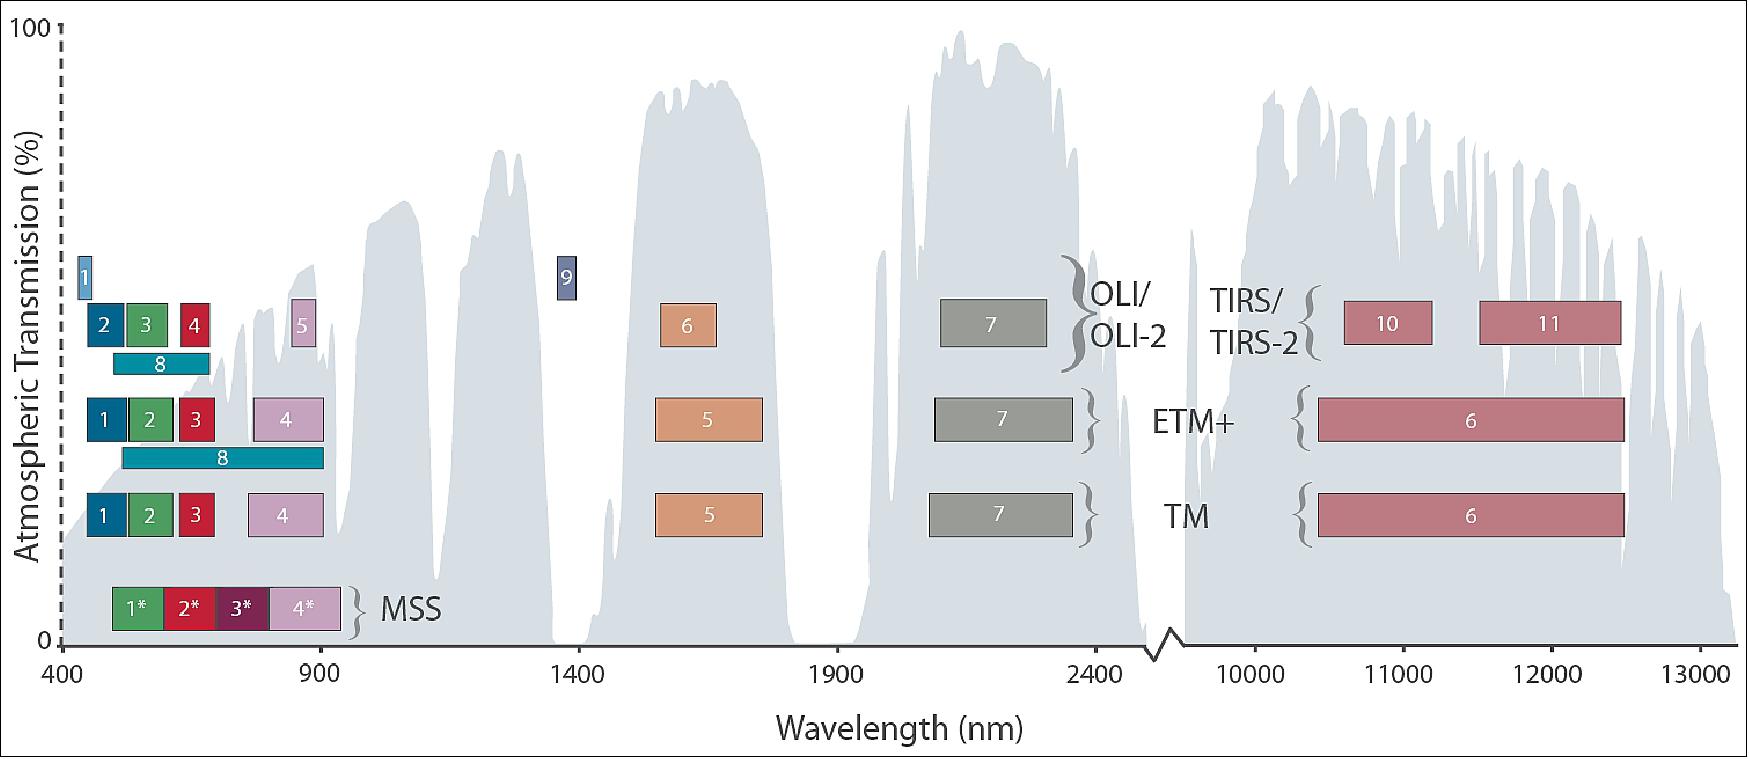
Today, Landsat-8 and 9 have eleven spectral bands acquired by the OLI/TIRS and OLI-2 / TIRS-2 instruments, respectively. These new bands help scientists measure high, thin clouds and water quality.
The previous generation sensor, ETM+, supports 8-bit data products, which means means the brightest to the darkest pixels are discriminated with 256 data values. The greater sensitivity of OLI, OLI-2, TIRS, and TIRS-2 instruments allow the signal to be discriminated over 4096 data values (12 bits), and the range has been increased to prevent saturation of very bright targets such as snow.
Band No | Band | Min lower band edge (nm) | Max upper band edge (nm) | Center wavelength (nm) | Max spatial resol. at nadir (m) |
1 | Coastal / Aerosol | 433 | 453 | 443 | 30 |
2 | Blue | 450 | 515 | 482 | 30 |
3 | Green | 525 | 600 | 562 | 30 |
4 | Red | 630 | 680 | 655 | 30 |
5 | NIR | 845 | 885 | 865 | 30 |
6 | SWIR-1 | 1560 | 1660 | 1610 | 30 |
7 | SWIR-2 | 2100 | 2300 | 2200 | 30 |
8 | Panchromatic | 500 | 680 | 590 | 15 |
9 | Cirrus | 1360 | 1390 | 1375 | 30 |
10 | Thermal | 10300 | 11300 | 10800 | 100 |
11 | Thermal | 11500 | 11300 | 12000 | 100 |
OLI-2 (Operational Land Imager-2)
OLI-2 continues observations in the visible, near infrared, and shortwave infrared portions of the electromagnetic spectrum and includes two new spectral bands, one of which is designed to support monitoring of coastal waters and the other to detect previously hard to see cirrus clouds that can otherwise unknowingly impact the signal from the Earth’s surface in the other spectral bands. 65)
The spatial resolution of its images are 15 m for the panchromatic band and 30 m for the multispectral bands. The image swath will be 185 km wide, covering wide areas of the Earth’s landscape while providing sufficient resolution to distinguish land cover features like urban centers, farms, and forests. Landsat-9’s near-polar orbit precesses at the same rate the Earth rotates around the sun, allowing the entire Earth to fall within view every 16 days at the same local solar time.
OLI-2 is, to the extent possible, a copy of OLI for Landsat-9 to maintain data continuity with Landsat-8 and to minimize cost and risk.
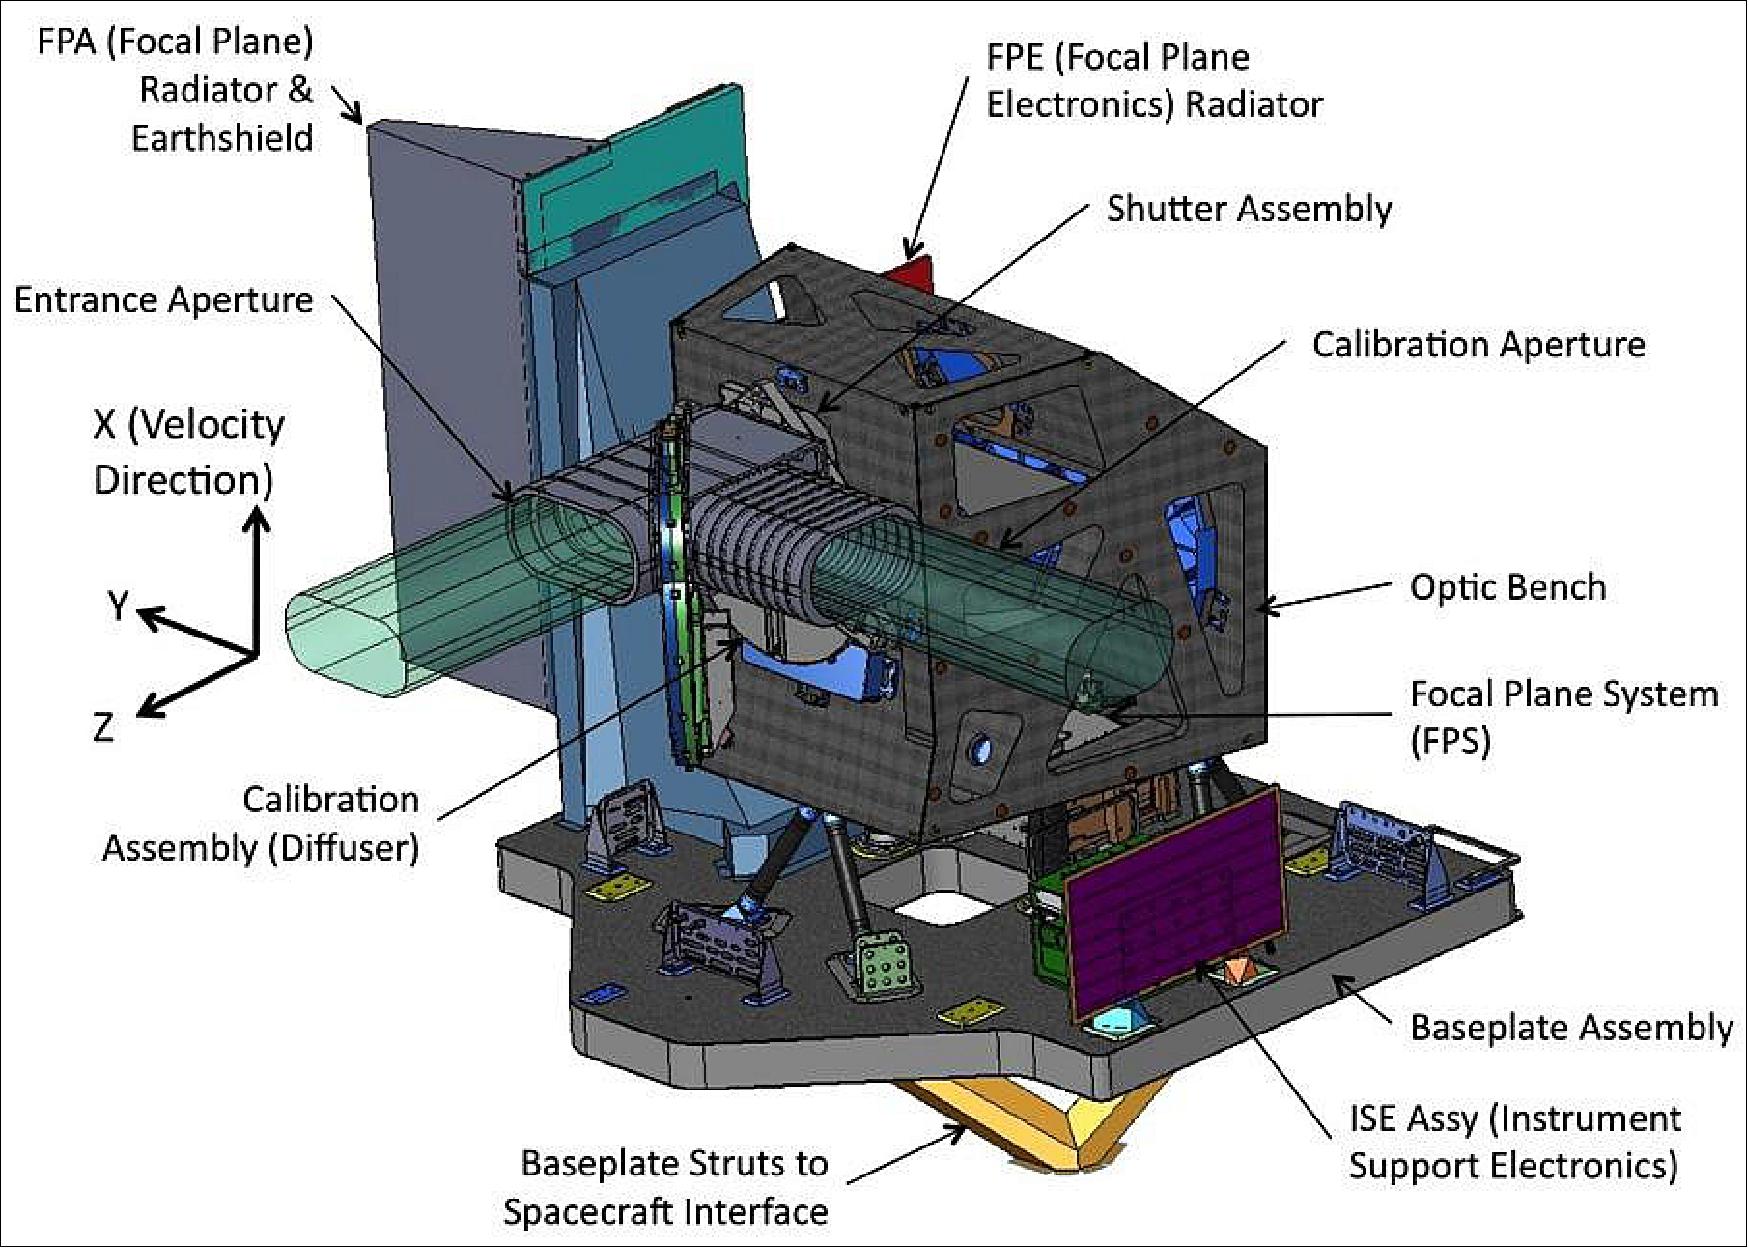
Instrument design: OLI-2 is a pushbroom sensor. Its focal plane features long arrays of photosensitive detectors. Incident radiation is focused onto the focal plane by a four-mirror anastigmatic telescope. OLI-2 has a 15º FOV covering a 185 km across-track ground swath.
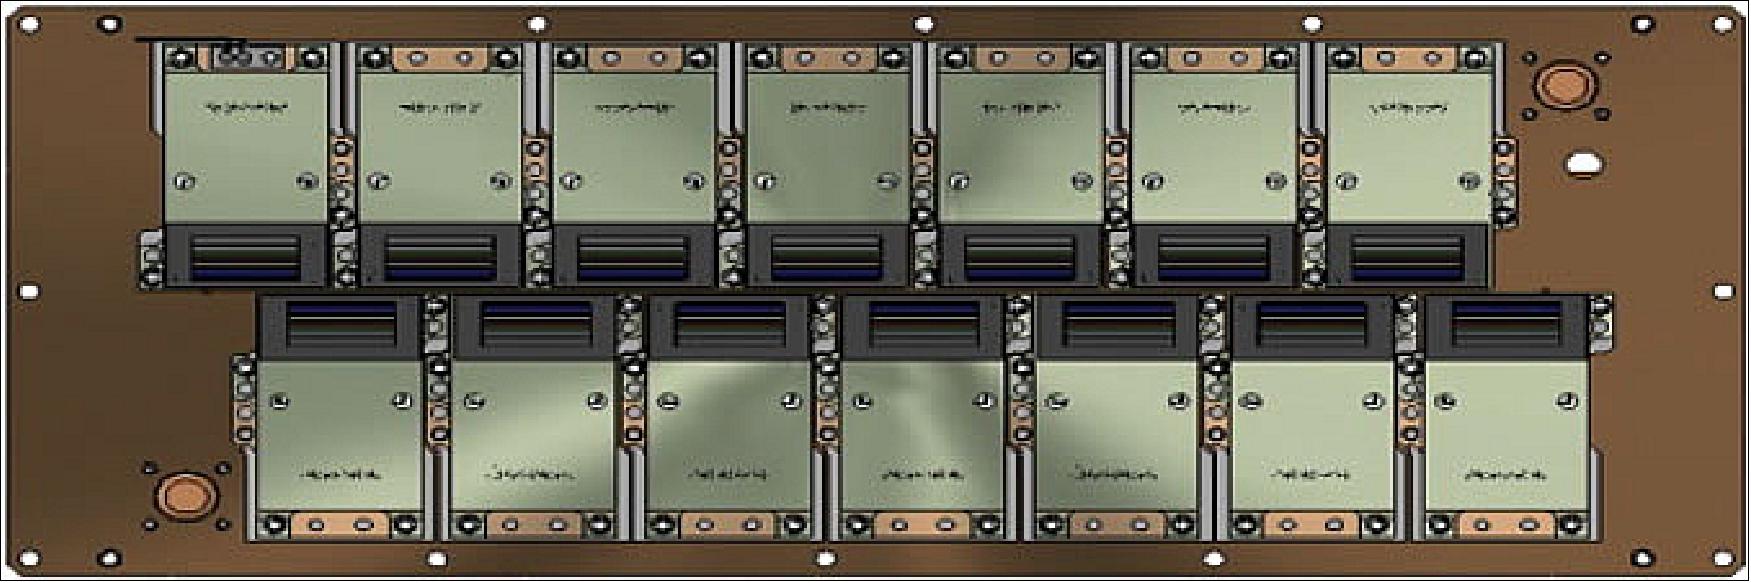
Landsat-9’s photosensitive detectors are divided into 14 modules. There are ~7000 across-track detectors for each OLI-2 spectral band, except the 15 m panchromatic band that has 13,000 detectors. Each spectral band has a specific filter; together the filters are arranged like a “butcher-block” over each module’s detector array. The visible and near-infrared detectors are made from Silicon PIN (SiPIN). The shortwave infrared detectors are made from Mercury–Cadmium–Telluride (MgCdTe).
The OLI-2 telescope views the Earth through its Earth-view baffle. There is a shutter wheel assembly between the Earth-view baffle and the aperture stop. Light enters the telescope via a hole in the shutter wheel during nominal observations. The solar-view baffle is occasionally pointed at the sun so that a diffuser panel can reflect solar illumination into the telescope for calibration purposes. Two lamp assemblies with six small lamps each inside an integrating hemisphere can illuminate the full OLI-2 focal plane through the telescope with the shutter closed as another component of the OLI-2 calibration subsystem.
TIRS-2 (Thermal Infrared Sensor-2)
TIRS-2 is a rebuild of the Landsat-8 TIRS except TIRS-2 was upgraded to Risk Class B for Landsat-9. The primary Risk Class B improvements are:
• Redundant MEBs (Main Electronics Boxes)
• Redundant CCEs (Cryocooler Electronics)
• Redundant RSEs (Switch Electronics).
Other TIRS-2 improvements:
• Improved stray light performance through improved telescope baffling
• Improved position encoder for scene select mirror to address problematic encoder on Landsa- 8 TIRS
• Improved thermal blanketing to better protect from micrometeorite impact; in accordance with new GSFC guidelines.
The TIRS-2 instrument is a two-band thermal imaging sensor with a push broom sensor (like OLI-2). Its focal plane has long arrays of photosensitive detectors.
The instrument features a four-element refractive telescope that focuses an f/1.64 beam of thermal radiation onto a focal plane that is cryogenically cooled. TIRS-2 has a 15º FOV to match the 185 km across-track swath of OLI-2. The TIRS-2 focal plane holds three modules with QWIP (Quantum Well Infrared Photodetector) arrays arranged in an alternating pattern along the focal plane centerline.
Spectral filters cover each focal plane module to create TIRS-2’s two specified bandwidths. Each QWIP array is 640 detectors long in cross-track allowing for overlap between the arrays to produce an effective linear array of 1850 pixels spanning across the 185 km ground swath.
The FOV is flipped between nadir (Earth) and both an internal blackbody and a deep space view used for on-orbit radiometric calibration using a mirror controlled by a scene select mechanism. This allows the view to be changed without changing the nominal Earth-viewing attitude of the Landsat-9 spacecraft.
A two-stage mechanical cryocooler cools TIRS-2’s focal plane. This permits the QWIP detectors to function at their required temperature of 43 K (-230° C). There are two radiators mounted to the side of the TIRS-2 instrument structure. One dissipates heat from the cryocooler and the other passively maintains a constant TIRS-2 telescope temperature of 185 K (-88° C).
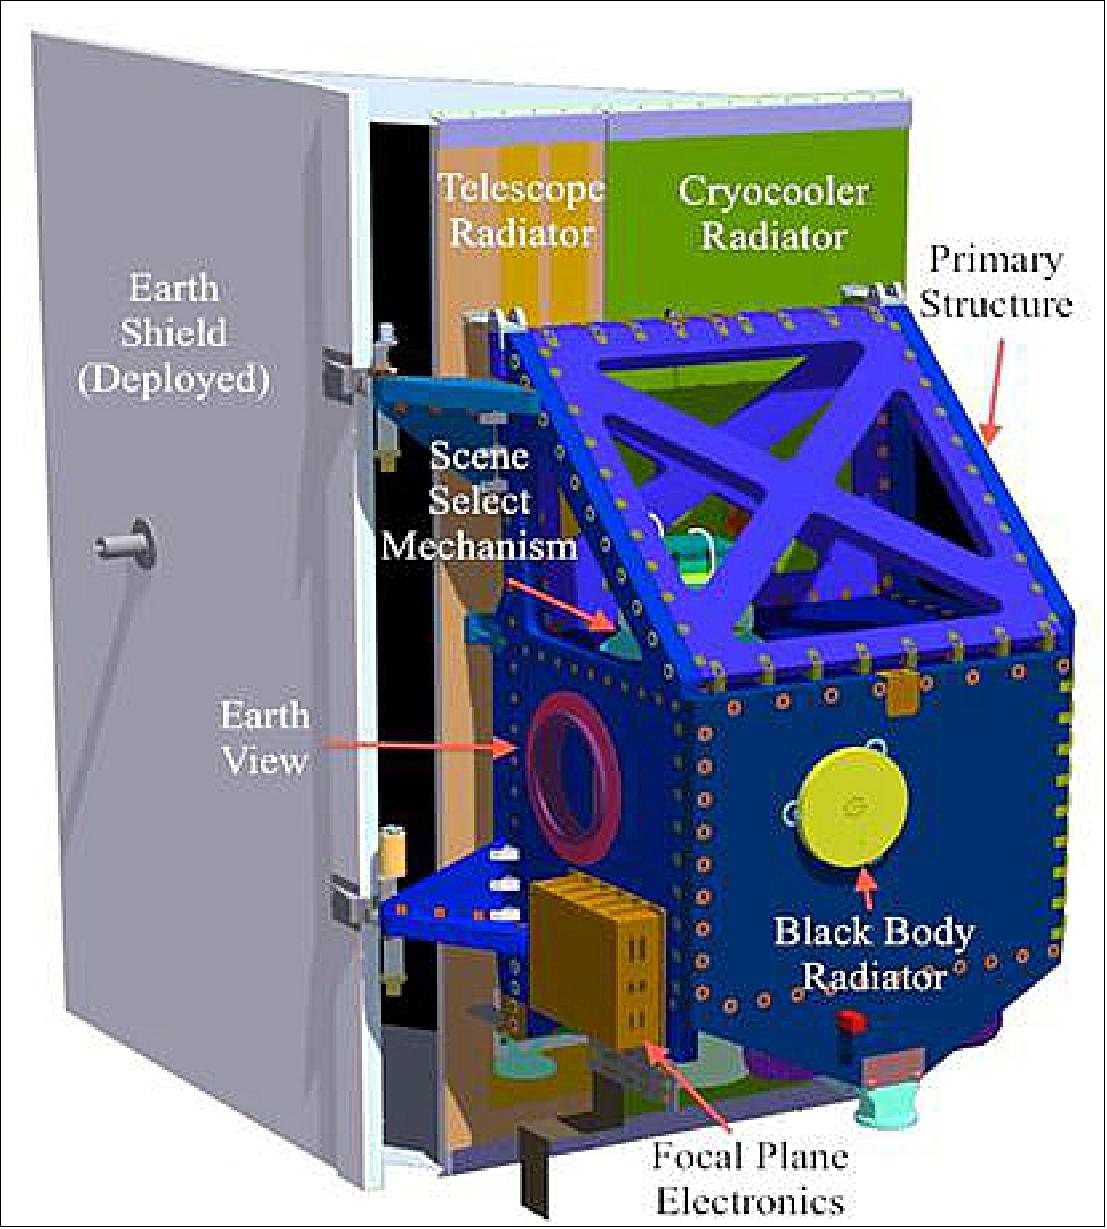
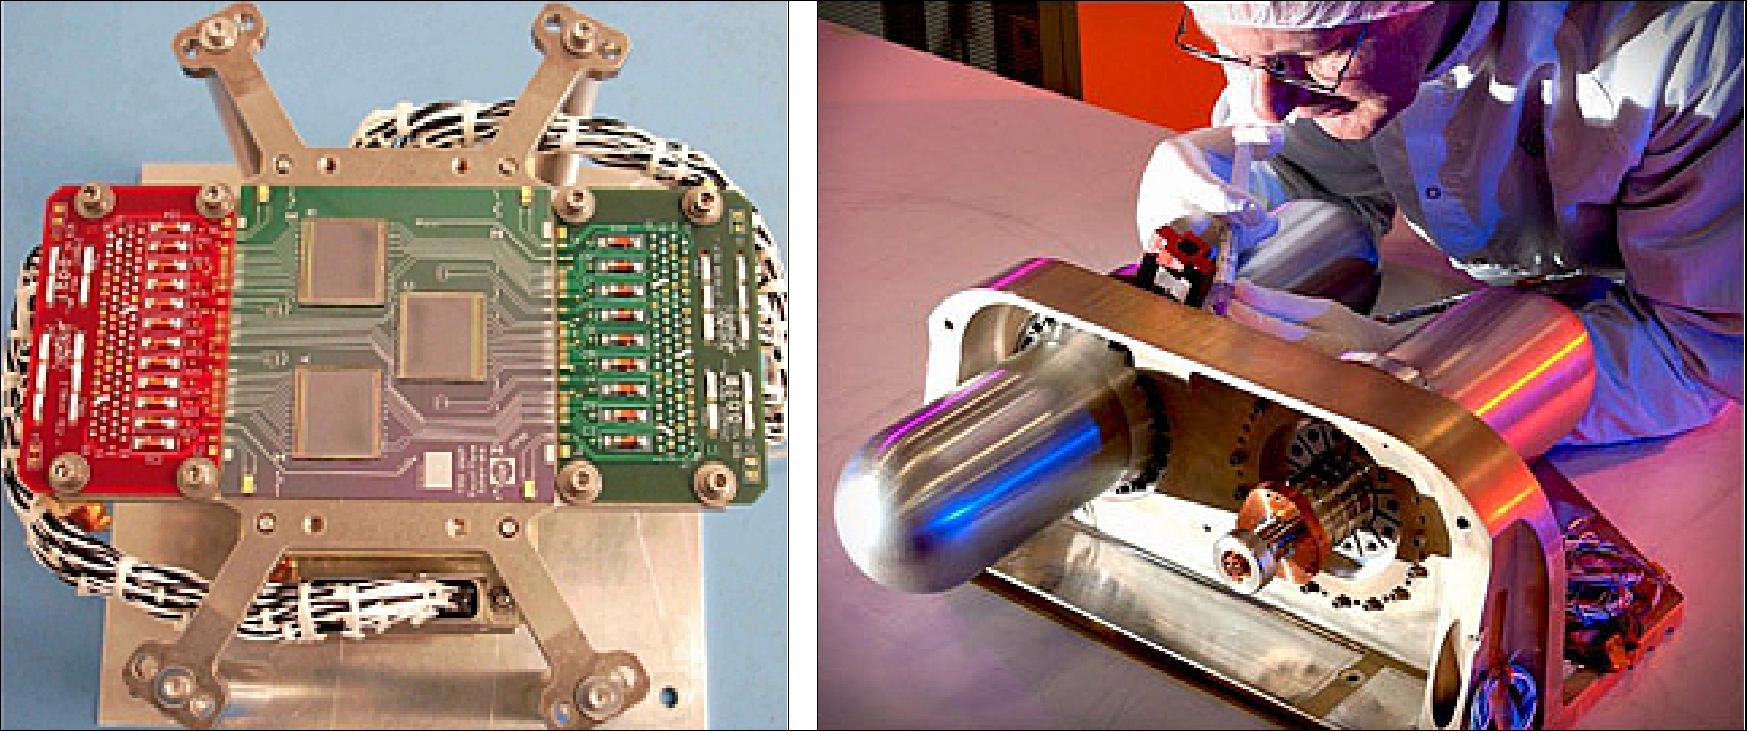
Ground Segment
On November 30 – December 1, 2016, the USGS EROS hosted the Landsat-9 GSRR (Ground System Requirements Review) in Sioux Falls, SD (South Dakota). This was the first in a series of major project reviews for Landsat-9, which was scheduled for launch in December 2020. The GSRR included presentations given to a joint NASA/USGS review panel on the proposed components of the Landsat-9 Ground System. At the conclusion of the review, the panel approved the Landsat-9 Ground System team to proceed to the PDR (Preliminary Design Review) stage. 66)
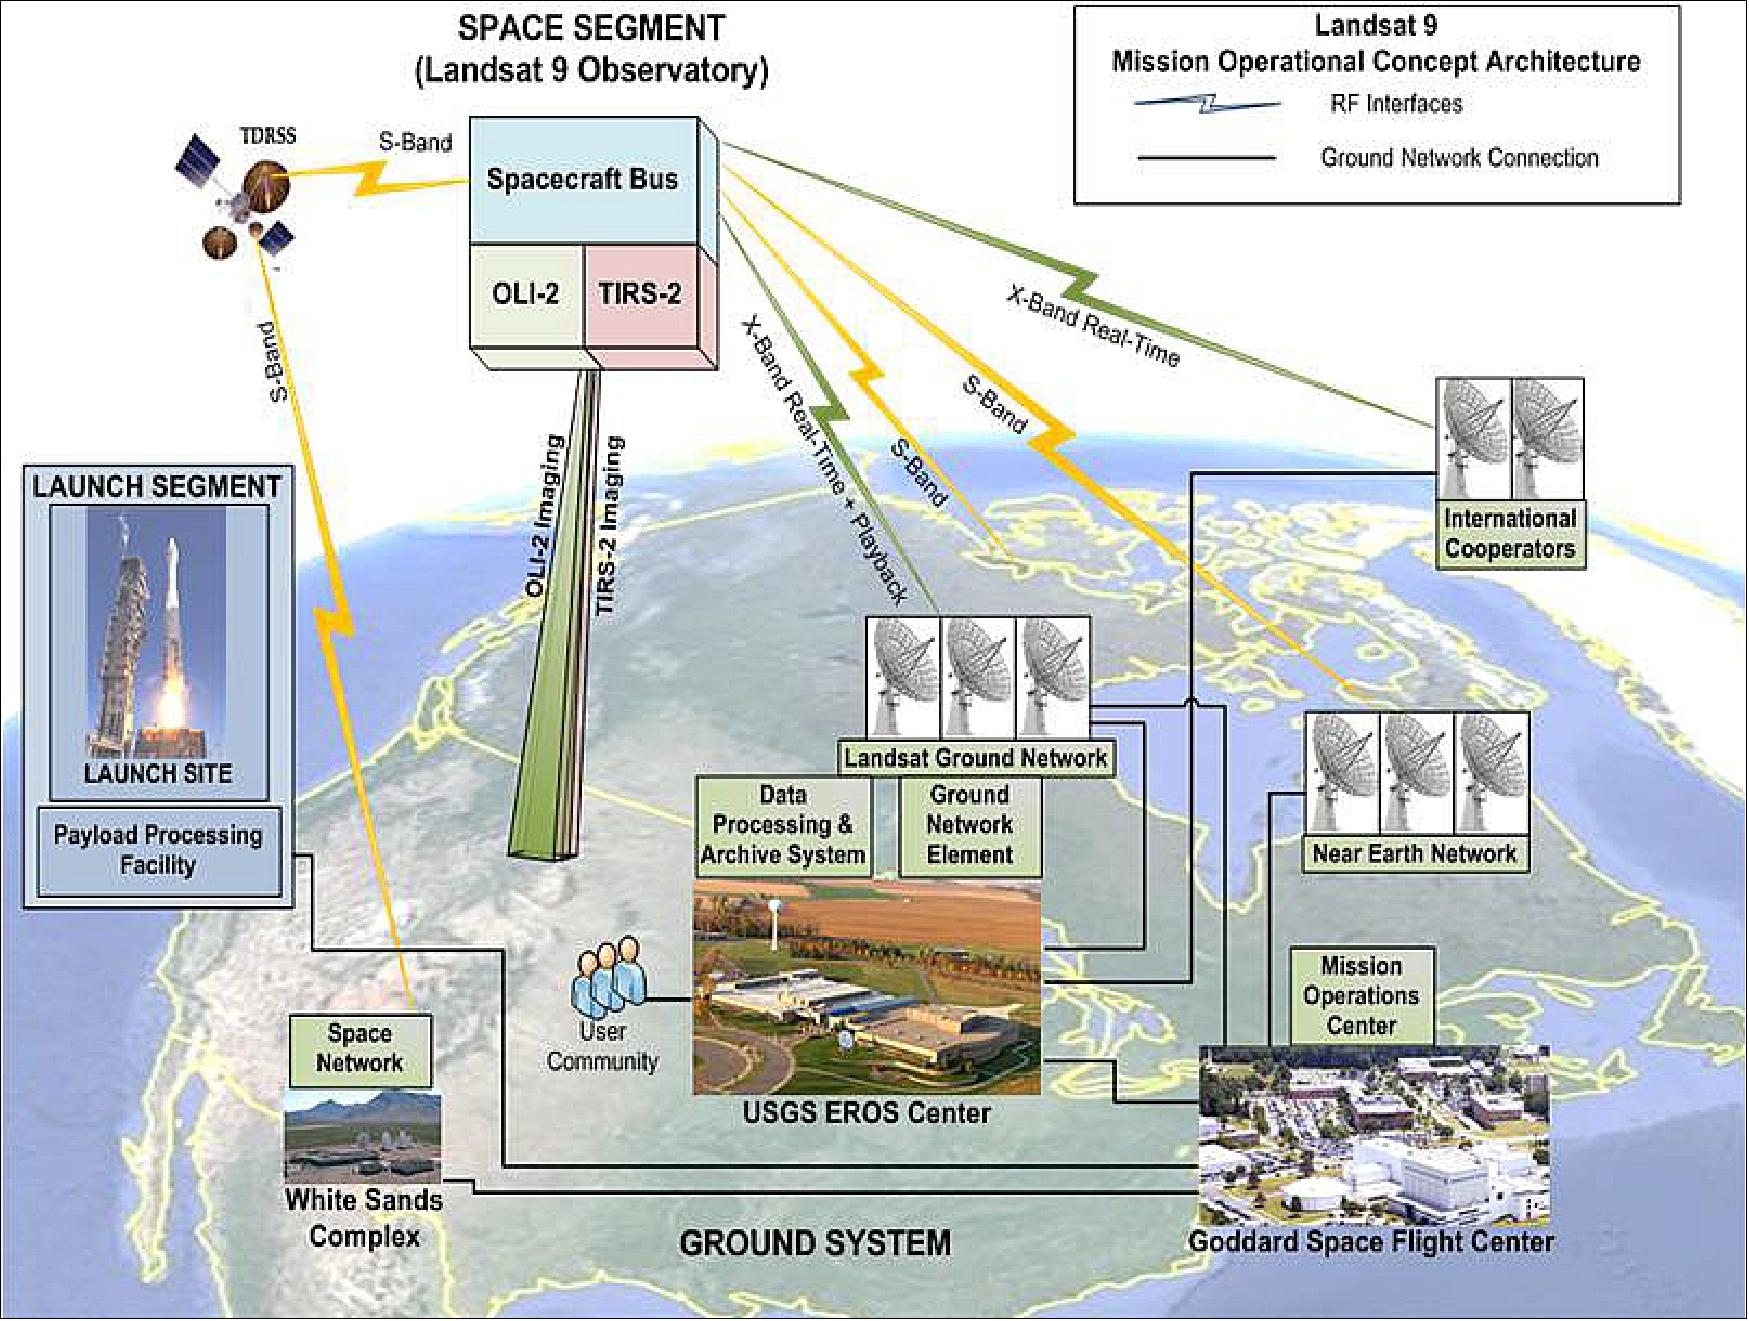
The ground segment consists of the following elements:
1) MOC (Mission Operations Center) with the following functions: Command & telemetry, Trending & analysis, Flight dynamics, Science acquisition planning, Primary and backup MOCs at GSFC.
- FOT (Flight Operations Team) performs mission planning and scheduling, command and control, health and status monitoring, orbit and attitude maintenance, mission data management.
- NASA provides MOC and BMOC facility at GSFC as well as NASA institutional services (SN, NEN, NISN, FDF) through on-orbit acceptance.
2) Operations Flight Operations Team:
- NASA leads (USGS supports) mission operations readiness activities, pre-launch, launch and early orbit activities.
- USGS leads operations following on-orbit acceptance.
3) DPAS (Data Processing and Archive System) with the following functions: Provides data ingest, product generation, & image assessment/processing, User Portal web interface for data discovery, product selection & ordering (for Cal/Val), & product distribution Storage and archive services.
- DPAS facility at USGS EROS Center.
4) GNE (Ground Network Element) with the following functions: Ground stations/antennas for X-band image & S-band telemetry data downlink; Generation of S-band command uplink.
- LGN (Landsat Ground Network) stations provide X- and S-band communications with the Observatory.
- LGN stations in Sioux Falls, SD; Fairbanks, AK; and Svalbard, Norway.
- DCRS (Data Collection and Routing Subsystem) gathers mission data from LGN stations into complete intervals to transfer to the DPAS.
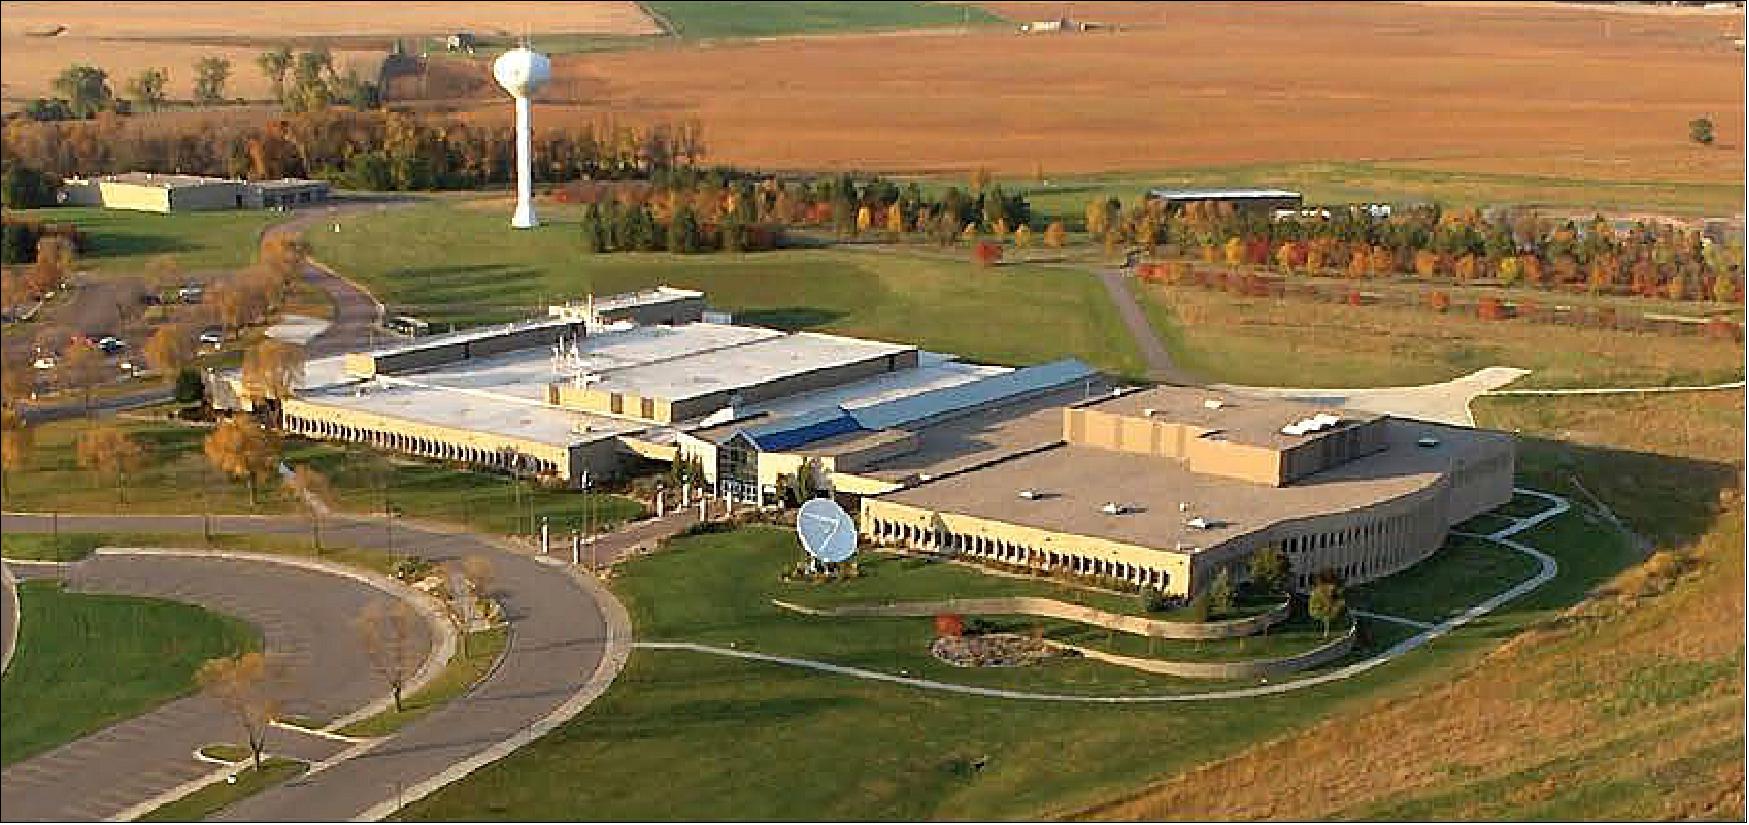
Development status of Landsat-9 Ground Segment
• February 19, 2019: The Landsat-9 Ground System development team members executed the first of a series of GRTs (Ground Readiness Tests) this week as they successfully simulated the communication of command and telemetry data between the GNE (Ground Network Element) at EROS and the LMOC (Landsat Multi-Satellite Operations Center) at the Goddard Space Flight Center. 67)
- In what was called GRT One, ground system engineers and operations team members used simulators to test the ability of the LMOC system and GNE system to talk with each other, communicating both simulated commands for actions by the spacecraft, but also retrieving and sharing with each other simulated telemetry data related to the health and safety of the satellite.
- The GNE is the element of the ground system that includes the hardware, software, and networks necessary to receive data from the spacecraft. It relies on a variety of ground stations around the globe to assist with those communications, though this week’s test focused only on the station at EROS and the LMOC.
- The LMOC is an element of the ground system as well. It receives and monitors spacecraft telemetry, ensures its health and safety, and sends commands to the satellite. While the LMOC utilized some of the Landsat-8 software subsystems, the LMOC is new, and this initial test was a significant accomplishment for the incremental delivery of the Landsat-9 ground system.
- That the exercise was a success didn’t surprise Brian Sauer, the USGS EROS Landsat-9 Project Manager. A significant amount of effort and preparation went into the test. The two elements conducted lower-level tests to verify their associated requirements. Following element tests, the system was installed into the operations environment, and L-9 Ground System staff conducted a series of Interface Connectivity Tests to ensure the systems could communicate with each other, commands could be sent, and data were able to flow. That was followed by several dry runs in January, and a Test Readiness Review conducted Feb. 8, Sauer said.
- “We know what requirements are supposed to be verified from the tests, and we completed dry runs for the tests. So, if the run for the record (for the GRT) would not have been a success, that would have been a surprise,” he said.
- The test wasn’t only about verification; it was also an early training opportunity for staff members who operate the system. The test was conducted by ground system Integration and Test (I&T) engineers and executed by the staff who operate the system when interfacing with the satellite. In fact, to the extent possible, it follows the “test as you fly” principle—operators run the system as they would when the spacecraft is in flight.
- GRT One also included Quality Assurance monitors who ensured that processes and procedures were correctly followed for the test, and that documentation was appropriate for those processes and procedures.
- Sauer said GRT One only covered initial commanding and did not include the full command suite. The additional tests took place during more recent GRTs, the next which was in August. GRTs were expected to be ongoing for the next 14 months, he said. “The success of this GRT truly is a credit to the all of the people on the Landsat-9 Ground System team,” Sauer said. “Contractors, government, everyone... it really is a team effort.”
References
1) ”Landsat-9 — continuing the legacy - 2020 and beyond,” NASA, URL: https://landsat.gsfc.nasa.gov/landsat-9/
2) Michael A. Wulder, Thomas R. Loveland, David P. Roy, Christopher J. Crawford, Jeffrey G. Masek, Curtis E. Woodcock, Richard G. Allen, Martha C. Anderson, Alan S. Belward, Warren B. Cohen, John Dwyer, Angela Erb, Feng Gao, Patrick Griffiths, Dennis Helder, Txomin Hermosilla, James D. Hipple, Patrick Hostert, M. Joseph Hughes, Justin Huntington, David M. Johnson, Robert Kennedy, Ayse Kilic, Zhan Li, Leo Lymburner, Joel McCorkel, Nima Pahlevan, Theodore A. Scambos, Crystal Schaaf, John R. Schott, Yongwei Sheng, James Storey, Eric Vermote, James Vogelmann, Joanne C. White, Randolph H. Wynne, Zhe Zhu,”Current status of Landsat program, science, and applications,” Remote Sensing of Environment, Volume 225, Pages 127-147, https://doi.org/10.1016/j.rse.2019.02.015, Published online: 11 May 2019, URL: https://reader.elsevier.com/reader/sd/pii/S0034425719300707?token=2AB2E55962A885E82FCCB2911018ED4B4F1CEACC6513B5A42B6CFEE6EECA001A7E87D7DC530D3B6BD68369A917E4459A
3) Brian L. Markham, Del Jenstrom, Jeffrey G. Masek, Phil Dabney, Jeffrey A. Pedelty, Julia A. Barsi, Matthew Montanaro, ”Landsat 9: Status and Plans,” white paper, 2016, URL: https://landsat.gsfc.nasa.gov/landsat-9/landsat-9-overview/
4) Steve Cole, “NASA, USGS Begin Work on Landsat 9 to Continue Land Imaging Legacy,” NASA, Release 15-061, April 16, 2015, URL: http://www.nasa.gov/press/2015/april/nasa-usgs-begin-work-on-landsat-9-to-continue-land-imaging-legacy/
5) Michael H. Freilich, ”NASA Earth Science Division: Status, Plans, Accomplishments,” NASA, 27 July 2015, URL: http://science.nasa.gov/media/medialibrary/2015/08/11/FREILICH_July_SC_ESD.pdf
6) As of June 6, 2018, Northrop Grumman Innovation Systems (NGIS) has closed the acquisition of Orbital ATK Inc.
7) ”NASA green lights key phase for Landsat-9’s development,” NASA Spaceflight.com, Oct. 25, 2016, URL: https://www.nasaspaceflight.com/2016/10/nasa-green-light-landsat-9s-development/
8) ”Orbital ATK Continues Landsat Legacy with Contract for Landsat 9,” Orbital ATK, URL: https://www.orbitalatk.com/news-room/feature-stories/Landsat9/default.aspx?prid=180
9) Stephen Clark, ”Landsat 9 lifted atop launcher to extend unbroken environmental data record,” Spaceflight Now, 21 September 2021, URL: https://spaceflightnow.com/2021/09/21/next-landsat-lifted-atop-launcher-to-extend-essential-environmental-data-record/
10) Jeff Foust, ”Liquid nitrogen shortage delays Landsat 9 launch,” SpaceNews, 31 August 2021, URL: https://spacenews.com/liquid-nitrogen-shortage-delays-landsat-9-launch/
11) Tylar Greene, Jake Richmond, ”NASA Unveils New Interactive Website Ahead of Landsat 9 Launch,” NASA Press Release 21-110, 16 August 2021, URL: https://www.nasa.gov/press-release/nasa-unveils-new-interactive-website-ahead-of-landsat-9-launch
12) Brian L. Markham, Cody H. Anderson, Michael J. Choate, Christopher J. Crawford, Del T. Jenstrom, Jeffrey A. Masek, Jeffrey A. Pedelty, Brian K. Sauer, and Kurtis J. Thome "Landsat 9: ready for launch", Proceedings of SPIE, Volume 11829, Earth Observing Systems XXVI, 118290J (1 August 2021), SPIE Optical Engineering +Applications, San Diego, CA, USA; https://doi.org/10.1117/12.2595885
13) ”Landsat 9 Continuing the Legacy - 2021 and beyond,” NASA Landsat Science, 14 August 2020, URL: https://landsat.gsfc.nasa.gov/landsat-9/
14) Jeffrey G. Masek, Michael A. Wulder, Brian Markham, Joel McCorkel, Christopher J. Crawford, James Storey, Del T. Jenstrom, ”Landsat 9: Empowering open science and applications through continuity,” ScienceDirect, Remote Sensing of Environment, Volume 248, October 2020, 111968, https://doi.org/10.1016/j.rse.2020.111968
15) ”Landsat 9 Ground System and Mission Operation Plans Well on Track for Launch,” NASA, 3 April 2020, URL: https://landsat.gsfc.nasa.gov/landsat-9-ground-system-and-mission-operation-plans-well-on-track-for-launch/
16) ”Remote Presentations No Problem for Successful Landsat 9 Mission Operations Review,” USGS, 9 April 2020, URL: https://tinyurl.com/y2bvcsk8
17) Sara Blumberg, ”Landsat 9: The Pieces Come Together,” NASA, 9 January 2020, URL: https://www.nasa.gov/feature/goddard/2020/landsat-9-the-pieces-come-together
18) Kate Ramsayer, Sara Blumberg, ”Landsat 9 Instrument Ready for Spacecraft Assembly,” NASA Feature, 27 September 2019, URL: https://www.nasa.gov/feature/goddard/2019/landsat-9-instrument-ready-for-spacecraft-assembly
19) Kate Ramsayer, Sara Blumberg, ”New Landsat Infrared Instrument Ships from NASA,” NASA, 23 August 2019, URL: https://www.nasa.gov/feature/goddard/2019/new-landsat-infrared-instrument-ships-from-nasa
20) ”Northrop Grumman Completes Orbital ATK Acquisition, Blake Larson Elected to Lead New Innovation Systems Sector,” Northrop Grumman News, 6 June 2018, URL: https://news.northropgrumman.com/news/releases/northrop-grumman-completes-orbital-atk-acquisition-blake-larson-elected-to-lead-new-innovation-systems-sector
21) ”In Focus: A Peek at Landsat 9’s OLI-2 Instrument During Focal Plane Integration,” NASA/GSFC, 23 May 2018, URL: https://web.archive.org/web/20201022205055/https://landsat.gsfc.nasa.gov/in-focus-a-peak-at-landsat-9s-oli-2-instrument-during-focal-plane-integration/
22) ”Successful Landsat 9 Mission Review,” 25 April 2018, URL: [web source no longer available]
23) ”Successful Landsat 9 Ground System Review Held,” NASA, 10 April 2018, URL: https://web.archive.org/web/20200927144526/https://landsat.gsfc.nasa.gov/successful-landsat-9-ground-system-review-held/
24) ”Landsat 9 Spacecraft Passes Latest Critical Design Review,” NASA, 15 March 2018, URL: [web source no longer available]
25) ”Ball Aerospace Delivers Flight Cryocooler Early for NASA's Landsat Mission,” Ball News Releases, 14 Feb. 2018, URL: http://ball.mediaroom.com/2018-02-14-Ball-Aerospace-Delivers-Flight-Cryocooler-Early-for-NASAs-Landsat-Mission?asPDF=1
26) ”New USGS-NASA Landsat Science Team Named...,” Satnews Daily, 19 Dec. 2017, URL: http://www.satnews.com/story.php?number=2057067562#
27) ”Next Landsat Science Team Will Pivot to Future of Landsat Program,” USGS, 15 Dec. 2017, URL: https://eros.usgs.gov/headlines/next-landsat-science-team-will-pivot-future-landsat-program
28) ”Landsat 9 Passes Key Decision Point C, Moves on to Implementation Phase,” NASA Landsat Science, 7 Dec. 2017, URL: https://landsat.gsfc.nasa.gov/landsat-9-passes-key-decision-point-c-moves-on-to-implementation-phase/
29) ”Landsat 9 Fact Sheet,” USGS, May 2019, URL: https://pubs.usgs.gov/fs/2019/3008/fs20193008.pdf
30) ”Landsat 9 Mission Details,” NASA, 2017, URL: https://landsat.gsfc.nasa.gov/landsat-9/landsat-9-mission-details/
31) ”Contract Awarded to Landsat 8/9 Team Member, a.i. solutions,” Satnews Daily, Sept. 24, 2017, URL: http://www.satnews.com/story.php?number=1138151745
32) ”Landsat 9 Preliminary Design Review Successfully Completed,” Landsat Science, Sept. 18, 2017, URL: https://landsat.gsfc.nasa.gov/landsat-9-preliminary-design-review-successfully-completed/
33) ”Landsat 9 Spacecraft Development on Schedule,” Landsat Science, August 10, 2017, URL: https://landsat.gsfc.nasa.gov/landsat-9-spacecraft-development-on-schedule/
34) ”Landsat 9 Thermal Instrument Passes Critical Design Review,” NASA, Feb. 28, 2017, URL: https://landsat.gsfc.nasa.gov/landsat-9-thermal-instrument-passes-milestone/
35) ”Landsat 9 Spacecraft Systems Review,” NASA, Feb. 27, 2017, URL: https://landsat.gsfc.nasa.gov/landsat-9-spacecraft-systems-review/
36) ”December 2, 2016 - Landsat 9 Ground System Review,” USGS, Dec. 2, 2016, URL: https://landsat.usgs.gov/december-2-2016-landsat-9-ground-system-review
37) Steve Cole, Cynthia M. O’Carroll,”NASA Awards Contract for Sustainable Land Imaging Spacecraft,” NASA, Oct. 25, 2016, URL: http://landsat.gsfc.nasa.gov/?p=13305
38) Cynthia M. O'Carroll, ”Thermal Infrared Sensor-2 Instrument Cryocooler Contract Awarded for Landsat 9,” NASA, May 17, 2016, URL: http://landsat.gsfc.nasa.gov/?p=12464
39) ”NASA Launches New Mission to Monitor Earth’s Landscapes,” NASA Press Release 21-126, 27 September 2021, URL: https://www.nasa.gov/press-release/nasa-launches-new-mission-to-monitor-earth-s-landscapes
40) ”Landsat 9: Payloads stacked atop Atlas V for launch,” ULA, 16 September 2021, URL: https://blog.ulalaunch.com/blog/landsat-9-payloads-stacked-atop-atlas-v-for-launch
41) ”Landsat 9 Atlas V,” 23 September 2021, URL: https://www.ulalaunch.com/missions/next-launch/atlas-v-landsat-9
42) ”Fires Near Yosemite,” NASA Earth Observatory, Image of the Day for 26 July 2022, URL: https://earthobservatory.nasa.gov/images/150128/fires-near-yosemite
43) ”Ice Springs Lava Flow,” NASA Earth Observatory, Image of the Day for 18 July 2022, URL: https://earthobservatory.nasa.gov/images/150087/ice-springs-lava-flow
44) ”Lena River Sedimentation,” NASA Earth Observatory, Image of the Day for 13 July 2022, URL: https://earthobservatory.nasa.gov/images/150076/lena-river-sedimentation
45) ”Almería’s Sea of Greenhouses,” NASA Earth Observatory, Image of the Day for11 July 2022, URL: https://earthobservatory.nasa.gov/images/150070/almerias-sea-of-greenhouses
46) ”Landsat Looks at the Moon,” NASA Earth Observatory, Image of the Day for 5 July 2022, URL: https://earthobservatory.nasa.gov/images/150043/landsat-looks-at-the-moon
47) ”Europa Island,” NASA Earth Observatory, Image of the Day for 26 June 2022, URL: https://earthobservatory.nasa.gov/images/150021/europa-island
48) ”Living with Floods in the Innoko Lowlands,” NASA Earth Observatory, Image of the Day for 20 June 2022, URL: https://earthobservatory.nasa.gov/images/149996/living-with-floods-in-the-innoko-lowlands
49) ”Young, Active Bagana Volcano,” NASA Earth Observatory, Image of the Day for 2 June 2022, URL: https://earthobservatory.nasa.gov/images/149899/young-active-bagana-volcano
50) Brendan T. McCormick Kilbride, Kila Mulina, Geoffrey Wadge, R. Wally Johnson, Ima Itikarai and Marie Edmonds, ”Multi-year Satellite Observations of Sulfur Dioxide Gas Emissions and Lava Extrusion at Bagana Volcano, Papua New Guinea,” Frontiers in Earth Science, 26 February 2019, https://doi.org/10.3389/feart.2019.00009
51) ”Cabo de Gata-Níjar Natural Park,” NASA Earth Observatory, Image of the Day for 21 May 2022, URL: https://earthobservatory.nasa.gov/images/149857/cabo-de-gata-nijar-natural-park
52) ”Traces of an Ancient Watery World in Capitol Reef,” NASA Earth Observatory, Image of the Day for 20 May 2022, URL: https://earthobservatory.nasa.gov/images/149850/traces-of-an-ancient-watery-world-in-capitol-reef
53) ”Submarine Eruption of Kavachi Volcano,” NASA Earth Observatory, Image of the Day for 17 May 2022, URL: https://earthobservatory.nasa.gov/images/149834/submarine-eruption-of-kavachi-volcano
54) ”Kīlauea’s Lava Lake Persists,” NASA Earth Observatory, Image of the Day for 11 May 2022, URL: https://earthobservatory.nasa.gov/images/149815/kilaueas-lava-lake-persists
55) ”Dungeness Spit,” NASA Earth Observatory, Image of the Day for 13 April 2022, URL: https://earthobservatory.nasa.gov/images/149674/dungeness-spit
56) ”Flooding in Eastern Australia,” NASA Earth Observatory, Image of the Day for 11 April 2022, URL: https://earthobservatory.nasa.gov/images/149685/flooding-in-eastern-australia
57) ”Divine Providencia,” NASA Earth Observatory, Image of the Day for 27 March 2022, URL: https://earthobservatory.nasa.gov/images/149637/divine-providencia
58) ”West Lothian Shale Bings,” NASA Earth Observatory, Image of the Day for 21 March 2022, URL: https://earthobservatory.nasa.gov/images/149602/west-lothian-shale-bings
59) ”Winter in the Appalachians,” NASA Earth Observatory, Image of the Day for 25 February 2022, URL:https://earthobservatory.nasa.gov/images/149508/winter-in-the-appalachians
60) ”Earth from Space: Washington, US,” ESA Applications, 25 February 2022, URL: https://www.esa.int/Applications/Observing_the_Earth/Earth_from_Space_Washington_US
61) ”Fog Down in the Valley, NASA Earth Observatory, Image of the Day for 20 February 2022, URL: https://earthobservatory.nasa.gov/images/149482/fog-down-in-the-valley
62) ”Wildfires Ravage Corrientes, Argentina,” NASA Earth Observatory, Image of the Day for 18 February 2022, URL: https://earthobservatory.nasa.gov/images/149478/wildfires-ravage-corrientes-argentina
63) ”A Super View of LA,” NASA Earth Observatory, 12 February 2022, URL: https://earthobservatory.nasa.gov/images/149458/a-super-view-of-la
64) ”NASA, USGS Release First Landsat- 9 Images,” NASA Press Release, 5 November 2021, URL: https://www.nasa.gov/press-release/nasa-usgs-release-first-landsat-9-images
65) ”Landsat 9 Spectral Bands,” NASA, URL: https://landsat.gsfc.nasa.gov/landsat-9/landsat-9-spectral-bands/
66) ”Landsat-9 Instruments,” NASA, URL: https://landsat.gsfc.nasa.gov/landsat-9/instruments/#oli
67) ”Landsat 9 Ground System Review,” USGS, Dec. 2. 2016, URL: https://landsat.usgs.gov/december-2-2016-landsat-9-ground-system-review
68) ”First in a Series of Landsat 9 Ground Readiness Tests is Successful,” USGS, 15 February 2019, URL: https://www.usgs.gov/center-news/first-a-series-landsat-9-ground-readiness-tests-successful?qt-news_science_products=1#qt-news_science_products
The information compiled and edited in this article was provided by Herbert J. Kramer from his documentation of: ”Observation of the Earth and Its Environment: Survey of Missions and Sensors” (Springer Verlag) as well as many other sources after the publication of the 4th edition in 2002. - Comments and corrections to this article are always welcome for further updates (eoportal@symbios.space).