PACE (Plankton, Aerosol, Cloud, ocean Ecosystem) Mission
EO
OCI
Ocean colour instruments
Multiple direction/polarisation radiometers
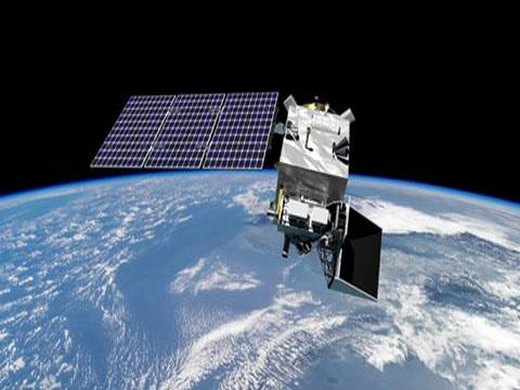
PACE (Plankton, Aerosol, Cloud, Ocean Ecosystem) is a NASA mission launched on 8 February, 2024. PACE aims to take measurements providing data records on ocean ecology and global biogeochemistry. This information can be used to benefit any economic or societal sector that relies on water quality, fisheries and food security.
Quick facts
Overview
| Mission type | EO |
| Agency | NASA, SRON, NSO |
| Mission status | Operational (nominal) |
| Launch date | 8 February 2024 |
| Measurement domain | Atmosphere, Ocean, Land |
| Measurement category | Cloud type, amount and cloud top temperature, Cloud particle properties and profile, Ocean colour/biology, Aerosols, Multi-purpose imagery (ocean), Radiation budget, Vegetation, Albedo and reflectance |
| Measurement detailed | Cloud top height, Ocean imagery and water leaving spectral radiance, Aerosol absorption optical depth (column/profile), Ocean chlorophyll concentration, Cloud cover, Aerosol optical depth (column/profile), Color dissolved organic matter (CDOM), Cloud ice (column/profile), Cloud imagery, Aerosol Extinction / Backscatter (column/profile), Cloud liquid water (column/profile), Aerosol effective radius (column/profile), Earth surface albedo, Ocean suspended sediment concentration, Normalized Differential Vegetation Index (NDVI), Diffuse attenuation coefficient (DAC), Aerosol Single Scattering Albedo, Aerosol Layer Height |
| Instruments | OCI, SPEXone, HARP2 |
| Instrument type | Ocean colour instruments, Multiple direction/polarisation radiometers |
| CEOS EO Handbook | See PACE (Plankton, Aerosol, Cloud, ocean Ecosystem) Mission summary |
Summary
Mission Capabilities
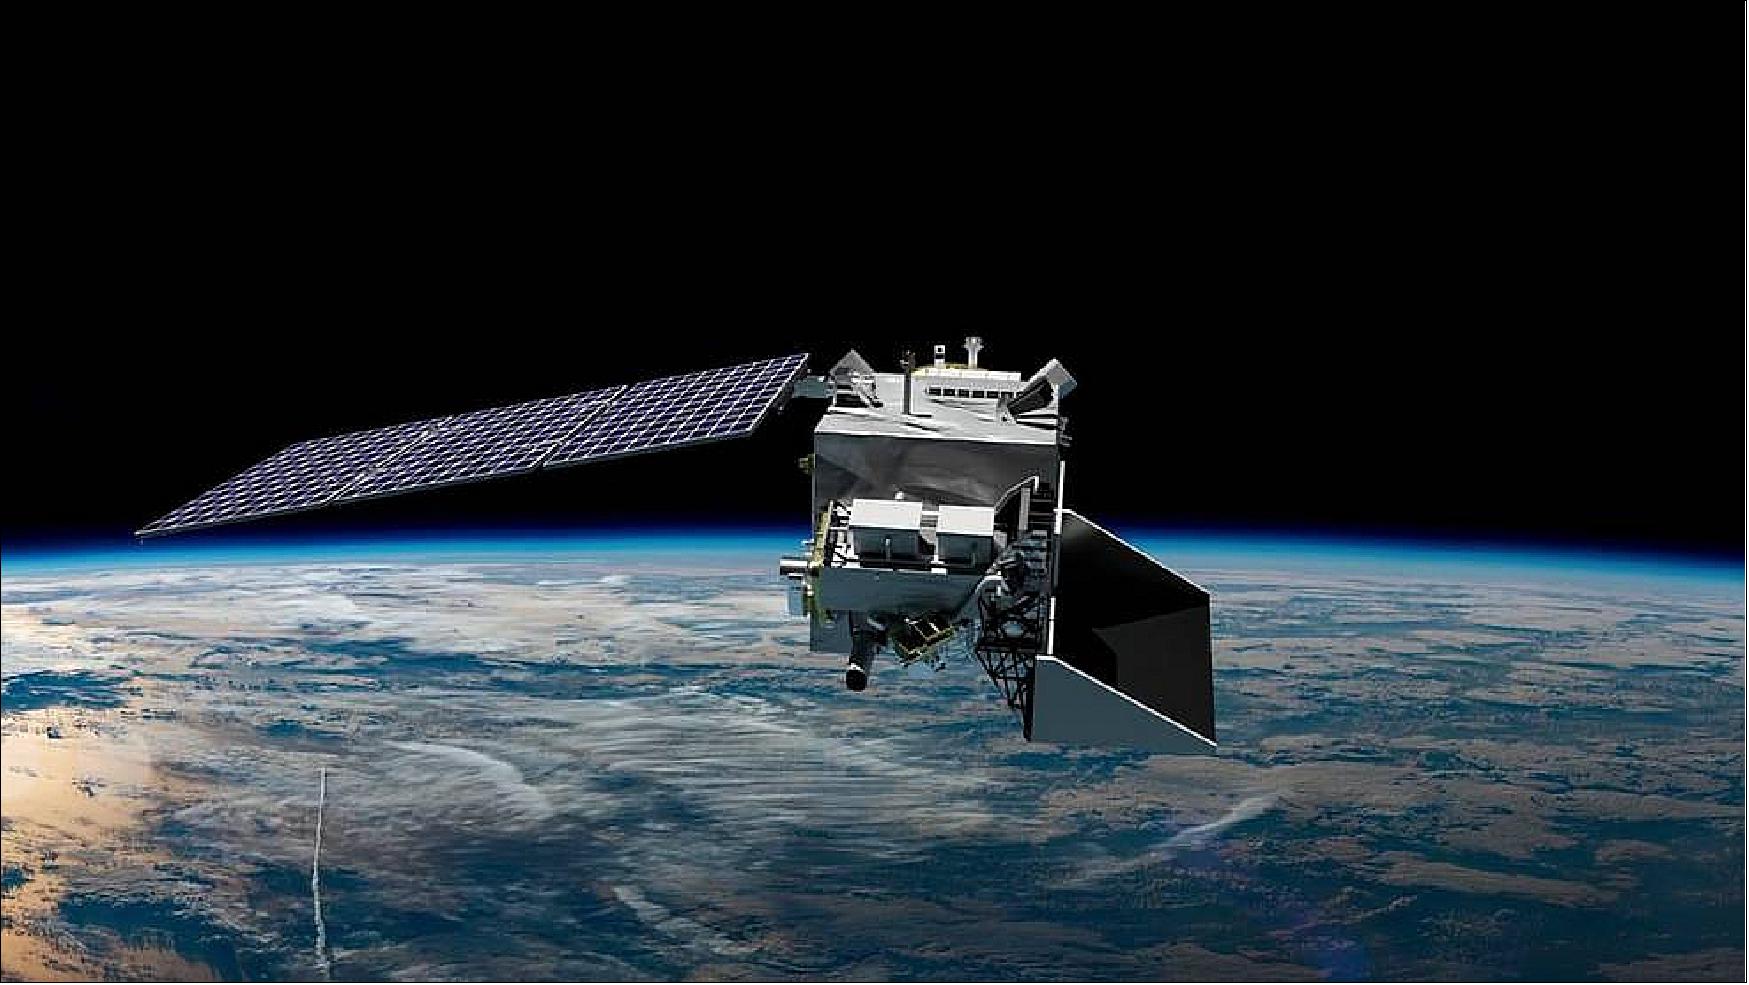
The primary instrument for PACE is OCI (Ocean Colour Instrument). It is an ocean colour imaging spectrometer, capable of measuring ultraviolet to infrared ocean colour. This measurement can be used to estimate the wavelength of the light reflected by the ocean, revealing information on oceanic biological components. The other sensors set to be employed on PACE are HARP-2 (Hyper-Angular Rainbow Polarimeter-2) and SPEXone (Spectro-Polarimeter for Planetary Exploration).
HARP-2, a polarimeter, will provide measurements for cloud and aerosol optical properties. This data can provide insight into cloud and aerosol energetics. SPEXone is a concept instrument for measuring aerosol characteristics. This multi-angle spectro-polarimeter will measure detailed physical properties of atmospheric aerosol, which will aid in assessing their impact on climate.
Performance Specifications
PACE will orbit at an altitude of 677 km and an inclination of 98° in a sun-synchronous orbit. OCI will have a maximum 2500 kilometre swath width, a resolution of 1 km and a 5 nm spectral resolution. It will be capable of wavelength measurements from ultraviolet (340 nm) to near-infrared (890 nm).
HARP-2 will boast an angular swath width of 47°, a resolution of 3 km and measurements in wavebands ranging from 440 nm to 970 nm.
SPEXone’s swath width is 100 km, with a resolution of 2.5 km and measurements taken in the wavelength regime 385 nm - 770 nm in steps of 2 nm. It aims to possess a polarimetric accuracy of 0.3% and a radiometric accuracy of 2%.
Space and Hardware Components
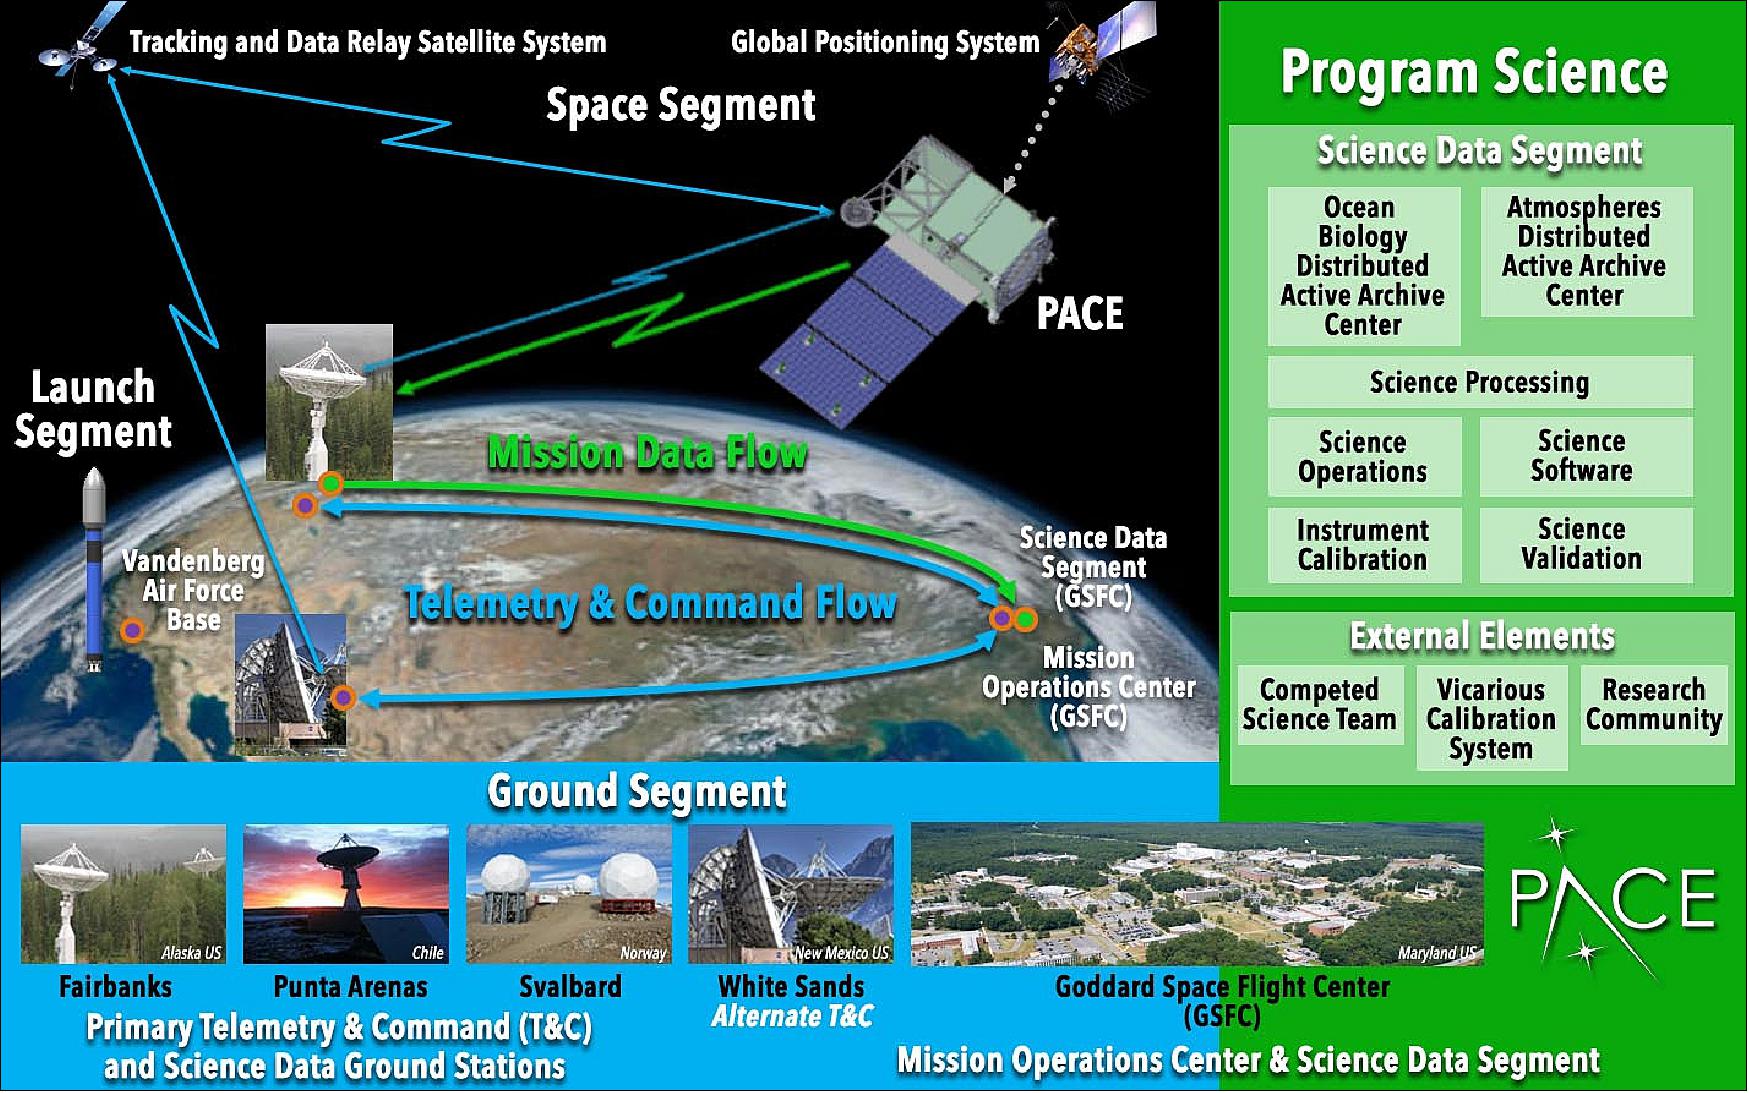
NASA’s Goddard Space Flight Centre is the design and manufacturing location for the main instrument and bus. For the spacecraft, the mass objective is not to exceed 1700 kilograms with fuel. Its size is 1.5 m x 1.5m x 3.2 m and it will be powered with 1 kW. A dual communication band will be deployed, with the S-band utilised for command and telemetry and Ka-band transmitting the science data.
PACE (Plankton, Aerosol,Cloud, ocean Ecosystem) Mission
Spacecraft Launch Mission Status Sensor Complement References
PACE is a NASA mission in the definition phase in 2013 by the SDT (Science Definition Team). In 2010 NASA HQ decided to implement PACE due to the outstanding issues for continuity of MODIS products for ocean color, aerosol, cloud from Suomi-NPP and JPSS VIIRS. In 2015, NASA approved the PACE mission to enter Pre-Phase A—mission preformulation and conceptual studies. 1)
PACE is a strategic climate continuity mission that makes global ocean color measurements to provide extended data records on ocean ecology and global biogeochemistry (e.g., carbon cycle) along with polarimetry measurements to provide extended data records on clouds and aerosols. Understanding of impacts and feedbacks of the Earth system to climate are of critical importance. 2) 3) 4)
Goddard built PACE’s OCI (Ocean Color Instrument). This PACE sensor allows scientists to see the colors of the ocean, from the ultraviolet to near infrared, and obtain more accurate measurements of biological and chemical ocean properties, such as phytoplankton biomass and the composition of phytoplankton communities. These changes in the ocean’s color help identify harmful algal blooms.
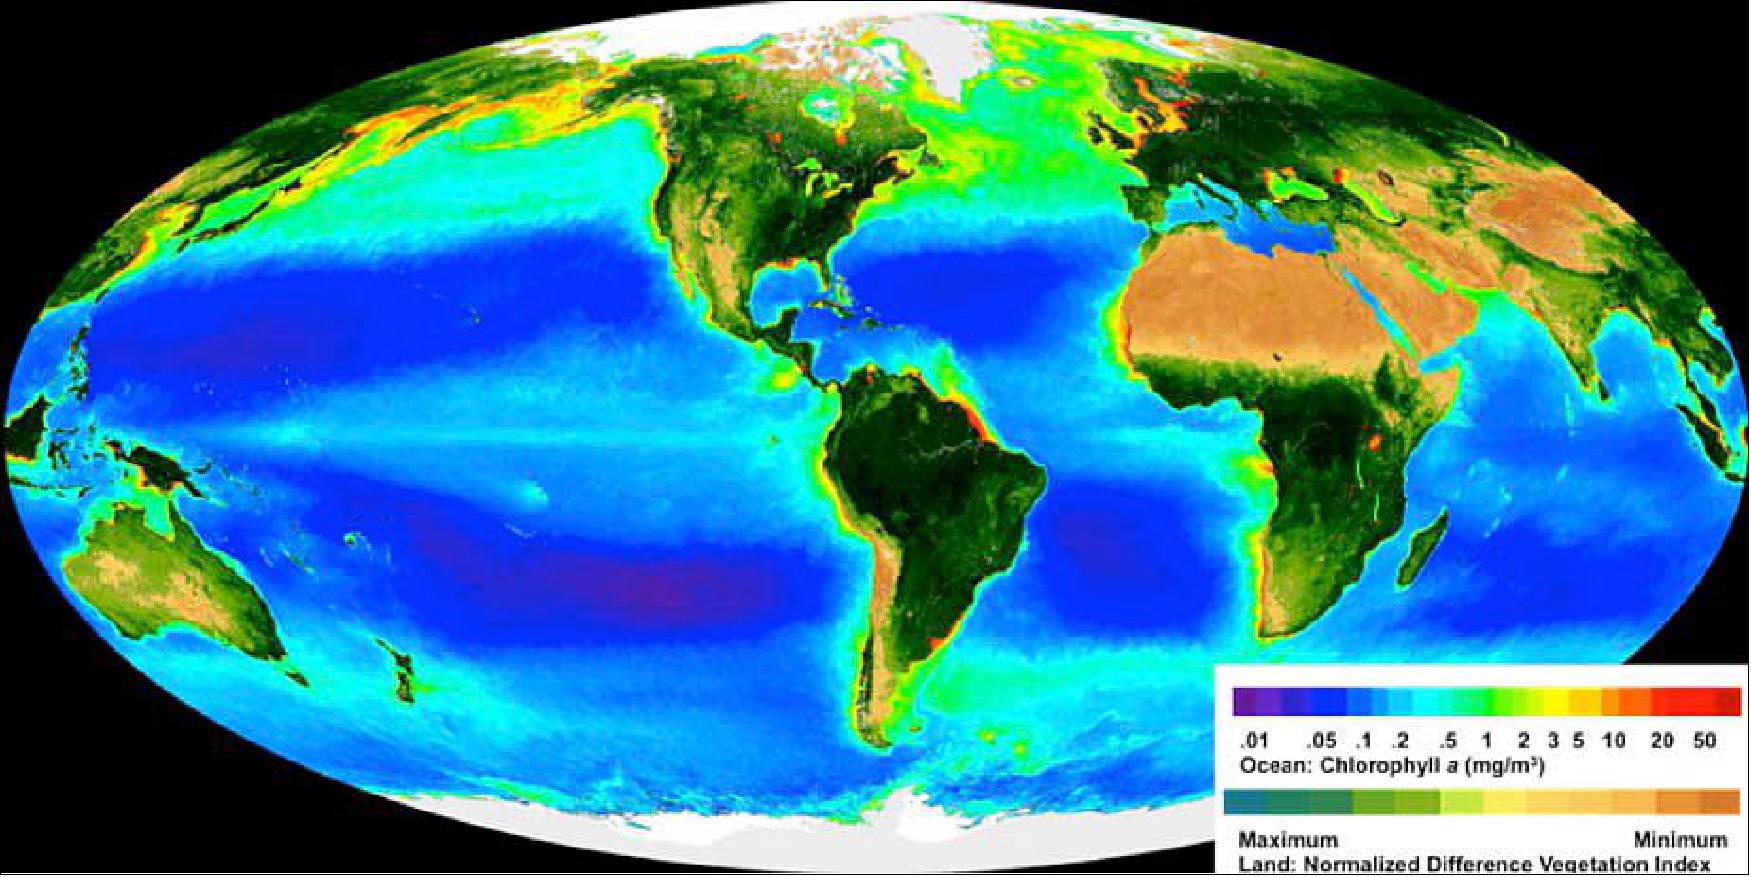
PACE is a polar-orbiting mission with an ocean color sensor and possibly an aerosolcloud polarimeter. The mission is capable of performing radiometric and possibly polarimetric ocean and atmosphere surveys, returning a range of geophysical data from which properties of the ocean and atmosphere can be produced to add to other critical climate and Earth system variables.
The PACE mission has multiple scientific goals: making climate-quality global ocean color measurements that are essential for understanding the carbon cycle and global ocean ecology and determining how the ocean’s role in global biogeochemical (carbon) cycling and ocean ecology both affects and is affected by climate change. The PACE science objectives have been described in the PACE Science Definition Team Report. 5) 6)
Quantifying phytoplankton is essential for understanding the carbon cycle and tracking climate variability and change. The ocean absorbs atmospheric carbon dioxide into solution at the sea surface. Like land plants, phytoplankton use carbon dioxide to create their organic biomass via photosynthesis. Phytoplankton vary greatly in their size, function, and response to environmental and ecosystem changes or stresses such as ocean acidification. Dissolved carbon dioxide also reacts with seawater and alters its acidity. About one fourth of human-made carbon dioxide ends up in the ocean. 7) 8) 9)
In addition to gathering data on ocean color, PACE measures clouds and tiny airborne particles like dust, smoke and aerosols in the atmosphere to supplement measurements from existing NASA satellite missions. These measurements are critical for understanding the flow of natural and human made aerosols in the environment. Aerosols affect how energy moves in and out of Earth’s atmosphere directly by scattering sunlight, and indirectly by changing the composition of clouds. Aerosols also can affect the formation of precipitation in clouds and change rainfall patterns.
The blend of atmospheric and oceanic observations from PACE is critical as ocean biology is affected by aerosols deposited onto the ocean, which in turn, produce aerosol precursors that influence atmospheric composition and climate. NASA is currently planning a second PACE instrument, a polarimeter, to better measure aerosol and cloud properties. These measurements will improve understanding of the roles of aerosols in the climate system.
PACE mission science questions (Ref. 1)
The PACE science objectives...are the result of decades of experience with requirements developed by the ocean color and cloud and aerosol communities. The advanced capabilities of the PACE OCI over heritage instruments will extend the current time series of high quality CDRs (Climate Data Records).
Global ocean ecosystems and climate:
• What are the standing stocks and compositions of ocean ecosystems? How and why are they changing?
• How and why are ocean biogeochemical cycles changing? How do they influence the Earth system?
• What are the material exchanges between land and ocean? How do they influence coastal ecosystems and biogeochemistry? How are they changing?
• How do aerosols influence ocean ecosystems and biogeochemical cycles? How do ocean biological and photochemical processes affect the atmosphere?
• How do physical ocean processes affect ocean ecosystems and biogeochemistry? How do ocean biological processes influence ocean physics?
• What is the distribution of both harmful and beneficial algal blooms and how is their appearance and demise related to environmental forcings? How are these events changing?
• How do changes in critical ocean ecosystem services affect human health and wel-fare? How do human activities affect ocean ecosystems and the services they pro-vide? What science-based management strategies need to be implemented to sus-tain our health and well being?
Coastal ocean ecosystems:
• What are the distributions of habitats and ecosystems and the variability of bio-geochemical parameters at moderate scales and what is the impact on coastal (e.g., estuarine, tidal wetlands, lakes) biodiversity and other coastal ecosystem services?
• What is the connectivity between coastal, shelf, and offshore environments?
• How does the export of terrestrial material affect the composition of phytoplank-ton communities in coastal waters, and how do these in turn affect the cycling of organic matter?
• How do moderate scale processes (e.g., sedimentation, photodegradation, respira-tion) affect the cycling of terrigenous organic material in the coastal environment?
Aerosols and clouds:
• What are the long-term changes in aerosol and cloud properties and how are these properties correlated with inter-annual climate oscillations?
• What are the magnitudes and trends of DARF (Direct Aerosol Radiative Forcing) and the anthropogenic component of DARF?
• How do aerosols influence ocean ecosystems and biogeochemical cycles?
PACE Mission Requirements
Responding to mission objectives and finding ways to answer the scientific questions is what drives mission requirements. NASA incorporated many of the features and “lessons learned” from heritage spectrometers flown by NASA as well as those flown by international partners into the OCI instrument design. A lesson learned from the SeaWiFS era, for example, is the benefit of an ocean color instrument that can view the full Moon each month from its Earth view port. The reflectance of the Moon can be accurately modeled, providing an invaluable temporal calibration source for the ocean color instrument. As of this early stage in the project, the key minimum threshold mission and OCI instrument characteristics and capabilities are:
• Earth surface spatial resolution at nadir of 1 km2 for all science bands.
• Sun-synchronous polar orbit with an equatorial crossing time near local noon (11:00-13:00 hours).
• Two-day global coverage of science measurements to a solar zenith angle of 75° and sensor view zenith angles not exceeding 60°—with mitigation of sun glint.
• A spectral range from 350 to 800 nm at 5-nm resolution, plus near-infrared bands at 865 and 940 nm and four or more shortwave infrared bands spanning 1240, 1378, 1640, 1880, 2130, and/or 2250 nm.
• Downlink and storage of the complete 5 nm resolution data from spacecraft to ground.
• Monthly characterization of instrument detector and optical component changes using lunar observations through the Earth-viewing port that illuminate all science detector elements.
PACE - Measuring More than Ocean Color
While PACE is predominantly an “ocean color” mission, it also has secondary objectives — and possibly a secondary instrument. An additional overarching goal for the mission is to help determine the roles of the ocean and atmosphere in global bio-geochemical cycling and how perturbations to Earth’s energy balance both affect and are affected by rising atmospheric CO2 levels and Earth’s changing climate.
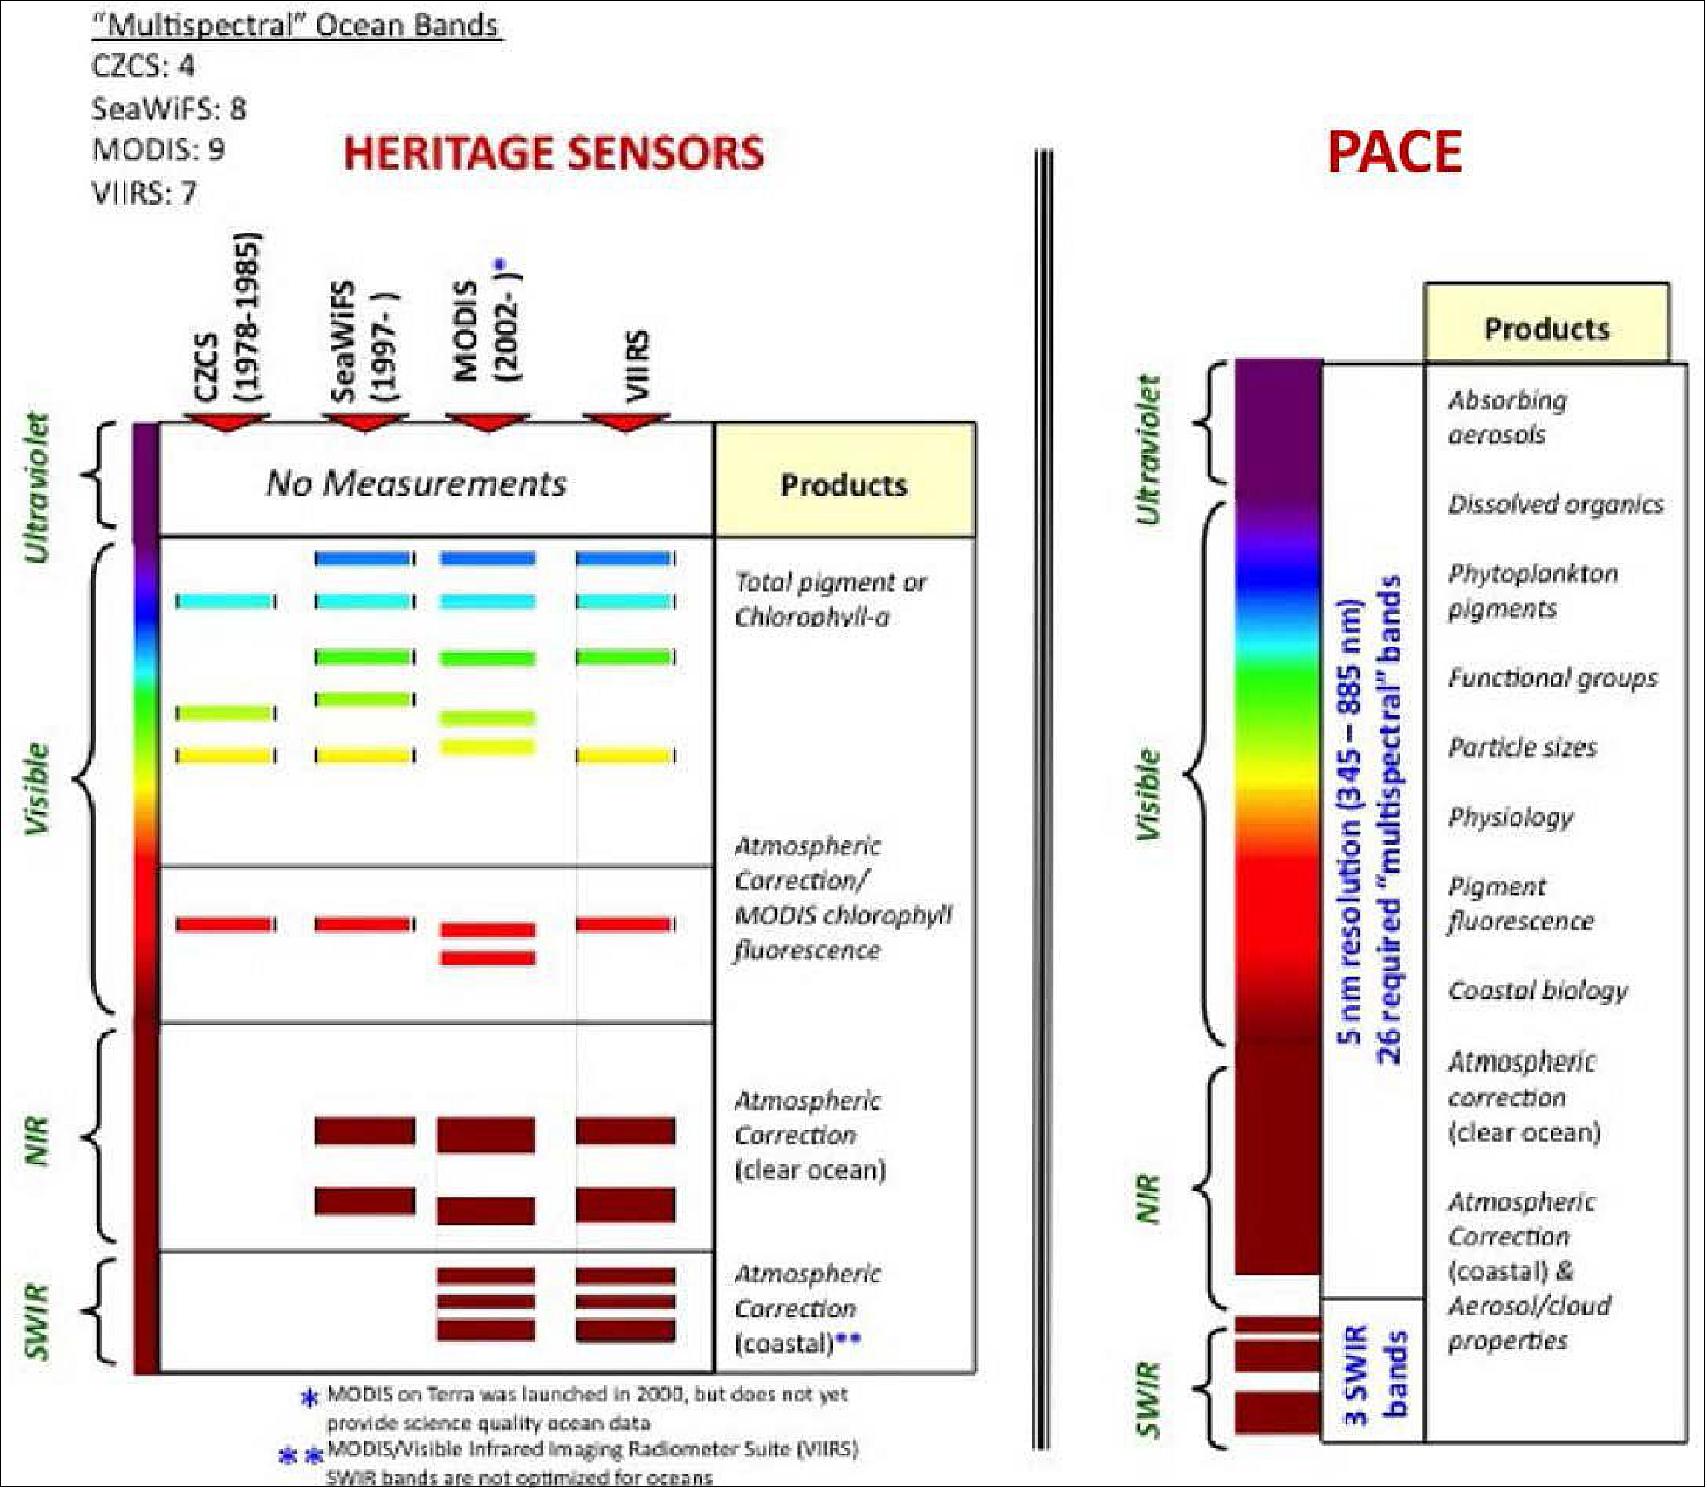
The PACE mission contributes to the continuation of atmospheric CDRs (Climate Data Records) as well as those for ocean color. The OCI allows continuation of “heritage” aerosol measurements made using the MODIS (Moderate Resolution Imaging Spectroradiometer) onboard Terra and Aqua and the OMI (Ozone Monitoring Instrument) onboard Aura. It also provides additional characterization of aerosol particles because its spectral range includes shortwave infrared wavelengths (Figure 2). This enables continuation of MODIS-like and OMI-like characterization of aerosol properties, and MODIS-like measurements of water vapor and retrievals of cloud optical properties. These are the key atmospheric components affecting our ability to predict climate change as they contribute the largest uncertainties in our understanding of climate forcings and cloud feedbacks for an increasingly warmer planet. The interactions between these species are key to such understanding, as aerosols, water vapor, and clouds remain intertwined within the hydrologic cycle because most cloud droplets are seeded by small aerosol particles called cloud condensation nuclei. Changes in the amount, type, and distribution of aerosols, therefore, can alter the micro- and macro-physical characteristics of clouds. Furthermore, natural and anthropogenic changes to the aerosol system may affect clouds and precipitation, which can alter where, when, and how much precipitation may fall.
Organizational Requirements and Responsibilities
PACE has been implemented as a NASA Class C mission and it was launched on February 8, 2024 timeframe and minimum mission duration of three years, with orbit maintenance capabilities for 10 years. PACE is designated as a design-to-cost mission, meaning that it has a fixed budget cap of $805 million. Under this funding framework, science returns from the mission needs to be optimized through a series of trade and feasibility studies that encompass the OCI, a potential polarimeter, the spacecraft and launch vehicle, the ground and science data processing segments, pre- and post-launch, science and calibration/validation programs, and all other components of system integration and mission management.
Full responsibility for the PACE mission was directed to NASA/GSFC (Goddard Space Flight Center) in December 2014. GSFC will design and build the OCI, as well as maintain responsibility for project management, safety and mission assurance, mission operations and ground systems, launch vehicle/spacecraft/instrument payload integration and testing, and OCI calibration, validation, and science data processing.
Spacecraft
The PACE project is managed by NASA/GSFC ( Goddard Space Flight Center). The main instrument and bus are being designed and built at Goddard Space Flight Center.
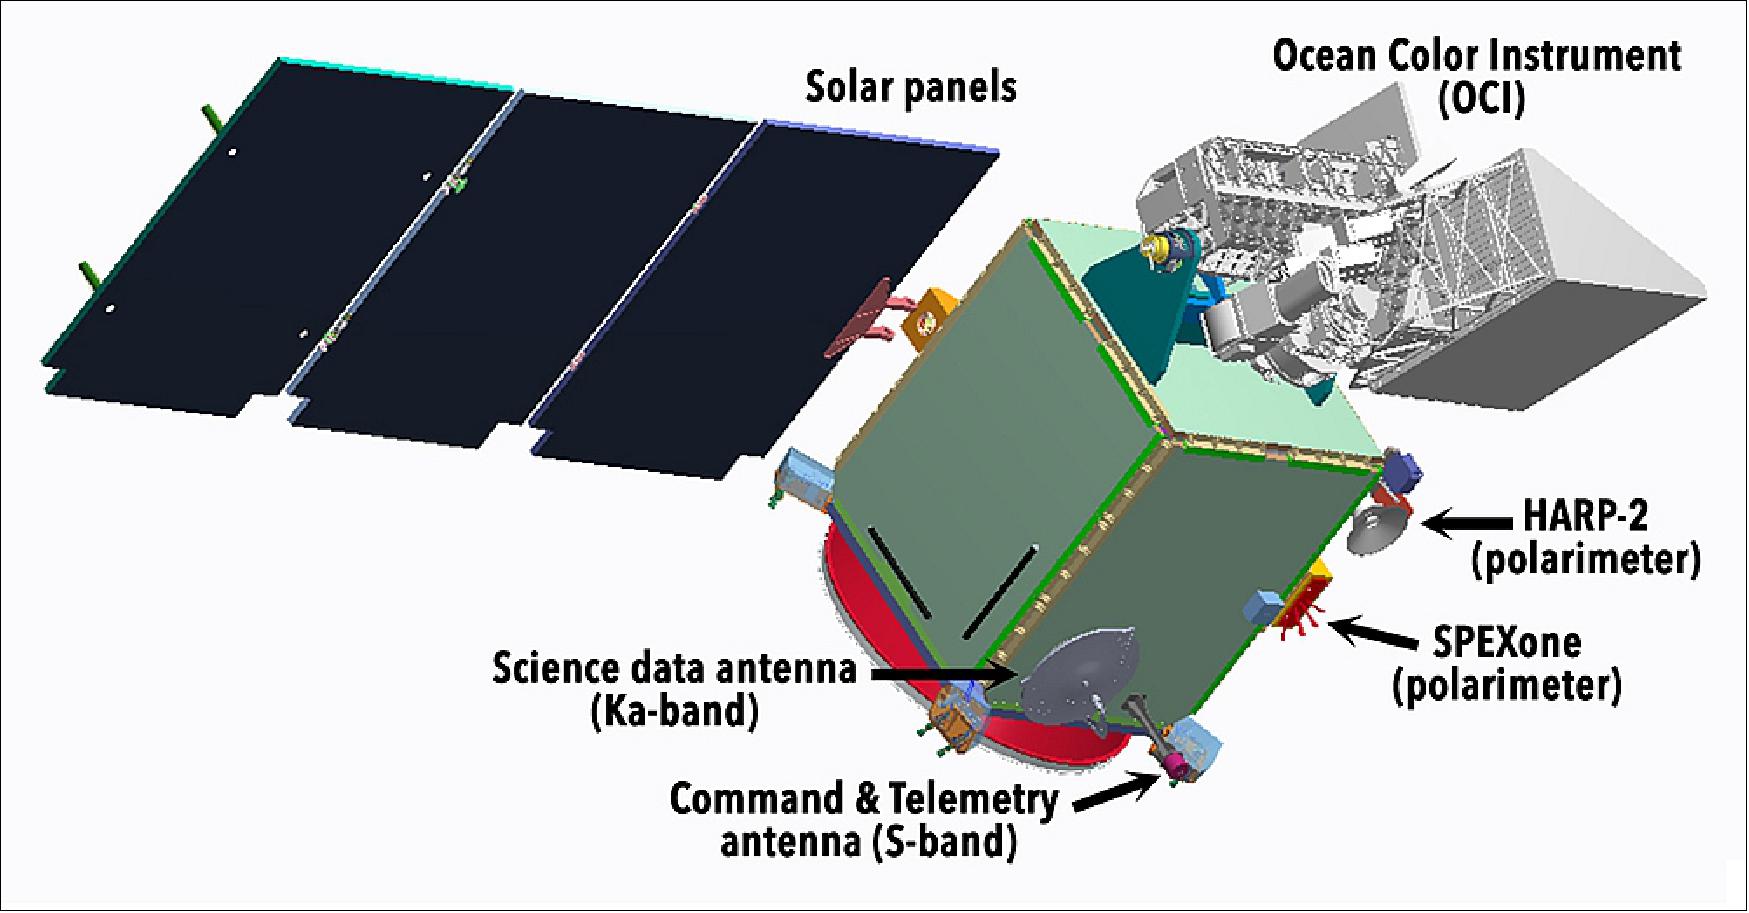
Mass with fuel | Not to exceed 1700 kg |
Spacecraft size | 1.5 m x 1.5 m x 3.2 m |
Power | 1 kW |
Communications | S-band: Command & Telemetry |
Launch
The PACE satellite was launched on 8 February 2024, at 1:33 a.m. EST (06:33 GMT) on a SpaceX Falcon-9 vehicle from the Cape Canaveral Complex 40, at the Air Force Station in Florida. 56)
Orbit: Sun-synchronous orbit, altitude = 676 km, inclination = 98º, LTAN (Local Time on Ascending Node) at 13:00.
Mission Status
• February 8, 2024: PACE launched aboard a SpaceX Falcon 9 rocket from Space Launch Complex 40 at Cape Canaveral Space Force Station in Florida, at 1:33 a.m. EST. NASA confirmed signal acquisition from the satellite about five minutes after launch, and the spacecraft is performing as expected.
“Congratulations to the PACE team on a successful launch. With this new addition to NASA’s fleet of Earth-observing satellites, PACE will help us learn, like never before, how particles in our atmosphere and our oceans can identify key factors impacting global warming,” said NASA Administrator Bill Nelson. “Missions like this are supporting the Biden-Harris Administration’s climate agenda and helping us answer urgent questions about our changing climate.”
From hundreds of miles above Earth, the PACE mission will study the impact of tiny, often invisible things: microscopic life in water and microscopic particles in the air. 57)
• March 30, 2021: The planning of a NASA space instrument usually follows a standard checklist: 10)
- Hours of planning
- Numerous checks and status updates
- A coordination of agencies, countries and production crews
And even if things go well, one thing can change all that planning, especially a pandemic.
- "It really changed delivery efforts for SPEXone," said Wen-Ting Hsieh, the polarimeter instrument manager for PACE at NASA's Goddard Space Flight Center (Goddard) in Greenbelt, Md. "Things were always changing."
- Despite the obstacles, this past March members of the PACE (Plankton, Aerosol, Cloud, ocean Ecosystem) mission, in coordination with its partners, successfully collected the SPEXone instrument as it landed at Dulles International Airport from the Netherlands.

- SPEXone is a multi-angle polarimeter instrument used for measuring the amount of light received from a given source as a function of its state of polarization.
- After arriving on a commercial flight and clearing customs, it made its way to Goddard where it will be further tested and eventually integrated onto the PACE observatory, where it will ultimately complement two other instruments.
- SPEXone was built in the Netherlands in partnership with Airbus Defence and Space NL and the SRON Netherlands Institute for Space Research.
- During those meetings, both teams were attempting to navigate international travel changes brought on from COVID-19.
- "This whole process took a lot of collaboration and a bit of creativity," Hsieh said.
- To accommodate the instrument's delivery, many changes were implemented. For instance, science teams checking and preparing the instrument at Goddard had to work at staggered times. A Dutch official flew in a week early and quarantined to be present for the instrument's hand-off.
- Those working with the concept of SPEXone aren't surprised by its unconventional journey, according to Adam Matuszeski, a systems engineer who helped with its development back in 2016.
- "At the time it was a partly contributed instrument where we were going to provide detectors and a thermal system. It was all going to come together and be the one polarimeter for PACE," Matuszeski said.
- Due to funding and budget constraints, the mission architecture went through a series of changes.
- The team looked at having a Canadian coastal imager on PACE. Members also talked to the Indian space agency about developing a new polarimeter. Ultimately, PACE couldn't accommodate another big instrument. It looked like PACE might become a single-instrument mission.
- Things finally changed when PACE members started talking again with Airbus and SRON and worked out a way to develop SPEXone as a smaller, fully-contributed version of the original instrument. Once that approach was worked out, Matuszeski said things came together. The PACE mission now has three instruments, including a second small polarimeter built by the University of Maryland, Baltimore County which complements beautifully the measurements provided by SPEXone.
• February 23, 2021: Yesterday, space research institute SRON briefly opened its digital doors for the media and the parties that have been collaborating over the past years on the new Dutch satellite instrument SPEXone. On behalf of the Dutch government, outgoing minister Ingrid van Engelshoven of the Ministry of Education, Culture and Science was there to conduct a final inspection of the instrument before it is shipped off to NASA in the United States. 11)
- The online presentation switched from SRON in Utrecht via the NSO (Netherlands Space Office) in The Hague to the GSFC (Goddard Space Flight Center) in the American state of Maryland and then back to SRON, where SPEXone spent the last few months undergoing a rigorous battery of tests in the cleanroom in preparation of its launch and the start of its mission. Viewers were left with two impressions: the collaboration between the Netherlands and NASA could not be more effective and SPEXone is sure to make an impact in the field of climate science.
The Effects of Aerosols
- Starting in 2023, NASA's PACE satellite will be studying the complex interplay between our planet's oceans, the atmosphere and the climate. The Dutch instrument SPEXone will focus on the effects of aerosols; small dust particles in Earth's atmosphere. There is much we do not know about aerosols. This general lack of knowledge has major consequences for the reliability of climate models. 12)
- Karen St. Germain, Earth Science Division director at NASA, eagerly awaits the arrival of SPEXone at NASA's Goddard Space Flight Center. “This is the result of an important partnership between NASA and the Netherlands. I am very happy with SRON, the NSO and all other parties in the Netherlands who helped make this possible.”
- The Netherlands and NASA have a long history of collaboration, says NSO director Harm van de Wetering. Previously, a Dutch consortium developed OMI ( Ozone Monitoring Instrument) for NASA's Aura satellite. This instrument played a key role in research of the expansion and contraction of the hole in the ozone layer. OMI was launched in 2004 and continues to operate flawlessly to this day.
- Van de Wetering is confident that SPEXone will be another big success for the field of climate science and for the Netherlands: “SPEXone has great scientific and social relevance. The development of this instrument ties into the economic goals of the Dutch space industry. I am proud of what we have achieved here and I certainly don't think this will mark the end of our partnership.”
Faith in the Instrument
- Aaldert van Amerongen, head of SRON's earth observation programme, gave viewers access to SPEXone in the cleanroom via a video connection. Together with three of his engineers, all wearing dust coats and facial protection, he talked about the results of an extensive testing campaign conducted over the past few months: “We have collected a wealth of high-quality data, which will allow us to make optimal use of the instrument once it reaches outer space and begins studying aerosols. The test results give us every reason to believe that the instrument is ready to go.”
- Minister Van Engelshoven directed one final look at the instrument and the strong titanium legs with which it will be attached to the PACE satellite. “I am impressed by the perseverance of all parties watching today. Everyone has worked on this instrument with so much passion and expertise that there is only one possible conclusion I can draw after this unique final inspection: SPEXone is good to go.”
About SPEXone
- SPEXone is a compact, optical satellite instrument that will characterize aerosols from a low orbit around the Earth. It is part of the NASA's PACE satellite (launch 2023). SPEXone is being developed by a Dutch consortium consisting of the space research institute SRON and Airbus Defense and Space Netherlands, supported by optomechanical experts from TNO. SRON and Airbus DS NL are responsible for the design, assembly and testing of the instrument. Scientific leadership is in the hands of SRON. SPEXone is a public-private initiative made possible by NSO with resources made available by OCW and by SRON-NWO with support from Airbus DS NL.
• January 18, 2021: PACE's data will help us better understand how the ocean and atmosphere exchange carbon dioxide. In addition, it will reveal how aerosols might fuel phytoplankton growth in the surface ocean. Novel uses of PACE data will benefit our economy and society. For example, it will help identify the extent and duration of harmful algal blooms. PACE will extend and expand NASA’s long-term observations of our living planet. By doing so, it will take Earth’s pulse in new ways for decades to come. 13)
• July 17, 2020: Why are there so many songs about rainbows? For NASA’s upcoming PACE (Plankton, Aerosol, Cloud, ocean Ecosystem) mission, the colors of the rainbow — or, if you prefer, the visible wavelengths of the electromagnetic spectrum — are the key to unlocking a wealth of new data on skies and seas around the world. 14)
Ultraviolet and Violet
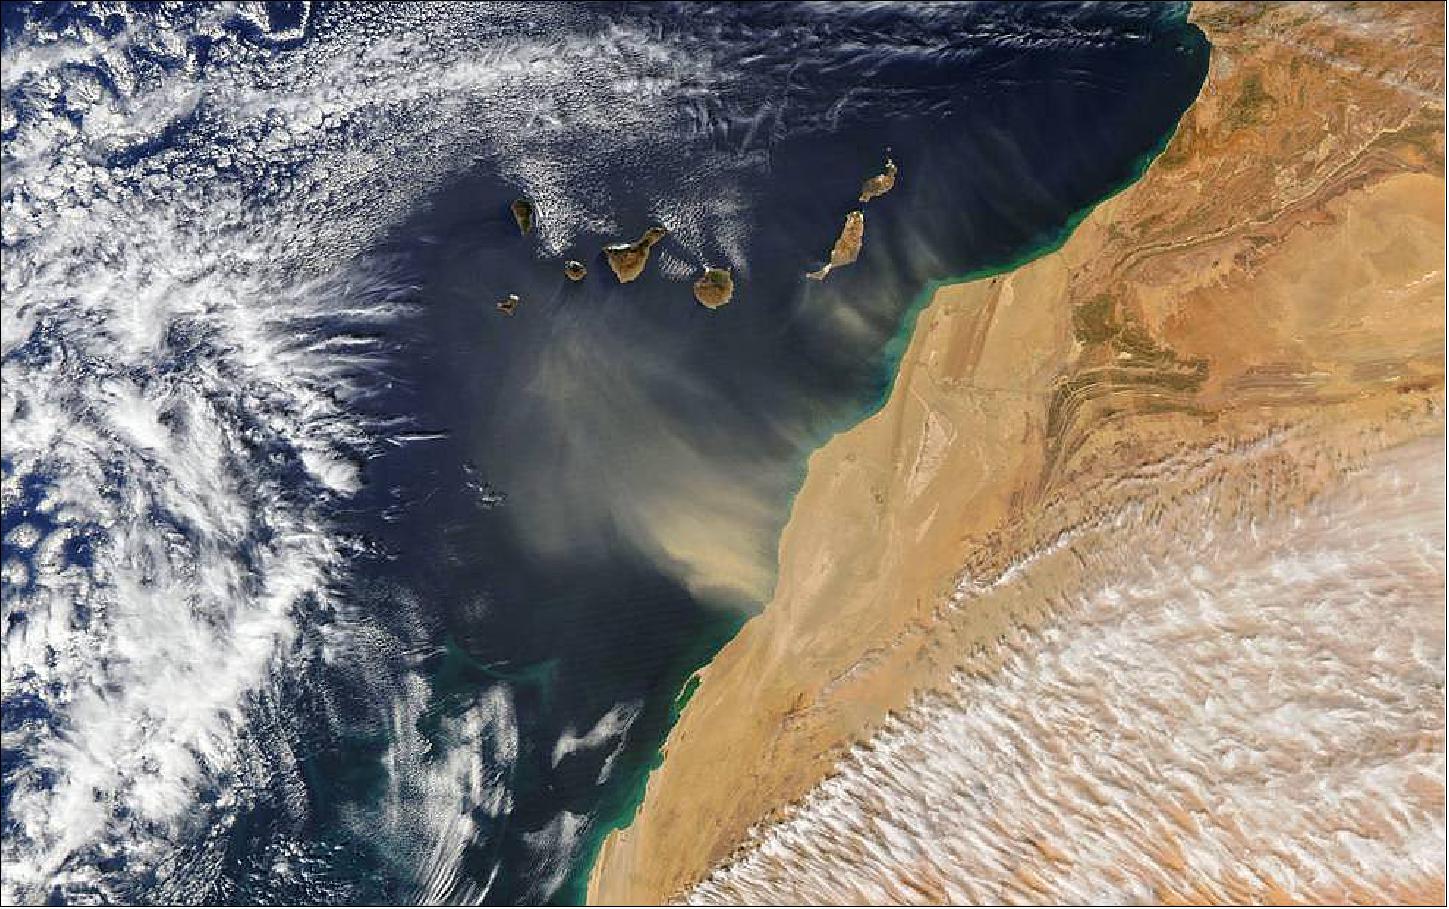
- Ultraviolet wavelengths (which are invisible to the human eye) and violet wavelengths (which are visible) help scientists learn about aerosols: particles in the atmosphere that may be organic or inorganic, solid or liquid, ranging from dust and soot to sea salt and chemical droplets. These wavelengths help reveal whether measured aerosols are natural or come from human activities.
- Ultraviolet and violet wavelengths will also help scientists study particles dissolved in the ocean – specifically, to distinguish between chlorophyll (a green pigment found in all phytoplankton) and other organic materials. Knowing the difference is important for studying how much carbon sinks and gets stored in the deep ocean.
- “Not all plankton do the same thing when it comes to carbon,” said Ivona Cetinić, an oceanographer at NASA’s Goddard Space Flight Center (GSFC) and PACE’s project science lead for biogeochemistry. “Some are better producers, some are better sequesterers who draw carbon dioxide down. Once the carbon enters the plankton, what happens later on depends on the type of plankton. If it’s teeny-tiny, there’s a big chance it will get eaten by a zooplankton – they are teeny-tiny cows, no? – which will get eaten by a bigger one, and so on. If those reactions happen close to the surface, the carbon comes back to the atmosphere. If the zooplankton poops, the carbon goes down into the deep ocean.”
Blue
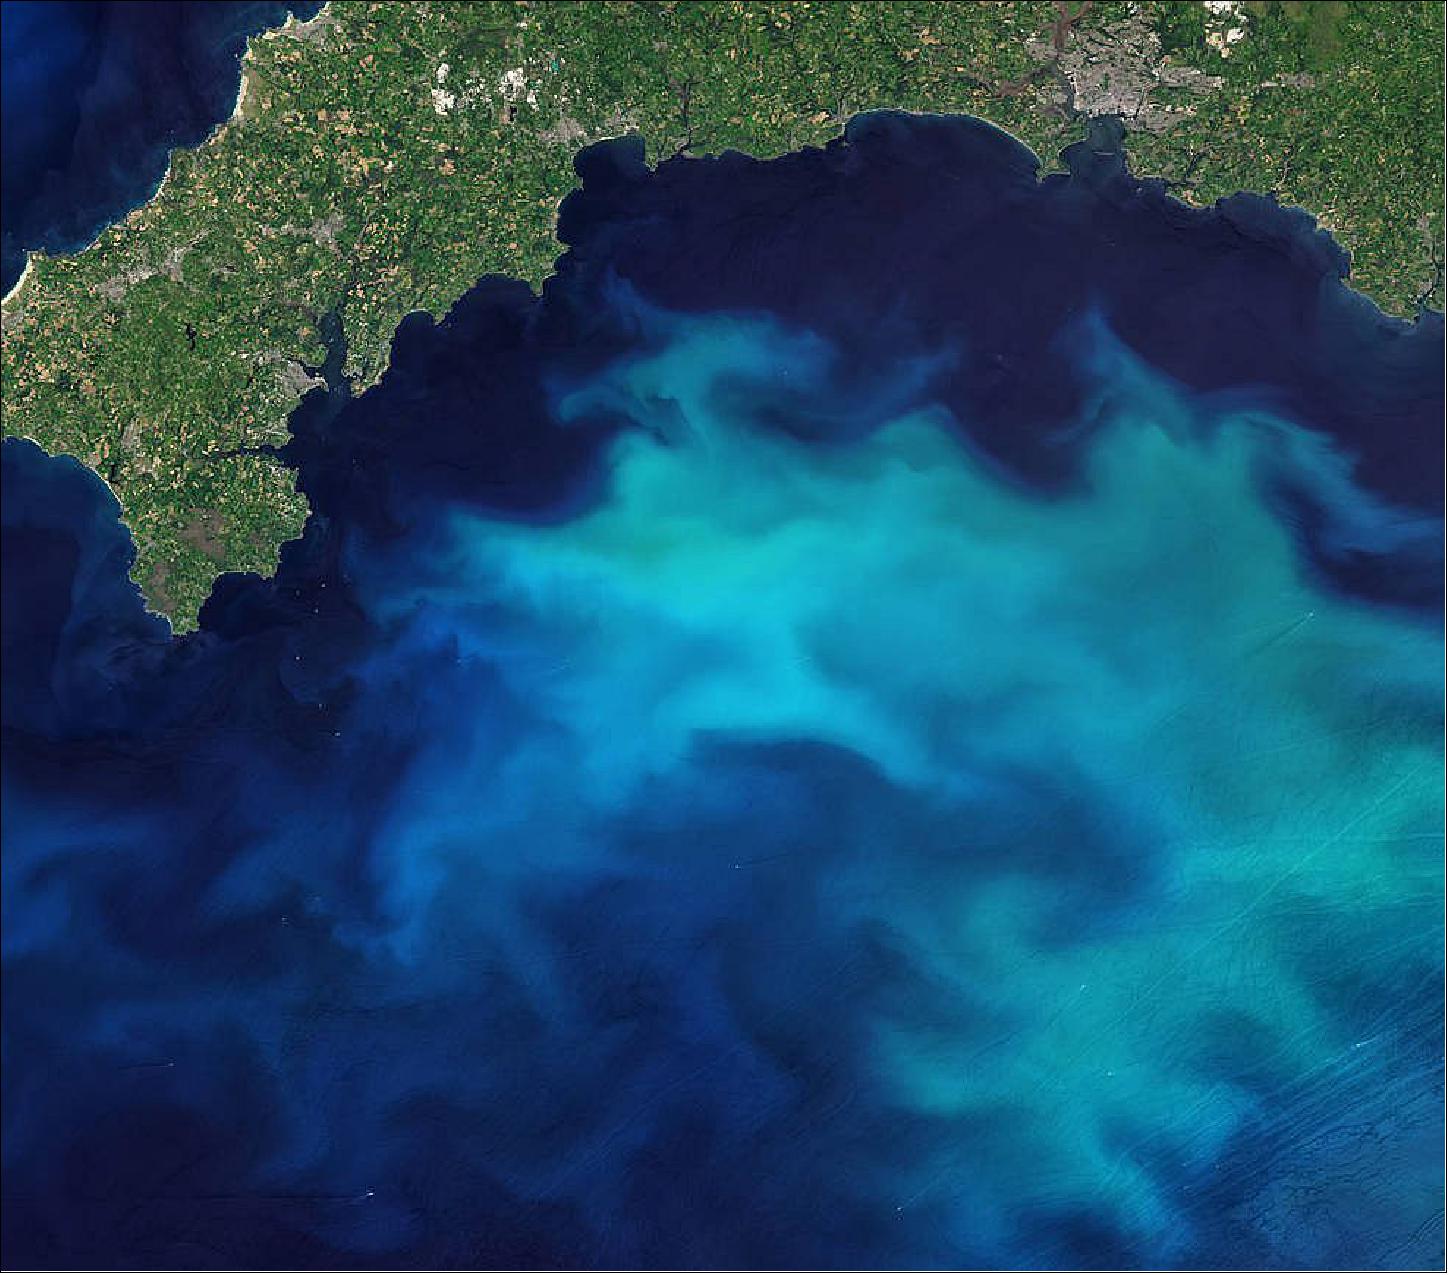
- Blue wavelengths help researchers differentiate between phytoplankton species. From diatoms to dinoflagellates, each phytoplankton species has its own identity: Different functions within the ecosystem, different nutritional needs (and content, for predators!), and importantly for the Ocean Color Instrument (OCI), different wavelengths of light that they absorb and scatter. Colors in the blue range of the spectrum will allow scientists to see the composition of phytoplankton communities.
- “If you’re looking at a meadow, it all looks green to your eyes, but you want to know all the players in that ecosystem,” said Cetinić. “It’s rare that you get just one type of plankton in a community; it’s much more likely that they’ll work together. They make up a microbial food web. PACE will allow us to resolve, not just one or two species, but the whole community.”
- Tracking phytoplankton community composition and health is not only important for understanding the ocean now, but also for predicting how it could change in the future.
Green
- Green wavelengths are often used as a reference for the total amount of particles in the air. These are combined with shorter and longer wavelengths to further determine the size of these particles. Size is an important factor in helping scientists know at what they are looking. Natural aerosols like dust or sea salt tend to have larger particles than human-produced ones like soot or smoke, so particle size helps identify aerosols’ sources.
- “There are several reasons it’s important to better understand aerosols,” said Andrew Sayer, an atmospheric scientist at NASA GSFC and PACE’s project science lead for atmospheres. “One reason is more useful air quality forecasts. Another is linked to climate: The cooling or warming effect aerosols have on climate, the way they interact with clouds and affect cloud lifetime, is dependent on the vertical distribution of all these features. We’ll be better able to monitor this from space. Satellite data can be used to interrogate the climate models more thoroughly and improve them.”
- Similarly, different phytoplankton species are different sizes, so this variable helps identify who is who in a plankton community.
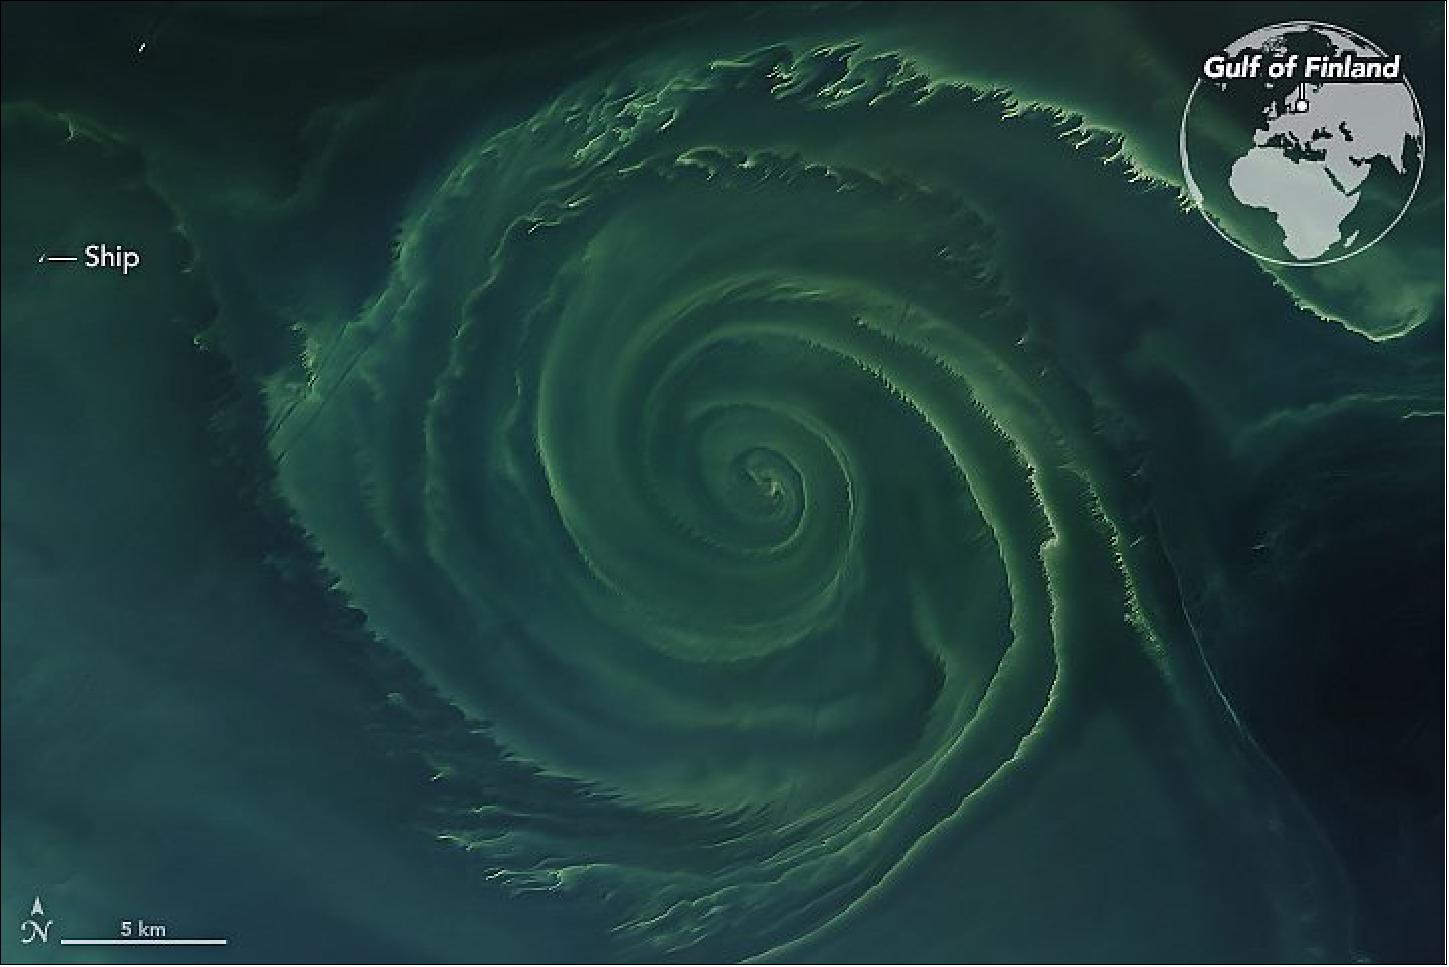
Yellow and Orange
- The OCI’s yellow and orange wavelengths help scientists track phytoplankton health and physiology. Scientists can determine how healthy a phytoplankton community is by looking at how quickly the phytoplankton are growing, how efficient their photosynthesis is and what color they are – all information they can gather with yellow and orange wavelengths.
- Understanding phytoplankton health can help predict HABs (Harmful Algal Blooms). When substances from land wash into the ocean, they sometimes become a feast for algae, allowing them to eat, grow and multiply rapidly. HABs can generate harmful toxins that sicken marine wildlife and humans and deplete oxygen in the water as bacteria feed on numerous dead algae.
- “Harmful algal blooms are not recent. We have writings from indigenous tribes in the Pacific Northwest that talk about things happening on the beach,” said Cetinić. “It’s just that today we’re looking for it more, and also anthropogenic influences are making blooms more prevalent.”
- While naturally occurring minerals can run into the ocean and feed algae, chemicals produced by humans – lawn fertilizer, wastewater treatment chemicals and agricultural chemicals, for example – are a much greater culprit.
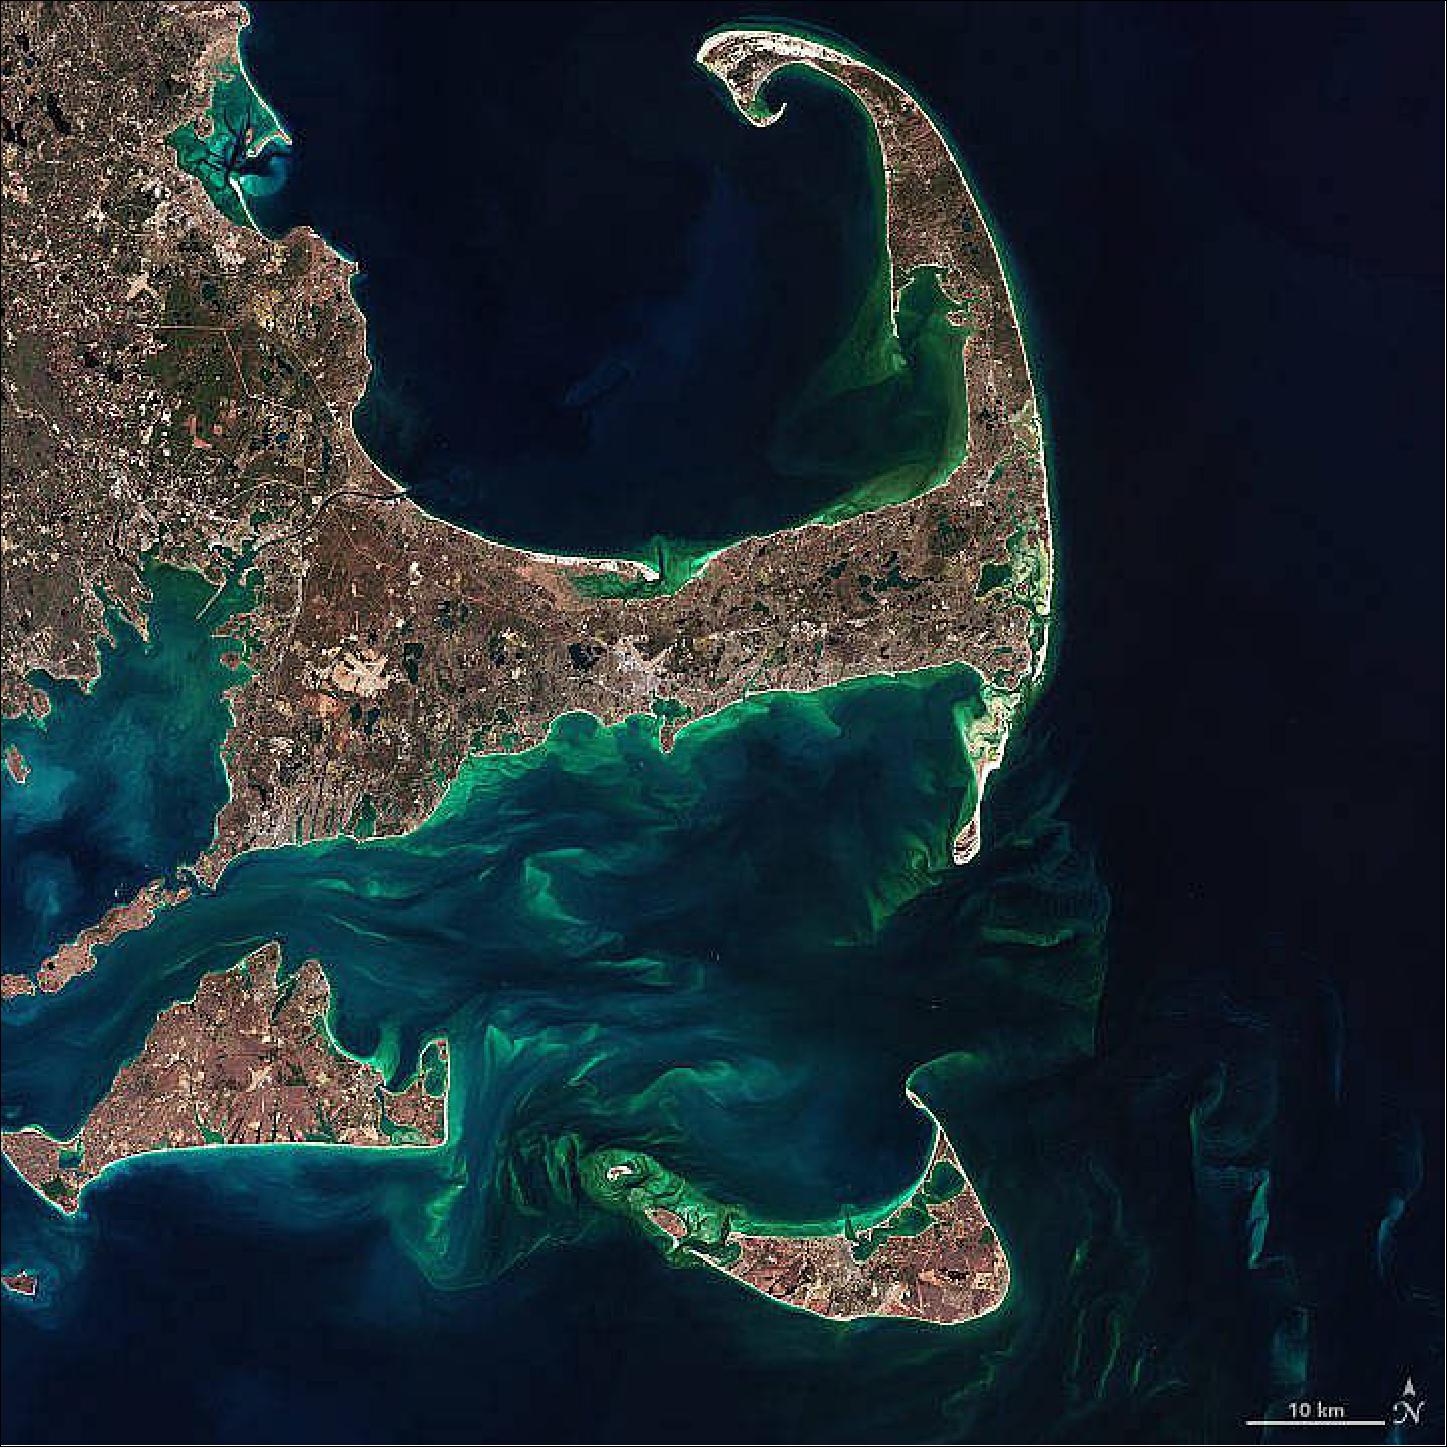
Red and Near-infrared
- Red and near-infrared wavelengths give the team a look into a different portion of the ocean: Coastal areas, with waters fed by rivers and shallower bottoms with sediments that can be suspended after a storm, are often colored very differently than the open ocean. Variations in the colors reflected back from coastal areas not only give scientists clues to the health of the organisms that live there, which also helps them prepare for coastal HABs, but also inform on outflows from riverine systems and watershed dynamics.
- “With PACE, we can see the early developmental stages of blooms and say what species it is,” said Cetinić. Early warnings allow businesses in coastal areas to prepare for HAB impacts, such as not harvesting or selling fish that consume the toxic algae, preparing veterinary offices for an influx of sick animals, aerating the water to prevent bottom-dwelling creatures from suffering lack of oxygen, and warning consumers not to eat sardines or oysters, she added.
- “Many of these kinds of early warning systems and measures are already in place in these coastal areas, so we’ll be adding our data to their systems,” Cetinić said. “Early information always saves money for local economies.”
Short-wave Infrared
- Just outside the range of visible light are the short-wave infrared (SWIR) wavelengths, which have a number of uses for both the atmosphere and the ocean.
- SWIR wavelengths help scientists determine how clear the atmosphere is over the ocean, which is important for calculations of ocean properties at the surface. It also helps with similar calculations for the atmosphere over the coast, which helps with studies of clouds and coastal biology.
- “Clouds reflect sunlight, they trap heat and light,” Sayer said. “We need a very accurate understanding of their brightness and physical location.”
- By also monitoring how much sunlight gets blocked by aerosols, the OCI will help scientists resolve an important gap in modeling, said Sayer. Clouds and aerosols interact with each other in the atmosphere, but scientists need more information about how and where.
- “There are some seasonally repeating aerosol features where you often get aerosols above the clouds,” he said. “For example, in the southeast Atlantic, there’s a lot of agricultural biomass burning in central and southern Africa, which peaks in August to October. A lot of that blows off over the ocean, where there’s a low-lying cloud deck. It’s similar in southeast Asia. These aerosols make it harder to accurately determine cloud properties.”
- In the same way, clouds make it harder to study aerosols, he said.
- “If you’re a climate modeler trying to model the transport of aerosols around the world, there are large areas of the world where you’re getting limited amounts of useful data,” he explained. “With the OCI, having more spectral bands will really help fill some of those gaps. Having a hyperspectral instrument that goes into the ultraviolet range will make it much easier to quantify these aerosols, especially in combination with the polarimeters.”
• June 4, 2020: NASA's PACE (Plankton, Aerosol, Cloud, ocean Ecosystem) mission has successfully passed its design reviews and moved into its construction and testing phase, preparing to advance the fields of global ocean and atmospheric science when it launches in 2023. 15)
- “The PACE project spent five years creating our mission design, and this milestone is proof that it’s credible,” said Jeremy Werdell, an oceanographer in the Ocean Ecology Laboratory at NASA Goddard and PACE’s project scientist. “Test versions of PACE’s instruments were evaluated to support these critical design reviews. Watching OCI be built has finally made the mission feel real. It’s incredibly exciting to see its design realized in hardware, with test results confirming that it performs even better than expected.”
A Colorful Point of View
- PACE’s high-resolution instruments will see ocean and atmosphere features in unparalleled detail when the mission launches in 2023. The mission combines science and engineering advances and builds off of historical ocean color sensors by NASA and other space agencies. Phytoplankton — tiny plant-like organisms and algae that live in the ocean — make up the basis of the marine food web and generate half of Earth’s oxygen, so monitoring their distributions over time is vital for understanding the health of the ocean and atmosphere. By measuring the intensity of the color of light that exits Earth’s ocean surface, PACE will capture fine details about plankton species, beneficial phytoplankton communities that fuel fisheries, and harmful algal blooms (HABs) that can poison animals and humans and disrupt tourism and commercial fishing.
- “If we look at plankton from the perspective of the carbon cycle, different types of plankton have specific roles,” said Ivona Cetinić, an oceanographer at NASA Goddard and PACE’s project science lead for biogeochemistry. “All of them take carbon from the atmosphere, but some are eaten by other animals, while others draw the carbon deep into the ocean. Right now, we know how much they take in, and we can put that into our big models, but it’s hard to understand what happens to carbon in the ocean. With PACE we can study the role phytoplankton play, how different types determine the path carbon will take when it enters the ocean.”
- Besides the OCI, PACE will carry two polarimeters: Instruments that measure how various molecules and particles in the atmosphere change the oscillation of light waves passing through them. Light waves travel through space at different angles, and these angles change when they strike particles and gases in the atmosphere, or reflect off Earth’s surface. The amount and direction of this change provides clues to the particles’ composition and size, as well as surface features.
- SPEXone (Spectro-polarimeter for Planetary Exploration) will be built and overseen by the SRON Netherlands Institute for Space Research and Airbus Defence and Space Netherlands. The Hyper-Angular Rainbow Polarimeter #2 (HARP2) is built by the Earth and Space Institute at the University of Maryland, Baltimore County. Both of these instruments are capable of observing the Earth from multiple angles simultaneously.
- “When you’re looking out your window, you might look down and there’s a bush, and it’s green, but if you go outside and stand next to it, it might look brown,” said Andrew Sayer, an atmospheric scientist at NASA Goddard and PACE’s project science lead for atmospheres. “From the window, you’re seeing the top, which is covered in leaves. From the ground, you’re seeing the trunk, which is brown. The apparent color of something changes depending on the angle you’re looking at it from. When you’ve got a multi-angle instrument like SPEXone or HARP2, they can infer more about what they’re looking at.”
- PACE’s ability to see the complete rainbow will set a new standard for ocean scientists, Werdell said.
- “With PACE, NASA and its partners are building an Earth observatory that pushes the boundaries of space technologies and physics – a satellite to measure our home planet in ways that until recently were inconceivable,” he said. “It is without question going to be the most advanced ocean color instrument ever built – a masterpiece of all the greatest things about global ocean color.”
• February 6, 2020: NASA has selected SpaceX of Hawthorne, California, to provide launch services for the agency's Plankton, Aerosol, Cloud, ocean Ecosystem (PACE) mission. The PACE mission currently is targeted to launch in December 2022 on a Falcon 9 Full Thrust rocket from Cape Canaveral Air Force Station in Florida. 16)
- The PACE mission represents the nation's next great investment in understanding and protecting our home planet. The mission will provide global ocean color, cloud, and aerosol data that will provide unprecedented insights into oceanographic and atmospheric responses to Earth's changing climate. PACE will help scientists investigate the diversity of organisms fueling marine food webs and the U.S. economy, and deliver advanced data products to reduce uncertainties in global climate models and improve our interdisciplinary understanding of the Earth system.
• August 28, 2019: After passing a key review hurdle, NASA's newest mission to study the health of Earth's ocean ecosystems and atmosphere is ready to move from design to reality. The PACE (Plankton, Aerosol, Cloud, ocean Ecosystem) mission will study phytoplankton - microscopic plants and algae that live in the ocean - as well as the clouds and atmospheric aerosol particles above the water. Every mission goes through a rigorous review process on its journey from idea to launch, and PACE is now cleared to move forward to the critical design phase of the mission. 17)
In August 2019, the mission entered Phase C, Final Design & Fabrication, with an expected launch readiness date of 2022.
• April 10, 2019: RUAG Space will deliver a navigation receiver. The receiver for low earth orbit can determine a satellite’s position in orbit around the Earth to within a few centimeters. “Our low earth orbit navigation receiver is the most precise receiver on the market”, says Peter Guggenbach, CEO RUAG Space. The navigation receiver together with an antenna will be delivered in 2020. 18)
- RUAG Space received the order directly from NASA. The satellite will be built by NASA’s Development Team at Goddard Space Flight Center. In total 20 navigation receivers from RUAG Space are currently in orbit and functioning flawlessly.

• February 2018: The NASA PACE mission, with a target launch within the next 5 years, aims to make measurements that will advance ocean and atmospheric science and facilitate interdisciplinary studies involving the interaction of the atmosphere with ocean biological systems. Unique to this Earth science satellite project was the formation of a science team charged with a dual role: performing principal investigator (PI)-led peer-reviewed science relevant to specific aspects of PACE, as well as supporting the mission’s overall formulation as a unified team. 20)
- This science team is serving a limited term of 3 years, and recompetition for membership is expected later this year. Overall, the cooperative, consensus-building approach of the first PACE Science Team has been a constructive and scientifically productive contribution for the new satellite mission. This approach can serve as a model for all future satellite missions.
- The PACE satellite, as envisioned, would carry multiple sensors into space as early as 2022. These instruments include a radiometer that will span the ultraviolet to the near infrared (NIR) with high spectral resolution (<5 nm). This radiometer will also scan individual bands from the NIR to the shortwave infrared. In addition, the instrument suite would include two different CubeSat polarimeters. These devices are radiometers that separate different polarization states of light over several viewing angles and spectral bands.
- Measurements from these sensors would be used to derive properties of atmospheric aerosols, clouds, and oceanic constituents. Derived products could lead to better understanding of the processes involved in determining sources, distributions, sinks, and interactions of these variables with critical applications including Earth’s radiative balance, ocean carbon uptake, sustainable fisheries, and more.
The PACE Science Team
- To help map out the scope of the PACE mission, NASA first established a science definition team that provided a report on the desired characteristics of PACE in 2012. Following that report and just before the decision to fund PACE was made, in 2014 NASA published a call for proposals for participants in the first PACE Science Team.
- The scientists funded under this call and selected for the science team were partitioned into two subject areas: One focused on atmospheric correction and atmospheric products, and the other addressed the retrieval of inherent optical properties of the ocean. The team was enhanced with NASA personnel with specific portfolios in two areas: data processing and applications for societal relevance.
- NASA’s solicitation specified “the ultimate goal for each of the two measurement suite teams is to achieve consensus and develop community-endorsed paths forward for the PACE sensor(s) for the full spectrum of components within the measurement suite. The goal is to replace individual ST [science team] member recommendations for measurement, algorithm, and retrieval approaches (historically based on the individual expertise and interests of ST members) with consensus recommendations toward common goals.”
- This new framework differed from past NASA science teams in that PIs not only proposed their own science objectives and coordinated their own research but were also expected to contribute to common goals as well.
Science Team Activities
- Soon after forming, the science team identified several issues or subject areas of common concern and formed subgroups to address these individual concerns. These areas included construction of novel data sets for algorithm development (both in situ and synthetic data sets), cross comparison and benchmarking of coupled ocean-atmosphere radiative transfer codes, and cross comparison of instruments in the field to assess and constrain uncertainties in the measurements of oceanic particle absorption.
- The science team was also asked by NASA to assess the designs of the PACE radiometer and polarimeter and to determine the value of adding a high spatial resolution coastal camera. An ad hoc subgroup was formed to produce a stand-alone report on the advantages and requirements for polarimetry for atmospheric correction, aerosol characterization, and oceanic retrievals. The team contributed to both the design and content of the PACE website.
- The PACE science team also developed an alternative style for their last two annual meetings that emphasized discussion and interaction. To improve the efficiency of the PACE science team’s workshops, a “flipped meeting” format was adopted in which team members prerecorded their individual presentations in advance and posted these recordings to an internal site. Science team members were able to view and listen to the recordings at their leisure and arrived at the meeting itself readied with questions and discussion points for the presenters. This meeting strategy was successful and led to invigorating two-way discussions.
Enhanced Collaborations
- The PACE science team is in the last phase of the 3-year term. Several consensus reports are being finalized to provide NASA with input and recommendations about the most likely paths forward for PACE atmospheric correction, atmospheric products, and oceanic optical properties [e.g., Werdell et al., 2018].
- PACE has set itself up to be a model for interdisciplinary collaboration. Early fruits of this can be seen in the multiple collaborations that have sprouted up between ocean and atmospheric scientists, whose vocabulary and culture were initially vastly different. Collaborative products range from published papers that build realistic radiative transfer models from within the ocean to the top of the atmosphere to the assembly of novel databases that contain ocean and atmospheric measurements useful to develop novel algorithms.
- We hope these collaborations will result in increased cooperation in PACE’s future and on future missions. In particular, we’re hopeful that collaborations will lead to enhanced study of processes at the air-sea interface, a complex domain that is relatively unknown, where a holistic and interdisciplinary approach will lead to better understanding of the functioning of our planet.
- PACE’s future is currently uncertain (it is in Congress’s continuing resolutions but was one of the missions the current administration did not support). Although we hope that the mission keeps its funding, we note that the cooperative, consensus-building approach of the first PACE science team was a constructive and scientifically productive contribution to the path forward for a new satellite mission. We expect that this framework to support mission activities will be adopted in future NASA missions to maximize their utility across disciplines.
• July 21, 2016: NASA's PACE mission is a first-of-its-kind project that aims to answer key questions about the consequences of climate change on the health of our oceans and their relationship with airborne particles and clouds. PACE will use a wide spectrum of wavelengths from an "ocean color" instrument to provide scientists with this information. 21)
- "PACE represents a major effort to truly combine ocean research with atmospheric research," Project Scientist Jeremy Werdell said. "We are going to go beyond just seeing that Earth's climate is changing to better understanding why the change is occurring."
- PACE was approved to move forward out of its preliminary stage of planning on June 16 at the Key Decision Point A (KDP-A) event. A significant milestone for this next stage is that the official mission budget becomes available for use on July 1, Project Manager Andre Dress said.
- The primary instrument for this mission is named the Ocean Color Instrument (OCI), which will collect hyperspectral measurements from the ultraviolet to the shortwave infrared—a range that is broader than its predecessor satellite instruments, SeaWiFS, MODIS, and VIIRS—to examine and monitor how phytoplankton communities in the ocean are changing in space and time. The OCI will provide precise measurements of the ocean surface to allow researchers to see the concentrations of different phytoplankton communities all over the globe. The spectral range and resolution of the OCI design will substantially advance the ability to distinguish between different species of phytoplankton compared to predecessor satellite instruments.
- Phytoplankton play an essential role in ocean ecosystems. They are the base of the marine food chain and, like land plants, produce much of the oxygen we breathe and play a role in reducing atmospheric carbon dioxide levels. With growing concern about the impact of rising global temperatures on our oceans, PACE data will be used to unveil new information about changing patterns in phytoplankton composition and the emergence of potentially harmful algal blooms. Satellites that currently exist are adept at detecting algal blooms, but cannot unequivocally determine their composition - for example, if they are harmful to fish or can contaminate drinking water. The spectral range of OCI will help scientists figure out more about where blooms occur and how they are changing.
- The possible addition of a polarimeter, an instrument that could provide multi-angle polarized radiometric measurements to advance studies of aerosol particles and clouds, is currently under consideration by the PACE team. A polarimeter would allow improved measurement of atmospheric particle compositions that will ultimately improve observations of ocean color. Normally, roughly ninety percent of what an ocean color satellite instrument measures when over the oceans is the atmosphere, which has to be subtracted out to reveal the ocean signal.
- Ongoing field campaigns and the collection of data at sea provide critical information that helps scientists and engineers plan and design this new mission. For example, the North Atlantic Aerosols and Marine Ecosystems Study (NAAMES) campaign, which had its most recent deployment during May 2016, collected a wealth of information from both a ship and an airplane to validate satellite measurements and give a three-dimensional perspective that includes what's happening beneath the surface. "NAAMES is helping us answer fundamental questions we have about processes in the ocean," said PACE Communications Coordinator and scientist Stephanie Uz. "The measurements they and other field campaigns collect at sea contribute to PACE being a giant leap forward in ocean and atmosphere research."
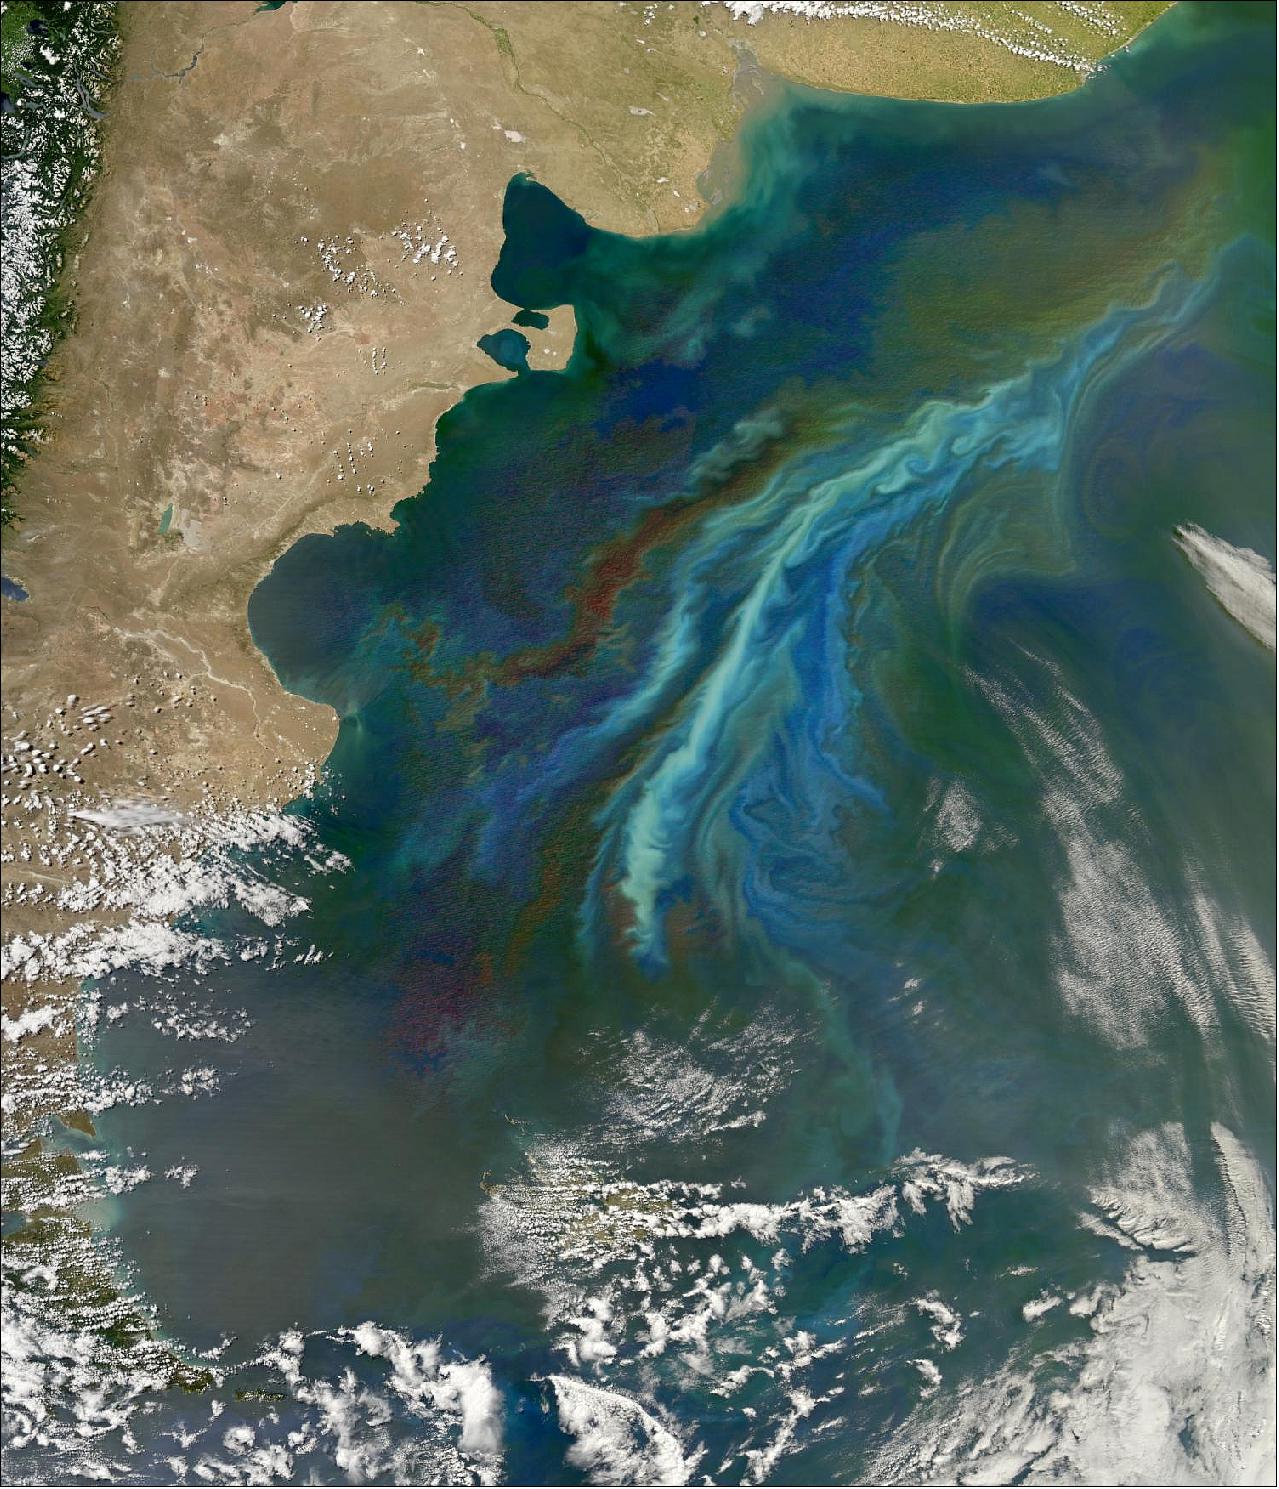
- All preliminary planning for PACE is currently being done at NASA's Goddard Space Flight Center. The unique information that this mission will provide, in combination with climate models, will allow for scientists to monitor the health of our oceans and their response to climate change like never before.
- "We are putting all this carbon dioxide into the atmosphere and causing oceans to be more acidic at the same time that the oceans are warming and coming under stress from a range of human activities," Uz said. "All of this is affecting the ocean in ways we don't fully understand... PACE will help us comprehend what we have now and how it is changing."
Sensor Complement
The primary science instrument for PACE is the Ocean Color Instrument (OCI) which is capable of measuring the color of the ocean from ultraviolet to shortwave infrared. In addition, PACE includes two polarimeters. Such instruments are used to measure how the oscillation of sunlight within a geometric plane - known as its polarization - is changed by passing through clouds, aerosols, and the ocean.
Parameter | OCI | HARP-2 | SPEXone |
Spectral range (bandwidth) | 342.5 - 887.5 @ 5 nm steps (5 nm) | 440, 550, 670 (10 nm) & 870 nm (40 nm) | 385-770 nm @ 2-4 nm step |
Shortwave infrared (OCI)/Polarized | Seven bands centered on 940, 1038, 1250, 1378, 1615, 2130 & 2260 nm | All | Same range in 15 to 45 nm step |
Number of viewing angles (º) | Fore-aft tilt ±20º to avoid sun glint | 10 for 440, 550, 870 nm & 60 for 670 nm (spaced over 114º) | Five (-57º, -20º, 0º, 20º, 57º) |
Coverage (swath width) | ±56.5º [2663 km at 20º tilt | ±47º (1556 km at nadir) | ±4º (100 km) |
Days for global coverage | 1-2 | 2 | About 30 |
Ground sample distance | 1 km at nadir | 3 km | 2.5 km |
Institution(s) | NASA/GSFC | University of Maryland – Earth and Space Institute | SRON Netherlands Institute for Space |
OCI (Ocean Color Instrument)
The PACE Ocean Color Instrument (OCI) builds on a firm foundation of ocean color observations at NASA that includes a 17-year continuous record of satellite ocean color observations, and many more years of experience (see graphs below). The CZCS (Coastal Zone Color Scanner), launched in 1978 onboard Nimbus-7, was the first instrument that measured ocean color from space. Intended to be a “proof-of-concept” mission, CZCS did that—and much more. CZCS observations ceased in 1986, but research continued for many years thereafter that laid the groundwork for the missions that followed.
OCI collects hyperspectral measurements from the ultraviolet to the shortwave infrared-a range that is broader than its predecessor satellite instruments, SeaWiFS, MODIS, and VIIRS - to examine and monitor how phytoplankton communities in the ocean are changing in space and time. The OCI provides precise measurements of the ocean surface to allow researchers to see the concentrations of different phytoplankton communities all over the globe. The spectral range and resolution of the OCI design does substantially advancing the ability to distinguish between different species of phytoplankton compared to predecessor satellite instruments. 23)
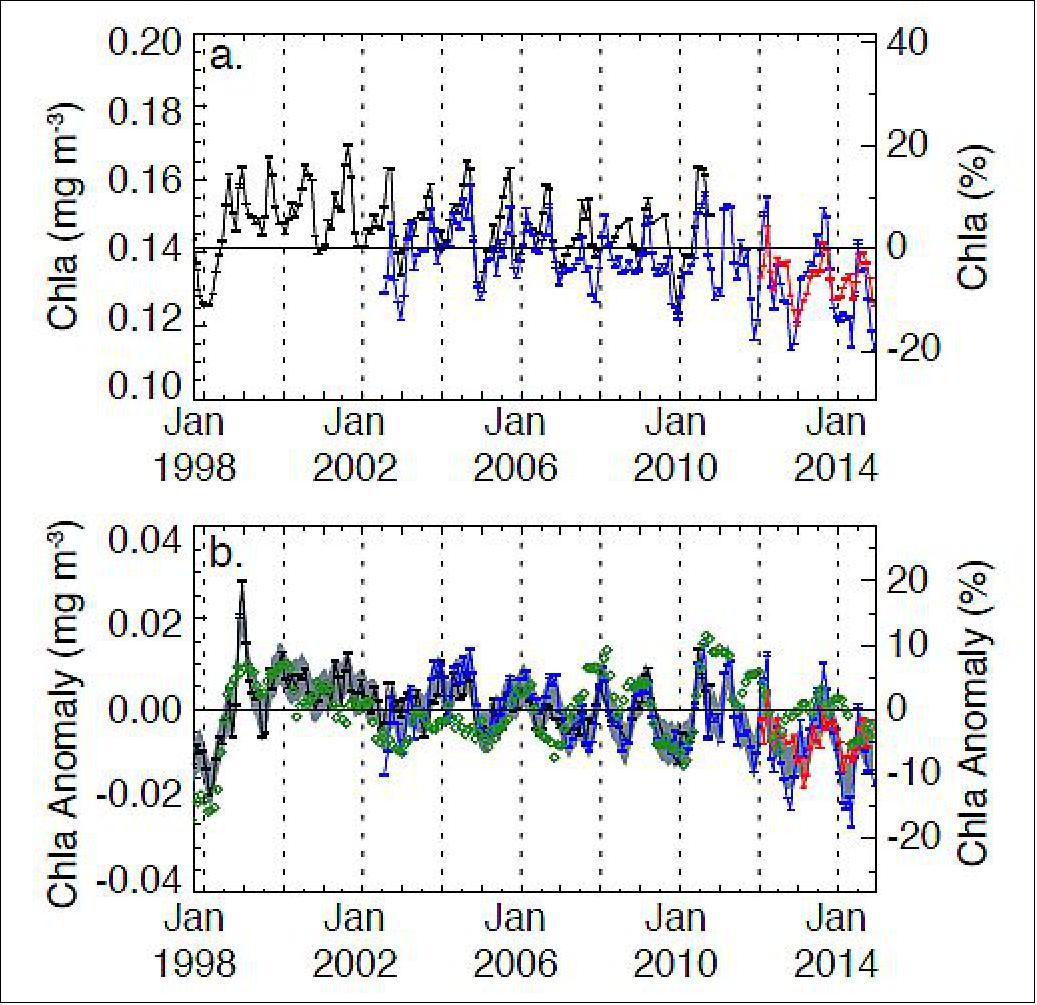
Legend to Figure 16: The top graph plots the independent record from each mission, with the multi-mission mean chlorophyll-a concentration for the region (horizontal black line). The bottom graph plots monthly anomalies after subtraction of the monthly climatological mean (SeaWiFS relative to the SeaWiFS climatology, and MODIS and VIIRS relative to their respective climatologies), with the average difference between SeaWiFS and MODIS-Aqua over the common mission lifetime (grey). The multivariate El Niño Southern Oscillation index is inverted and scaled(green diamonds) to match the range of the chlorophyll-a anomalies.
Instrument:
PACE's primary sensor, the OCI (Ocean Color Instrument), is a highly advanced optical spectrometer that is used to measure properties of light over portions of the electromagnetic spectrum. It enables continuous measurement of light at finer wavelength resolution than previous NASA satellite sensors, extending key system ocean color data records for climate studies. 24)
The color of the ocean is determined by the interaction of sunlight with substances or particles present in seawater such as chlorophyll, a green pigment found in most phytoplankton species. By monitoring global phytoplankton distribution and abundance with unprecedented detail, the OCI helps us to better understand the complex systems that drive ocean ecology.
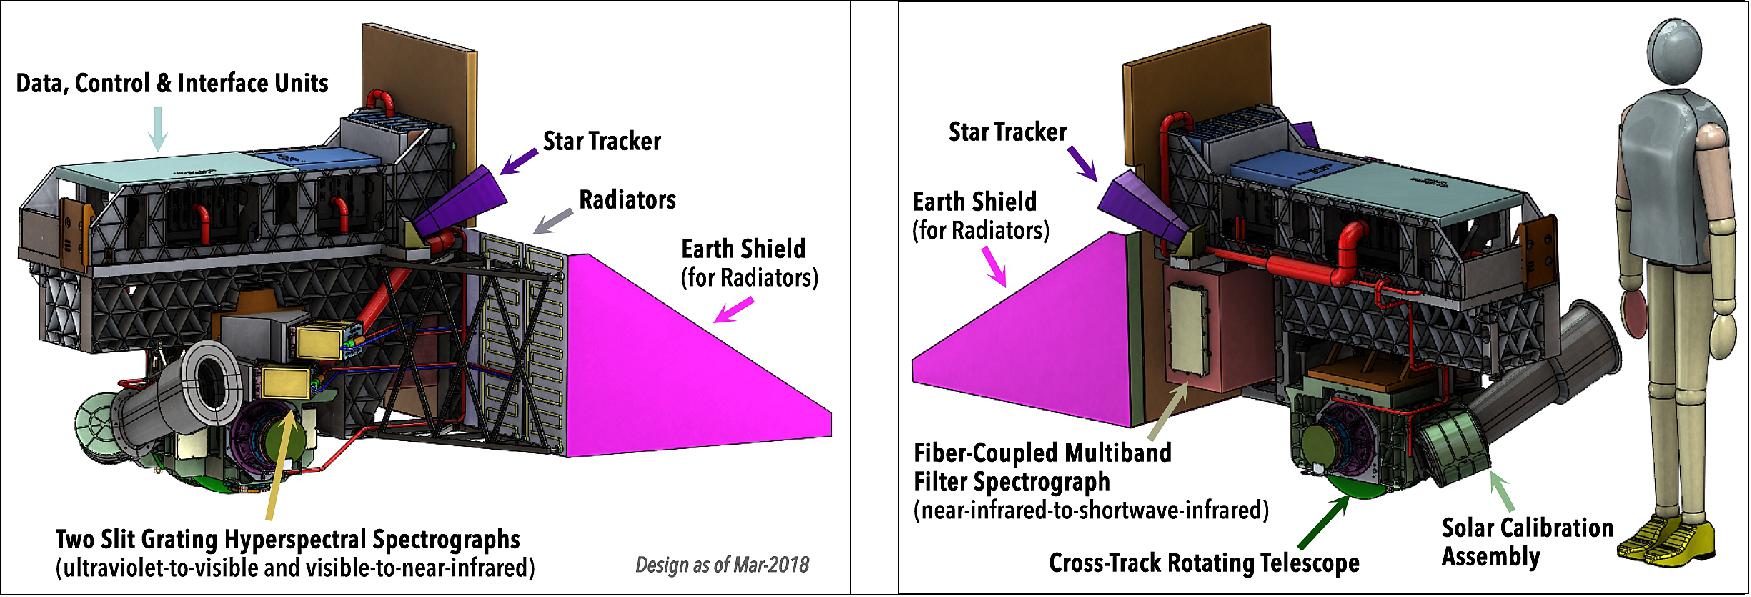
OCI has been built at GSFC. It consists of a cross-track rotating telescope, thermal radiators, along with half-angle mirror and solar calibration mechanisms. The OCI's tilt helps avoiding sun glint and single science detector design will inhibit image striping. Its signal-to-noise ratios will rival or exceed previous ocean color instruments.
The OCI features:
• Cross track, 360° continuous rotating telescope
• Two slit grating hyperspectral spectrographs (ultraviolet to visible & visible to near-infrared, NIR)
• Fiber-coupled multiband filter spectrograph (NIR-to shortwave-infrared)
OCI is a hyperspectral imaging radiometer whose continuous coverage extends from 340 to 890 nm in the ultraviolet (UV) to near infrared spectrum at 5 nm resolution (with bandwidth at 5 nm). The goal is to increase the spectral steps to 2.5 nm (with bandwidth remaining at 5 nm), which was confirmed at the PACE Critical Design Review in Winter 2019/2020. It also includes 7 discrete bands from 940 nm to 2260 nm in the shortwave infrared (SWIR) spectrum. Like SeaWiFS, OCI will perform a tilt maneuver every orbit at approximately the sub-solar point to avoid Sun glint reflected off the ocean, looking 20° north (fore) in the northern hemisphere and 20° south (aft) in the southern hemisphere.
The OCI telescope scans from east to west at a rotation rate of 5.77 Hz, acquiring Earth view data at a 1 km x 1 km ground sample footprint at nadir and an angular range of ±56.5° for a ground swath width of 2663 km. The OCI fore optics design follows that of SeaWiFS, with a rotating telescope, a half angle mirror, and a depolarizer that is transmissive (rather than reflective as with CZCS and SeaWiFS). Dichroics – material which splits visible light into distinct beams – direct the light to three different focal planes: 1) a blue spectrograph (340-605 nm) with wavelength separation via grating and light detection using a CCD; 2) a red spectrograph (600-890 nm) using the same approach; and 3) SWIR detection assembly with wavelength separation using dichroics / bandpass filters and light detection via semiconductor devices that convert light into an electrical current, known as "photodiodes."
Mass | 241 kg |
Power | 275 W |
FOV (Field of View) | 0.08º along track and 1.42º cross track |
Coverage | 2-day global coverage at 1 km resolution. |
UV to NIR | Hyperspectral radiometry from the ultraviolet (340 nm) to near-infrared (890 nm). Bandwidth at 5m resolution and spectral steps of 5 nm (with the goal of increasing the spectral steps to 2.5 nm). |
SWIR bands | Shortwave (SW) infrared (IR) bands include: 940, 1038, 1250, 1378, 1615, 2130, and 2260 nm. |
Calibration | Total calibration of instrument artifacts <0.5% at top-of-atmosphere. Daily and monthly solar calibrations using onboard solar diffusers like those used on MODIS. Bi-monthly lunar calibrations. |
The OCI builds on the ORCA (Ocean Radiometer for Carbon Assessment) prototype. Its SWIR detection assembly uses a new approach that guides light to individual detection units via fiber optic cables. These specialized photodiodes employ alloys of indium gallium arsenide (InGaAs) and mercury cadmium telluride (HgCdTe). A subset of SWIR bands and the red spectrograph have been evaluated as part of engineering test unit development in preparation for the OCI’s Critical Design Review. Subsequently, the flight unit that includes all spectral channels was built at GSFC.
ORCA is a prototype of an advanced ocean biology/biogeochemistry satellite sensor. The concept development began in 2000 with the eventual fabrication of a functional bench top instrument completed in 2013. The prototype development was supported by NASA/GSFC with the actual fabrication and testing conducted under two consecutive grants (three years each) funded through the NASA ESTO/IIP (Earth Science Technology Office/Instrument Incubator Program).
HARP-2 (Hyper-Angular Rainbow Polarimeter-2)
Global, consistent, and accurate measurements of our atmosphere and surface are extremely important to climate studies. Measurements from space allow us to understand how clouds and aerosols, for example, affect the way the Earth system distributes energy. Clouds and aerosols interact with shortwave and longwave radiation differently, but also interact with each other in complicated ways. Aerosols are well-known cloud and ice condensation nuclei, and play a direct role in cloud brightness, lifetime, and onset of precipitation, as compared to clean scenes . Aerosols can also dry out the local atmosphere, which evaporates smaller cloud droplets. Therefore, aerosols can both inhibit and promote cloud development, depending on ambient conditions. Aerosols scatter and absorb solar and terrestrial radiation with an efficiency that depends on the aerosol composition, shape, size, and other optical properties. Their direct effect on radiation and indirect effect on cloud development are difficult to decouple and it is currently unknown how these processes will change as our globe warms. Therefore, connecting microphysical and radiative processes of clouds and aerosols are amongst the most uncertain, critical gaps in our climate knowledge. Remote sensors play a significant role here: they are capable of near-daily global coverage, and use a mixture of spectral channels, sensitivity to intensity and polarization, and spatial and angular resolution to characterize optical and reflective properties of our atmosphere and surface. 25)
To narrow uncertainties related to climate change, we need highly accurate, comprehensive measurements of our atmosphere and surface that can:
• improve our climate models at relevant scales,
• maintain continuity and accuracy of measurement between like-instruments, and
• increase retrieval information content and simultaneously reduce biases in the measurements.
There is a strong interest in the climate community for instruments capable of measuring the same target from multiple angles and at narrow resolution, with sensitivity to intensity and polarization, and a wide swath. Several upcoming missions, like the NASA PACE (Plankton-Aerosol-Cloudocean Ecosystem), demonstrate how new remote sensing technologies can address these needs and improve how we currently study our climate. 26)
At the Earth and Space Institute at the University of Maryland, Baltimore County (UMBC), in collaboration with NASA Goddard Space Flight Center (GSFC), we designed and developed the Hyper-Angular Rainbow Polarimeter-2 (HARP-2), a wide FOV, multi-angle polarimetric imager specifically for these purposes. HARP-2 is an optimized version of the HARP CubeSat instrument, a standalone payload that will fly in the orbit of the International Space Station (ISS) for a year-long mission, starting in November 2019. The HARP-2 concept was first demonstrated by AirHARP, an aircraft demonstration of HARP technology, in two NASA field campaigns in 2017: the LMOS (Lake Michigan Ozone Study) in the summer and the ACEPOL (Aerosol Characterization from Polarimeter and Lidar) in the fall.
HARP-2 and the hyperspectral polarimeter, SPEXone, 27) are contributed instruments to the PACE mission and follow do-no-harm requirements, relative to the primary payload, the Ocean Color Instrument (OCI). 28) Mission success is defined by the OCI, a hyperspectral radiometer, whose datasets are used to derive optical properties of chlorophyll-sensitive species in the ocean and ocean color. Even so, the addition of both polarimeters will improve OCI measurements, in the sense that their measurements can help remove the atmosphere and surface from OCI ocean data. 29)
Molecular scattering, aerosol, cloud, and surface reflectance are major sources of contamination a typical top-of-atmosphere (TOA) signal. Because these constituents give off strong signals in polarized light and at particular geometries, HARP2 and SPEXone can characterize the atmosphere at both high angular and spectral resolution and clear the remainder of the TOA signal for OCI ocean retrievals. Demonstrating HARP-2 measurement, in synergy with SPEXone and OCI, also will improve algorithm and technology development, and measurement requirements for future space missions, such as the NASA Aerosol-Cloud-Convection-Precipitation (A&CCP) project. 30)
HARP-2 (Hyper-Angular Rainbow Polarimeter-2)
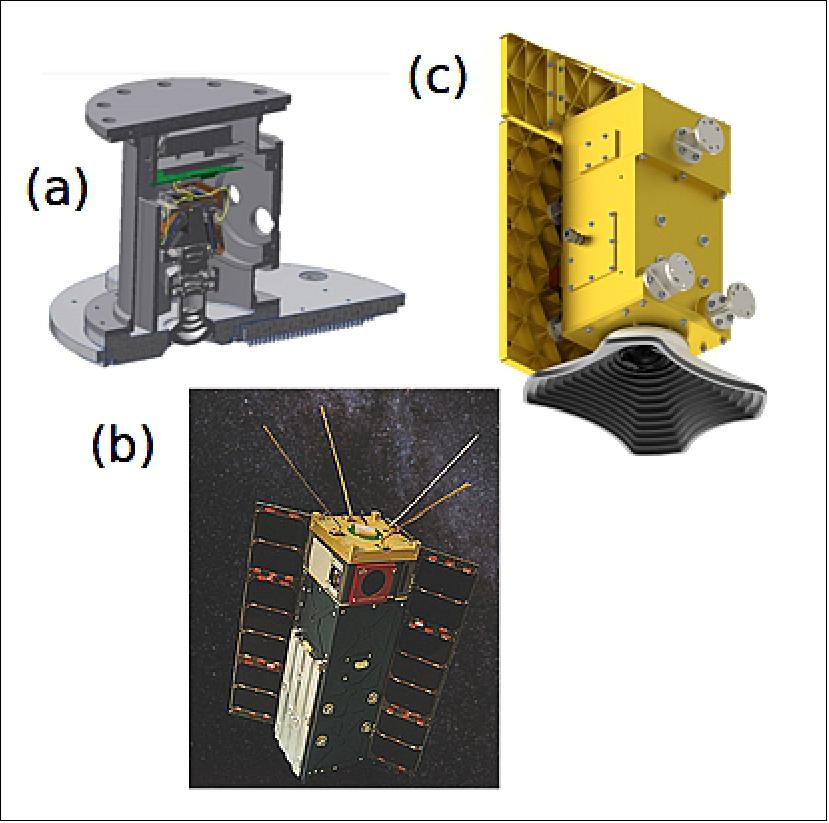
The HARP-2 instrument, as shown in Figure 18c, carries over much of its design from AirHARP (Figure 18a) and HARP CubeSat (Figure 18b) with notable differences for optical performance and space operation. During an observation, scattered sunlight enters the HARP-2 wide FOV front lens. This light travels through a telecentric optical train and reaches a Phillips prism, which decouples the light into three unique linear polarization states. Each state passes through one final polarizer before reaching a CCD detector. The polarizers in front of each detector differ at minimum by 45° in transmission axis (0, 45, 90°). Because the prism splits one optical beam into three detectors, the images are spatially identical. The information captured in a co-located pixel between all detectors can be used to retrieve the first three parameters of the Stokes vector: the total intensity (I) and linearly polarized components (Q, U).
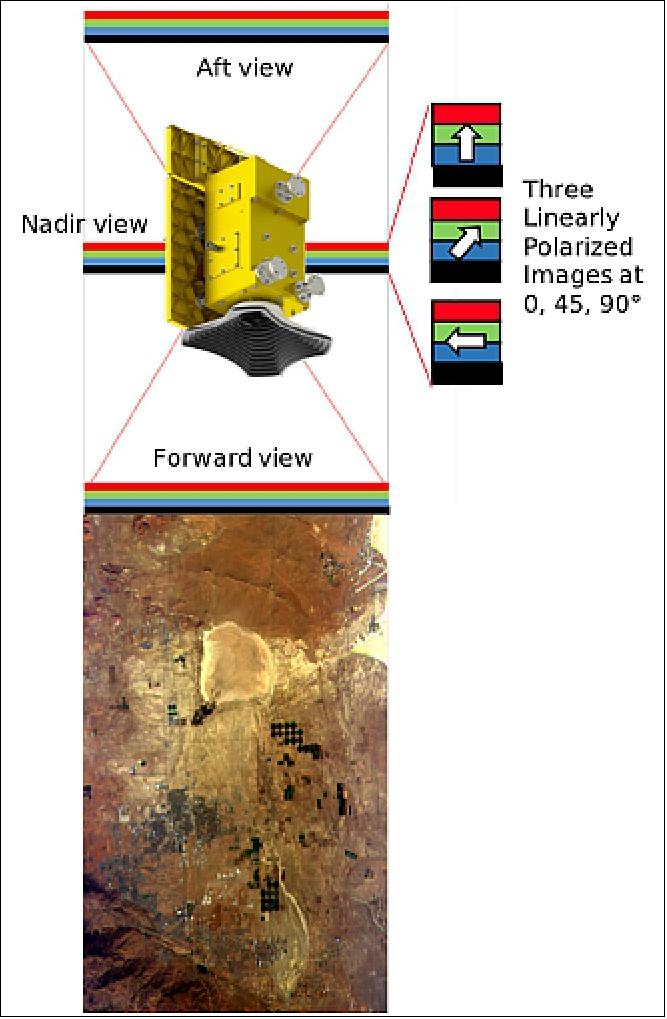
Over the detector surface, a stripe filter selects the wavelength and viewing angle of every pixel. The stripe filter identifies 120 distinct rows of the detector, called view sectors, that correspond to unique entry apertures at the HARP-2 front lens and four visible wavelength channels, given in Table 4. On-orbit, only 90 view sectors save the data, due to limited data storage, though the instrument still retains the capability to use all 120 view sectors, if desired. Table 4 outlines the spectral and polarization specifications and Table 5 gives geometric and orbital values for the HARP-2 mission.
Nominal Wavelength (nm) | Bandwidth (nm) | # Along Track View Sectors | Polarized |
440 | 14 | 10 | Y |
550 | 12 | 10 | Y |
670 | 18 | 60 | Y |
870 | 37 | 10 | Y |
Parameter | km | degree (º) |
Orbit altitude | 676 |
|
Orbit inclination |
| 98 |
Nadir pixel resolution | 0.7 |
|
Nadir binned resolution | <6 |
|
Cross track swath | 1556 | 94 |
Along track swath |
| 113 |
On-orbit, HARP-2 acquires data at a minimum two frames/second, though this could have increases during development to improve measurement signal-to-noise. During these exposures, all 90 view sectors capture information, which are assembled into single-angle pushbrooms, as shown in Figure 19. All pushbrooms observe the same scene on the ground, however, a single pushbroom represents that scene as observed by a single view sector. All pushbrooms are registered to a common grid, meaning that any pixel in common to all or a subset of the views represents the same target on the ground. Therefore, one can reconstruct the multi-angle scattering profile of the target from a single pixel; this profile encodes information on DSDs (Droplet Size Distributions), aerosol optical properties and loading, molecular scattering, and land and ocean surface reflectance distributions. 31) 32) 33)
The mixture of wide swath, polarization, and multi-angular sampling allows HARP-2 to image the atmosphere far from the nadir track with the spatial and angular resolution to capture processes at climate-relevant scales. HARP-2 also anticipates 2-day global coverage.
HARP-2 has several advancements that improve calibration traceability, measurement accuracy, and stray light avoidance, as compared to AirHARP and HARP CubeSat. Because AirHARP is sub-orbital, and HARP CubeSat can fly in the ISS orbit (400 km), neither instrument sees the sun during normal operation. The PACE satellite, on the other hand, is higher in altitude above the Earth and can fly in a polar orbit. Therefore, the HARP-2 front lens could directly see the sun at the northern and southern terminators, if not properly blocked. We developed an aluminum baffle to block tangent solar rays in these orbit locations and prevent stray light in general, as shown in Figures 18c and 19. A stair-step design on the lens-facing side reduces particle contamination, and the baffle is coated white on the outside to minimize absorption. The front lens is also coated with a UV-resistant layer, such that if the solar rays ever enter the science FOV, optical darkening is avoided. Even so, the PACE spacecraft team has evaluated a new, in-frequent spacecraft maneuver that can provide HARP-2 a direct solar view for radiometric calibration and flatfielding. HARP-2 includes an onboard diffuser, mounted to a bi-stable shutter at the aperture stop, that are used to view the sun safely during these events.
On-Orbit Operations
A day-in-the-life for HARP-2 consists of acquisition, calibration, standby, and data transfer to the spacecraft. During the acquisition mode, HARP-2 takes binned images of the daylit portion of the Earth and saves them to on-board storage on the instrument. The HARP-2 instrument begins acquisition 11 minutes before the northern terminator and finish 11 minutes after the southern terminator to ensure the daylit portion of the orbit is captured with full-angular coverage. After acquisition finishes, the science FOV is entirely in eclipse. Here, the instrument performs dark calibration: the dark arm of the shutter engages and several reference images are taken at the same resolution as acquisition. The instrument then transitions to standby, a low-power mode that prepares for data transfer to the spacecraft. HARP-2 only transfers data during eclipse, due to a 10 Mbit/s limitation on the spacecraft. Also, OCI and SPEXone transfer their data to the spacecraft during the daylit portion of the orbit. After data transfer, the instrument then returns to standby, before starting the next acquisition 11 minutes before the next terminator crossing. All of these modes and their timing are defined by periodic commands sent to the spacecraft from ground stations.
In-frequent operation modes include alignment, lunar and solar calibration. These modes require special acquisition settings that increase data volume, so they are not performed daily. Figure 20 shows the different areas of the HARP-2 FOV that are targeted by these calibration modes. The alignment mode, for example, requires a full-size, full-resolution image of a heterogeneous target, like a coastline or major city, in order to co-align the image content of the three detectors. The image content is cross-correlated and the relative alignment, along-track and cross-track, is found using one of the sensors as a reference. Our algorithm, previously tested on AirHARP data, finds translational and rotational offsets at the pixel level. The relative alignment is therefore known to less than a pixel. This is important for polarization accuracy, as misalignments could create “false polarization” when the polarization information from each detector is combined. This effect is particularly significant along edges and sharp features of the Earth’s surface. The alignment verification occurs weekly and only a few images of the Earth are required each time.
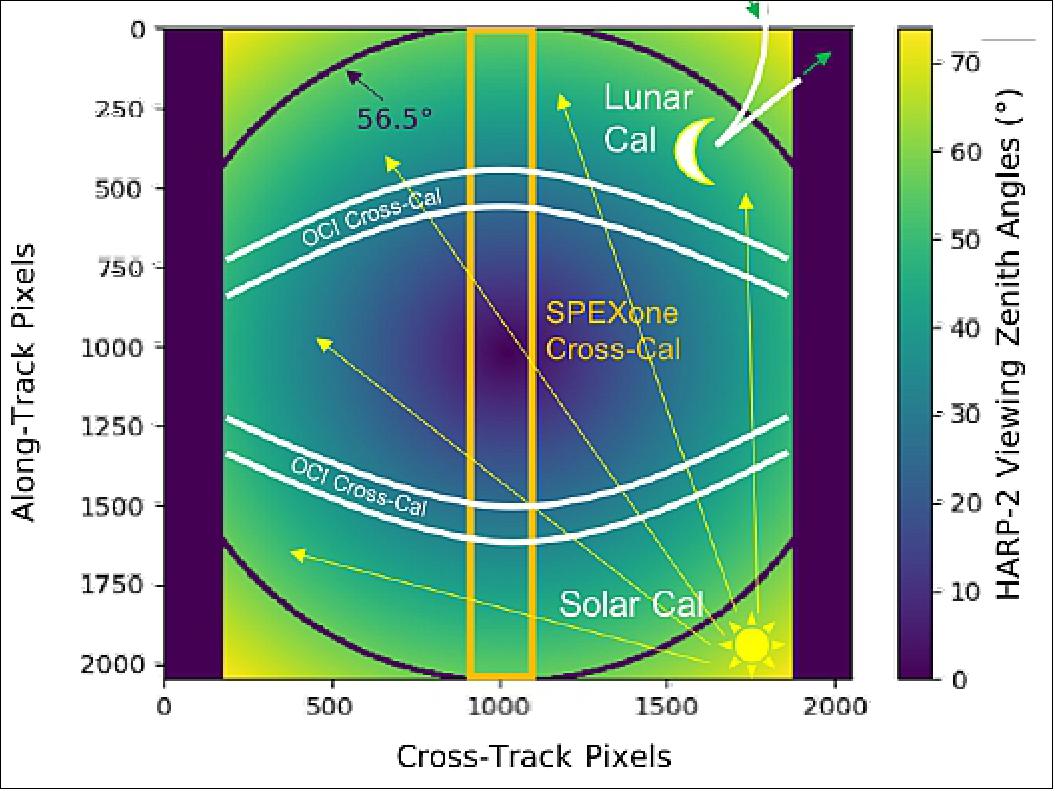
Once a month, the PACE spacecraft performs a dedicated slew for a full-disk lunar calibration. The moon is a stable source of reflected sunlight in the full moon phase: the relative radiometric calibration of an instrument can be tracked and adjusted over the course of a mission with regular observations. During the maneuver, the spacecraft can slew across the lunar disk, before returning to nadir-pointing in preparation for the next daylit acquisition. The 0.5º lunar disk corresponds to a 10 x 10 pixel area on the HARP-2 detector, and is present in the HARP -2 FOV for a nine minute period during the slew. The curved line in the northeast corner of Figure 20 represents the size of the moon in the HARP-2 FOV and its trajectory during a typical slew. The moon enters at the top of the image and moves out the right-hand side, shown by the green arrows. In order to balance data content with data volume, HARP-2 bins fullsize full-resolution images during the calibration. This calibration is important for relative trending of the HARP-2 calibration in off-nadir sectors of the sensor.
Similarly, the PACE spacecraft can slew once daily from nadir-pointing to the sun, for is not enough for HARP-2 to observe the sun, so a second, dedicated slew for HARP-2 is currently in development. If approved, it would occur weekly, right before the northern terminator crossing of a typical orbit. In the proposal, the spacecraft slewed to the sun and HARP2 acquired binned images, same as the acquisition mode, for 30 seconds, before the spacecraft slewed back to nadir-pointing. The current plan is for the sun to target the very corner of the HARP-2 FOV, as in Figure 20. The on-board diffuser shutter covers the boresight and spread solar light homogeneously to all FOVs. This process serves three purposes: radiometric calibration, flatfield, and polarization validation. The sun is a well-known radiometric standard, and spreading its light to all pixels allows us to adjust calibration coefficients during the mission. Since the diffuser creates a homogenous field, we can also study the pixel-to-pixel relative response and use this dataset to correct any internal scattering artifacts in the images. Finally, diffusers strongly depolarize light, and so this measurement is also a quick check on how well HARP-2 can retrieve low DOLP signals across the FOV. This calibration may become monthly based on HARP-2 calibration stability and mission risk.
Calibration and Validation
Telecentric Calibration: The HARP-2 instrument performs various calibration activities before and after it is integrated onto the spacecraft. Some traditional tests on imaging cameras include background correction (dark captures), detector alignment, non-linear response, and spectral calibration. These are typical of remote sensors and will not be detailed here; these are described in ancillary documentation for AirHARP translate exactly to HARP-2. 34)
Detector flatfielding is one of the most crucial HARP-2 calibration tests. The HARP-2 sensor is telecentric in the image space: rays arrive at the detector at 0° angle-of-incidence (AOI). This means that there are no focus- or AOI-related artifacts present in the images, at any pixel, within engineering tolerances. The flatfield represents the entire internal optical performance of the HARP-2 sensor and can be used to transfer a calibration performed at nadir to all FOVs. This telecentric technique allows traceability for every pixel in the FOV. Also, this allows for efficient field calibrations during aircraft campaigns, and cross-calibration at the pixel-level with SPEXone and OCI on the PACE spacecraft.
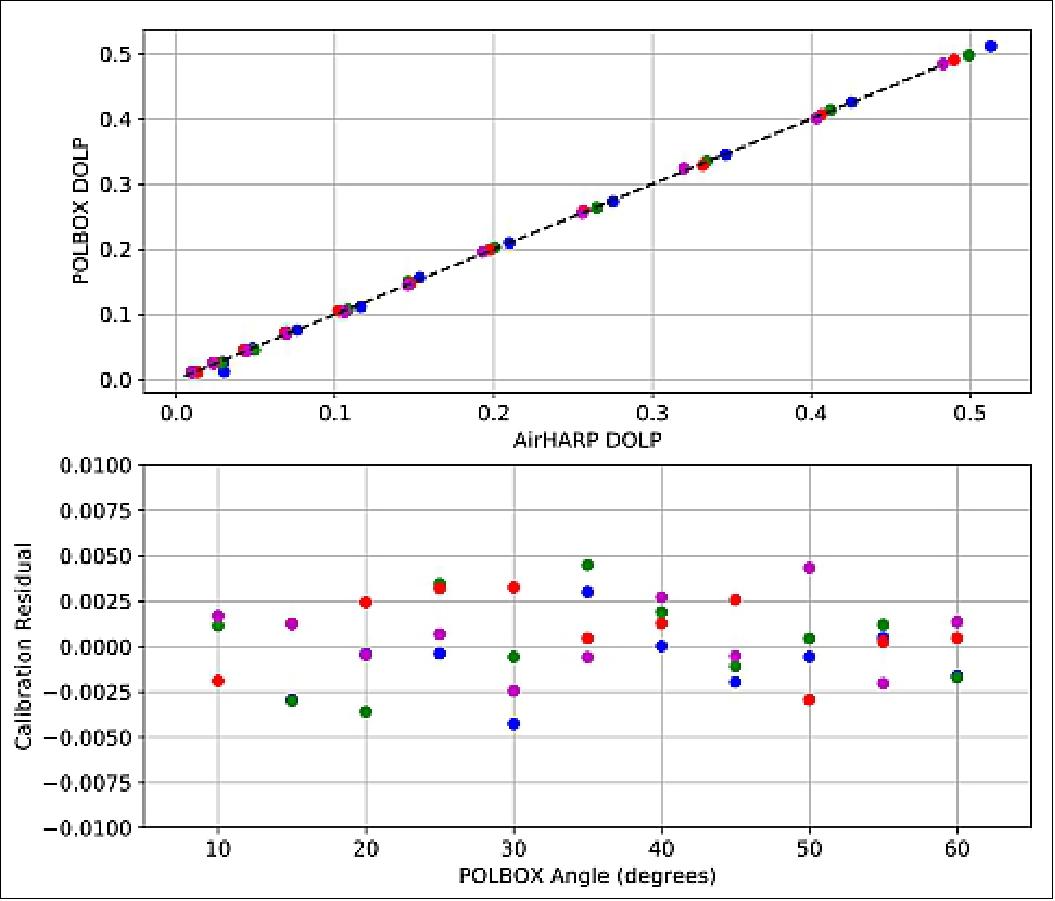
For AirHARP and HARP CubeSat, calibration coefficients are derived at nadir using input from a rotating wire-grid polarizer, which is placed at the aperture of an integrating sphere. An integrating sphere is a proper depolarizer, and so placing a linear polarizer in its aperture transforms ~0% polarization to ~100%. Rotating this polarizer at discrete angles changes the distribution of Stokes parameters Q and U, while maintaining the overall DOLP (Degree Of Linear Polarization). In this way, HARP-2 is exposed to a representative set of fully polarized Q and U states. A calibration matrix that translates between detector counts and Stokes parameters can be derived using least-squares method on this dataset. This process is done for each wavelength for a set of nadir pixels, and translated to all FOVs using the detector flatfield. This technique is very powerful: calibration coefficients are found for each pixel in the FOV, only by performing a flatfield and a set of polarized measurements over a small set of nadir pixels. In space, this same process can be done vicariously using a HARP-2 solar cal with the diffuser activated and a cross-calibration with SPEXone over several co-incident targets. In any event where a flatfield and a polarization measurement across several Q and U states is possible, the HARP-2 sensor calibration can be adjusted and validated. We currently estimate the polarization accuracy of AirHARP and HARP CubeSat at 0.5% in DOLP, as shown in Figure 21, and 5% in radiance; the addition of the HARP-2 on-board calibrator will likely provide traceable <0.5% DOLP and 3% radiance uncertainties.
Intercomparisons with co-incident instruments
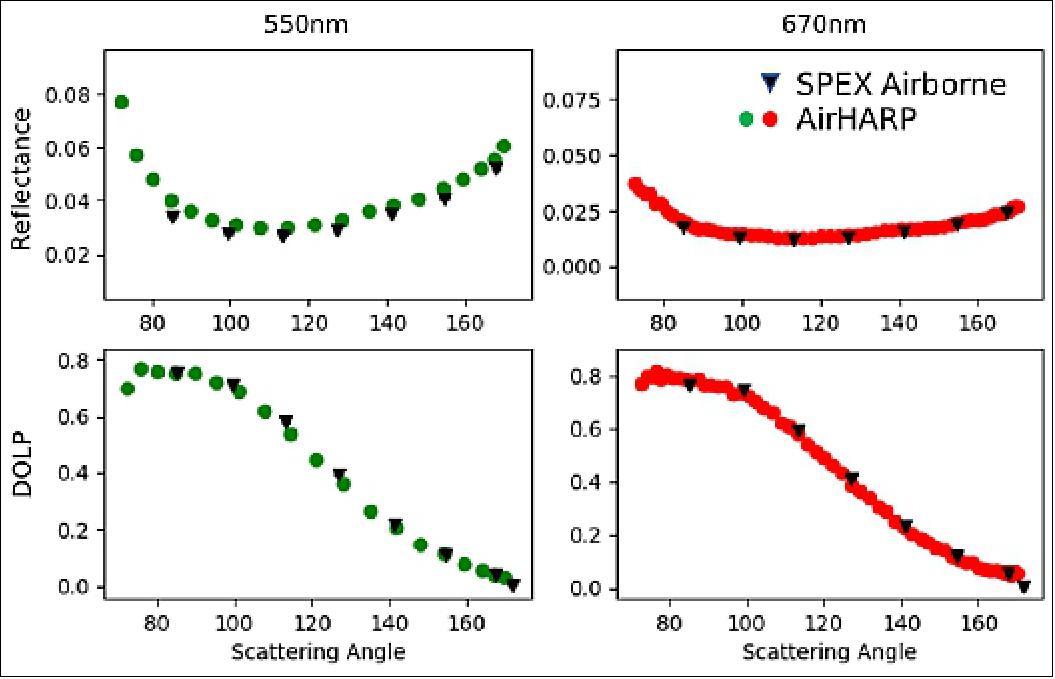
To validate our full FOV calibration, we intercompare multi-angle, polarized HARP-2 data with other multi-angle polarimeters. During the NASA ACEPOL campaign, AirHARP flew on the high-altitude NASA ER-2 with RSP (Research Scanning Polarimeter), AirMSPI, 35) and SPEX Airborne (Ref. 27) polarimeters, along with two lidars: the High-Spectral Resolution Lidar-2, 36) and the Cloud Physics Lidar. 37) The campaign achieved many targets of opportunity, including sunglint, marine stratocumulus clouds, cirrus, flat desert, AERONET (AErosol RObotic NETwork) sites over cities and water, and prescribed aerosol plumes. Over all of these targets, the six instruments were co-incident, which provided an excellent dataset for intercomparing total and polarized radiances. This opportunity is especially important for HARP-2 (and AirHARP) because it can verify the telecentric technique with flight data.
Figure 22 shows an example of a reflectance and DOLP intercomparison against the SPEX Airborne during ACEPOL, for the 550 and 670 nm wavelengths. This intercomparison was performed over sunglint on the Pacific Ocean strait between Los Angeles and the Santa Catalina Island on October 23, 2017 at 21:30 UTC. In this example, AirHARP matches SPEX Airborne in intensity and DOLP within 1% at each measurement point for 550 and 670 m. Figure 22 shows that our telecentric technique properly translates a nadir calibration to all FOVs. This result is promising for the HARP-2 sensor on PACE: cross-calibrations with SPEXone and OCI over natural targets can be used to adjust HARP2 coefficients throughout the mission. A publication on the overall AirHARP calibration scheme, intercomparisons with other polarimeters during ACEPOL, and implications for HARP CubeSat and HARP2 is in preparation.
Examples of cloud, aerosol, and land surface retrievals
Spatial maps of the cloud droplet size distribution The polarized, co-located, multi-angle sampling of the HARP-2 instrument enables detailed study of cloud optical properties, beyond what current radiometric satellite instruments can achieve alone. When the wavelength of sunlight is on the order of the droplet size at cloud top, a powerful interaction occurs between the sunlight and the droplet. Light scattered by the droplet in the backward direction is highly polarized and creates an oscillatory structure in scattering angle, as shown in Figure 23b. This signal, called the polarized cloudbow, encodes the droplet size, or effective radius (CDR), and breadth of the droplet size distribution, or effective variance (CDV), of the cloud target. 38)
The CDR determines the location of oscillatory maxima with scattering angle and the CDV (Cloud Droplet effective Variance) defines their amplitude. The polarized cloudbow signal is so robust that discrete measurements of the oscillation can be fit to a unique Mie simulation in CDR and CDV. 39) HARP-2, with its co-located, hyper-angular coverage, can retrieve the CDR (Cloud Droplet effective Radius) and CDV of a cloud target at narrow resolution and over a wide spatial field. HARP2 is the first polarimeter to date, excluding AirHARP and HARP CubeSat, with this capability.
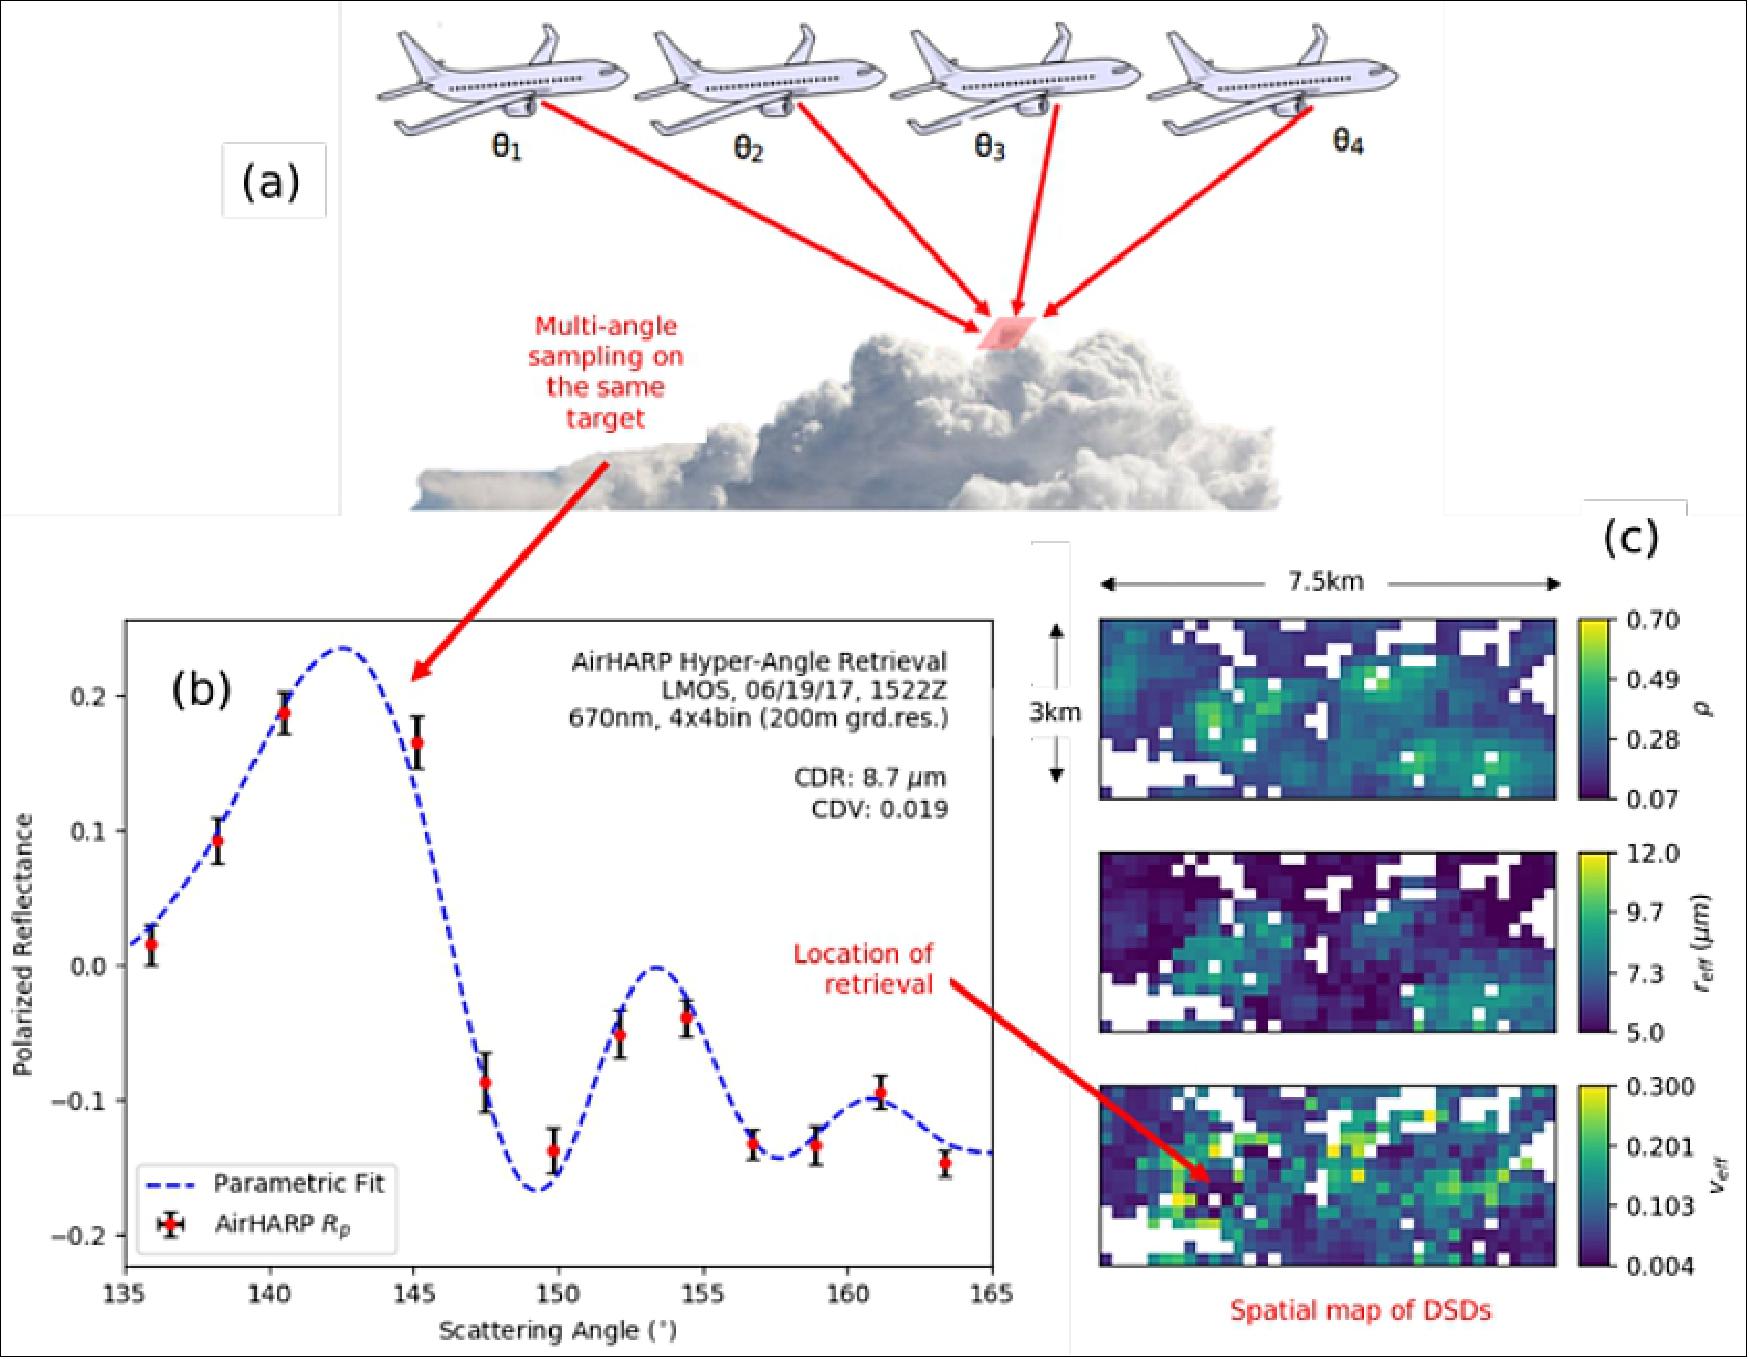
AirHARP observed a stratocumulus cloud field during the NASA LMOS campaign at 15: 22 UTC on June 19, 2019. This cloud field aligned close to the solar principal plane, which allowed excellent geometry on the cloudbow. For any gridded pixel with access to cloudbow scattering angles between 135-165º, a DSD (Droplet Size Distribution) retrieval was performed. This retrieval created spatial map of CDR and CDV from all suitable pixels. Figure 6 shows the spatial distribution of intensity, CDR, and CDV retrieved from this dataset at 200 m superpixel resolution. The intensity image closely represents how we would see the cloud field with our eyes, and so we can use the differences in brightness to define cloud cores (brighter) and periphery areas (darker). With this in mind, intensity and CDR trend together, with larger droplet sizes corresponding to brighter cloud cores. The CDV, however, tends to anti-correlate with intensity and CDR in cloud cores and periphery. We find larger CDV on peripheries and smaller CDV in the cloud cores. This result agrees with large-eddy simulations of similar cloud fields 40) and these spatial maps have the potential to expose microphysical processes across the field, thanks to broad spatial context and narrow <1 km retrieval resolutions. HARP CubeSat and HARP-2 continue this retrieval capability forward at resolutions <6 km from space. These resolutions are better suited for intercomparisons with spaceborne sensors, like MODIS and VIIRS, that also retrieve cloud droplet size properties at similar grid sizes. However, the larger pixels may obscure more of the microphysics and variability as compared to the resolution of AirHARP measurements from aircraft. McBride et al. (2020) explores this AirHARP cloud study in further detail.
Polarimetric information can also be used to discriminate between liquid and ice phase, based on the strength of cloudbow oscillations compared to the structureless profile from irregular ice particles. This retrieval could be enhanced by the wide swath, hyperangle coverage of HARP2, which may improve upon prior studies of ice asymmetry by RSP 41) and jointretrievals of cloud thermodynamic phase between POLDER and MODIS. 42)
Aerosol microphysical retrievals with GRASP
Aerosol optical and microphysical properties can also be retrieved using the information from multiangle, polarimetric HARP-2 observations. We make use of the inversion algorithm called GRASP (Generalized Retrieval of Aerosol and Surface Properties) to retrieve aerosol and surface properties at the pixel-level. 43) This inversion methodology has been demonstrated using the AirHARP observations during the ACEPOL 2017 campaign. We use all AirHARP spectral bands and their multi-angle measurements in the retrieval. Stokes parameters I, Q, and U are corrected for atmospheric gas absorption using the technique mentioned in 44). Gas absorption is mainly due to four atmospheric gases: CO2, CH4, O3, and NO2, which have the greatest impact to the retrieval in the 550 nm and 670 nm bands. Absorption at different atmospheric layers due to these gases are calculated using the UNL-VRTM testbed. 45)
We retrieve the aerosol particle size distribution, real and imaginary part of the particle refractive index, information on the shape of the particle (sphere fraction) by minimizing the error between observed and modelled variables (I, Q/I. and U/I). This method is done for each spectral band separately and uses a priori assumptions about the aerosol and surface properties. AOD (Aerosol Optical Depth), single scattering albedo (SSA), and angstrom exponent (AE) are also derived. Figure 24 shows an example of a prescribed smoke plume, measured by AirHARP over the Grand Canyon in Arizona, USA during the 2017 NASA ACEPOL campaign. Each pixel in Figure 24a has a resolution of 400 m, which were aggregated into 1.2 km superpixels before entering the GRASP retrieval process. We assume, within each retrieval box, that the aerosol optical properties vary smoothly and the surface properties may vary significantly.
Figure 24b shows the GRASP AOD retrieval of this scene using the AirHARP 440 nm band. This example is unique because it contains regions of very high and low aerosol loading over complex terrain.
For the case of surface parameters, GRASP must assume a surface model for every target, which provides an estimate of the directional reflectance. Therefore, GRASP simultaneously retrieves both the surface parameters and aerosol optical properties at the superpixel gridbox. For a detailed description on the surface models used in GRASP, one can refer to Dubovik et al. (2011) 46) and Litvinov et al. (2010). 47) For all the AirHARP retrievals, we make use of different surface BRDF (Bi-directional Reflectance Distribution Function) and BPDF (Bi-directional Polarized reflectance Distribution Function) models based on the ground target. The GRASP algorithm has been tested and verified using a variety of AirHARP observations during ACEPOL 2017, and we anticipate using GRASP in the same way for future HARP-2 aerosol and surface retrievals.
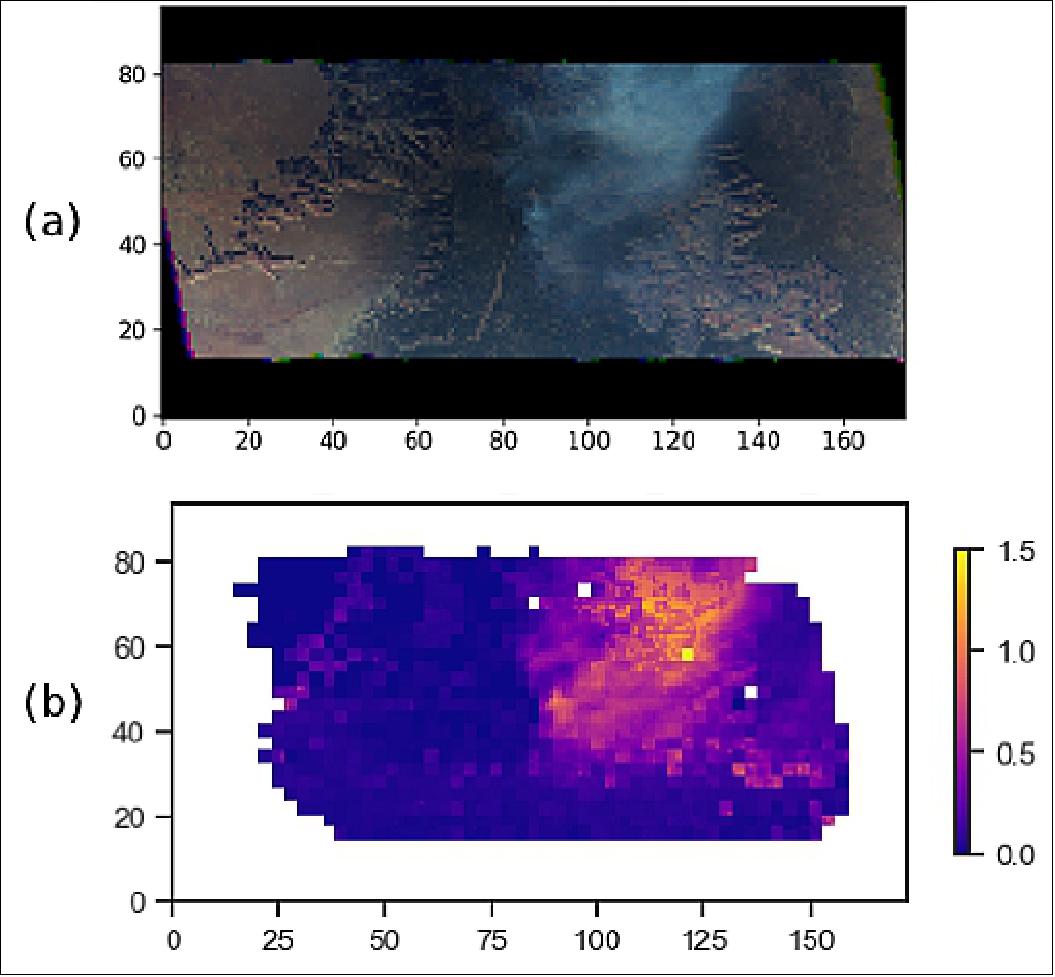
Bi-directional reflectance distribution (BRDF/BPDF) measurement of land and ocean surfaces
The anisotropic total and polarized reflectance of a terrestrial surface are often characterized by the bidirectional reflectance and polarization distribution functions (a.k.a. BRDF and BPDF). The measurement of BRDF and BPDF of terrestrial surfaces are important for determining
surface albedo and characterizing leaf area index and biophysical information about the land surface [37,38].
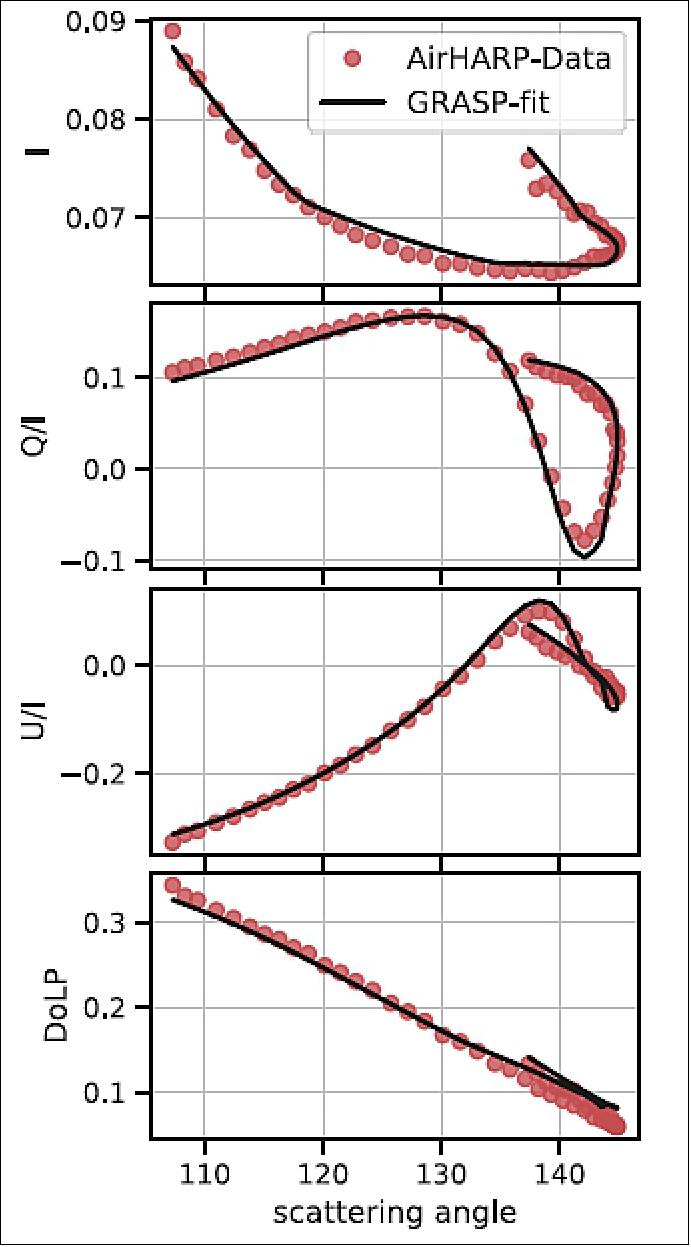
A variety of semi-empirical BRDF and BPDF kernels have been developed. In real applications, these kernels are often used singly or linearly combined to form a BRDF or BPDF model.48) For instance, the GRASP algorithm described in the above section uses a combination of several BRDF and BPDF models. It is important to evaluate different models in remote sensing for both surface and atmospheric retrievals, especially those developed from multi-angular backscatter and/or polarimetric measurements.49) The unique hyper-angular polarimetric capability of
HARP-2 allow us to observe the same location from up to 60 angles, which is critically useful for characterizing surface BRDF and BPDF. In an ongoing effort, the total and polarized surface bidirectional reflectance factors (BRF) are characterized using AirHARP measurements over the California Rosamond Lake area during the NASA ACEPOL campaign. With the UNL-VRTM radiative transfer model,50) we can characterize this surface after performing atmospheric correction. The derived surface BRFs are used to evaluate common BRD and BPDF models, including the Ross-Li, Rahman-Pinty-Verstraete BRDF, and the Maignan BPDF models. The results provide a useful guidance for surface reflectance assumptions in aerosol retrieval algorithms that use multi-angle polarimetric data as input.
In summary, HARP-2 is a contributed instrument to the NASA PACE mission, and though it follows a do-no-harm philosophy, its measurements will greatly improve the ability of the other PACE instruments, SPEXone and OCI, to measure the optical properties of the atmosphere and ocean.
HARP-2 stands out from other modern polarimeter concepts due to its wide swath, hyperangular coverage on the same target, narrow ground resolution, and 2-day global coverage from space. These advancements are supported by frequent lunar and solar calibrations, an on-board diffuser shutter, and constant co-incidence with SPEXone and OCI. These advancements also allow highly resolved retrievals of liquid water cloud DSDs, aerosol optical properties and loading, land surface reflectance, and atmospheric correction coefficients. In the case of clouds, the hyper-angular, wide swath measurement provides the foundation for spatial maps of cloud droplet effective radius and variance for HARP-2 resolutions of <6 km.
AirHARP DSD retrievals from a heterogeneous stratocumulus cloud field during the NASA LMOS campaign demonstrated narrow retrieval resolution is needed to understand the scale and correlation between intensity, CDR, and CDV for cloud core and periphery regions. These correlations may directly connect microphysical and radiative processes, but more study is needed, both from aircraft and space platforms. For aerosols, the multi-angle measurements from four HARP-2 wavelengths can be used with the GRASP algorithm to retrieve optical properties such as refractive index, single-scattering albedo, and land surface reflectance at the superpixel level. Aerosol retrievals using GRASP on HARP-2 data, especially in the vicinity of clouds, are anticipated. The multi-angle HARP-2 sampling also improves studies of BRDF and BPDF of the Earth’s land surface and ocean. The HARP-2 FOV can access a broad scattering angle range, which may extend into forward scattering angles (<90º) for some observations. These angles are typically inaccessible to narrow FOV instruments and HARP-2 measurements may improve the fidelity of current BRDF/BPDF models at these angles.
HARP-2 670 nm channel, with 60 views on the same pixel, also provides a nearly uninterrupted scattering profile of any target. This angular sampling is also useful for stereogrammetry: when comparing the parallax of the same target viewed from at least two angles, the altitude of a cloud top, aerosol layer, or surface feature can be derived. We can use HARP-2 data to make topographic maps of atmospheric or surface features and support the geolocation of SPEXone and OCI datasets.
HARP-2 represents a significant advancement in remote sensing of our atmosphere. With the launch of the PACE mission in 2024, the same retrieval concepts applied here on AirHARP data have the potential to connect cloud and aerosol microphysical properties to global radiative forcings. HARP-2 datasets, along with AirHARP and HARP CubeSat, provide strong science rationale for including high-resolution, hyper-angle imaging polarimetry on future Earth science space missions.
SPEXone (Spectro-Polarimeter for Planetary Exploration)
SPEXone is a concept satellite instrument that measures the characteristics of aerosols in the earth's atmosphere with unparalleled accuracy for the purpose of climate and air quality research. SPEXone is developed by a consortium consisting of SRON (Space Research Organization Netherlands) and Airbus Defence and Space NL, supported by unique expertise from partner TNO. This initiative is a public-private partnership. 51)
Science Case:
The research that will be made possible using the SPEXone instrument addresses one of our biggest knowledge gaps in the area of climate and air quality. According to the latest report (2013) by the Intergovernmental Panel on Climate Change (IPCC), aerosols represent the biggest uncertainty in the understanding of radiative forcing caused by human activity (cooling versus warming). Furthermore, this missing knowledge has important and yet unknown consequences for the interaction between air quality and climate under the conditions of a changing climate and changing emissions.
With the signing of the Paris Agreement in 2015, the international community has recognized that climate change forms a global threat to societies and our planet and that urgent action is needed. Countries that are signatories to the agreement worked together on finding an effective answer to this problem with the aim of reducing emissions.
Besides the climate, emissions from fuels also have a major impact on our living environment; each year, half a million Europeans die prematurely due to particulate matter. These societal themes are reflected in the Dutch National Research Agenda. The many questions concerning climate that were posed by Dutch citizens during the compilation of the agenda have, for example, been consolidated in questions 7, 8, 9 and 119 of the Dutch National Research Agenda and connect with the themes people, environment and economy, and society and technology.
Laboratory, field and airplane tests have demonstrated that the measurement data SPEXone can collect are a world-class scientific quality and an order of magnitude more accurate than those of existing satellite instruments. This makes SPEXone an important addition to worldwide research into the climate and air quality.
Instrument concept:
SPEXone is an evolution of the SPEXlite instrument concept that was originally provided as part of the NASA PACE mission. SPEXlite is a spectro-polarimeter instrument that combines the high polarimetric accuracy (by means of the spectral modulation technology) of SPEX airborne with a large viewing angle and with high spatial resolution based on SPECTROlite airborne (which in turn has been derived from TROPOMI).
SPEXone takes the principles of SPEXlite and translates the original concept, which consists of five optical modules, into a single compact instrument with five viewing angles and two polarizations projected on a single detector. As a result of this, the viewing angle is reduced to 100 km, without any further concessions being made to the instrument's performance, making SPEXone a research instrument for groundbreaking aerosol climate research and a demonstration for groundbreaking aerosol air quality research.
Applications:
SPEXone is an instrument that provides experimental data aimed mainly at acquiring new knowledge about the fundamental aspects of aerosols and the effect these have on climate and health, without the intention of realizing a direct commercial application or a direct commercial use. In this way the consortium acquires the necessary insights that are important for taking the next step towards producing an application in the future.
NASA PACE mission:
NASA Goddard Space Flight Center asked the Netherlands to contribute to the PACE (Plankton, Aerosol, Cloud, Ocean Ecosystem) mission by means of SPEXone. The SPEXone measuring instrument can be launched as part of NASA’s PACE observatory. It could then fulfill the “A” in PACE. NASA covered the costs of the satellite platform, special provisions for placing the SPEXone instrument on the satellite platform, launching, and ground segment infrastructure.
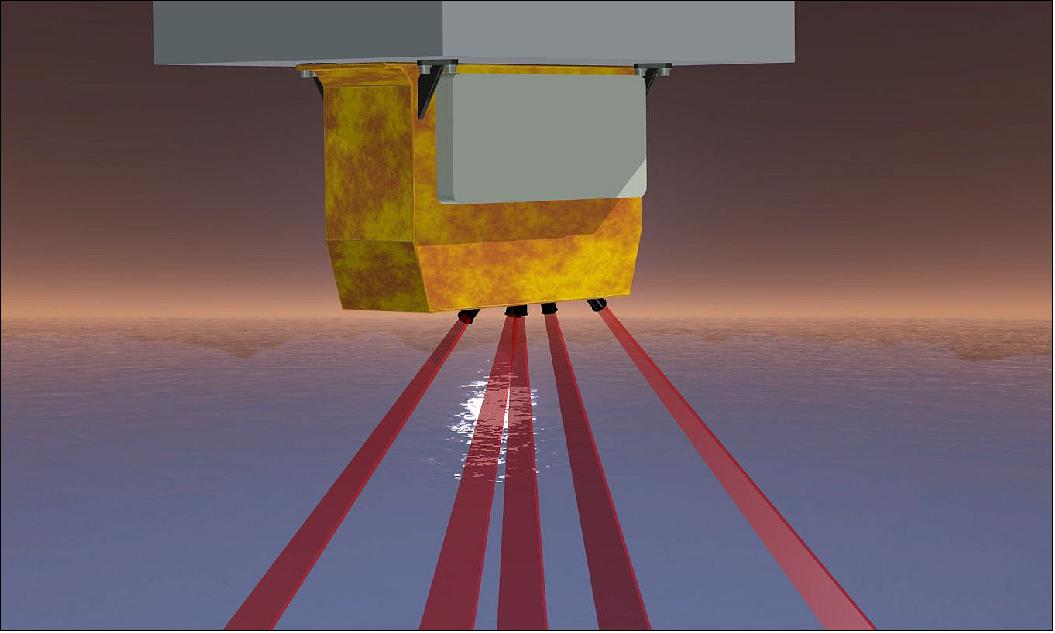
PACE's SPEXone instrument is a multi-angle polarimeter. It measures the intensity, Degree of Linear Polarization (DoLP) and Angle of Linear Polarization (AoLP) of sunlight reflected back from Earth's atmosphere, land surface, and ocean. The focus of the SPEXone development is to achieve a very high accuracy of DoLP measurements, which facilitates accurate characterization of aerosols in the atmosphere. 52)
Aerosols are small solid or liquid particles suspended in the air that affect climate directly through interaction with solar radiation. Aerosols affect climate indirectly by changing the micro- and macro-physical properties of clouds. According to the Intergovernmental Panel on Climate Change, aerosols are the largest source of error in quantifying the radiative forcing of climate change. SPEXone will enable measurements of optical and micro-physical properties of aerosols with unprecedented detail and accuracy.
Spectral range (resolution) | 385-770 nm (hyperspectral 2 nm) |
Number of viewing angles | 5 (-52º, -20º, 0º, 20º, 52º) |
Swath width | 9º (100 km) |
GSD (Ground Sample Distance) | 2.5 km2 |
Instrument heritage | AirSPEX |
SPEXone was developed by a Dutch consortium consisting of SRON Netherlands Institute for Space Research and Airbus Defence and Space Netherlands, supported by optical expertise from TNO. SRON and Airbus DS NL are responsible for the design, manufacturing and testing of the instrument. The scientific lead is in the hands of SRON. SPEXone is a public-private initiative funded by the Netherlands Space Office (NSO), the Netherlands Organization of Scientific Research (NWO), SRON, and Airbus DS NL.
SPEXone features:
• A compact three-mirror segmented telescope assembly (patented by the consortium) to gather light from 0°, ±20° and ±50° (at satellite level) and direct the light towards a common entrance slit of a spectrometer.
• Polarization Modulation Optics (PMO) to encode the state of linear polarization in the intensity spectrum as a sinusoidal modulation.
• A compact and lightweight all-reflective imaging grating spectrometer.
SPEXone Heritage
For the polarization modulation technique, SPEXone is based on heritage in ground-based and airborne applications. The spectral modulation technology was invented by the group of Prof. Keller (Leiden University) and has been further developed in the Netherlands through several national programs.
Major steps in this development have been the development, characterization, and field-testing (ground-based) of a SPEX Prototype (originally designed for a Mars orbiter) and the "upgrade" of the SPEX prototype into a stand-alone instrument, SPEX airborne, for operating on the high-altitude (21 km) NASA ER-2 research aircraft.
The spectrometer of SPEXone is based on Dutch heritage with the Sentinel-5 precursor TROPOMI instrument, its predecessor OMI, and the derived compact version SPECTROlite.
SPEXone Instrument
SPEXone is a very compact instrument that contains an intricate design. It is only 9 kg, and has a size of 37 x 28 x 15 cm3. The SPEXone design is based on a concept that maps the linear polarization state onto the spectrum, using passive optical components. This allows us to characterize the full linear polarization state for a scene instantaneously. This improves the polarimetric accuracy, compared to current space borne polarimeters that operate in selected wavelength bands and use rotating polarizers. SPEXone attains a polarimetric accuracy of 0.3%, which is critical for aerosol characterization. This enables us to distinguish, for example, anthropogenic from natural aerosol types. Moreover, the absence of moving parts simplifies the instrument. By virtue of being a partnered payload, the interface with the main platform is dealt with through a Do No Harm (DNH) approach. 53)
The SPEXone instrument is a multi-angle spectro-polarimeter with five viewing angles operating in the visual part of the spectrum, from 385-770 nm. A block diagram of the instrument is shown in Figure 27. A three-mirror segmented telescope assembly gathers light from 0°, ±20° and ±50° and directs the light towards a common entrance slit of a single spectrometer. Before and after the slit, several optical components are placed that together form the Polarization Modulation Optics (PMO) that encode the state of linear polarization in the intensity spectrum as a sinusoidal modulation. The polarizing beam splitter in the PMO results in two complementary light beams that both enter the spectrometer and are focused onto the detector as two pairs of five spectral images.

The spectrometer is based on Dutch heritage with the Sentinel-5 precursor TROPOMI instrument and the derived compact version SPECTROlite. 54) The SPECTROlite and SPEXone compact spectrometers are developed so that they can be flown on very small platforms.
The focal plane assembly is a detector module from 3Dplus that is equipped with a 2k x 2k CMOSIS CMV4000 CMOS (Complementary Metal Oxide Semiconductor) image sensor, a Microsemi FPGA, SDRAM and FLASH memory. This detector module enables image acquisition and processing with a high level of flexibility. In SPEXone advanced binning and co-addition capabilities are implemented. Due to this detector module functionality, the complexity of the ICU (Instrument Control Unit) can be kept limited. The main functions of the ICU are: receiving commands from the spacecraft, commanding the camera module, LED-calibration source control, collecting data from the camera module, gathering housekeeping data, transmitting science and housekeeping data to the spacecraft, and performing thermal control of the instrument.
The building blocks described above result in a very compact design, as shown in the one-to one mock in Figure 28, and an exploded view in Figure 29. The size of the instrument (including thermal hardware) is 365 x 282 x 151 mm3. The mass of the instrument is slightly below 9 kg, and the in-orbit average power consumption 16 W.
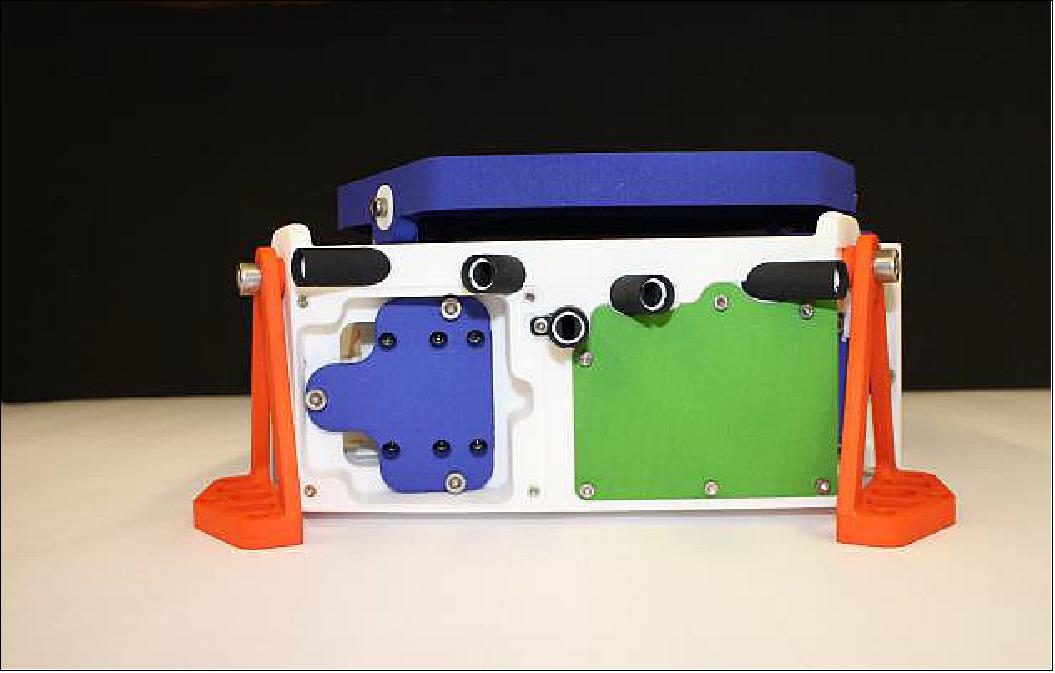
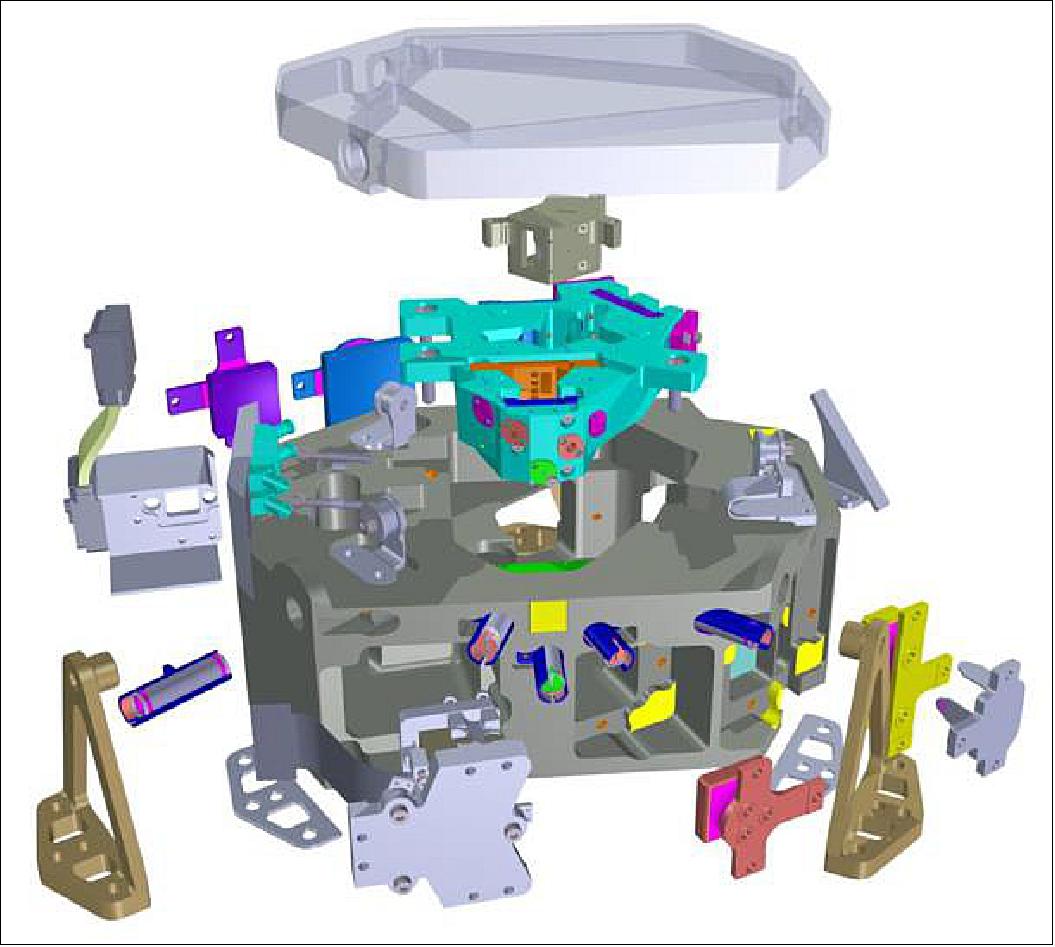
Design to Cost: SPEXone is the first instrument of its type to fly on a space mission. It is funded as a special program by the Netherlands Space Office, Netherlands Organisation for Scientific Research (NWO), and Airbus DS-NL and SRON themselves. It is developed as a valuable contribution to a science mission and it also acts as a learning project. What we want to establish is that:
• We can – as a Dutch consortium - independently build a TROPOMI quality optical payload at reduced cost
• We can demonstrate first SPEX-type instrument for aerosol in space
• We can build a Highly integrated and miniaturized Optical Payload that can be manufacturable as a recurring project
• We can build an instrument to lean (tailored) standard and processes that still fulfill the important quality objectives, but cuts down on unnecessary overhead.
One of the important boundary conditions of the SPEXone program is that the budget for developing, building, and calibrating the instrument is fixed. A fixed budget also implies a fixed, tight, schedule. Figure 30 shows the challenging time line for SPEXone. The green items are milestones already achieved.
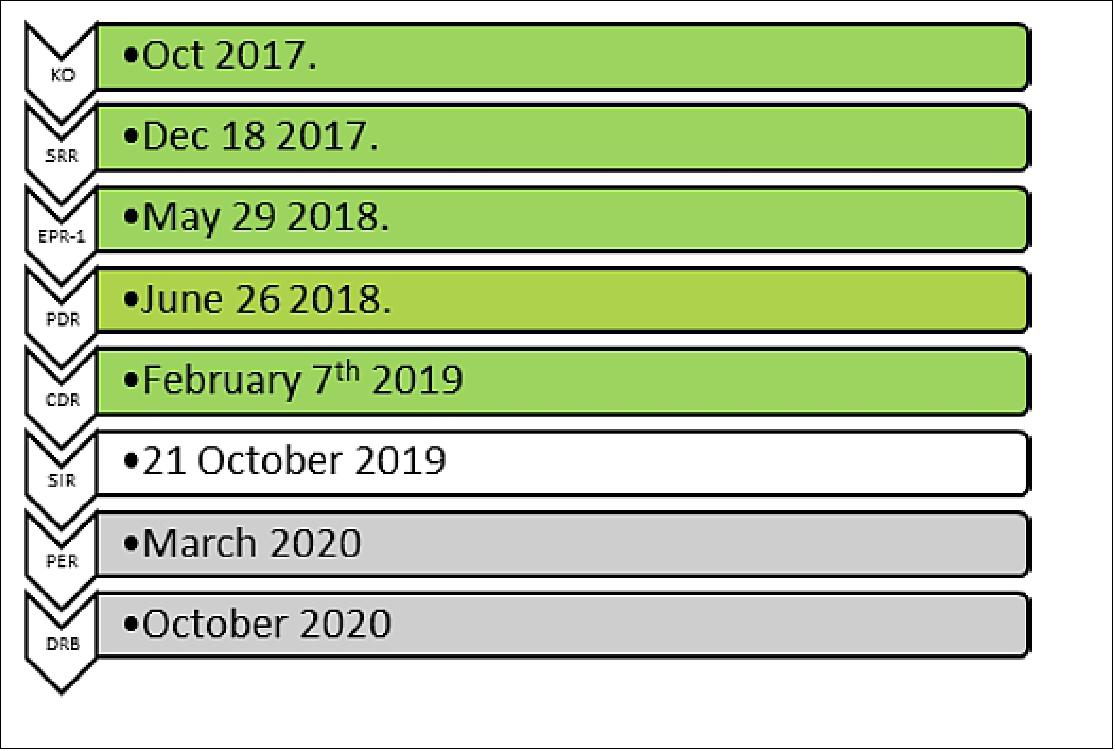
This tight schedule required a well-controlled but flexible process, captured by DTC (Design to Cost). The SPEXone instrument development and governance were organized to reach optimal performance within the boundaries of a DTC process.
This means that all elements of the instrument, other than the cost, are in the DTC trade space. The SPEXone project defines appropriate measures to remain within the DTC trade space while maximizing science capabilities.
There are a number of major contributors to a successful implementation of DTC. The first is short and efficient communication lines. For this, we have one particular advantage: the Netherlands is a small country. All major players in the SPEXone program are well within a 50 km radius from each other (Figure 31). This allows easy collocation and shifting of tasks between different locations and facilities.
There is a potential pitfall that within the instrument development team there are short communication lines, but the interface with spacecraft – with their team in the US – can become the bottleneck. This is partly solved by the scope of Do No Harm (see below), but more importantly by the implementation of a weekly tag-up videoconference between NASA and the SPEXone team.
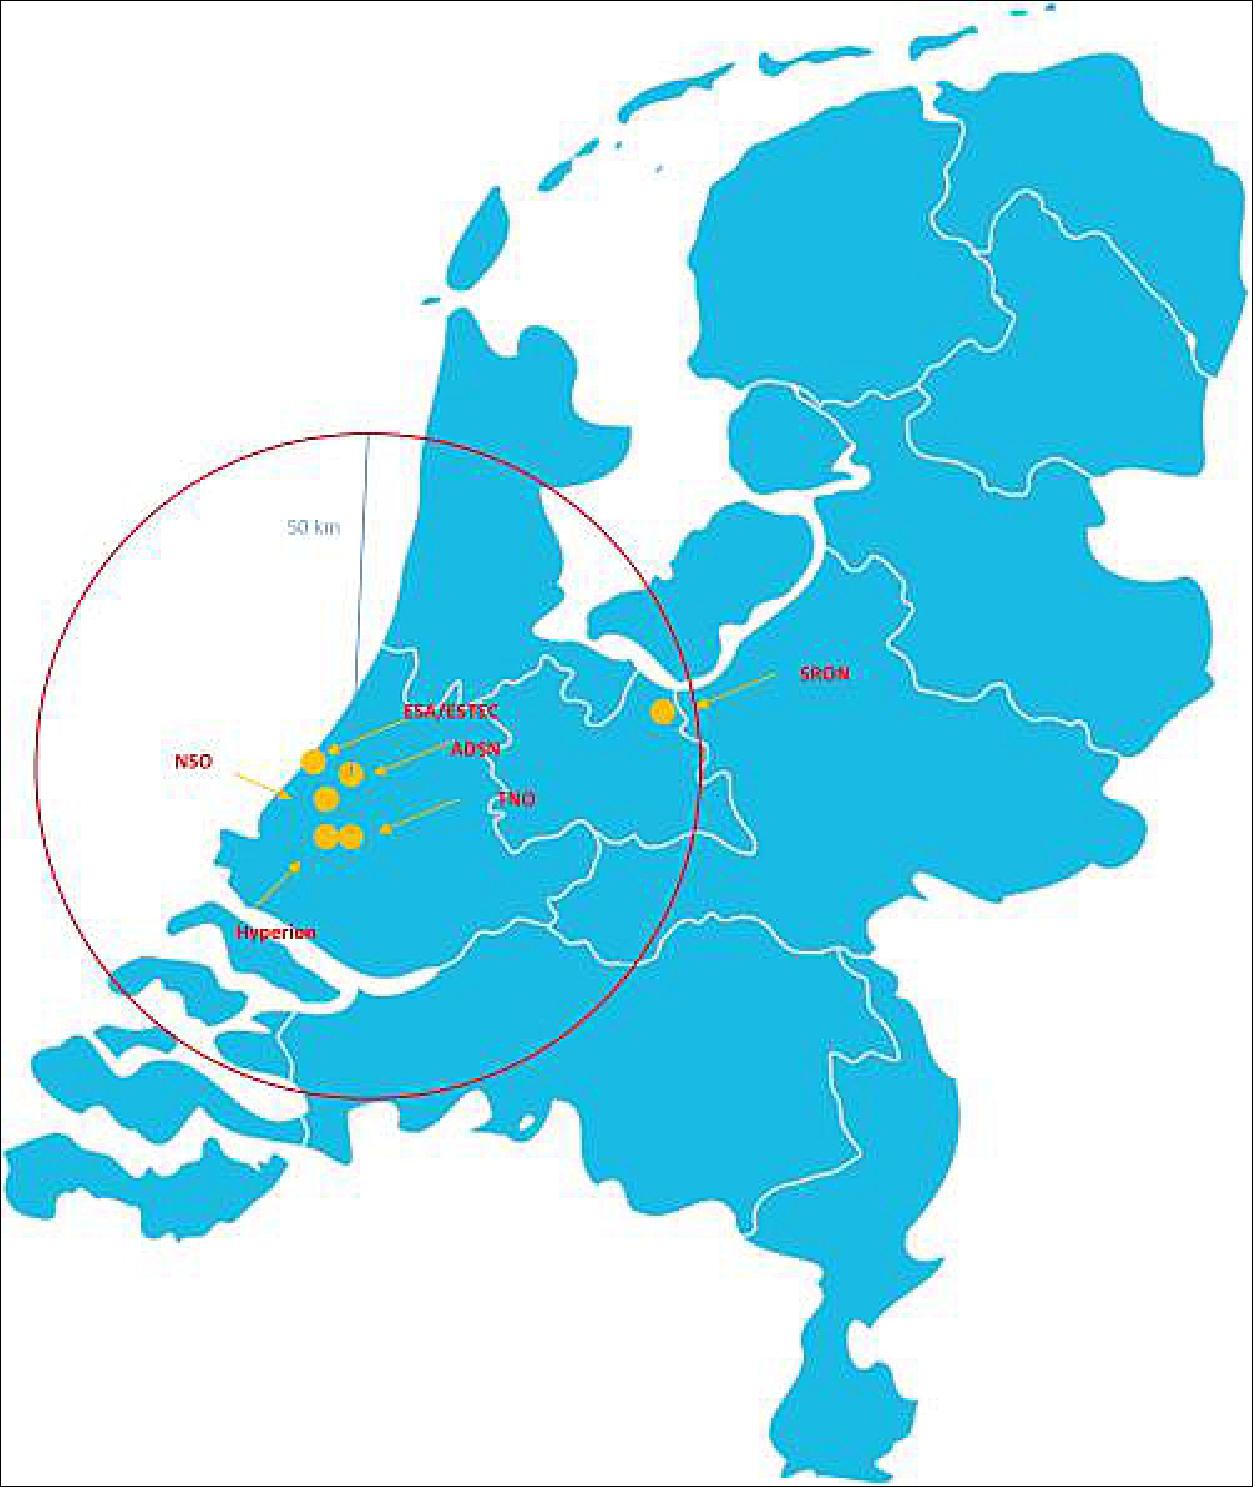
The second factor is requirements management. The SPEXone group writes and maintains its own TRS (Technical Requirements Specification). TRS contains performance requirements that are a copy of a (very limited) set of science requirements as laid down in the System Requirements Document, 55) and the Do No Harm requirements, as laid down in the NASA Agreements document (see next section). All derived requirements are under complete control of the team. This can go as far as discussing relaxations of science requirements – without going through a lengthy formal process. The SPEXone team and the Principle Investigator discuss the options directly, and jointly come to a way forward. This way forward can be started immediately, but in the end requires sanctioning by an independent body.
This is implemented by the presence of a SPEXone Steering Committee (StC), that consists of two Airbus DS NL and two SRON members including the Principle Investigator.
In practice, the number of times a relaxation needed to be discussed was very small, and very easily resolved. In the classic approach, it would have taken an order of magnitude longer to come to a conclusion. In addition the process ensures the perception of the instrument builder and PI alike that they are in it together. The instrument builder and PI can openly discuss and trade available margins on design and science requirements during instrument development, yielding the optimum science within cost.
A third factor is lean development and manufacturing; kept strictly to the minimum required functionality to fulfill the science goal. The Principle Investigator always remains in the loop. At the same time, the project makes sure that they maintain sufficient design margins and apply low technology risk solutions. This means that sometimes a choice is made to implement Commercial off the Shelve subsystems or subsystems composed of automotive grade parts, rather than state-of-the-art dedicated space applications.
Also, the test and calibration is done as much as possible in ambient conditions. SPEXone has been designed to operate with sufficient performance at 20 °C. Lower temperatures can yield a better performance, but at the cost of a more complex calibration campaign. This is a particular example where “good enough “is preferred over “better”.
Finally, we have learned to step away from the usual practice in institutional programs of requiring a large number of documents in specific formats, with lengthy documentation reviews. The project only makes documents which are considered beneficial to the program (taking into account the need to capture the design for posterity), in a form best suited for the subject, re-issued only when needed. Analysis reports were written and discussed as presentations. Procedural documents were combined and tailored.
Do No Harm
SPEXone is part of the PACE mission as a partnered payload. This means that NASA’s role (as mission prime) is to facilitate and guard the interface between SPEXone and PACE, together with the StC. The acceptability of the actual performance of the instrument itself is left to the StC.
The process for this type of payload has been captured by NASA as Do No Harm projects. These are defined as:
- Allowable technical risk is very high.
- There are no requirements to last any amount of time, only a requirement not to harm the host platform.
- No mishap would be declared if the payload doesn’t function.
The essential Requirements from S/C to SPEXone (and vice versa) are captured in a dedicated single document tailored to SPEXone; the PACE to SPEXone IRD (Interface Requirements Document). It not only specifies all relevant interface requirements, but also records the implementation of the interface. As the program progresses, the IRD evolves into a combined interface requirements and interface control document. All of the IRD requirements are traced to the SPEXone TRS, allowing proof that if the SPEXone Verification Control Document is accepted, then the interfaces automatically comply with the IRD.
Substantial effort has been spent on producing and reviewing the SPEXone interface Failure Mode Effects and Criticality Analysis (FMECA). Special attention was paid to cleanliness, propagation of electrical failures, and containment of mechanical failures. The results were discussed in two Engineering Peer Reviews, and found to be satisfactory.
Finally, we have kept the operational concept of SPEXone as simple as possible. Only standard commanding and data handling capabilities are required form the S/C. Failure detection and recovery are kept to a minimum. This allows easy end-to-end functional verification, saving time both in the SPEXone test phase and at S/C level.
References
1) P. Jeremy Werdell, Emmanuel Boss, Lorraine Remer, Brian Cairns, ”NASA Sets the PACE for Advanced Studies of Earth’s Changing Climate,” The Earth Observer, July-August, 2015, Volume 27, Issue 4, pp. 4-12, URL: http://eospso.nasa.gov/sites/default/files/eo_pdfs/July%20August%202015_col_508.pdf
2) Paula Bontempi, “State of the Program: NASA Ocean Biology & Biogeochemistry,” International Ocean Color Science (IOCS) Meeting, Darmstadt, Germany, May 6-8, 2013, URL: http://iocs.ioccg.org
/wp-content/uploads/1330-paula-bontempi-welcome-and-program-update-for-nasa.pdf
3) Carlos E. Del Castillo, “The Pre-Aerosol Clouds and ocean Ecosystem Mission PACE,” International Ocean Color Science (IOCS) Meeting, Darmstadt, Germany, May 6-8, 2013, URL: http://iocs.ioccg.org
/wp-content/uploads/1440-carlos-delcastillo-pre%E2%80%90aerosol-cloud-oocean-ecosystem.pdf
4) Steve Cole, Rani Gran, “New NASA Mission to Study Ocean Color, Airborne Particles and Clouds ,” NASA, Release 15-037, March 13, 2015, URL: http://www.nasa.gov/press/2015/march/
new-nasa-mission-to-study-ocean-color-airborne-particles-and-clouds/#.VQPn_eH-b_U
5) Carlos Del Castillo, Steve Platnick and the PACE Science Definition Team,”Pre-Aerosol, Clouds, and ocean Ecosystem (PACE) Mission Science Definition Team Report,” October 16, 2012, URL: http://decadal.gsfc.nasa.gov/PACE/PACE_SDT_Report_final.pdf
7) Paula Bontempi, “Pre-Aerosol, Clouds, and ocean Ecosystem (PACE) Science Team Meeting,” College Park, MD, Jan. 14-16, 2015, URL: http://decadal.gsfc.nasa.gov/PACE/
PACE_STM_01_2015/Presentations_day_1/PaulaBontempi_StatusOfPACE.pdf
8) Carlos E. Del Castillo, “The Pre-Aerosol Clouds and ocean Ecosystem Mission- PACE: Threshold and Goal Requirements for the Ocean Color Instrument,” PACE Science Team Workshop, College Park MD, Jan. 14-16, 2015, URL: http://decadal.gsfc.nasa.gov/PACE/
PACE_STM_01_2015/Presentations_day_1/CarlosDelCastillo_SDT.pdf
9) Steve Cole, Rani Gran, “New NASA Mission to Study Ocean Color, Airborne Particles and Clouds,” NASA Release 15-037, March 13, 2015, URL: http://www.nasa.gov/press/2015/march/
new-nasa-mission-to-study-ocean-color-airborne-particles-and-clouds/#.VQ52Y-H-b_U
10) Sara Blumberg, ”From the Netherlands to Maryland: SPEXone comes to Goddard,”
11) ”SPEXone is Good to Go!,” PACE News, 23 February 2021, URL: https://pace.oceansciences.org/news_more.htm?id=35
12) ”Dutch Minister Van Engelshoven: “SPEXone is good to go!”,” 23 February 2021, URL: https://www.spaceoffice.nl/en/news/452/
dutch-minister-van-engelshoven-spexone-is-good-to-go-.html
13) Jeremy Werdell, ”Keeping PACE with NASA's Plankton, Aerosol, Cloud, ocean Ecosystem mission,” NASA/GSFC, 18 January 2021, URL: https://www.youtube.com/watch?v=VFpcNbcQz0M
14) Jessica Merzdorf, ”A Walk Through the Rainbow with PACE,” NASA Feature, 17 July 2020, URL: https://www.nasa.gov/feature/goddard/2020/a-walk-through-the-rainbow-with-pace
15) ”NASA Ocean Ecosystem Mission Preparing to Make Waves,” NASA, 4 June 2020, URL: https://www.nasa.gov/feature/goddard/2020/
nasa-ocean-ecosystem-mission-preparing-to-make-waves
16) ”NASA Awards Launch Services Contract for PACE Mission,” NASA, 6 February 2020, URL: https://pace.oceansciences.org/news_more.htm?id=31
17) ” NASA Ocean Ecosystem Mission Moves Forward,” NASA Feature, 28 August 2019, URL: https://www.nasa.gov/feature/goddard/2019/nasa-ocean-ecosystem-mission-moves-forward
18) ”RUAG Space Delivers Navigation Receiver for NASA’s PACE Climate Mission,” RUAP Space Press Release, 10 April 2019, URL: http://spaceref.com/news/viewpr.html?pid=53938
19) ”PACE Mission,” NASA, 15 June 2018, URL: https://pace.oceansciences.org/mission.htm
20) Emmanuel Boss and Lorraine A. Remer, ”A Novel Approach to a Satellite Mission’s Science Team,” NASA, 12 February 2018, URL: https://eos.org/science-updates/a-novel-approach-to-a-satellite-missions-science-team
21) ”NASA's PACE mission will uncover new information about health of our oceans,” NASA/GSFC, 21 July 2016, URL: https://phys.org/news/2016-07-nasa-pace-mission-uncover-health.html
22) ”NASA Awards Launch Services Contract for Earth Science Mission,” NASA Goddard Contract Release C20-004, 4 February 2020, URL: https://www.nasa.gov/press-release
/nasa-awards-launch-services-contract-for-earth-science-mission
23) ”PACE will help uncover new information about health of our oceans,” Space Daily, July 21, 2016, URL: http://www.spacedaily.com/reports/
NASAs_PACE_Mission_Will_Uncover_New_Information_About_Health_of_Our_Oceans_999.html
24) ”Ocean Color Instrument,” NASA, URL: https://pace.oceansciences.org/oci.htm
25) Brent A. McBride, J. Vanderlei Martins, Anin Puthukuddy, Xiaoguang Xu, Roberto Fernandez Borda, Henrique M. J. Barbosa, Otto Hasekamp, and Lorraine A. Remer, ”The Hyper-Angular Rainbow Polarimeter-2 (HARP2): a wide FOV polarimetric imager for high-resolution spatial and angular characterization of aerosol and cloud microphysics,” Proceedings of the 70th IAC (International Astronautical Congress), Washington DC, USA, 21-25 October 2019, paper: IAC-19-B1.2.7, URL: https://iafastro.directory/iac/proceedings/IAC-19/IAC-19/B1/2/manuscripts/IAC-19,B1,2,7,x52335.pdf
26) Lorraine A. Remer, Kirk Knobelspiesse, Peng-Wang Zhai, Feng Xu, Olga V. Kalashnikova, Jacek Chowdhary, Otto Hasekamp, Oleg Dubovik, Lianghai Wu, Ziauddin Ahmad, Emmanuel Boss, Brian Cairns, Odele Coddington, Anthony B. Davis, Heidi M. Dierssen, David J. Diner, Bryan Franz, Robert Frouin, Bo-Cai Gao, Amir Ibrahim, Robert C. Levy, J. Vanderlei Martins, Ali H. Omar and Omar Torres, ”Retrieving Aerosol Characteristics From the PACE Mission, Part 2: Multi-Angle and Polarimetry,” Frontiers in Environmental Science, 23 July 2019, https://doi.org/10.3389/fenvs.2019.00094
27) Otto P. Hasekamp, Guangliang Fu , Stephanie P. Rusli , Lianghai Wu , Antonio Di Noia , Joost aan de Brugh, Jochen Landgraf, J. Martijn Smit, Jeroen Rietjens, Aaldert van Amerongen, ”Aerosol measurements by SPEXone on the NASA PACE mission: expected retrieval capabilities,” Journal of Quantitative Spectroscopy & Radiative Transfer, Volume 227, April 2019, Pages 170-184. https://doi.org/10.1016/j.jqsrt.2019.02.006
28) Lorraine A. Remer, Anthony B. Davis, Shana Mattoo, Robert C. Levy, Olga V. Kalashnikova, Odele Coddington, Jacek Chowdhary, Kirk Knobelspiesse, Xiaoguang Xu, Ziauddin Ahmad, Emmanuel Boss, Brian Cairns, Heidi M. Dierssen, David J. Diner, Bryan Franz, Robert Frouin, Bo-Cai Gao, Amir Ibrahim, J. Vanderlei Martins, Ali H. Omar, Omar Torres, Feng Xu and Peng-Wang Zhai, ”Retrieving Aerosol Characteristics From the PACE Mission, Part 1: Ocean Color Instrument,” Frontiers in Environmental Science, Volume 7, 23 July 2019, https://doi.org/10.3389/feart.2019.00152
29) Robert J. Frouin, Bryan A. Franz, Amir Ibrahim, Kirk Knobelspiesse, Ziauddin Ahmad, Brian Cairns, Jacek Chowdhary, Heidi M. Dierssen, Jing Tan, Oleg Dubovik, Xin Huang, Anthony B. Davis, Olga Kalashnikova, David R. Thompson, Lorraine A. Remer, Emmanuel Boss, Odele Coddington, Pierre-Yves Deschamps, Bo-Cai Gao, Lydwine Gross, Otto Hasekamp, Ali Omar, Bruno Pelletier, Didier Ramon, François Steinmetz and Peng-Wang Zhai, ”Atmospheric correction of satellite ocean-color imagery during the PACE Era,” Frontiers in Earth Science, 26 July 2019, https://doi.org/10.3389/feart.2019.00145
30) ”NASA Aerosol-Cloud-Convection-Precipitation (ACCP)”, URL: https://science.nasa.gov
/earth-science/decadal-accp
31) Oleg Dubovik, Zhengqiang Li, Michael I. Mishchenko, Didier Tanré, Yana Karol, Bojan Bojkov, Brian Cairns, David J. Diner, W. Reed Espinosa, Philippe Goloub, Xingfa Gu, Otto Hasekamp, Jin Hong, Weizhen Hou, Kirk D. Knobelspiesse, Jochen Landgraf, Li Li, Pavel Litvinov, Yi Liu, Anton Lopatin, Thierry Marbach, Hal Maring, Vanderlei Martins, Yasjka Meijer, Gennadi Milinevsky, Sonoyo Mukai, Frederic Parol, Yanli Qiao, Lorraine Remer, Jeroen Rietjens, Itaru Sano, Piet Stammes, Snorre Stamnes,Xiaobing Sun, Pierre Tabary, Larry D. Travis, Fabien Waquet, Feng Xu, Changxiang Yan, Dekui Yin, ”Polarimetric remote sensing of atmospheric aerosols: Instruments, methodologies, results, and perspectives,” Journal of Quantitative Spectroscopy and Radiative Transfer, Volume 224, February 2019, Pages 474-511, https://www.sciencedirect.com/science/article/pii/S0022407318308409
32) Francois-Marie Breon and Fabienne Maignan, ”A BRDF–BPDF database for the analysis of Earthtarget reflectances,” Earth System Science Data, Vol. 9, pp: 31–45, 20 January 2017, URL:
https://www.earth-syst-sci-data.net/9/31/2017/essd-9-31-2017.pdf
33) Feng Xu, Oleg Dubovik, Peng-Wang Zhai, David J. Diner, Olga V. Kalashnikova, Felix C. Seidel, Pavel Litvinov, Andrii Bovchaliuk, Michael J. Garay, Gerard van Harten, and Anthony B. Davis, ”Joint retrieval of aerosol and water-leaving radiance from multispectral, multiangular and polarimetric measurements over ocean,” Atmospheric Measurement Techniques, Vol. 9, pp: 2877–2907, 8 July 2016, URL: https://www.atmos-meas-tech.net/9/2877/2016/amt-9-2877-2016.pdf
34) ”NASA Langley Data Archive, ACEPOL campaign,” 30 September 2019, URL:
https://www-air.larc.nasa.gov/cgi-bin/ArcView/acepol#MARTINS.VANDERLEI/
35) D. J. Diner, F. Xu, M. J. Garay, J. V. Martonchik, B. E. Rheingans, S. Geier, A. Davis, B. R. Hancock,V. M. Jovanovic, M. A. Bull, K. Capraro, R. A. Chipman, and S. C. McClain, ”The Airborne Multiangle SpectroPolarimetric Imager (AirMSPI):a new tool for aerosol and cloud remote sensing,” Atmospheric Measurement Techniques, Vol. 6, pp: 2007–2025, 13 August 2013, URL:
https://www.atmos-meas-tech.net/6/2007/2013/amt-6-2007-2013.pdf
36) D. Müller, C. A. Hostetler, R. A. Ferrare, S. P. Burton, E. Chemyakin, A. Kolgotin, J. W. Hair, A. L. Cook,D. B. Harper, R. R. Rogers, R. W. Hare, C. S. Cleckner, M. D. Obland, J. Tomlinson, L. K. Berg, and B. Schmid, ”Airborne Multiwavelength High Spectral Resolution Lidar(HSRL-2) observations during TCAP 2012: vertical profiles of optical and microphysical properties of a smoke/urban haze plume over the northeastern coast of the US,” Atmospheric Measurement Techniques, Vol. 7, pp: 3487–3496, 10 October 2014, URL: https://www.atmos-meas-tech.net/7/3487/2014/amt-7-3487-2014.pdf
37) Matthew McGill, Dennis Hlavka, William Hart, V. Stanley Scott, James Spinhirne, and Beat Schmid, ”Cloud Physics Lidar: instrument description and initial measurement results,” Applied Optics, Vol. 41, Issue 18, pp. 3725-3734 (2002), https://doi.org/10.1364/AO.41.003725
38) Mikhail D. Alexandrov, Brian Cairns, Andrzej P. Wasilewski, Andrew S. Ackerman, Matthew J. McGill, John E. Yorks, Dennis L. Hlavka, Steven E. Platnick, G. Thomas Arnold, Bastiaan van Diedenhoven, Jacek Chowdhary, Matteo Ottaviani, Kirk D. Knobelspiesse, ”Liquid water cloud properties during the Polarimeter Definition Experiment (PODEX),” Remote Sensing of Environment, Volume 169, November 2015, Pages 20-36, https://doi.org/10.1016/j.rse.2015.07.029
39) François‐Marie Bréon, Philippe Goloub, ”Cloud droplet effective radius from spaceborne polarization measurements,” Geophysical Research Letters, Volume25, Issue11, 1 June 1998, Pages 1879-1882, URL: https://agupubs.onlinelibrary.wiley.com/doi/epdf/10.1029/98GL01221
40) Daniel J. Miller, Zhibo Zhang, Steven Platnick, Andrew S. Ackerman, Frank Werner, Celine Cornet, andKirk Knobelspiesse, ”Comparisons of bispectral and polarimetric retrievals of marineboundary layer cloud microphysics: case studies using aLES–satellite retrieval simulator,” Atmospheric Measurement Techniques, Volume 11, pp: 3689–3715, 26 June 2018, https://doi.org/10.5194/amt-11-3689-2018, URL: https://www.atmos-meas-tech.net/11/3689/2018/amt-11-3689-2018.pdf
41) B. van Diedenhoven, B. Cairns, A. M. Fridlind, A. S. Ackerman, and T. J. Garrett, ”Remote sensing of ice crystal asymmetry parameter using multi-directional polarization measurements – Part 2: Application to the Research Scanning Polarimeter,” Atmospheric Chemistry and Physics, Volume 13, pp: 3185–3203, 18 March 2013, URL: https://www.atmos-chem-phys.net/13/3185/2013/acp-13-3185-2013.pdf
42) J. Riedi, B. Marchant, S. Platnick, B. A. Baum, F. Thieuleux, C. Oudard, F. Parol, J.-M. Nicolas, and P. Dubuisson, ”Cloud thermodynamic phase inferred from merged POLDER and MODIS data,” Atmospheric Chemistry and Physics, Volume 10, pp: 11851–11865, 13 December 2010, URL: https://pdfs.semanticscholar.org/f4a1/02e4e752307bb07f3abd1344a0c817949b19.pdf
43) Oleg Dubovik, Tatyana Lapyonok, Pavel Litvinov, Maurice Herman, David Fuertes, Fabrice Ducos, Benjamin Torres, Yevgeny Derimian, Xin Huang, Anton Lopatin, Anatoli Chaikovsky, Michael Aspetsberger and Christian Federspiel, ”GRASP: a versatile algorithm for characterizing the atmosphere,” Proceedings of SPIE, 19 September 2014, https://spie.org/news/
5558-grasp-a-versatile-algorithm-for-characterizing-the-atmosphere
44) Falguni Patadia, Robert C. Levy, and Shana Mattoo, ”Correcting for trace gas absorption when retrieving aerosol optical depth from satellite observations of reflected shortwave radiation,” Atmospheric Measurement Techniques, Volume 11, pp: 3205–3219, 4 June 2018, URL:
https://www.atmos-meas-tech.net/11/3205/2018/amt-11-3205-2018.pdf
45) Xiaoguang Xu, Jun Wang, ”UNL-VRTM, A Testbed for Aerosol Remote Sensing: Model Developments and Applications,” In: Kokhanovsky A. (eds) Springer Series in Light Scattering. Springer Series in Light Scattering. Springer, Cham, https://doi.org/10.1007/978-3-030-20587-4_1, 30 June 2019
46) O. Dubovik, M. Herman, A. Holdak, T. Lapyonok, D. Tanre, J. L. Deuze, F. Ducos, A. Sinyuk, and A. Lopatin, ”Statistically optimized inversion algorithm for enhanced retrieval of aerosol properties from spectral multi-angle polarimetric satellite observations,” Atmospheric Measurement Techniques, Volume 4, pp: 975-1018, 31 May 2011, URL: https://www.atmos-meas-tech.net/4/975/2011/amt-4-975-2011.pdf
47) Pavel Litvinov, Otto Hasekamp, Brian Cairns, ”Models for surface reflection of radiance and polarized radiance: Comparison with airborne multi-angle photopolarimetric measurements and implications for modeling top-of-atmosphere measurements,” Remote Sensing of Environment, Volume 115, Issue 2, 15 February 2011, Pages 781-792, https://doi.org/10.1016/j.rse.2010.11.005
48) W. Wanner, X. Li, A. H. Strahler, ”On the derivation of kernels for kernel‐driven models of bidirectional reflectance,” JGR(Journal of Geophysical Research) Atmospheres, Published: 20 October 1995, https://doi.org/10.1029/95JD02371
49) M. Leroy, J. L. Deuz, F. M. Bréon, Hautecoeur, M. Herman, J. C. Buriez, D. Tanrfi, S. Bouffies, P. Chazette, and J. L. Roujean, ”Retrieval of atmospheric properties and surface bidirectional reflectances over land from POLDER/ADEOS,” Journal of Geophysical Research, Vol. 102, No. D14, pages 17,023-17,037, July 27, 1997, URL: https://agupubs.onlinelibrary.wiley.com/doi/pdf/10.1029/96JD02662
50) Jun Wang, Xiaoguang Xu, Shouguo Ding,Jing Zeng, Robert Spurr, Xiong Liu, Kelly Chance, Michael Mishchenko,”A numerical testbed for remote sensing of aerosols, and its demonstration for evaluating retrieval synergy from a geostationary satellite constellation of GEO-CAPE and GOES-R,” Journal of Quantitative Spectroscopy and Radiative Transfer, Volume 146, October 2014, Pages 510-528, 29 March 2014, https://doi.org/10.1016/j.jqsrt.2014.03.020
51) ”SPEXone highly promising instrument for aerosol measurements,” SRON, URL: https://www.sron.nl/earth-instrument-development/spex/spexone
52) ”SPEXone Polarimeter,” URL: https://pace.oceansciences.org/spexone.htm
53) Marc Oorta, Aaldert van Amerongen, Dirk Slootweg, Jeroen Rietjens, Jos Dingjan, Otto Hasekamp, ”SPEXone ready for manufacturing,” Proceedings of the 70th IAC (International Astronautical Congress), Washington DC, USA, 21-25 October 2019, paper: IAC-19.B1.3.1, URL: https://iafastro.directory/iac/proceedings/IAC-19/IAC-19/B1/3/manuscripts/IAC-19,B1,3,1,x53586.pdf
54) L. F. van der Wal, B. T. G. de Goeij, R. Jansen, J. A. J. Oosterling, B. Snijders, W. A. Klop, A. L. Verlaan, H. Visser, and H. van Brug, ”Compact, low-cost earth observation instruments for nano- and microsatellites,” Proceedings of the 4S Symposium Small Satellites Systems and Services, Valletta, Malta, 30 May – 3 June 2016
55) https://pace.oceansciences.org/docs/
SRON-ISG-SP-2017-002-SpexOneScience-Requirements-issue1.2.pdf
56) Space.com, “SpaceX launches NASA's PACE satellite to study Earth's oceans, air and climate”, September 8, 2024, URL: https://www.space.com/spacex-launches-nasa-pace-climate-ocean-satellite
57) NASA, “NASA Launches New Climate Mission to Study Ocean, Atmosphere”, February 8, 2024, URL: https://www.nasa.gov/news-release/nasa-launches-new-climate-mission-to-study-ocean-atmosphere/
Spacecraft Launch Mission Status Sensor Complement References Back to top