RADARSAT-2
EO
Atmosphere
Ocean
Multi-purpose imagery (ocean)
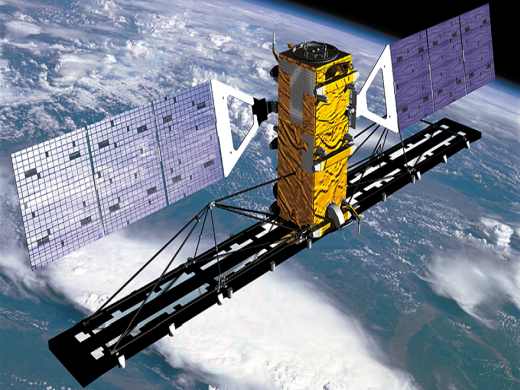
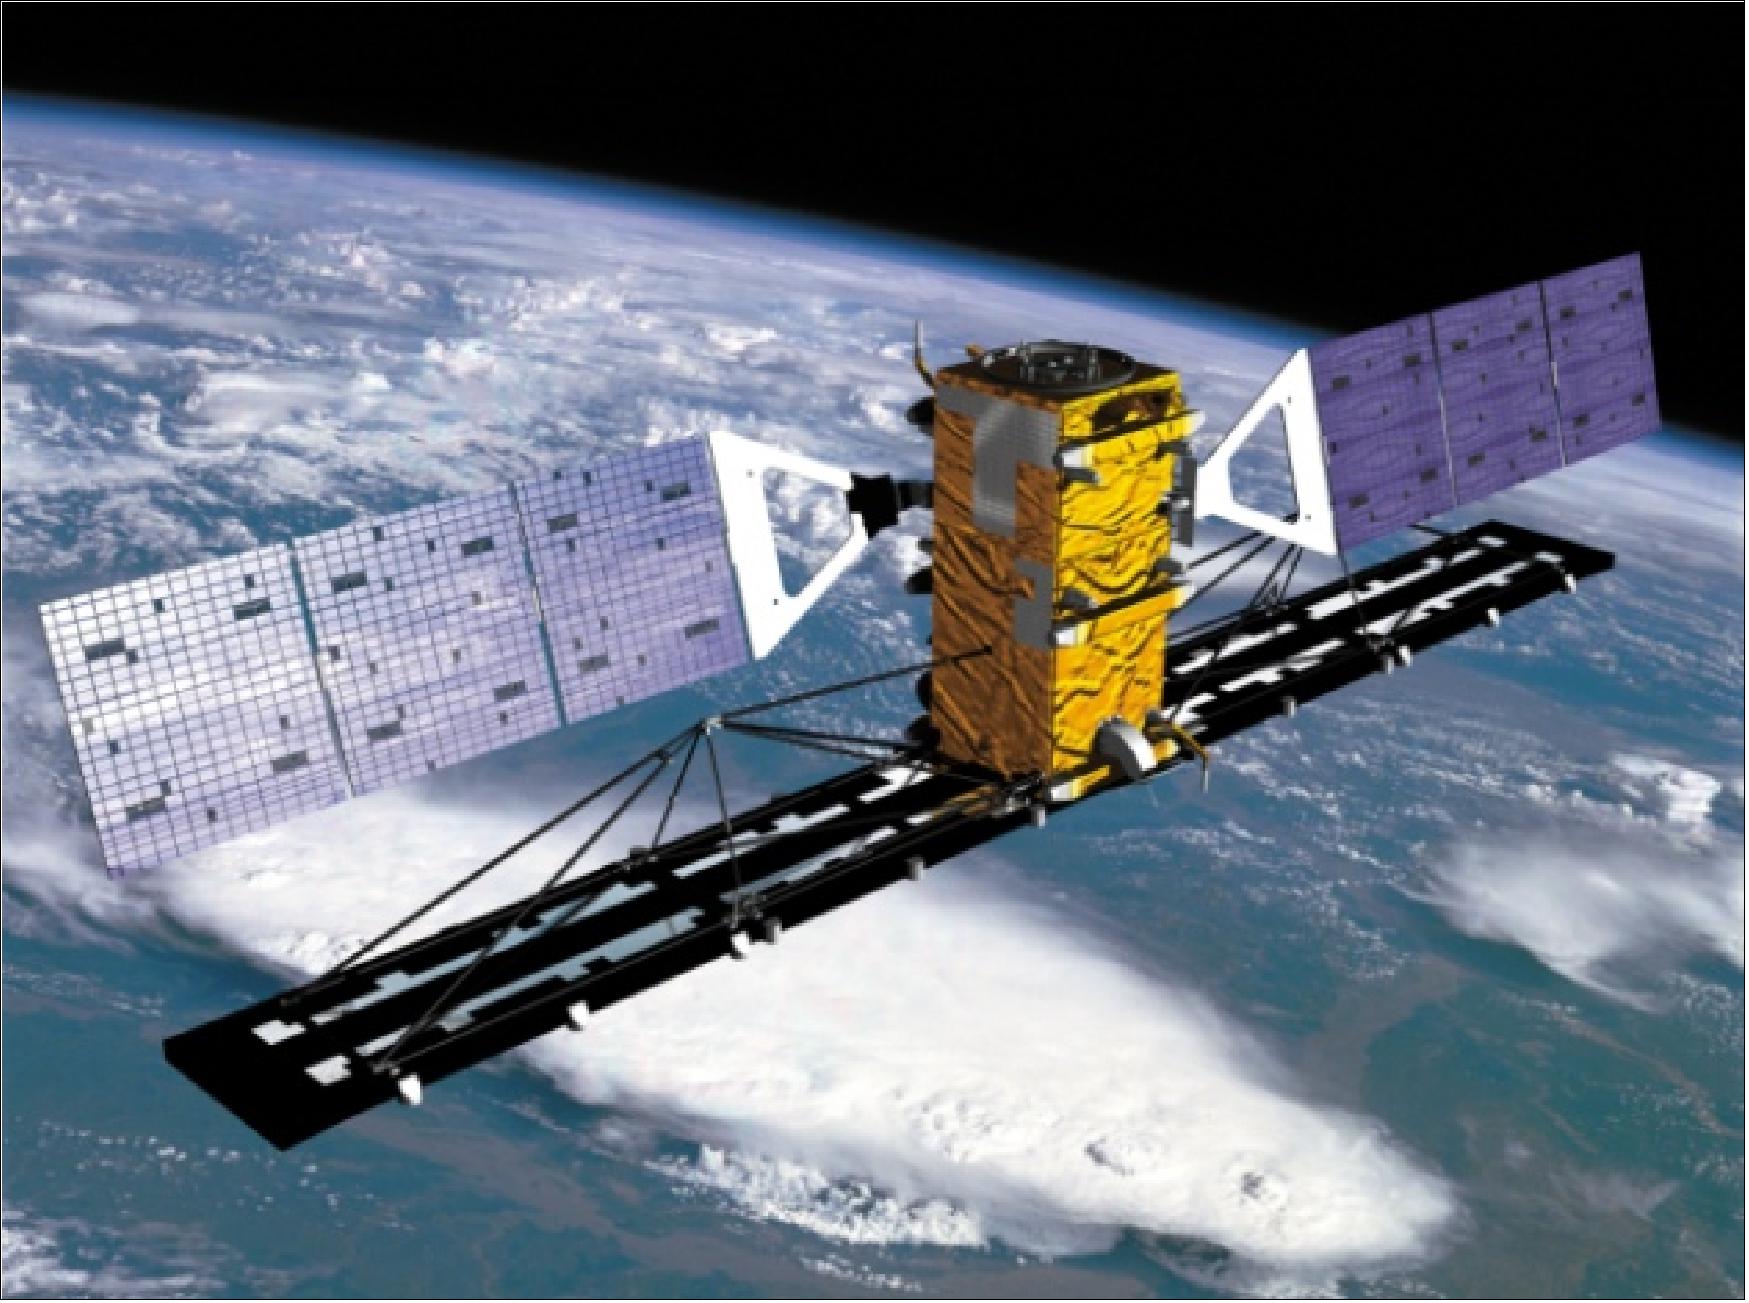
RADARSAT-2, the successor to RADARSAT-1, is a commercial radar imaging satellite providing continuity in data collection for environmental monitoring, natural resource management, and coastal surveillance.
Quick facts
Overview
| Mission type | EO |
| Agency | CSA, MDA |
| Mission status | Operational (nominal) |
| Launch date | 14 Dec 2007 |
| Measurement domain | Atmosphere, Ocean, Land, Snow & Ice |
| Measurement category | Multi-purpose imagery (ocean), Multi-purpose imagery (land), Vegetation, Albedo and reflectance, Landscape topography, Ocean topography/currents, Sea ice cover, edge and thickness, Soil moisture, Snow cover, edge and depth, Ocean surface winds, Atmospheric Winds, Ocean wave height and spectrum, Ice sheet topography |
| Measurement detailed | Ocean imagery and water leaving spectral radiance, Land surface imagery, Vegetation type, Fire fractional cover, Earth surface albedo, Land cover, Ocean surface currents (vector), Land surface topography, Sea-ice cover, Snow cover, Soil moisture at the surface, Wind speed over sea surface (horizontal), Snow water equivalent, Sea-ice thickness, Significant wave height, Bathymetry, Sea-ice type, Glacier motion, Ocean dynamic topography, Sea-ice sheet topography, Glacier cover, Oil spill cover, Soil type, Glacier topography, Above Ground Biomass (AGB), Surface Coherent Change Detection |
| Instruments | SAR (RADARSAT-2) |
| Instrument type | Imaging microwave radars |
| CEOS EO Handbook | See RADARSAT-2 summary |
Related Resources
Summary
Mission Capabilities
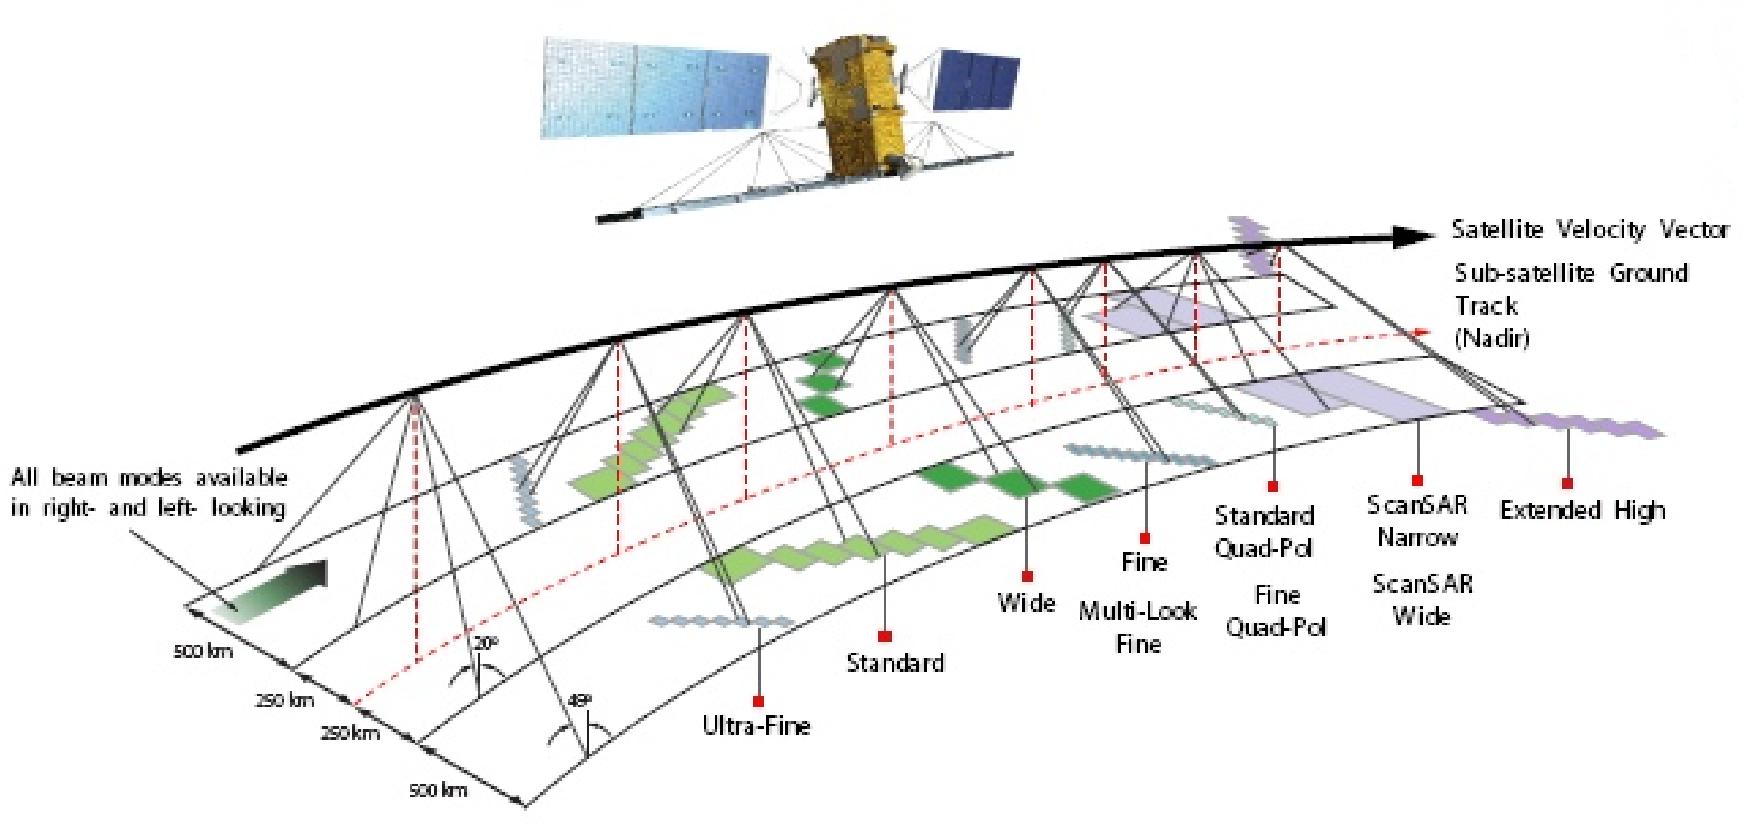
RADARSAT-2 has one sensor module, a C-band SAR (Synthetic Aperture Radar) imager. It operates at a frequency of 5.4GHz and is capable of full polarimetric imaging. Multiple different operational modes (Standard, Fine, ScanSAR Wide/Narrow, Polarimetric Standard/Fine, Multi-Look Fine and Ultra-fine) allow for a variety of potential applications, with the primary mission objectives being: glacier cover, motion, and topography; ice sheet and land surface topography; and sea-ice cover and type. RADARSAT-2 is fully integrated in the RADARSAT-1 ground segment, and is capable of tandem missions with its predecessor.
Performance Specifications
The SAR module has an imaging resolution of 3m-100m, an improvement on the original RADARSAT-1 SAR module, which has a resolution of 10m-100m. RADARSAT-2 is capable of left or right hand variable pointing with a 150-500km wide field of regard (20-49° off-nadir) depending on the mode of operation. Covering a ground swath of 20km-500km, RADARSAT-2 has near global coverage within one week when operating in ScanSAR Wide mode, but longer global coverage times for other modes of operation with higher spatial resolutions. The satellite is in a sun-synchronous orbit at an altitude of 798km with an LTDN (Local Time on Descending Node) of 6am, an inclination of 98.6° and a period of 100.7 minutes.
Space and Hardware Components
The spacecraft bus was developed from proposed designs for the COSMO-SkyMed constellation, and produced by Alena Spazio. It utilises a box-design with dimensions 1.34 x 1.34 x 3.2m and houses power system components, spacecraft control computer, three pairs of orbit maintenance thrusters, S-band TT&C (Telemetry, Tracking and Command) transceivers and X-band data downlink transmitters. It is powered by six solar panels in two wings, with two Lithium-ion batteries for power buffering.
RADARSAT-2
Spacecraft Launch Mission Status Sensor Complement MODEX ExperimentGround Segment References
RADARSAT-2 is a jointly-funded satellite mission of CSA (Canadian Space Agency) and MDA (MacDonald Dettwiler Associates Ltd. of Richmond, BC), representing a Canadian government/industry partnership [or PPP (Public Private Partnership)] in a commercial venture. In Feb. 1998, CSA awarded a contract to MDA to build RADARSAT-2. The contract calls for MDA to develop, own and operate RADARSAT-2 and related infrastructure (including data distribution). CSA provides a fixed financial contribution to MDA (about 75%), in exchange for imagery allocation from the S/C to government agencies. 1) 2) 3) 4) 5) 6) 7) 8) 9) 10) 11) 12)
US space policy, and regulations related to the export of satellite and rocket technology as well as to the distribution of high-resolution imagery, caused CSA in January 2000 to cancel an existing satellite bus contract with OSC (Orbital Sciences Corporation) of Dulles, VA, and to award a new contract to Alenia Spazio of Rome, Italy.
RADARSAT-2 is an advanced state-of-the-art technology follow-on satellite mission of RADARSAT-1 with the objective to:
- continue Canada's RADARSAT program and to develop an Earth Observation satellite business through a private sector-led arrangement with the federal government
- provide data continuity to RADARSAT-1 users and to offer data for new applications tailored to market needs.
- the key priorities of the mission respond to the challenges of:
- Monitoring the environment
- Managing natural resources
- Performing coastal surveillance.
Spacecraft
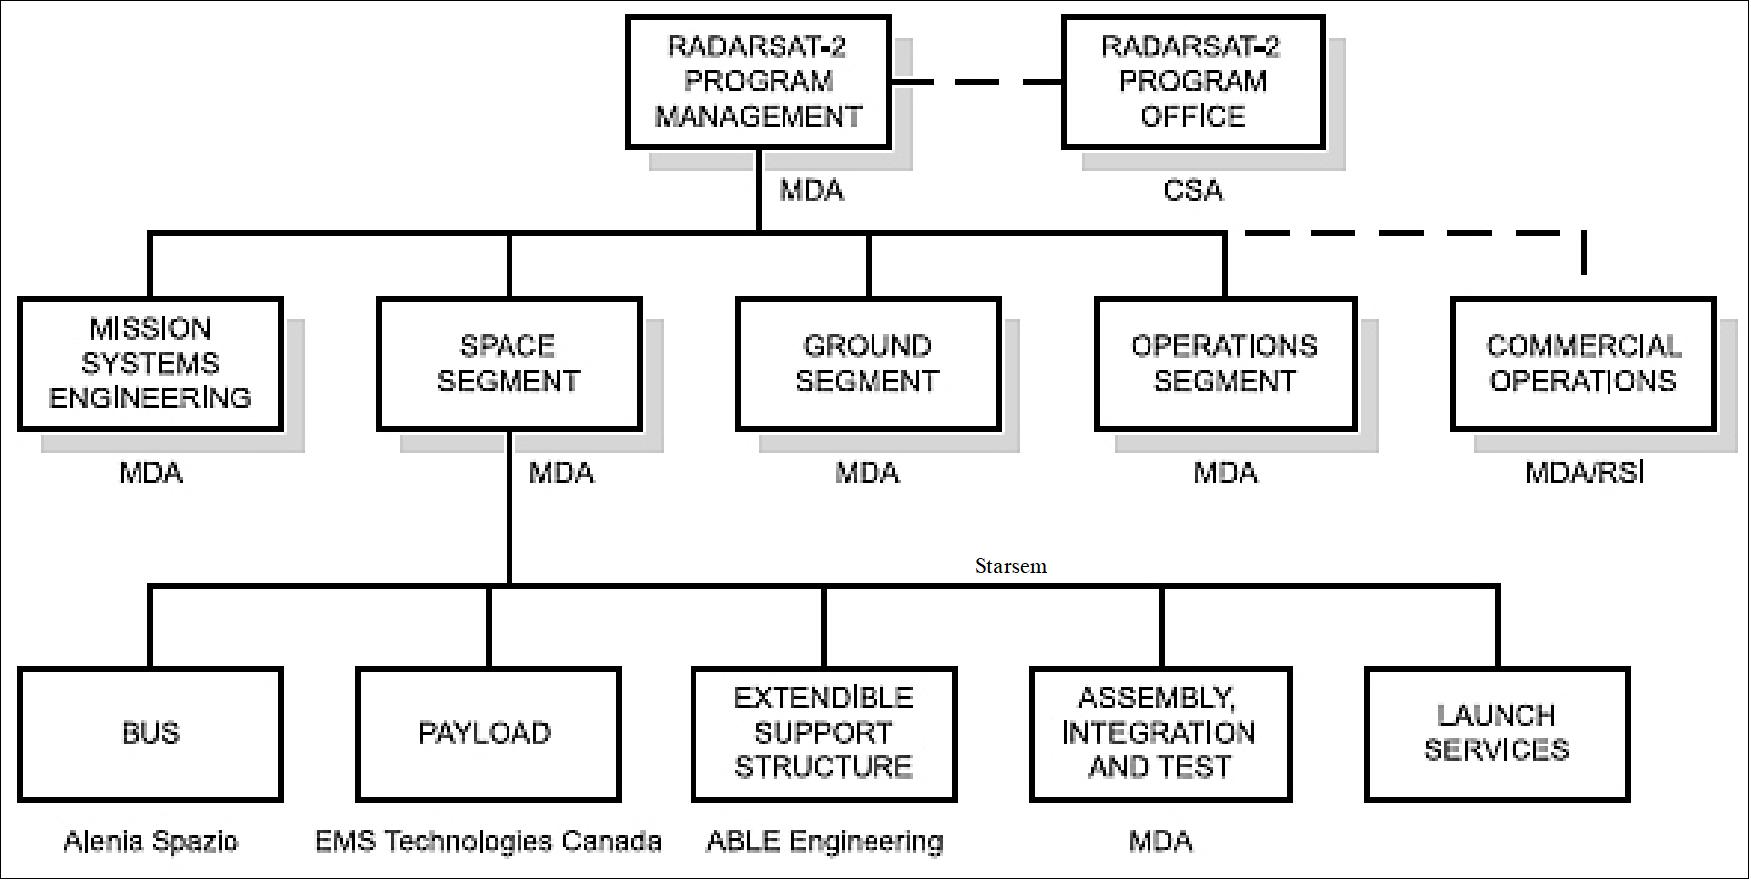
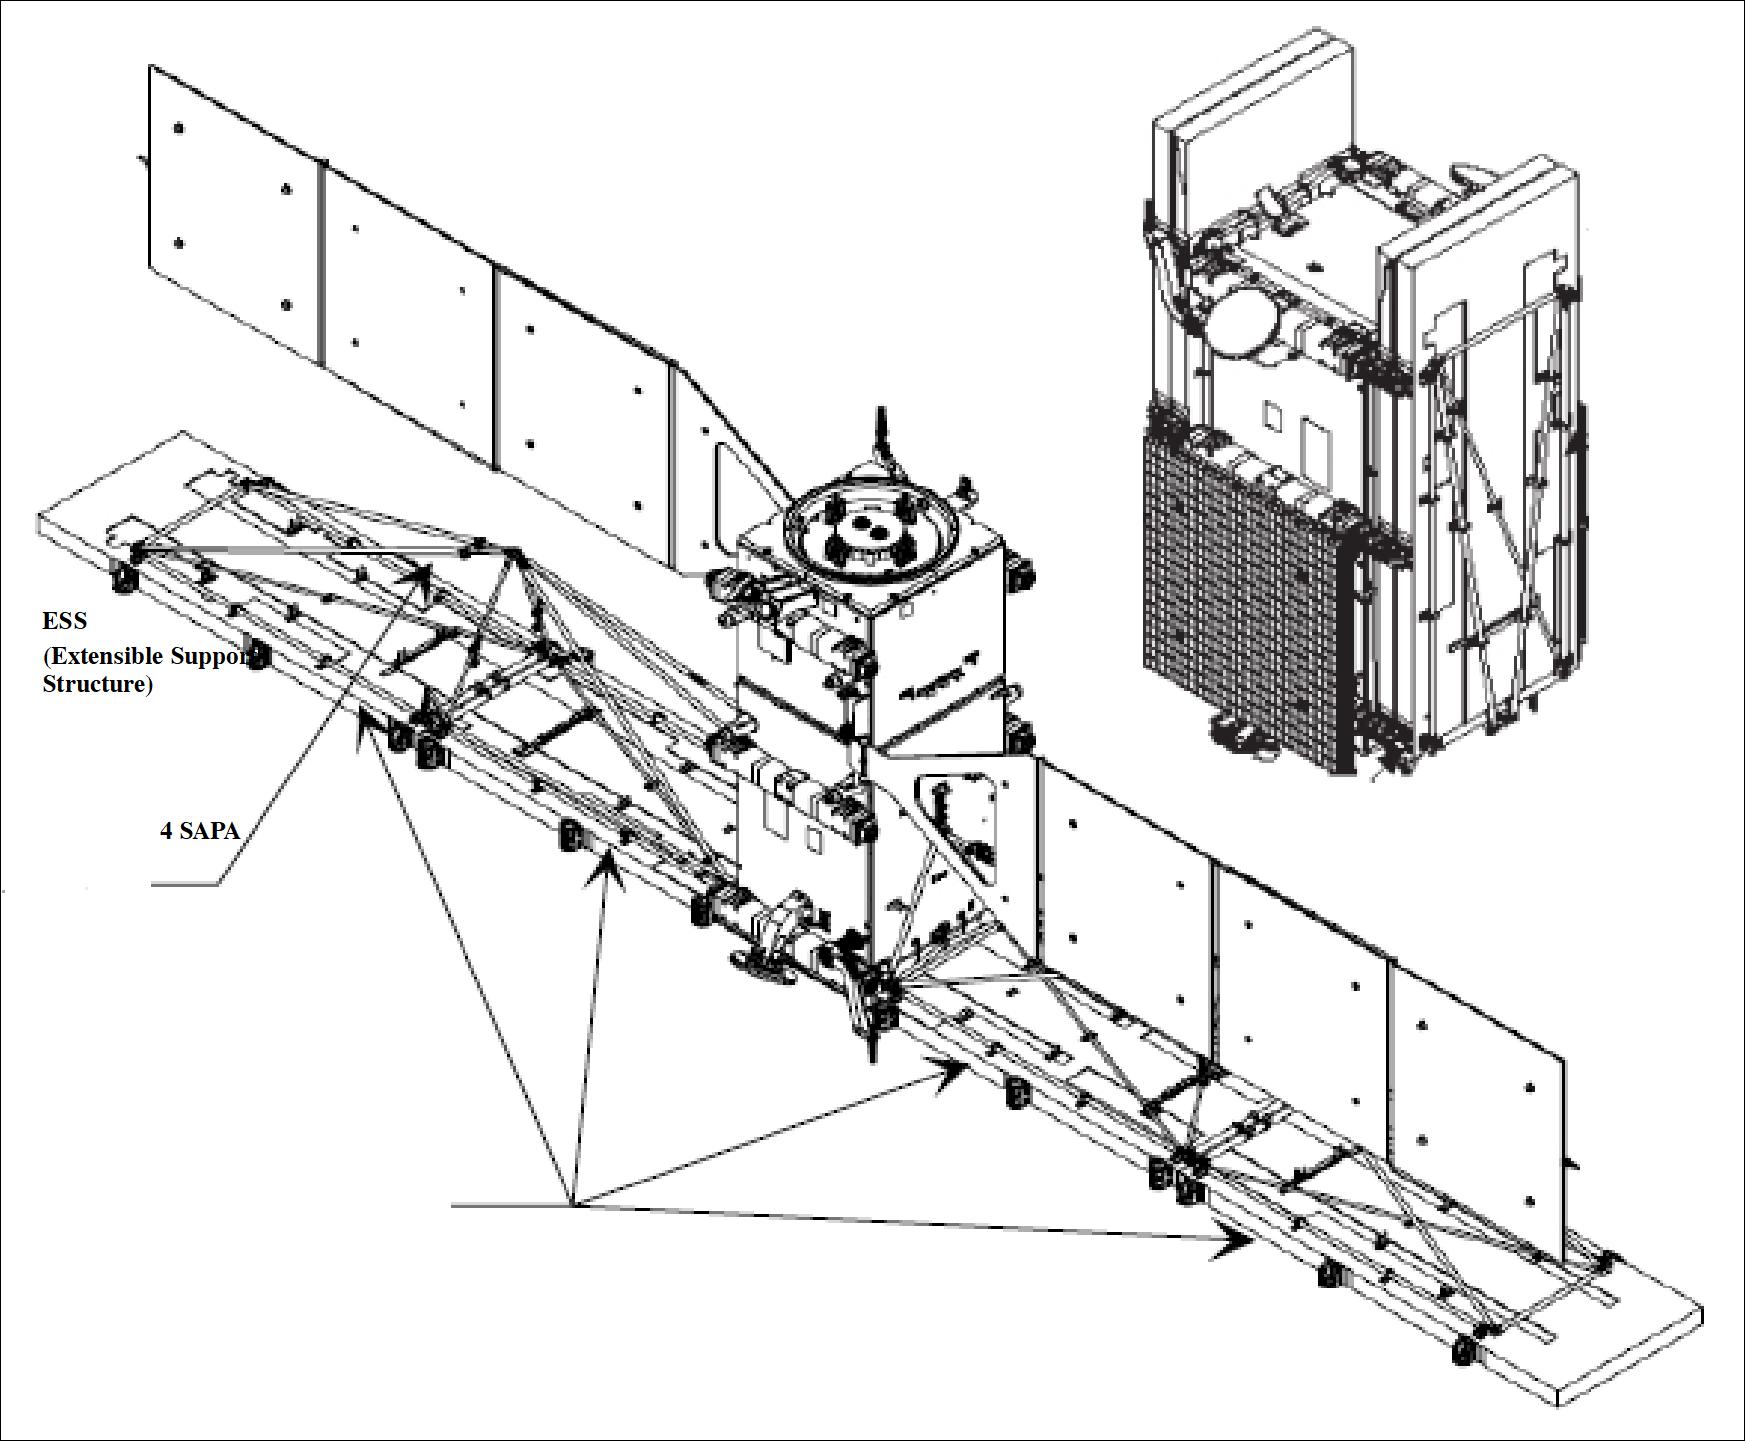
The S/C consists of a bus module, a payload module, and the ESS (Extendible Support Structure). Alenia Spazio, EMS Technologies, and AEC-Able were respectively awarded the subcontracts (from MDA) for the spacecraft bus, payload, and ESS. The SAR antenna itself is supported by ESS, which is used to deploy the antenna and to provide rigid support in the deployed position. Note: As of 2006, the former EMS Technologies Canada Ltd. was bought by MDA and is now referred to as MDA Satellite Subsystems.
The S/C bus is based on PRIMA, a reconfigurable bus developed for the Italian Space Agency (ASI) with bus dimensions of 3.7 m (height) by 1.36 m (diameter). The phased array SAR antenna, built by EMS of Montreal, has 8192 radiating elements fed by 512 T/R modules, two subapertures are provided offering a limited GMTI (Ground Moving Target Indication) capability based on along-track interferometry. The overall SAR antenna size is 15 m by 1.5 m with a mass exceeding 700 kg.
The S/C is three-axis stabilized (zero-momentum satellite). ACS (Attitude Control Subsystem) is using two-star trackers for precision pointing (provided by Galileo Avionica S.p.A. of Milan, Italy). Attitude knowledge is ±0.02º, attitude control is ±0.05º (3σ in each axis). The GPS receiver (LAGRANGE of Laben SpA) provides real-time position knowledge of ±60 m. Image location knowledge is < 300 m at downlink, and < 100 m for processed imagery. RADARSAT-2 is yaw-steered (unlike RADARSAT-1). The yaw steering, combined with the improved attitude control of RADARSAT-2, simplifies image processing and improves image quality. Yaw steering provides a measure of Earth rotation compensation and thus brings the data Doppler centroids (DC) near zero Hz. 13) 14)
S/C mass at launch is 2200 kg, power of 2.4 kW at EOL (two solar panels with dimensions: 3.73 m x 1.8 m, each), one Nickel-hydrogen battery with 89 Ah. The S/C design life is seven years. RADARSAT-2 provides several new imaging modes, such as polarimetric imagery (retrieval of full vectorial polarization information), and ultra-fine (3 m resolution) beams, in addition to preserving all RADARSAT-1 modes.
RADARSAT-2 uses a monopropellant hydrazine fuel. The S/C has six 1 N thrusters which are used initially to manoeuvre the spacecraft into its operational orbit (correcting any launch dispersions). The thrusters then maintain the spacecraft's orbit to keep the ground track within a strict tolerance range (better than ± 5km, with a goal of ± 1km) during its operational lifetime.
- Four thrusters of the propulsion system are in the nadir direction (+Z)
- Two thrusters are in the velocity direction (-X)
- They are used alternatively for drag make-up and COLA (Collision Avoidance) manoeuvres.
- The original fuel budget did not include anything for COLA manoeuvres
- The fuel budget of October 2016 is enough for extensive COLA manoeuvres and de-orbit services.
Parameter | RADARSAT-1 | RADARSAT-2 |
S/C mass at launch | 2750 kg | 2200 kg |
Design life | 5 years | 7 years |
Onboard data recording | Tape recorder (analog) | Solid-state recorder (384 Gbit) and addressable data retrieval |
Spacecraft location (tracking) | S/C ranging from ground | GPS receiver onboard |
Imaging frequency | C-band at 5.3 GHz | C-band at 5.405 GHz |
Spatial resolution of data | 10-100 m | 3-100 m |
Polarization | HH | Fully polarimetric |
Switching delay between imaging modes | about 14 seconds | ≤ 1 second |
Look direction of SAR antenna | Right | Left or Right (faster revisit times) |
S/C attitude control | Sun sensors, magnetometers, and horizon scanners | Two star trackers for precision pointing |
Downlink power transmitter | Standard ground antenna size of about 10 m diameter is needed | Ground antenna size of 3 m diameter is needed |
On-board location accuracy device | None | GPS receivers (± 60 m real-time position information) |
Yaw steering | None | Yaw steering for zero Doppler shift at beam center (facilitates image processing) |
Launch
A launch of RADARSAT-2 took place on Dec. 14, 2007 on a Soyuz launch vehicle (launch provider: Starsem) from Baikonur, Kazakhstan.
Note: Initial arrangements were made in 2003 with the Boeing Company to launch RADARSAT-2 on a Delta-2 vehicle from VAFB. However, after the arrangement was made, there were objections from US intelligence agencies who felt the S/C observations would pose a threat to US national security.
Orbit
Sun-synchronous polar orbit, mean altitude = 798 km, inclination = 98.6º, period = 100.7 min (14 7/34 orbits/day), LTAN (Local Time on Ascending Node) = 18:00 hrs ±15 min (dusk-dawn orbit), repeat cycle = 24 days (343 orbits). RADARSAT-2 is in the same orbit as RADARSAT-1, separated by 30 minutes (and having the same ground track and repeat cycle as RADARSAT-1). The spacecraft orbit control system is capable of maintaining ground-track repeatability to within at least ± 5 km (with a goal of ±1 km), at any point in the orbit. This facilitates proper ground station scheduling. In addition, the tandem flight configuration of RADARSAT-1 and -2 provides a wealth of interferometric applications support.
Orbit determination: The POD (Precise Orbit Determination) software in combination with the onboard GPS receivers permits accurate real-time orbit information. The LAGRANGE receiver is a 12-channel dual-frequency receiver that produces pseudorange and Doppler phase measurements. The POD software is a GPS based onboard orbital filter, which uses an orbital filter to combine the GPS measurements with high-fidelity orbit models to significantly improve onboard orbit knowledge, under the constraints imposed by the bus on the onboard computing resources. Fast-delivery position knowledge is ± 60 m (3σ in each axis), the post-processed position knowledge is ± 15 m (3σ in each axis). 15)
RF communications
Two onboard SSR (Solid-State Recorder) each with a capacity 150 Gbit BOL provide recording of the source data outside of the receiving station range. They can accept data at rates up to 400 Mbit/s. BAC (Block Adaptive Quantization) data compression is used to encode signal data with a selectable wordlength (normally 4 bits I + 4 bits Q).
Payload downlink of two parallel X-band channels at 105 Mbit/s for real-time data reception. Encryption is available for command & control as well as for the downlink of signal data. S-band for TT&C communications: downlink data rates at 15, 128, 512 kbit/s (2230.00 MHz), uplink data rate at 4 kbit/s (2053.458 MHz).
Agreements between CSA and MDA make MDA the S/C owner and operator. The RADARSAT-2 ground segment is also owned and operated by MDA. This includes the re-use of the existing RADARSAT-1 infrastructure where possible. CSA's investment will be recovered through the supply of imagery to a number of Canadian government agencies during the mission lifetime. RSI (as well as others) are commercial distributors of imagery.
Mission Status
• June 28, 2022: MDA Ltd. has announced a significant contribution to combat illegal, unreported, and unregulated (IUU) fishing by providing Global Fishing Watch (GFW) with access to its RADARSAT-2 satellite radar archive. The 14-year historical record includes over 970,000 images and 26 billion square kilometers of oceanic Synthetic Aperture Radar (SAR) data. GFW plans to use the archive to map IUU fishing patterns using science-based analytics, aiding international policymakers, conservationists, and researchers in the fight against illegal fishing, which is considered the planet's sixth-largest crime, costing an estimated $23.5 billion annually and capturing over 90 million tonnes of fish illegally each year, according to the United Nations. MDA, through its Maritime Insights platform, is actively involved in monitoring fishing activity in near real-time, supporting maritime enforcement initiatives. 16)
• December 17, 2020: MDA has entered into a new agreement with Orbital Insight, providing high-resolution imagery from its RADARSAT-2 SAR (Synthetic Aperture Radar) satellite to Orbital Insight. This collaboration aims to enhance Orbital Insight's geospatial analytics capabilities for the energy industry. MDA's RADARSAT-2 offers global monitoring with a large collection capacity and high-resolution radar imaging, regardless of light or weather conditions. Orbital Insight will leverage this imagery to create oil inventory information, supporting its energy products like the Global Geospatial Crude Index, which provides daily insights into global crude inventory for confident decision-making in energy markets. This contract expands the partnership between Orbital Insight and Maxar Technologies, which also includes a multi-year partnership with DigitalGlobe for high-resolution electro-optical satellite imagery and geospatial analytics. 17)
• November 20, 2019: The volcanic island known as Hunga Tonga-Hunga Ha‘apai, formed in 2015 after an undersea eruption in the Tongan archipelago, has defied expectations of rapid erosion and stands nearly five years old. NASA scientists, including Jim Garvin and Dan Slayback, have intensively studied the island using radar imaging satellites, capturing images from different angles every 24 days to detect changes in elevation and texture. The island's stability has been attributed to the redistribution and hydrothermal alteration of volcanic material, as well as the formation of a protective sandbar. Researchers believe the insights gained from studying this evolving landscape could be valuable for understanding similar processes on Mars, especially areas with ancient eruptions through shallow seas. 18)
![Figure 3: This SAR image of the volcanic island "Hunga Tonga-Hunga Ha‘apai" was acquired on October 8, 2019, by the RADARSAT-2 satellite of CSA (Canadian Space Agency). [image credit: NASA Earth Observatory image by Joshua Stevens, using RADARSAT-2 data courtesy of James Garvin/NASA GSFC (via MURF agreement with CSA). RADARSAT-2 data and products are copyright of Maxar Technologies Ltd. 2019. RADARSAT is an official mark of the Canadian Space Agency. Story by Kathryn Hansen]](https://www.eoportal.org/ftp/satellite-missions/r/Radarsat2_010722/Radarsat2_Auto29.jpeg)
• February 26, 2019: MDA has announced that its Forest Alert Service (FAS) spaceborne capabilities have played a key role in enabling Asia Pulp & Paper's (APP) pulpwood suppliers to strategically monitor forest cover loss in conservation areas. The partnership, which began in 2016, employs MDA's RADARSAT-2 satellite to provide near real-time monitoring services, detecting forest disturbances and aiding in efficient operational planning. The Forest Conservation Policy announced by APP in 2013 has seen significant reductions in natural forest cover losses, demonstrating the commitment to responsible forest management and conservation in the Indonesian rainforest. 19)
• December 17, 2018: MDA and Orbital Insight have entered into an agreement where MDA will provide high-resolution imagery from its RADARSAT-2 SAR satellite to Orbital Insight for the energy industry. This partnership enhances Orbital Insight's product offerings, enabling timely and reliable imaging of global oil storage sites, irrespective of cloud cover. The combination of RADARSAT-2's large imaging capacity and timely data delivery with Orbital Insight's geospatial analytics capabilities aims to expand the market for information derived from SAR imagery. The data will be used to create oil inventory information, including the Global Geospatial Crude Index, providing daily insights into global crude inventory for economic decision-making in energy markets. 20)
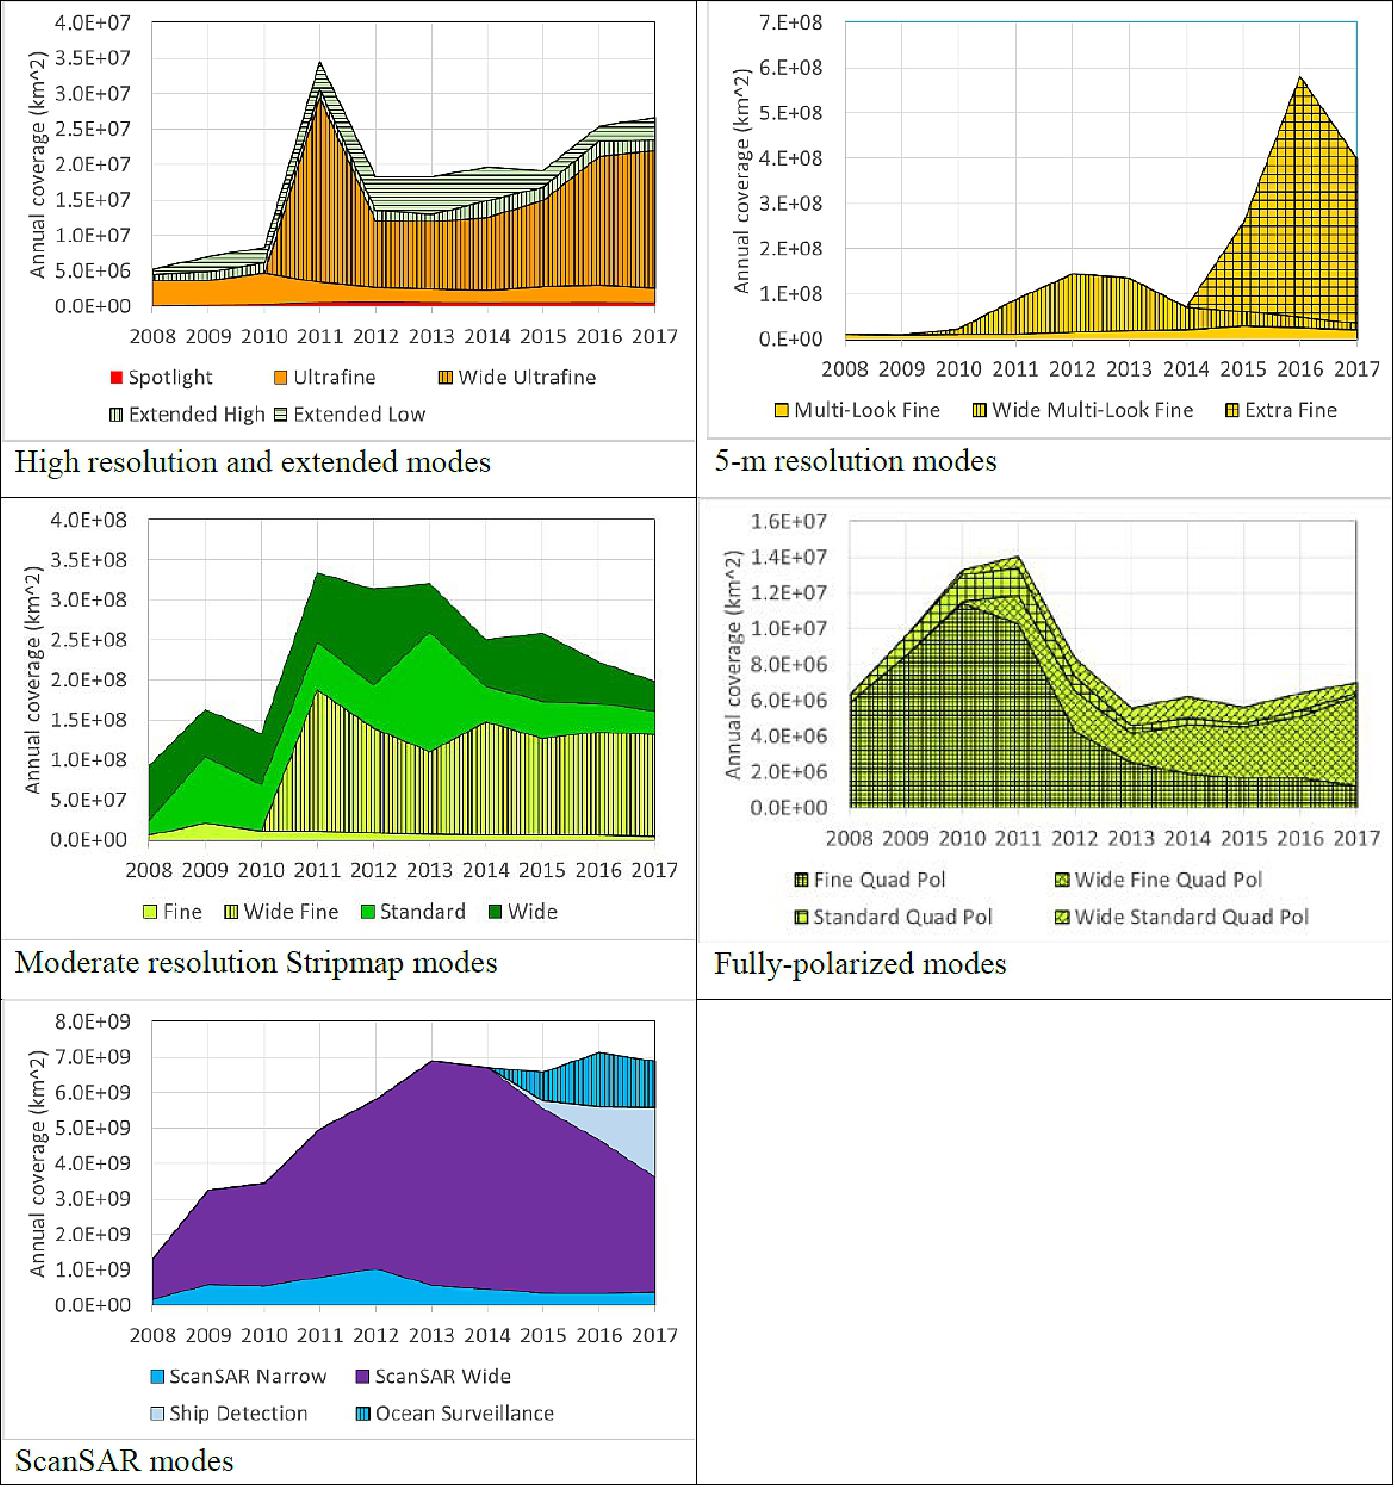
• June 2018: RADARSAT-2 continues to operate successfully without any degradation in image quality, offering support for operational imaging through various modes such as 15 Stripmap modes, 4 ScanSAR modes, and a Spotlight mode. A noteworthy feature of RADARSAT-2 is its ability to add new modes during ongoing operations, addressing evolving government and commercial market needs. Over the last decade, the usage of RADARSAT-2 has evolved, with trends identified in the annual coverage for each mode, plotted in Figure 4. Recent initiatives by MDA include making the RADARSAT-2 archive more accessible to users through cloud environments for big data analytics and providing an online portal for the search and discovery of RADARSAT-2 data. 21) 22)
• June 2018: Canada, with the world's longest coastline, utilizes the RADARSAT-2 satellite for maritime surveillance to protect its coastal waters and Exclusive Economic Zone (EEZ). The Marine Security Operations Centers (MSOCs) in Halifax and Esquimalt coordinate the monitoring of maritime traffic, relying on ship detection reports from the Polar Epsilon system. This system uses wide swath SAR images from RADARSAT-2 to provide daily surveillance, complementing reports from ships through the Automatic Identification System (AIS) or the Long Range Identification and Tracking (LRIT) system. The integration of RADARSAT Constellation Mission (RCM) into the Polar Epsilon system enhances surveillance capabilities, although challenges, such as limited ship detection performance and incomplete AIS/LRIT data, are addressed through ongoing efforts to refine tools and develop new capabilities for maritime surveillance in challenging environments. 23)
• December 2017: Celebrating its 10th year in orbit since its launch in December 2007, RADARSAT-2 continues to play a crucial role in monitoring climate change impacts, environmental protection, resource management, and disaster relief. The satellite, owned and operated by Maxar Technologies Ltd., represents a collaborative effort between government and industry. The Canadian Space Agency (CSA) supported the satellite's construction and launch, recovering its investment through the supply of RADARSAT-2 data to the Government of Canada. Demonstrating Canadian leadership in remote sensing technology, RADARSAT-2 remains a cornerstone for monitoring the environment and managing natural resources, providing high-quality data products for a diverse range of applications globally. 24)
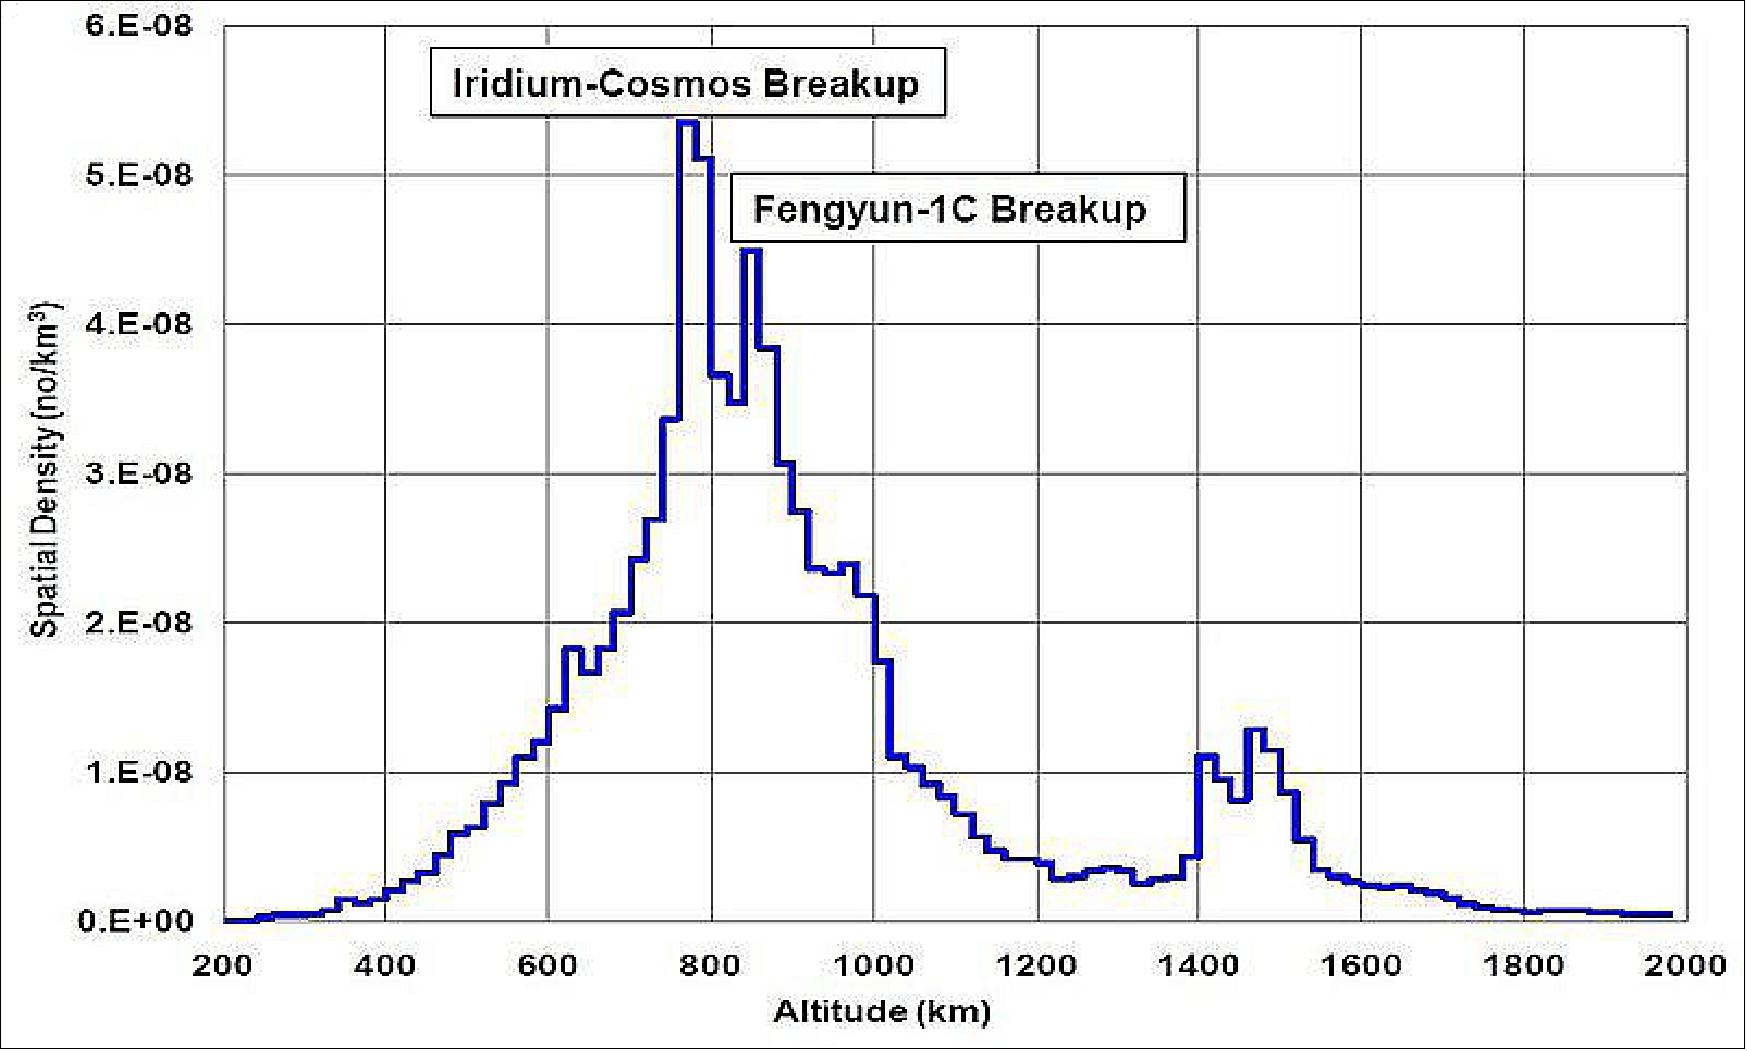
• November 2016: RADARSAT-2 currently operates in one of the most populated debris zones in Earth's orbit. Despite lacking a formal collision avoidance strategy at launch, a comprehensive plan has been developed over time. The strategy involves assessing the risk based on miss distance, uncertainty, and data quality, with a collision avoidance box specifying certain parameters. The current approach incorporates the Probability of Collision (PoC) as the primary assessment, considering factors like data quality, PoC sensitivity, geometry, and Time of Closest Approach (TCA). The Collision Risk Assessment & Mitigation System (CRAMS) and the Joint Space Operations Center (JSpOC) tools aid in monitoring and notification of close approaches, enhancing risk management for RADARSAT-2. 26) 27)
Number | COLA date | PoC | ΔV (cm/s) | Object | Manoeuvre time (hrs before TCA) |
1 | June 02, 2010 | N/A | 0.65 | Orbcomm FM30 | 20:53 |
2 | May 25, 2011 | 7.7 x 10⁻³ | 1.09 | Cosmos 2251 Debris | 23:13 |
3 | Oct. 06, 2011 | 1.2 x 10⁻⁹ | 0.56 | Pegasus R/B (2) | 37:48 |
4 | May 01, 2012 | <1 x 10⁻¹⁰ | 1.40 | Cosmos 1302 | 33:35 |
5 | July 01, 2013 | 2.3 x 10⁻⁴ | 0.17 | Cosmos 2251 Debris | 31:56 |
5 | July 01, 2013 | <1 x 10⁻¹⁰ | 2.0 | Cosmos 2251 Debris | 6:21 |
6 | Jan. 30, 2014 | 1.5 x 10⁻³ | 2.68/2.68 | FengYun 1C Debris | 4:54/4:04 |
7 | Jan. 05, 2015 | 2.4 x 10⁻³ | 0.39 | Thorad Agena D Debris | 19:18 |
8 | Mar. 23, 2015 | 1.6 x 10⁻³ | 0.92 | Cosmos 2251 Debris | 31:03 |
9 | Aug. 13, 2015 | 7.7 x 10⁻³ | 1.80 | Cosmos 2251 Debris | 20:41 |
10 | Mar. 22, 2016 | 2.2 x 10⁻⁴ | 0.71 | FengYun 1C Debris | 11:45 |
11 | Aug. 18, 2016 | 5.0 x 10⁻³ | 0.67 | Cosmos 2251 Debris | 19:01 |
• April 24, 2016: As RADARSAT-2 enters its 8th operational service year since being declared operational in April 2008, it has undergone significant enhancements in both ground and space segments. The satellite's operational performance exceeds specifications, boasting an acquisition success rate surpassing 98% and an impressive availability percentage of 99.95%, affirming its reliability in executing successful acquisitions and maintaining consistent operational availability.
• October 1, 2015: MDA's Information Systems group has introduced two new commercial imaging modes for RADARSAT-2, specifically tailored for maritime monitoring. The Ship Detection mode offers enhanced ship detection capabilities for vessels measuring 25 meters or more, covering expansive areas up to 450 km x 500 km per RADARSAT-2 scene. This mode is particularly useful for applications like monitoring illegal fishing and safeguarding sovereignty. The Ocean Surveillance mode extends maritime monitoring capabilities, covering areas as large as 530 km x 500 km. Apart from ship detection, this mode includes features for monitoring oil on water, ice and wind analysis, as well as wake detection, catering to diverse maritime applications. 28)
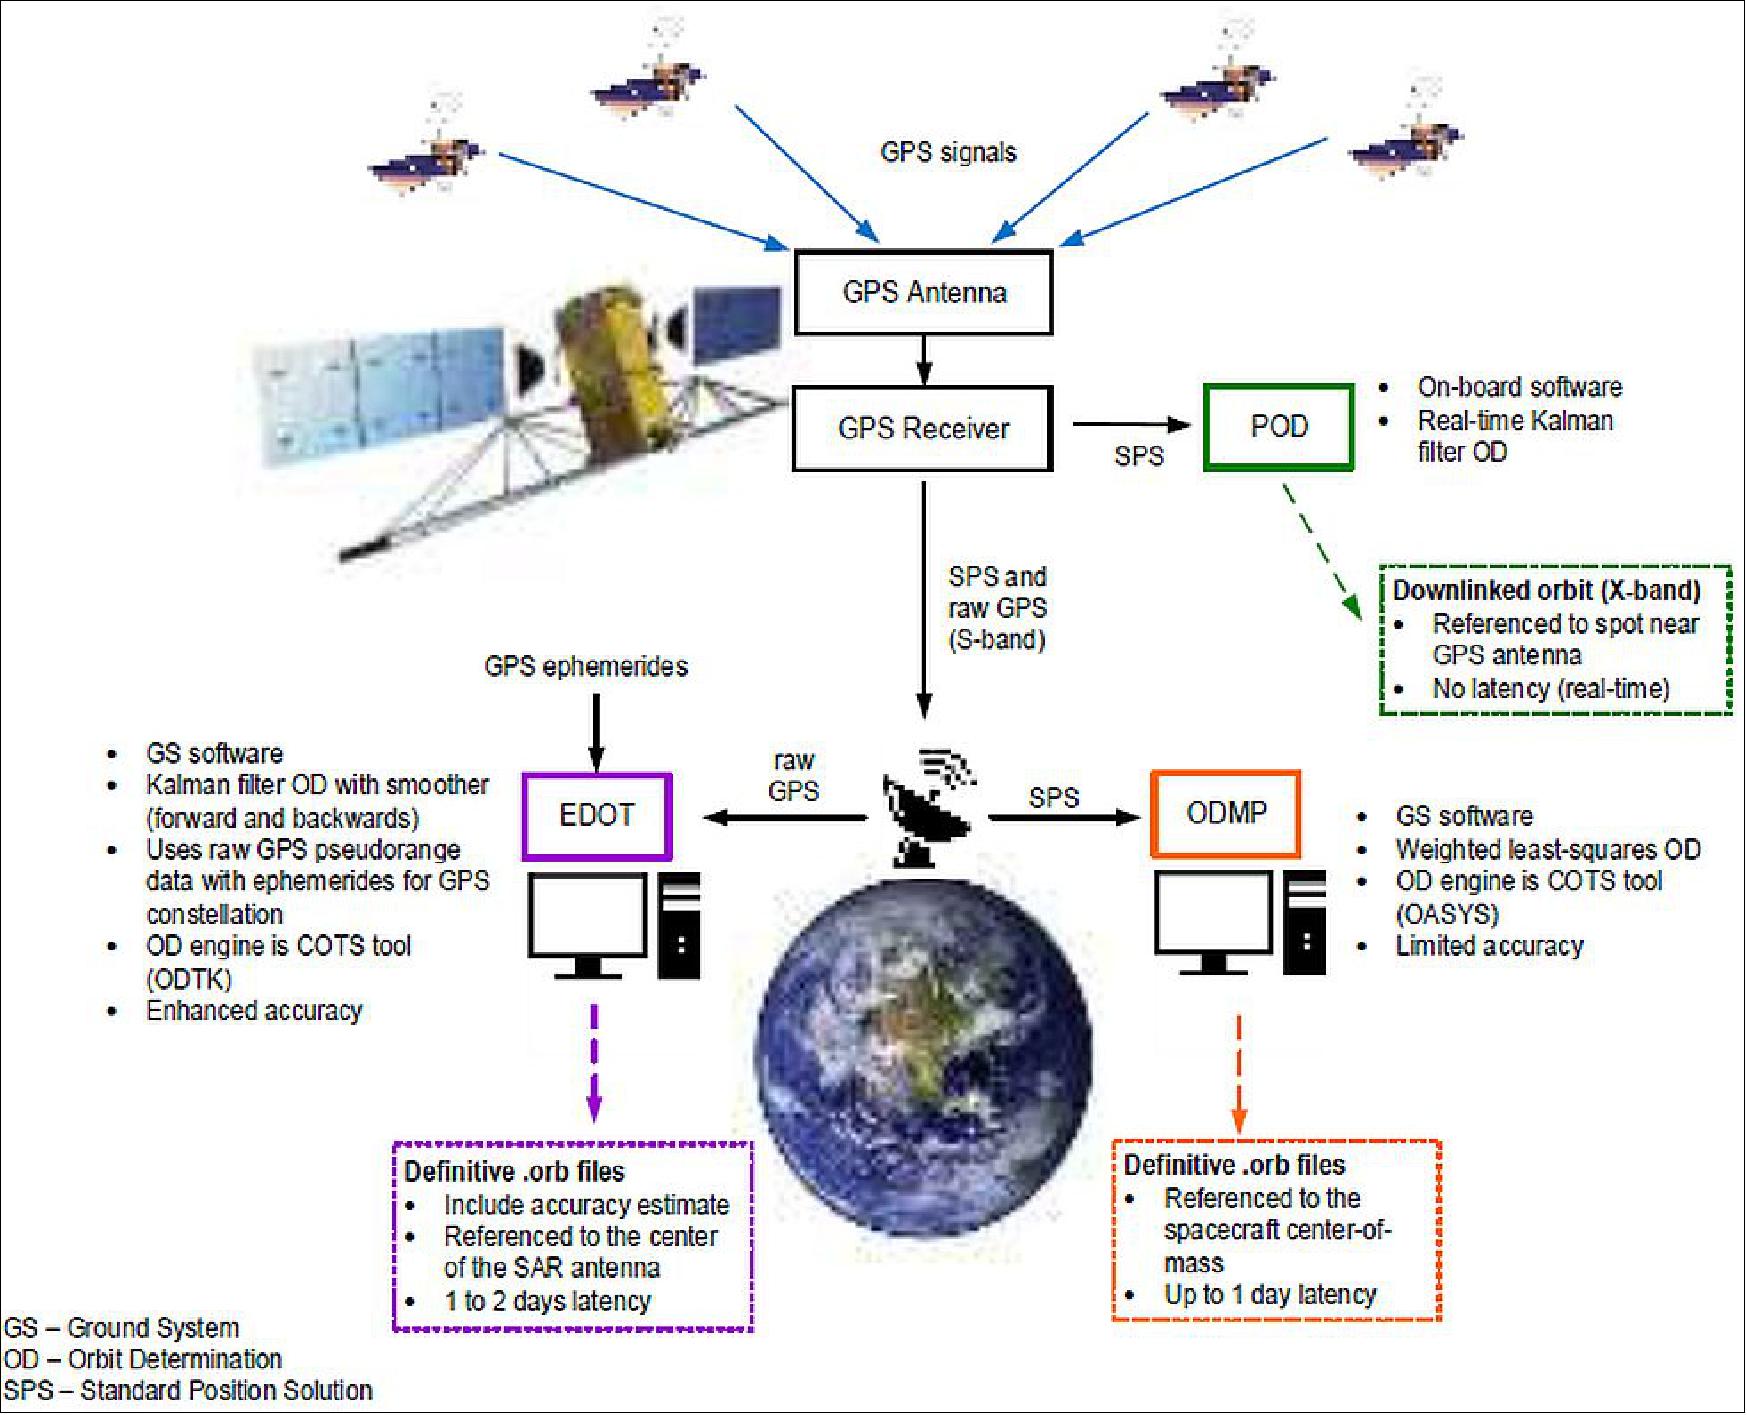
• August 10, 2015: RADARSAT-2 has maintained exceptional performance, meeting or exceeding system targets without measurable degradation. The 2012 SAR antenna CDU failure was mitigated by redundancy usage and a comprehensive plan. Minor anomalies, including propulsion system heater failures, were addressed through workarounds and software patches. The solar array's Sun tracking mode significantly reduced battery cycles. Thermally, some systems experienced higher temperatures after the solar array configuration change, but they remained within operating ranges. Attitude performance remains excellent, and fuel consumption for drag make-up maneuvers is low. The introduction of the Enhanced Definitive Orbit Tool (EDOT) in 2014 improved high-precision SAR product quality, utilizing raw GPS measurements and accounting for satellite attitude, enhancing orbit accuracy. EDOT's latency, using Rapid GPS ephemerides, is between one and two days, providing enhanced orbit accuracy for historical and future RADARSAT-2 data, benefiting applications like interferometry and geolocation. Figure 6 illustrates the EDOT in the RADARSAT-2 context (note that "ODMP" is the current Orbit Determination Software). 29)
• August 1, 2015: The Enhanced Management of Orders and Conflicts (EMOC) process, initiated by the Canadian Space Agency (CSA), addresses the coordination of RADARSAT-2 data ordering and planning for Government of Canada (GoC) users. Developed in response to increased SAR applications and potential conflicts, EMOC evolved from an ad-hoc project to a mandated, operational process managed by the CSA Order Desk. It facilitates transparent collaboration among GoC users, resolving conflicts and maximizing satellite resource utilization. EMOC's monthly cycle involves collecting, resolving conflicts, coordinating compatible requests, creating a coordinated acquisition plan, and submitting requests. In 2014, over 1000 RADARSAT-2 acquisition requests were processed monthly, enhancing data allocation efficiency, avoiding high programming fees, and increasing user satisfaction. EMOC's success lies in its collaborative approach, transparent processes, and substantial cost-saving measures, serving as a crucial mechanism until the RADARSAT Constellation Mission becomes operational. 30)
• February 2015: RADARSAT-2, designed for reliability and operational flexibility, continues to exceed its mission specifications, meeting the increasing demands of its global user base. Positioned to operate effectively for several more years, RADARSAT-2 serves as a vital asset for diverse applications. The future RADARSAT Constellation Mission (RCM) represents the program's evolution, aiming for data continuity, enhanced SAR operational use, and improved system reliability. Comprising three satellites, RCM offers around-the-clock coverage, enabling frequent monitoring of strategic areas. Scheduled for launch in 2018, RCM integrates automated identification system technology for real-time ship detection and identification, providing comprehensive coverage of Canada's land and oceans and daily access to 95% of the world for international users. 31)
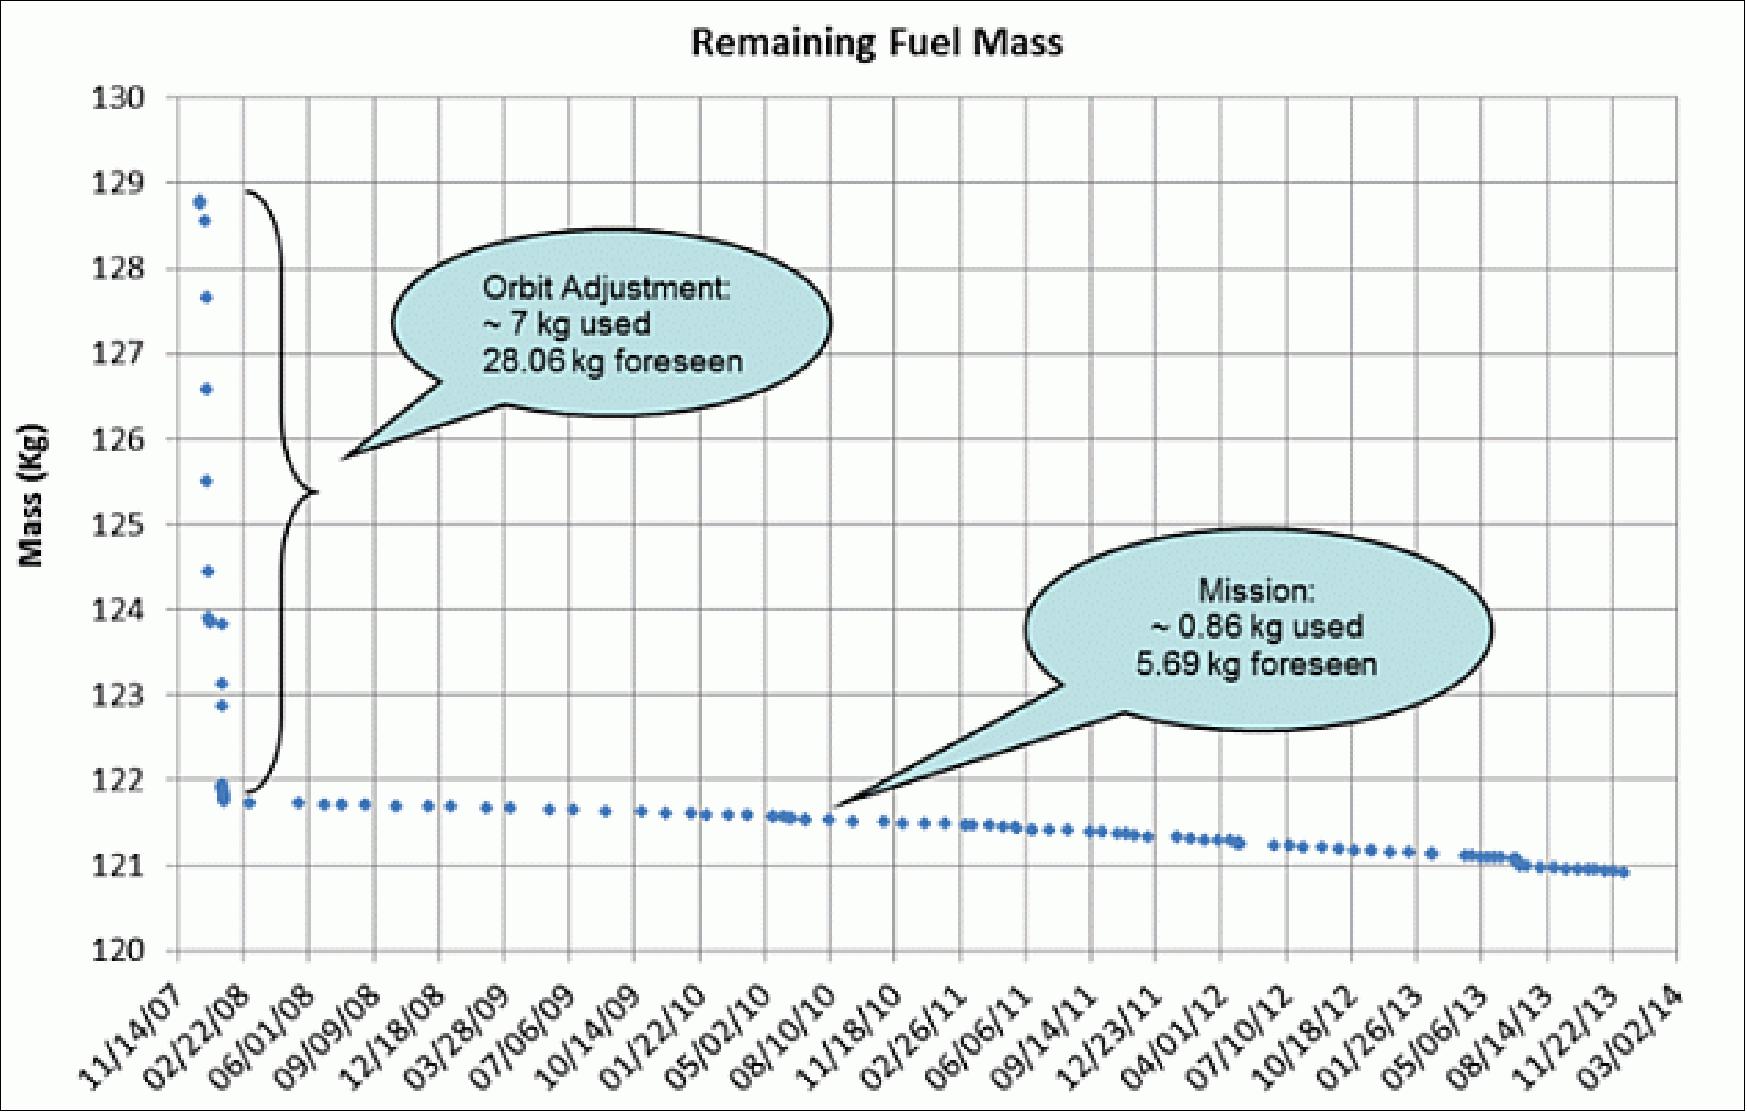
• July 2014: In its seventh year of operation, RADARSAT-2 continues to perform well, meeting or surpassing system performance targets. The most notable anomaly was the SAR antenna CDU unit failure in 2012, mitigated by redundancy. The longest outage in the past year resulted from a battery overvoltage issue, now resolved with algorithm adjustments. Transient attitude instabilities were addressed with logic and sequencing changes. The decision to maintain sun tracking configuration aims to optimize battery life. Ground segment improvements focus on SAR data downlink planning flexibility, processor upgrades, and orbit determination accuracy. The extensive global network of X-band SAR data reception stations has expanded to 26 sites. Future plans include routine availability of enhanced definitive orbits, the introduction of high incidence angle imaging modes, and exploration of enhancements for maritime surveillance and ship detection. The system evolves with a balance between long-term maintainability and feature improvements. Figure 7 shows the fuel consumption since launch. 32)
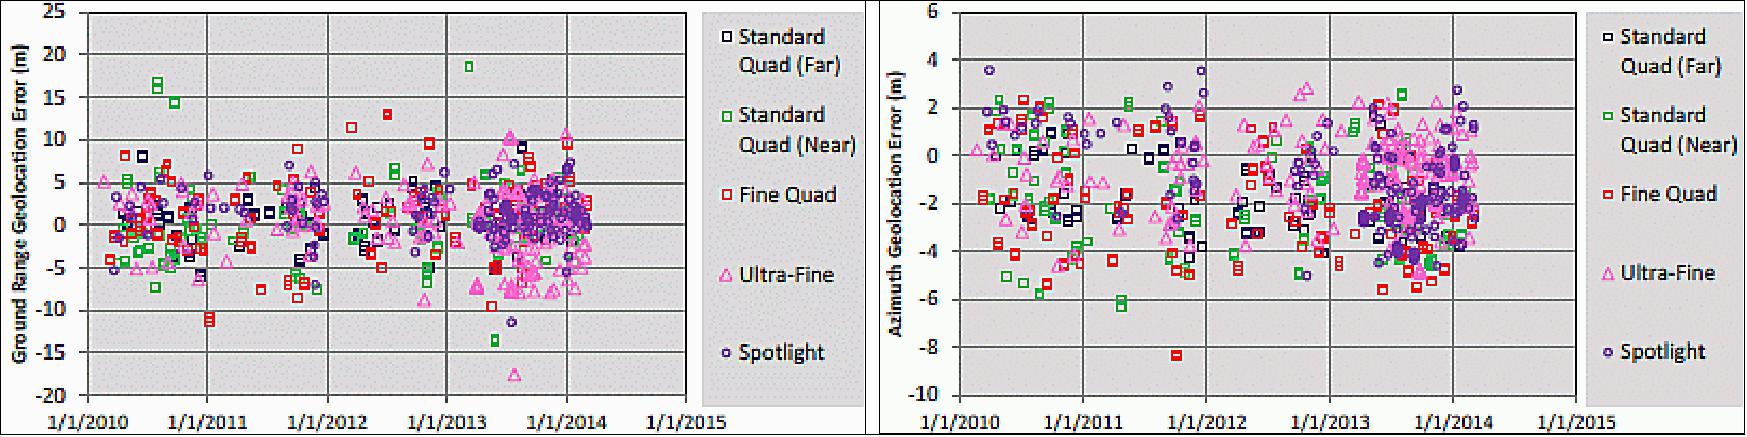
• June 2014: The performance of RADARSAT-2 remains robust across various parameters, ensuring high-quality image products. The satellite's image quality, characterized by stable resolutions, radiometric accuracy, and low noise levels, continues to meet operational objectives. The Near Real-Time (NRT) geolocation accuracy is excellent, facilitated by precise ephemeris data. The elevation beam pointing accuracy exhibits stability, with minimal errors. In the azimuth direction, some variability in beam pointing knowledge is observed, influenced by seasonal factors, yet this has negligible impact on image quality due to adaptive processing. Dual-receive aperture balance is effectively managed, compensating for phase imbalances. Polarimetric accuracy, while subject to seasonal fluctuations, remains within specifications, with calibration adjustments addressing longer-term drifts. Overall, RADARSAT-2 demonstrates consistent and reliable performance in delivering high-quality synthetic aperture radar (SAR) data for diverse applications. Figure 8 shows the latest results for the subset of modes that are used to monitor calibrated corner reflectors. 33)
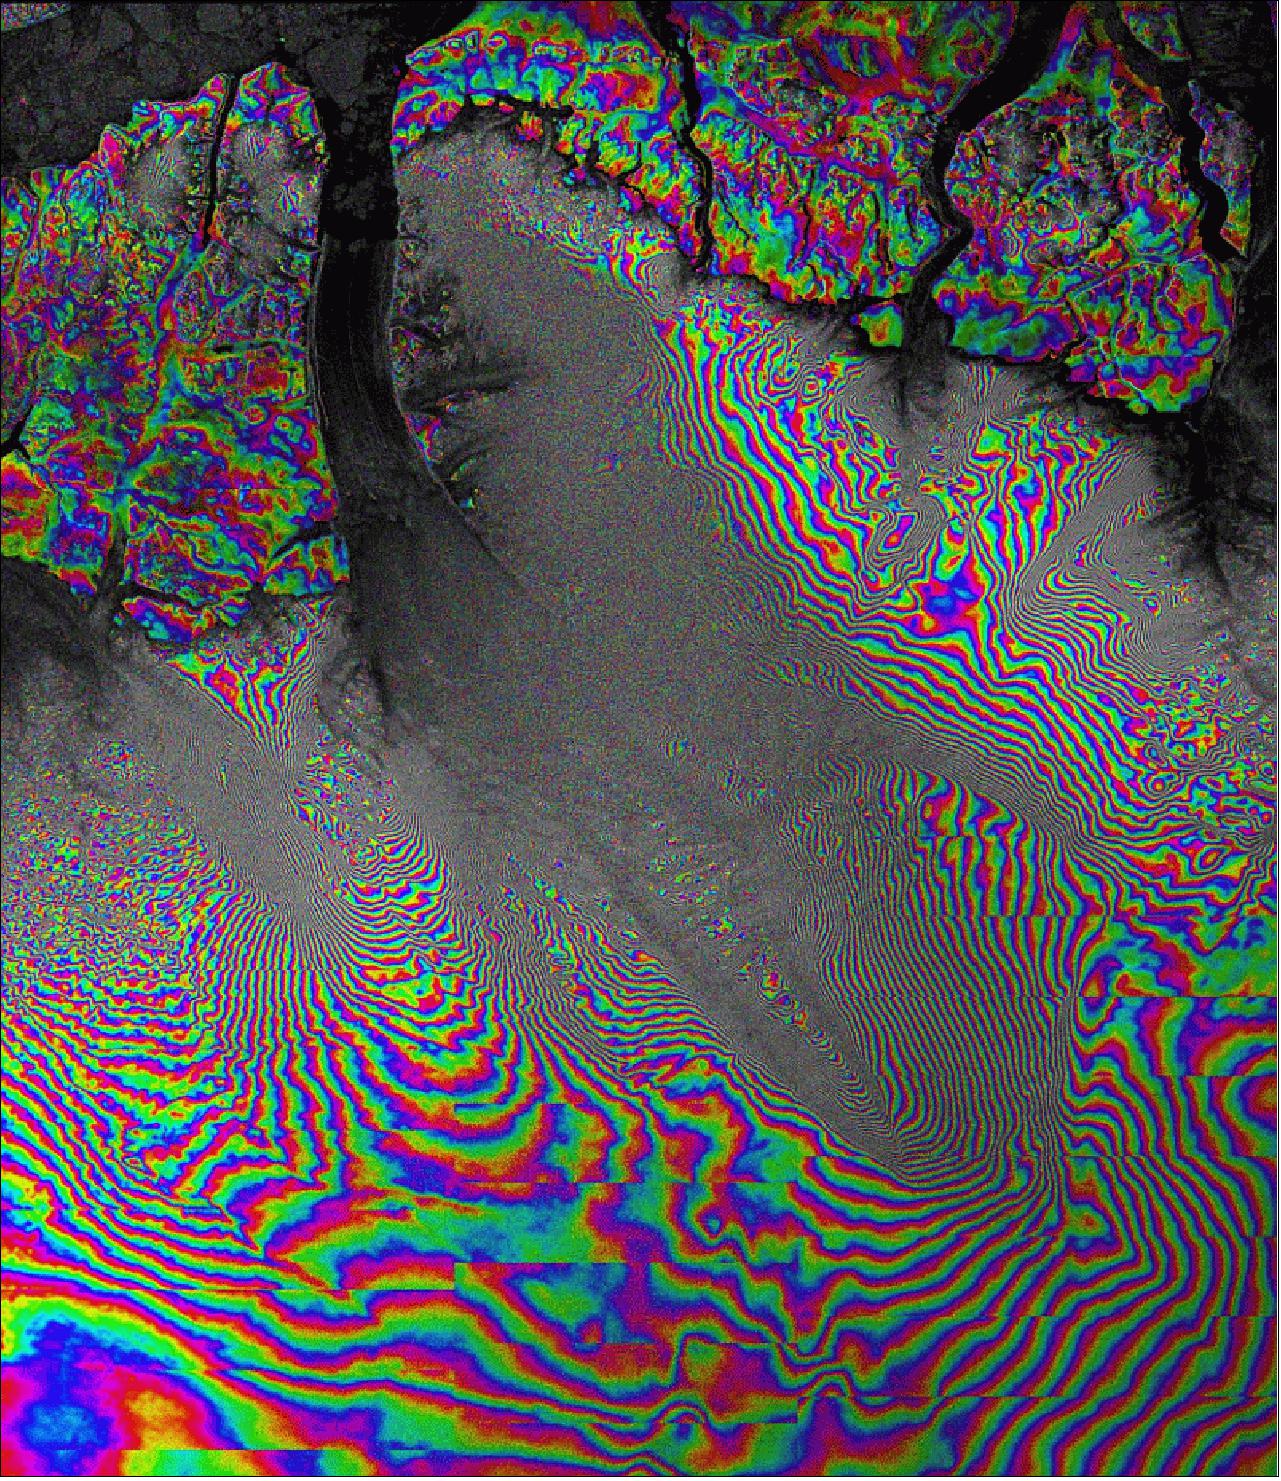
• March 17, 2014: The interferogram presented in Figure 9 depicts the Petermann Glacier's movement toward the northwestern coast of Greenland, generated using two RADARSAT-2 TOPS images acquired 24 days apart. Specifically programmed for an experimental imaging mode called TOPS (Terrain Observation by Progressive Scans), RADARSAT-2 aligns its azimuth scanning with ESA's Sentinel-1 for enhanced Earth observation. Employing InSAR (Interferometric SAR), the technique reveals large-scale surface changes by combining radar images, manifesting as rainbow-colored fringes indicating phase variations. The image illustrates both stationary and slowly moving features, along with rapidly moving ice areas, where the interferometric fringes vary in spacing, being widely distributed in stationary regions and closely packed in the faster-moving central glacier area. 34)
• December 13, 2013: MDA's Information Systems group announced that it has signed an agreement with the European Space Agency (ESA) to provide RADARSAT-2 information to user groups under ESA's Third Party Mission Program. The RADARSAT information will be used to perform research and develop applications and services such as ice monitoring, pollution monitoring, disaster management, agricultural monitoring and forest management. 35)
• October 21, 2013: MDA has secured two contracts related to RADARSAT-2 information and services. Firstly, the Norwegian Space Center has extended a contract, originally signed in January 2003, for an additional three years. This extension allows MDA to continue providing RADARSAT-2 data to the Norwegian government for applications such as ice mapping, landslide monitoring, oil spill detection, and ship detection services. The second contract involves an amendment for MDA to prolong its provision of RADARSAT-2 imagery until November 2014 in support of Europe's Copernicus program. The extended use of RADARSAT-2 imagery will play a crucial role in sea ice monitoring across the Baltic Sea, Arctic Ocean, and Antarctic Ocean, contributing to maritime navigation safety and environmental monitoring within the Copernicus program. 36)
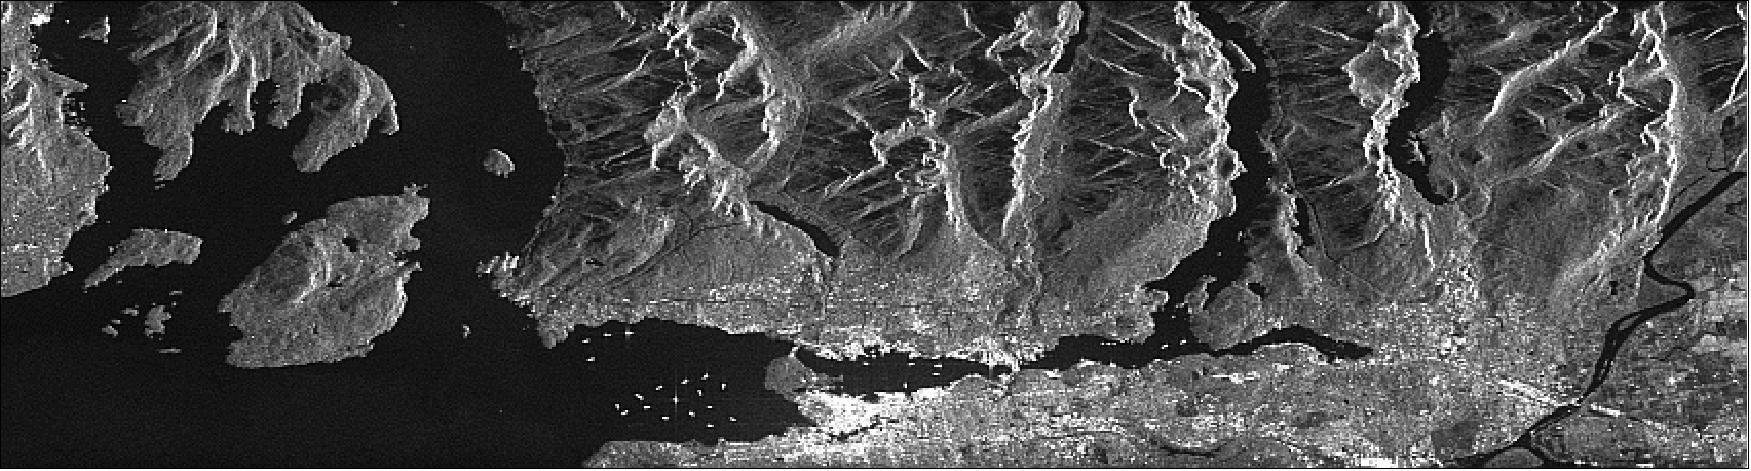
• May 2013: MDA successfully reprogrammed RADARSAT-2 to emulate the imaging method of the European Space Agency's Sentinel-1 spacecraft, utilizing the Terrain Observation with Progressive Scan (TOPS) SAR operations support mode. This achievement is notable for achieving an image quality closely resembling that of Sentinel-1. The initial results, demonstrated over Vancouver harbor in Canada, exhibit clear visibility of the city, docked ships, coastline, and nearby mountain ranges. Further image acquisitions over specific test sites are planned to showcase Sentinel-1's suitability for sea-ice classification, applications involving ocean winds and waves, and ship detection, facilitating user readiness for data utilization. 37) 38)
• July 27, 2012: The RADARSAT-2 spacecraft and its payload are operating nominally, completing four years of routine phase operations. A mid-life review of all spacecraft subsystems has been conducted, demonstrating overall good performance. Some notable performance items include occasional system outages due to transient events, increased frequency of orbit maneuvers to counter higher solar activity, and improvements such as the introduction of alternate downlink capabilities for enhanced data flexibility. The development of new and enhanced beam modes, such as the upcoming Extra Fine mode, reflects ongoing efforts to optimize swath width, resolution, and coverage. Despite past challenges like payload timeout issues, comprehensive investigations and adjustments have resulted in a notable decrease in occurrence. 43)
• July 20, 2012: MDA has entered into a contract amendment with the Canadian Space Agency and the European Space Agency to enhance the provision of RADARSAT-2 satellite imagery for Europe's GMES (Global Monitoring for Environment and Security) program. This amendment addresses a data gap resulting from the loss of ESA's Envisat spacecraft in April 2012. The extended RADARSAT-2 imagery support will fulfill ESA's maritime monitoring needs until the full operational capacity of the Sentinel-1A satellite is achieved around mid-2014. The imagery will play a crucial role in sea ice monitoring in the Baltic Sea, Arctic Ocean, and Antarctic Ocean, contributing to maritime navigation safety and environmental monitoring under the GMES program's objectives. GMES aims to provide accurate and timely information services for environmental management, climate change mitigation, and civil security in Europe. 42)
• July 10, 2012: RADARSAT-2 has enhanced its capabilities for spaceborne monitoring of vessel traffic and fishing activities by introducing five new modes in response to user demand. These modes offer improved flexibility in resolution, polarization, and look direction, providing better opportunities for operational ship detection. The Wide Fine, Wide Multi-Look Fine, Wide Ultra-Fine, Wide Standard Quad-Polarization, and Wide Fine Quad-Polarization modes address various scenarios by offering combinations of finer spatial resolution, wider swath width, and quad-polarization. This expansion allows users to order high-resolution and quad-polarization images with broader coverage, catering to a range of operational needs beyond research purposes and small areas of interest. 54) 55) 56)
Beam mode | Nominal swath width | Swath width for regular corresponding mode | Range resolution | Azimuth resolution | Incidence angle | Polarization (pol) | Applications |
Wide ultra fine | 50 km | 20 km | 1.6 - 3.3 m | 2.8 m | 30-50º | Single-pol | Same resolution as ultra fine mode, but wider swath |
Wide multi-look fine | 90 km | 50 km | 3.1-10.4 m | 4.6-7.6 m | 29 - 50º | HH,VV, HV, or VH | Wider swath than milti-look fine, butsame spatial and radiometric resolution. 50% overlap between individual swaths |
Wide fine | 120-170 km | 50 km | 5.2-15.2 m | 7.7 m | 20 - 45º | Single-pol or dual-pol | Good resolution (same as for fine beam) and a wider swath (same as for wide beam) |
Wide fine Quad-Pol | 50 km | 25 km | 5.2-17.3 m | 7.6 m | 18 - 42º | Quad-pol | 21 beams. Wider swath width. Same spatial resolution as for the original modes. 50% overlap between the modes |
Wide standard Quad-Pol | 50 km | 25 km | 9-30.0 m | 7.6 m | 18 - 42º |
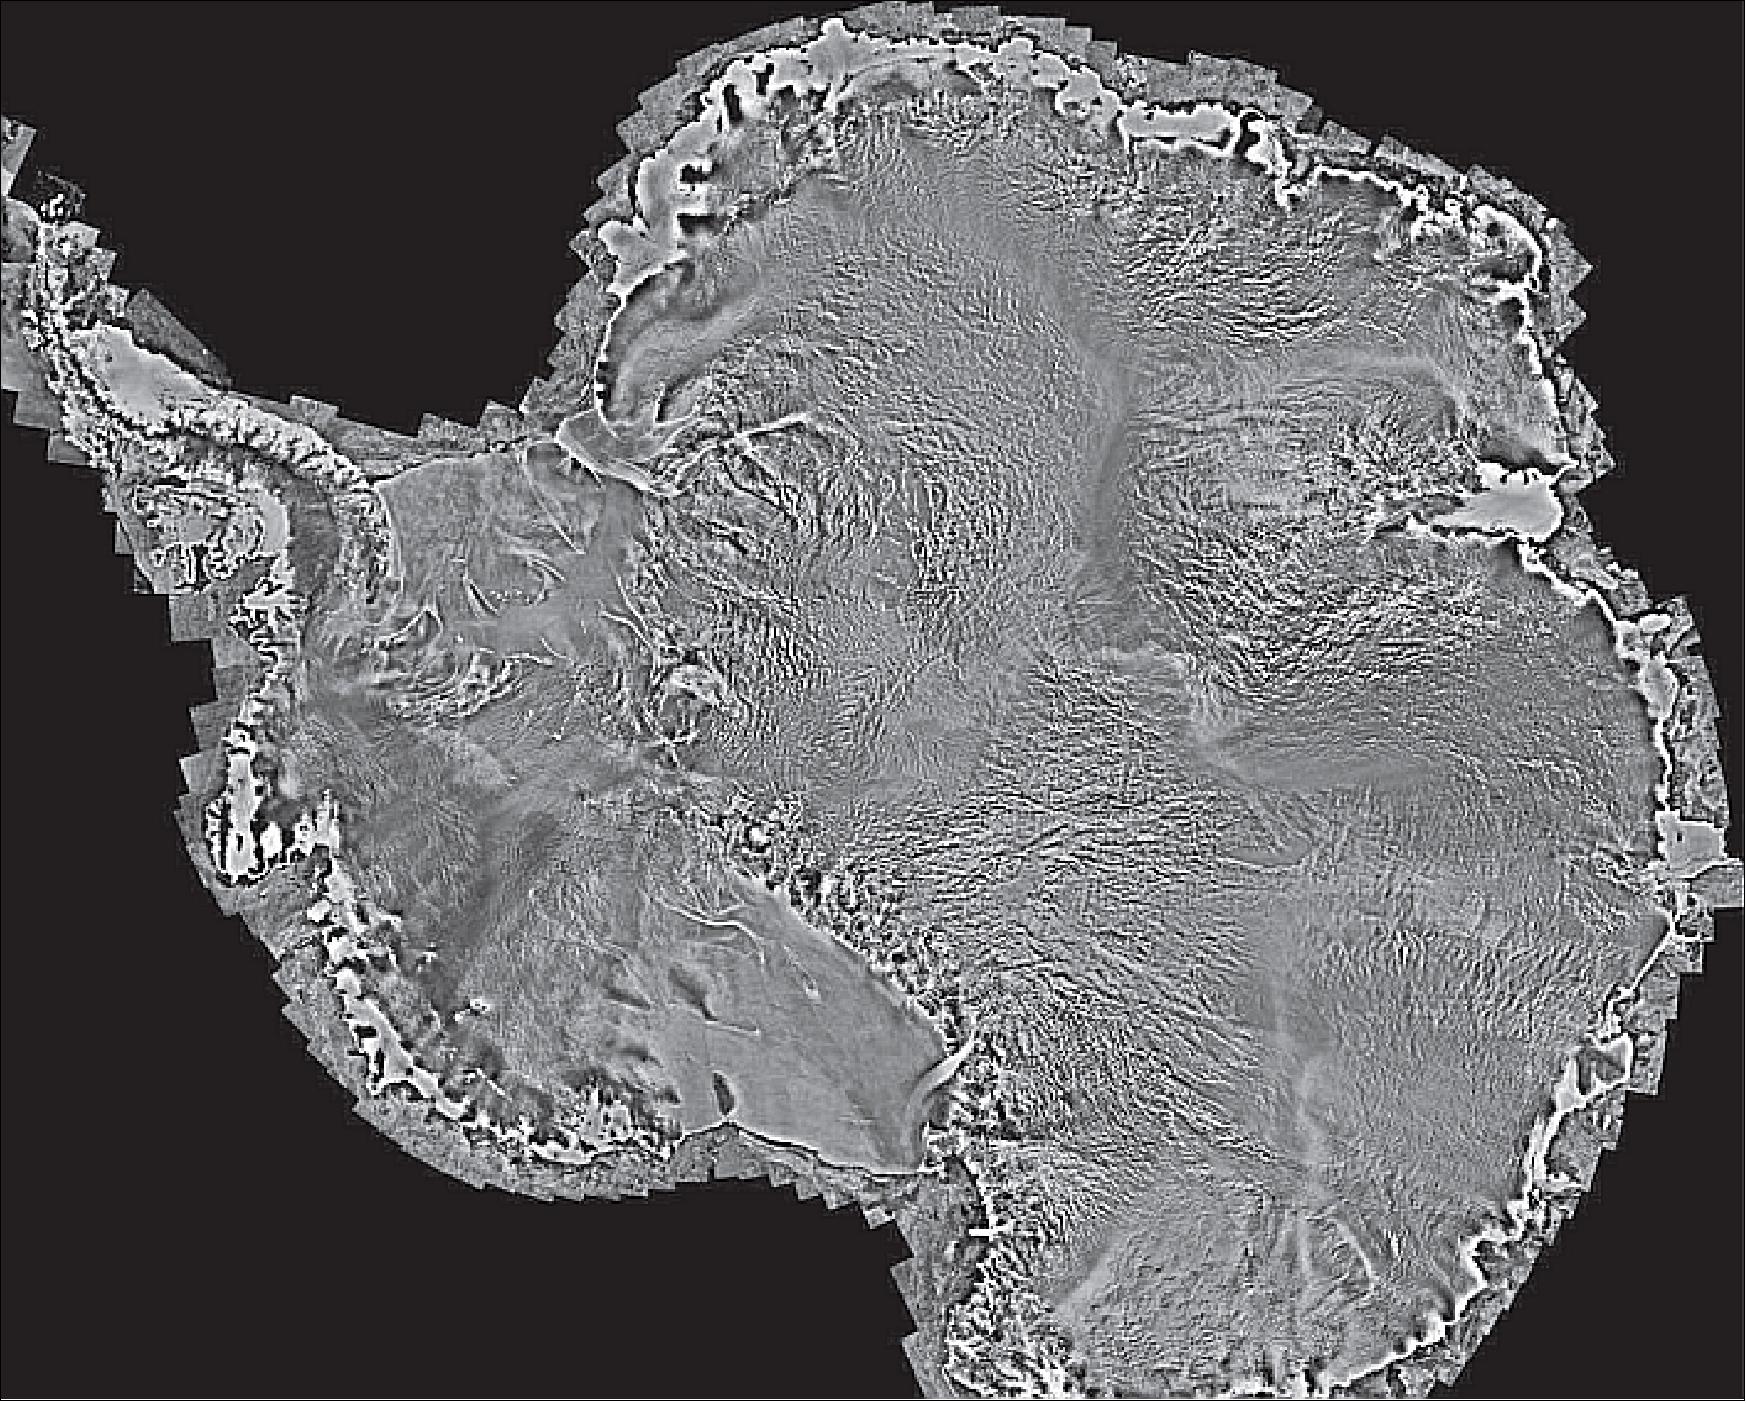
• August 18, 2011: The University of California at Irvine (UCI) researchers have leveraged imagery from the Canadian satellite RADARSAT-2, along with data from other international satellites, to make groundbreaking discoveries in Antarctica. Utilizing NASA technology, the researchers mapped previously unknown glaciers, revealing unique terrain features that offer insights into the direction and velocity of Antarctic ice flow. RADARSAT-2's distinctive capability to capture data over the central part of the continent facilitated full continental coverage from the South Pole to the coast, providing crucial information for understanding ice melt and predicting future sea-level rise due to climate change. The project, funded by NASA, demonstrates the vital role of satellite data in advancing Antarctic research. 44) 45) 46) 47) 48)

• September 2011: MDA signed a contract with the US NGA (National Geospatial-Intelligence Agency) to provide the SAR data of RADASAT-2 to be used in creating ice charts and for maritime surveillance to improve the safety of maritime navigation. 49)
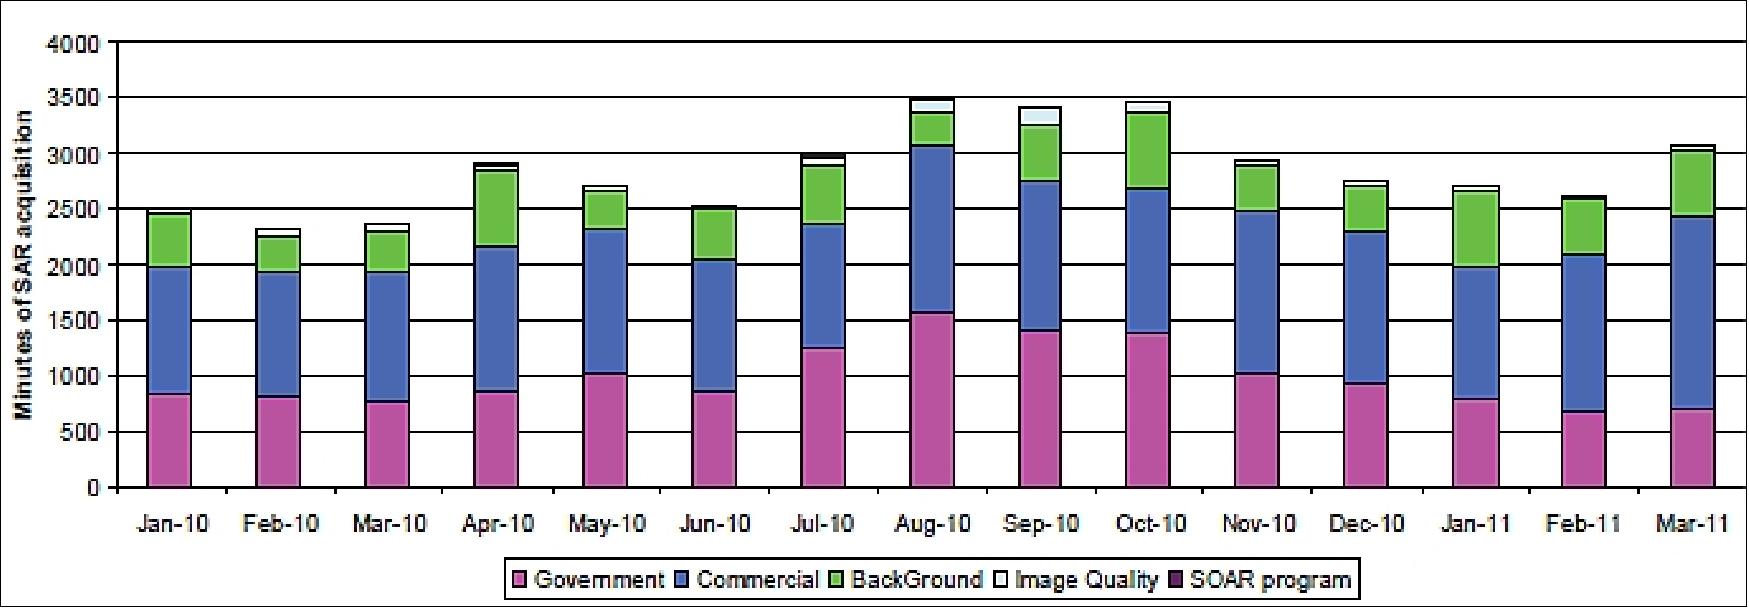
• July 29, 2011: RADARSAT-2 has completed over three years of routine phase operations, maintaining high availability and meeting performance specifications. The spacecraft's success rate for image acquisitions has remained robust, exceeding 97%. Despite the growing demand for Synthetic Aperture Radar (SAR) data, as reflected in Figure 12, the system has demonstrated resilience, with the team implementing various enhancements to address anomalies, particularly those attributed to Single Event Upsets. Image quality has been consistently maintained or improved through a performance monitoring campaign, allowing the identification of issues and potential enhancements. Mission planning has been a focus, with several system improvements, including feasibility checks, order desk template functionality, and upgrades to support the Heterogeneous Mission Access (HMA) interface with ESA. The addition of new receiving stations has expanded the global network, emphasizing RADARSAT-2's enduring capabilities in Earth observation. The spacecraft has executed orbit maintenance maneuvers, collision avoidance procedures, and contributed to projects like the Antarctic mosaic (Figure 13) and Project Polar Epsilon for ship detection. The continuous attention to system optimization, risk mitigation, and collaborative initiatives underscores the mission's commitment to excellence in satellite operations. 50) 51)
• August 2010: RADARSAT-2 continues to demonstrate adherence to specifications and stability in key parameters. Impulse response measures remain consistent with expectations, and radiometry has shown stability since the start of the Operational Phase, with no system calibration adjustments required. Periodic polarimetric calibration adjustments ensure accuracy within original goals. Geolocation accuracy is assessed as less than 10 meters for all single beam modes. Notably, additional Quad-Pol beams, totaling 31 swath positions, have been introduced operationally, covering a range of incidences from 20º to 49º. 52) 53)
• April 2010: RADARSAT-2 has successfully completed its second year of routine phase operations, maintaining and exceeding performance specifications. The mission operations team has reduced system outage trends, demonstrating increased reliability. Notably, orbital collision risk mitigation measures gained importance, leading to the execution of RADARSAT-2's first avoidance maneuver as a precaution. Ongoing improvements include the introduction of new and enhanced beam modes, and a significant upgrade to support the DND Polar Epsilon project is underway. The spacecraft continues to meet performance specifications, with stable thermal and power performance, and nominal battery performance during the annual eclipse season. Additionally, RADARSAT-2 has actively supported moving object detection experiments conducted by Defence R&D Canada. 59)
• June 19, 2009: RADARSAT-2 is involved in the Global Monitoring for Environment and Security (GMES) initiative of the European Union. In early 2010, MDA finalized a project to establish the Heterogeneous Mission Access (HMA) catalog interface capability, enabling cohesive access to archives to support scientific exploitation. 61)
• April 24, 2008: RADARSAT-2 achieved operational status, marking the conclusion of the commissioning phase following the Commissioning Review. Subsequently, additional modes such as Spotlight and Moving Object Detection Experiments (MODEX, i.e., Ground Moving Target Indicator) were introduced. Ongoing efforts have focused on enhancing the performance of all modes beyond the original specifications. One notable feature is the availability of both left- and right-looking modes, enabling regular mapping of Antarctica and providing flexibility in emergency situations to optimize beam mode and position for extensive coverage of specific regions. 64) 65) 66) 67) 68)
• December 18, 2007: The very first images of RADARSAT-2 were acquired just four days after launch.
Sensor Complement
The payload module consists of the SAR instrument, the SAR antenna, and specific support equipment required to perform such functions as timing and control of the payload, signal distribution, signal detection, thermal control, data storage, and X-band downlink.
SAR (Synthetic Aperture Radar) Instrument
The SAR instrument specification is outlined in Tables 7 and 8 with the following functional capabilities: 69)
• Operationally, the SAR instrument is identical to that of RADARSAT-1 (with regard to mission control, mission planning, and data collection and processing)
• Fully integrated into the RADARSAT-1 ground segment
• Supports tandem mission operations with RADARSAT-1
• All RADARSAT-1 image quality specifications are met or exceeded
• A 3 m ultra-fine resolution is provided (improved object detection)
• A selectable incidence angle and the choice of left- and right-looking imaging capability is provided with the ability to maneuver the S/C on command. This feature offers much quicker revisit times for handling user requests. It also doubles FOR (Field of Regard) for event monitoring support applications.
• Provision of fully polarimetric imaging modes. Polarimetry modes (amplitude and phase information) increase the information content of the measurement.
• An increased downlink power permits the use of 3 m antenna dishes for ground receiving stations
• The encrypted downlink science data stream maintains service confidentiality
• The utilization of onboard GPS receivers offers real-time position knowledge within 60 m
• The functional exploitation of solid-state recording technology permits the provision of new customer services (selection of image scenes and receiving station)
The most fundamental change in the instrument design from RADARSAT-1 is the introduction of an active phased array antenna on RADARSAT-2 providing two-dimensional beamforming and beamsteering to produce the many (over 200) beams required for the various imaging modes. This replaces the passive slotted waveguide antenna with one-dimensional elevation beamforming of the earlier S/C. The full set of modes is given in Table 8, and they are illustrated in Figure 16. All modes are available in both left- and right-looking satellite orientations. 70) 71)
The AIU (Antenna Interface Unit) and 16 CDU (Column Drive Units), one on each column, perform the command & control and the power distribution functions of the antenna.
Center Frequency | 5.405 GHz, C-band (5.5 cm wavelength) |
RF bandwidth | 11.6, 17.3, 30, 50, or 100 MHz |
Transmitter power (peak) | 1650 W (normal mode), 2280 W (ultra fine mode) |
SAR Antenna | - Aperture size: 15 m x 1.37 m |
Antenna polarization | - Full polarimetric (HH, VV, HV, VH) |
Deployment mechanism | Antenna, ESS (Extendible Support Structure) |
Imaging mode delay time | 10 ms |
X-band downlink margin at 5º elevation | 9 dB (allows 3 m receiving ground station antenna) |
Data rate (max) | 105 Mbit/s [recorded (encrypted) and realtime] |
Mass of SAR antenna | 750 kg |
Transmit H or V | Beam modes | Nominal swath width | Incidence angles to left or right side | Nr. of looks Range x Azimuth | Spatial | Swath coverage left or right (km) |
Standard | 100 km | 20º - 49º | 1x4 | 25 x 28 | 250-750 | |
Wide | 150 km | 20º - 45º | 1x4 | 25 x 28 | 250-650 | |
Low incidence | 170 km | 10º - 23º | 1x4 | 40 x 28 | 125-300 | |
High incidence | 70 km | 50º - 60º | 1x4 | 20 x 28 | 750-1000 | |
Fine | 50 km | 37º - 49º | 1x1 | 10 x 9 | 525-750 | |
ScanSAR wide | 500 km | 20º - 49º | 4x4 | 100x100 | 250-750 | |
ScanSAR narrow | 300 km | 20º - 46º | 2x2 | 50 x 50 | 300-720 | |
New RADARSAT-2 modes (beyond those offered by RADARSAT-1) | ||||||
Polarimetric: transmit H, V on alternate pulses | Standard Quad polarization | 25 km | 20º - 41º | 1x4 | 25 x 28 | 250-600 |
Fine Quad polarization | 25 km | 20º - 41º | 1x1 | 11 x 9 | 400-600 | |
Selective single polarization | Multi-look fine | 50 km | 30º - 50º | 2x2 | 11 x 9 | 400-750 |
Ultra-fine | 20 km | 30º - 40º | 1x1 | 3 x 3 | 400-550 | |
SAR instrument calibration: The design of the RADARSAT-2 payload has made it possible to operate in fully polarimetric quad-polarization (quad-pol) modes, which introduce the requirement for polarimetric calibration on top of the radiometric calibration of all other modes. In addition to these two primary forms of calibration, there are also a number of other forms of image measurement and payload characterization work which must be undertaken in order to ensure that the required image quality is achieved and maintained. An IQS (Image Quality Subsystem) has been established within the RADARSAT-2 ground segment to perform these tasks, and the key tools required for analysis of data and generation of calibration information have been built into a suite of software provided in several IQS workstations. 72) 73)
SAR Instrument Overview
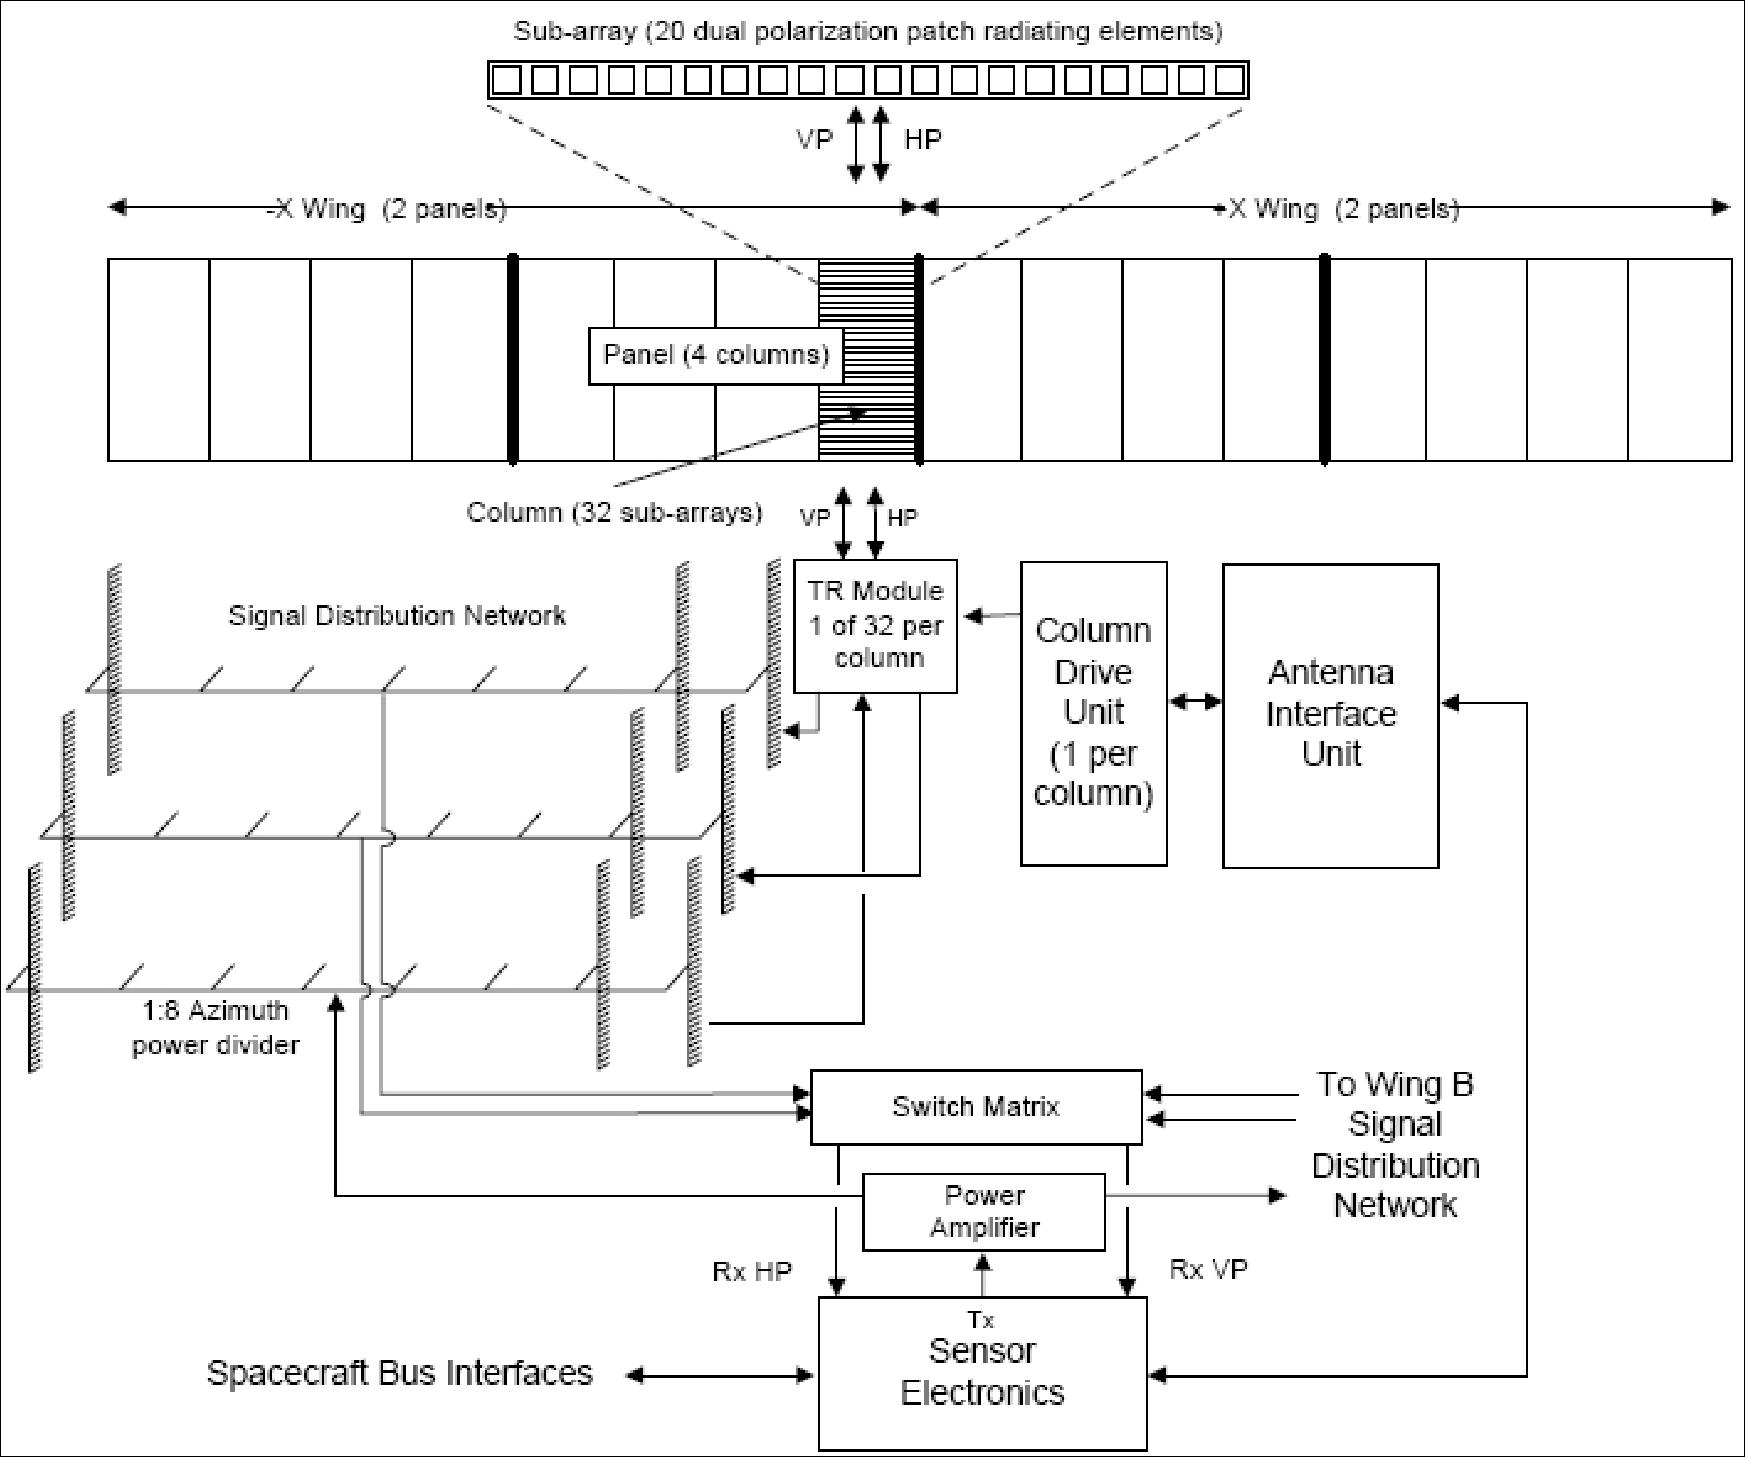
The SAR payload consists of the SAR Antenna and the Sensor Electronics (SE) as shown in Figure 19. The Antenna includes a planar distributed phased array antenna having 512 subarrays each interfaced to one solid state transmit / receive (T/R) module. The long, or horizontal, dimension (15 m) of the array is directed along the direction of flight. The short, or vertical, dimension (1.4 m) is oriented such that the normal to the physical antenna aperture is inclined towards the Earth's surface at an angle of 29.8º with respect to the vertical between the spacecraft and the ground. 74) 75)
The subarrays are each provided with dual ports to enable transmission and reception in horizontal polarization (HP) mode (electric field vector aligned with long dimension of the array) and vertical polarization (VP) mode (electric field vector aligned with the short dimension of the array). The 512 T/R modules and their associated radiating subarrays are arranged in 16 columns uniformly spaced over the length of the array. Each column comprises 32 T/R modules and subarrays uniformly spaced over the height of the array.
Low level transmit signal generation and on-board receive signal handling is performed by the SE (Sensor Electronics) subsystem. Low power transmit signal pulses at C-band are generated by a waveform generator within the SE and distributed to each T/R module via a PAA (Power Amplifier Assembly) and a corporate signal distribution network comprising APDN (Azimuth Power Dividing Networks) and EPDN (Elevation Power Dividing Networks). Radar echo pulses are amplified by the T/R modules and collected by two independent sets of corporate combining networks, one for each polarization. The receive path combining networks have the same physical and electrical properties as the transmitting network, but operate in the reverse direction.
The output signals from each of the combining networks are routed via the SM (Switch Matrix) to the two receiver channel inputs of the SE. The SM controls the routing of received signals from the antenna wings to the SE input ports as required by the current imaging mode, and allows a low power reference sample of the transmitted pulse to be inputted to the SE during the transmit pulse time.
The antenna radiating elements, T/R Modules, CDUs and associated power, control and RF signal interconnecting harnesses and distribution networks are mounted on the SAPA (SAR Antenna Panel Assembly) as shown in Figure 20.
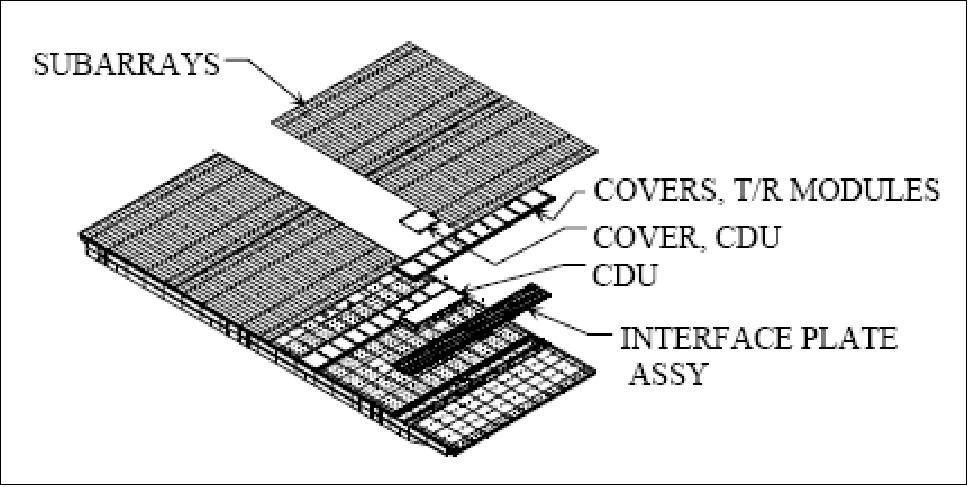
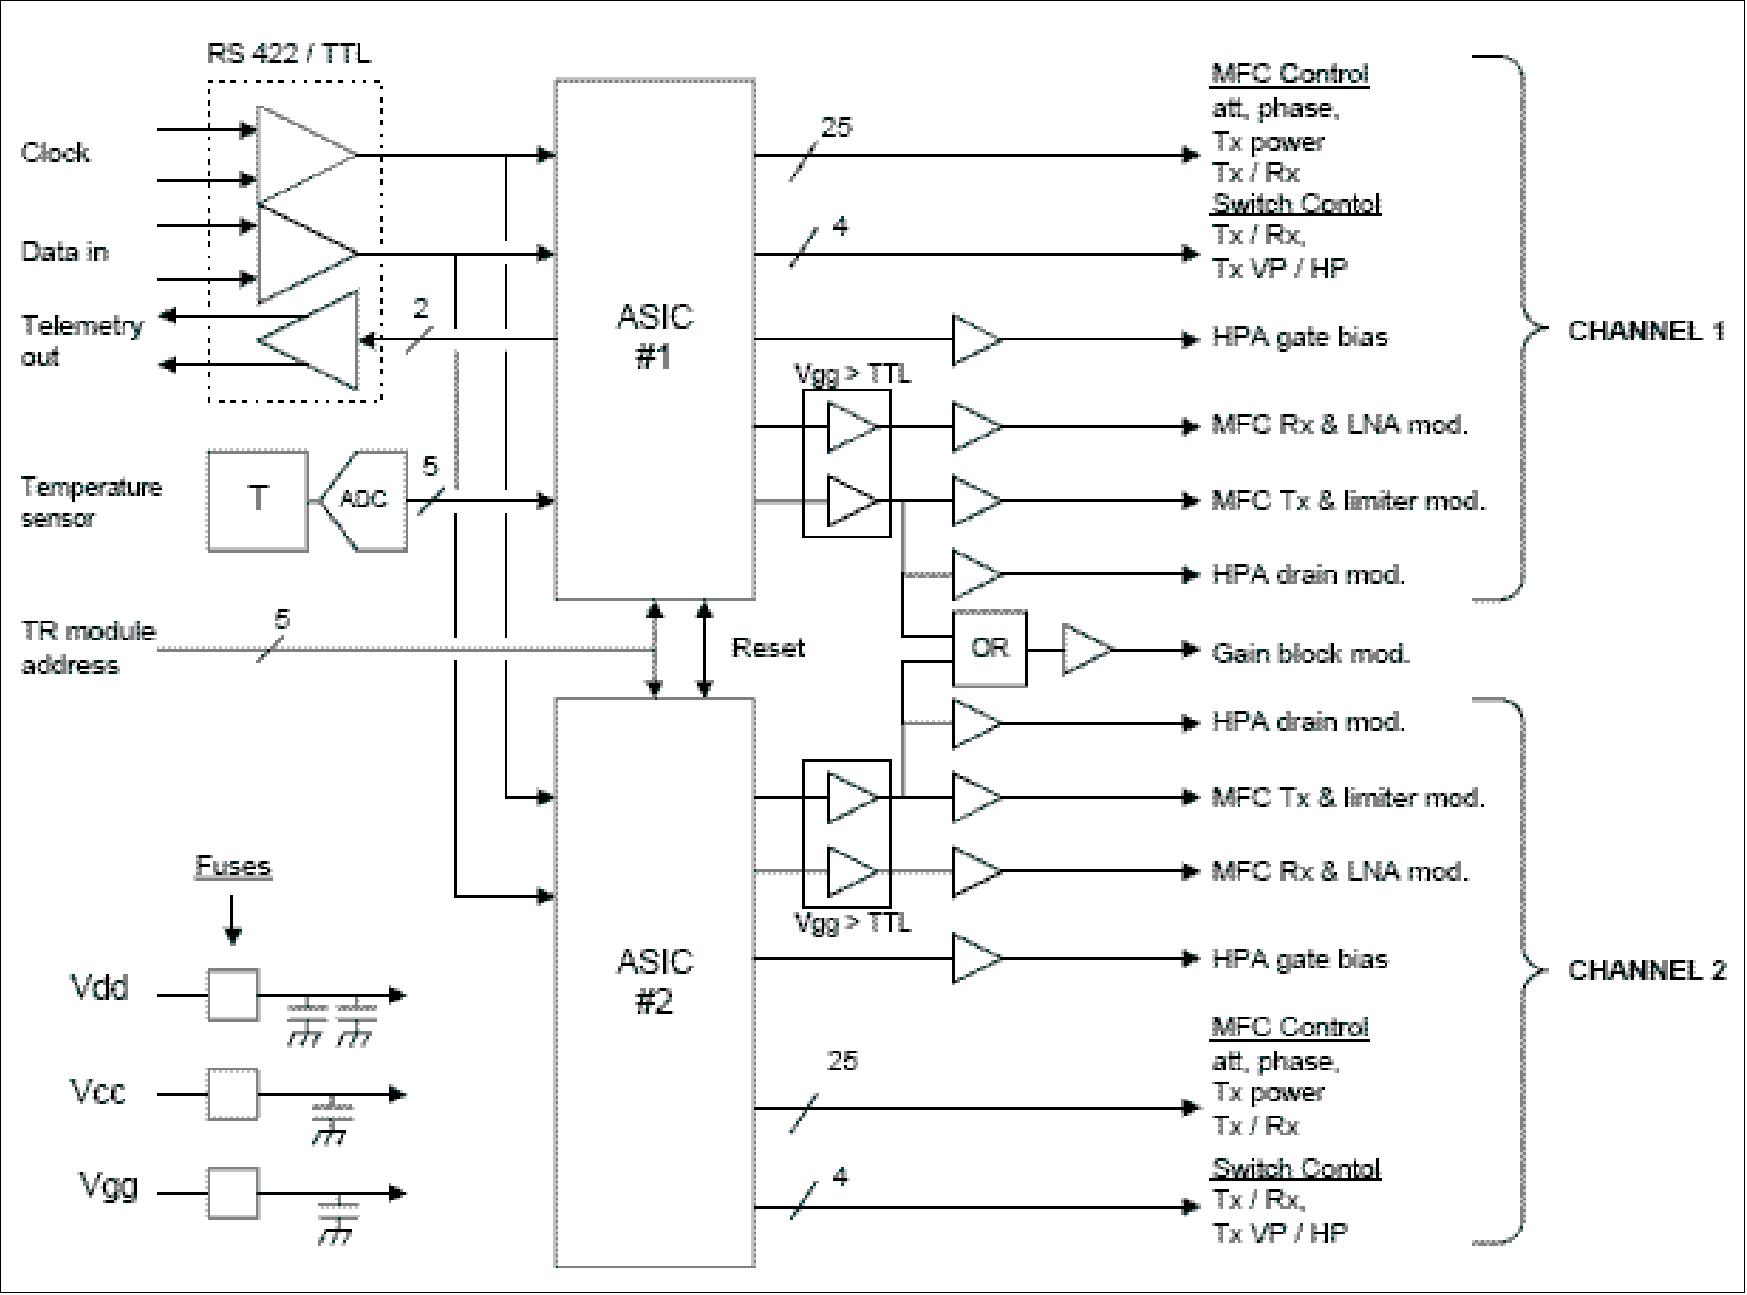
T/R module architecture (Figure 20): The T/R module provides the transmit RF power amplification and receive signal amplification for the antenna array. A T/R module includes two transmit power amplification channels and two receive channels. The two receive channels may be operated simultaneously for reception of V and H polarized signals. One transmit channel can be selected depending on the setting of the RF switches. If required, the transmit operation can alternate between H and V on alternate pulses.
A nominal peak pulse power of +6 dBm is applied to the 50 ohm transmit input port of each T/R module. The center frequency is 5.405 GHz, and maximum bandwidth, dependent on operating mode, is 100 MHz. The T/R module sends the Transmit RF pulse by the HP or VP port to the subarray. Nominal peak pulse output power levels are +40 dBm (10 watts) in high power mode and +38 dBm (6.3 W) in low power mode, into 50 ohm. Only one transmitter pulse output can be active at any one time. The same ports provide HP and VP 50 ohm RF receive interfaces with the subarray.
A control board, containing digital ASIC and discrete devices, controls the operation of T/R module RF functions. Two identical ASIC's, one dedicated to each RF channel, provide serial interface control, modulator drive, timing and phase and amplitude data memory functions for their associated RF channel.
MODEX (Moving Object Detection Experiment)
MODEX represents an experimental GMTI (Ground Moving Target Indication) capability of the SAR system on RADARSAT-2. During MODEX operation, the SAR antenna is partitioned into two subapertures along the satellite track to sequentially observe the same scene from the same spatial point. The technique allows a wide variety of operating modes and parameters to be tried. In one version of the experiment, similar to ultra-fine mode, MODEX makes use of the dual-receive capability of the RADARSAT-2 antenna. This dual-receive capability provides two apertures aligned in the along-track direction, which is suitable for detecting moving objects. By processing the received echo data using along-track interferometric techniques and DPCA (Displaced Phase Center Antenna) techniques, objects with non-zero radial velocities can be detected and their radial velocities can be estimated. 76) 77) 78)
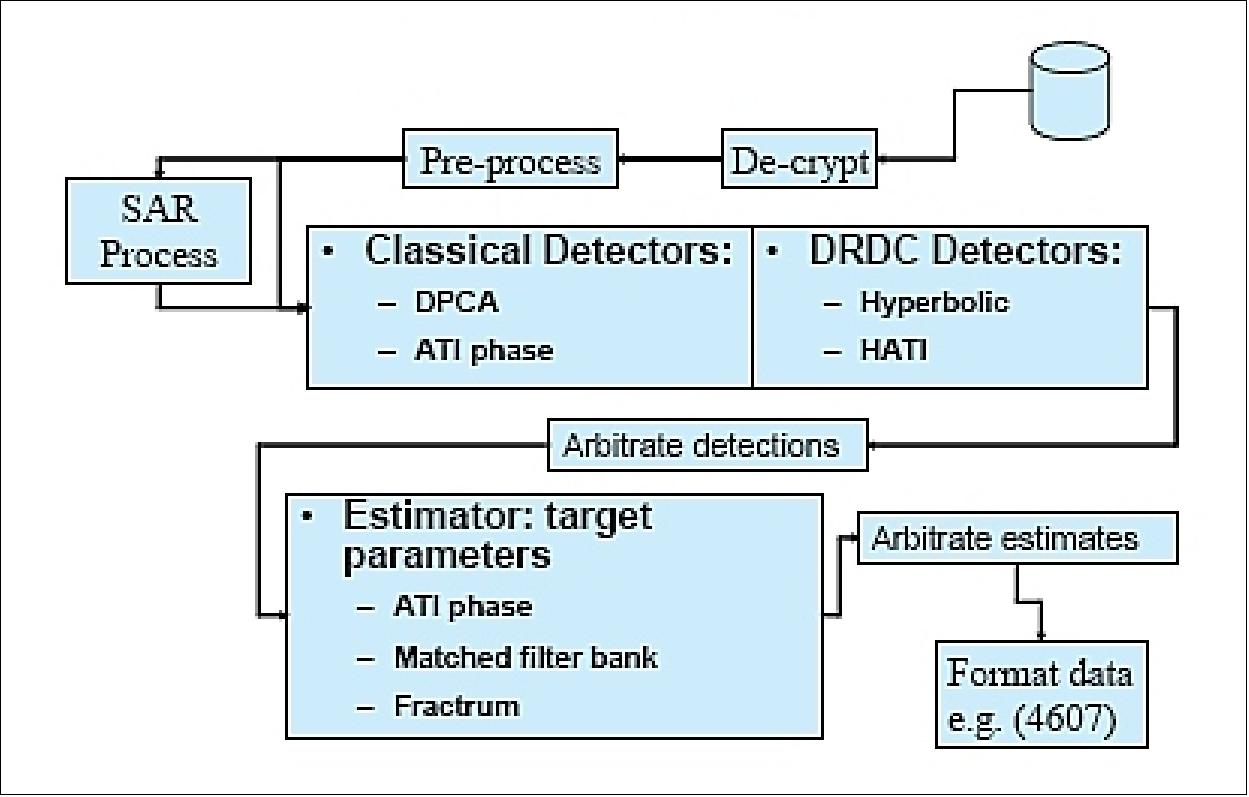
MODEX has been implemented through collaboration between DND, the Canadian Space Agency (CSA), and the satellite builder, MDA Corporation, Ltd. Three GMTI detection algorithms were implemented: 79)
• The first one is the classical DPCA (Displaced Phase Center Antenna), which is based on using two separate signal channels that observe the same scene at different times from the same point in space. The presence of moving targets is detected in the differential data by comparing the magnitude of the signal difference against a computed CFAR (Constant False Alarm Rate) threshold.
• The second detector is a new algorithm called the Hyperbolic detector, which is based on the combination of two independent metrics. The first metric is used to detect targets with a high probability of detection while allowing a rather large number of false alarms. A second metric is then applied to only the targets which exceeded the detection threshold of the first metric to reduce the false alarms while preserving the high probability of detection. The two independent metrics are combined into one two-dimensional metric. The resulting detection threshold from the combined metric is a hyperbolic curve instead of a classic CFAR threshold value.
• The third detection algorithm is called the HATI (Histogram Along-Track Interferometry) detector. This algorithm differs from the other detectors in that it uses an adaptive nonparametric CFAR detection scheme that does not involve the theoretical modeling of clutter statistics. Although the HATI algorithm uses ATI for moving target detection, the adaptive histogram techniques to calculate CFAR thresholds can also be applied to other detectors such as DPCA.
In addition to the dual-receive mode of operation, RADARSAT-2 also supports an alternating-transmit mode where pulses are transmitted alternately from each wing, and received alternately on each wing. This toggle mode allows greater separation of the two-way phase centers in the along-track direction. The transmitter toggling approach (between fore and aft sub-apertures) has the advantage of maintaining the same phase-center distance as the dual-channel case, which is 3.75 m for RADARSAT-2, and is capable of generating three phase centers.
Six sets of MODEX data were collected during RADARSAT-2 commissioning trials: three in the MODEX-1 mode and three in the MODEX-2 mode (or the toggle mode). Preliminary MODEX results showed that the sensor is capable of detecting and measuring both cross-track and along-track velocity components as low as 5 m/s. The accuracy of the measurements is about ±0.3 m/s in the cross-track direction and ±4.0 m/s in the along-track direction (Ref. 79).
Note: MODEX-1 represents the MODEX processor implementation at launch which includes a preprocessor to prepare the data for GMTI processing as well as two-antenna techniques to detect and estimate moving target parameters. MODEX-2 is a processor upgrade which includes toggle mode data processing and waveform diversity processing as well as three-antenna detectors and estimation methods.
The MODEX experiment is being funded by DND (Department of National Defense) of Canada for technology demonstration purposes. DND aims to develop a SAR-GMTI processing system to investigate the military and commercial utility of space-based moving target measurements. MODEX is being carried out by DRDC (Defense Research and Development Canada).
RADARSAT-2 data: RSI (RADARSAT International), a subsidiary of MDA, will market and distribute RADARSAT-2 data on a commercial basis. 80)
In addition, Canada is going to use the RADARSAT-2 data in the following programs:
• SOAR (Science and Operational Applications Research for RADARSAT-2), a joint partnership program between the Canadian government and MDA through CSA and CCRS (Canada Center of Remote Sensing) of NRC (Natural Resource Canada).
- The SOAR program provides access to RADARSAT-2 data only for research and testing purposes.
- The SOAR program provides an opportunity to explore the enhanced capabilities of RADARSAT-2 and their potential contributions to applications through a loan of limited amounts of RADARSAT-2 data to research projects.
Now that the satellite is fully operational, the Government of Canada will develop specific R&D initiatives under the SOAR program umbrella.
• Project Polar Epsilon: A surveillance and ship detection initiative within Canada's Defence Program. RADARSAT-2 wide-area data will be used to enable all-weather, day/night persistent surveillance of Canada's Arctic region and ocean approaches (Canada has the longest coastline in the world at 243,772 km and a corresponding marine area of responsibility of over 11 million km2). The goal in marine security is domain awareness: to know what is happening and where it is happening in the marine domain or ocean approaches to the borders.
Project Polar Epsilon invests in applications and ground segment infrastructure to receive and process RADARSAT 2 information. Polar Epsilon will deliver four main capabilities: near real-time ship detection; arctic land surveillance; environmental sensing; and maritime surveillance radar beam optimization. The near real-time ship detection capability will include local RADARSAT-2 satellite reception, processing and applications in support of the emerging Marine Security Operations Centers (MSOCs) on both of Canada's east and west coasts at or near Halifax and Esquimalt. 81) 82) 83) 84)
The RADARSAT-2 imagery analysis by the MSOCs will be complemented with optical imagery of the MODIS (Moderate-Resolution Imaging Spectroradiometer) instrument on various US missions. The provision of ocean color information from the MODIS sensors will assist the MSOCs with operational use of maritime patrol aircraft, ships, submarines and sonar performance prediction.
The RADARSAT-2 surveillance must be seen as complementary to future AIS (Automated Identification System) services onboard ships, mandated by the IMO (International Maritime Organization). AIS is a mixed ship and shore-based broadcast transponder system, operating in the VHF maritime band, which sends ship identification, position, heading, ship length, beam, type, draught and hazardous cargo information, to other ships as well as to shore. Of significance is that AIS can be monitored from satellites.
An AIS device will not be part of RADARSAT-2. RADARSAT-2 will only perform the ship detection function with its SAR imagery. However, Canada is planning to fuse commercial space-based AIS with coincidental RADARSAT-2 passes - this will help to confirm non-compliant AIS reports or no reports.
The follow-up system of RADARSAT-2, a three-spacecraft mission referred to as RCM (RADARSAT Constellation Mission), with launches in the timeframe 2012-14, is planning to combine SAR and AIS on the same spacecraft platform.
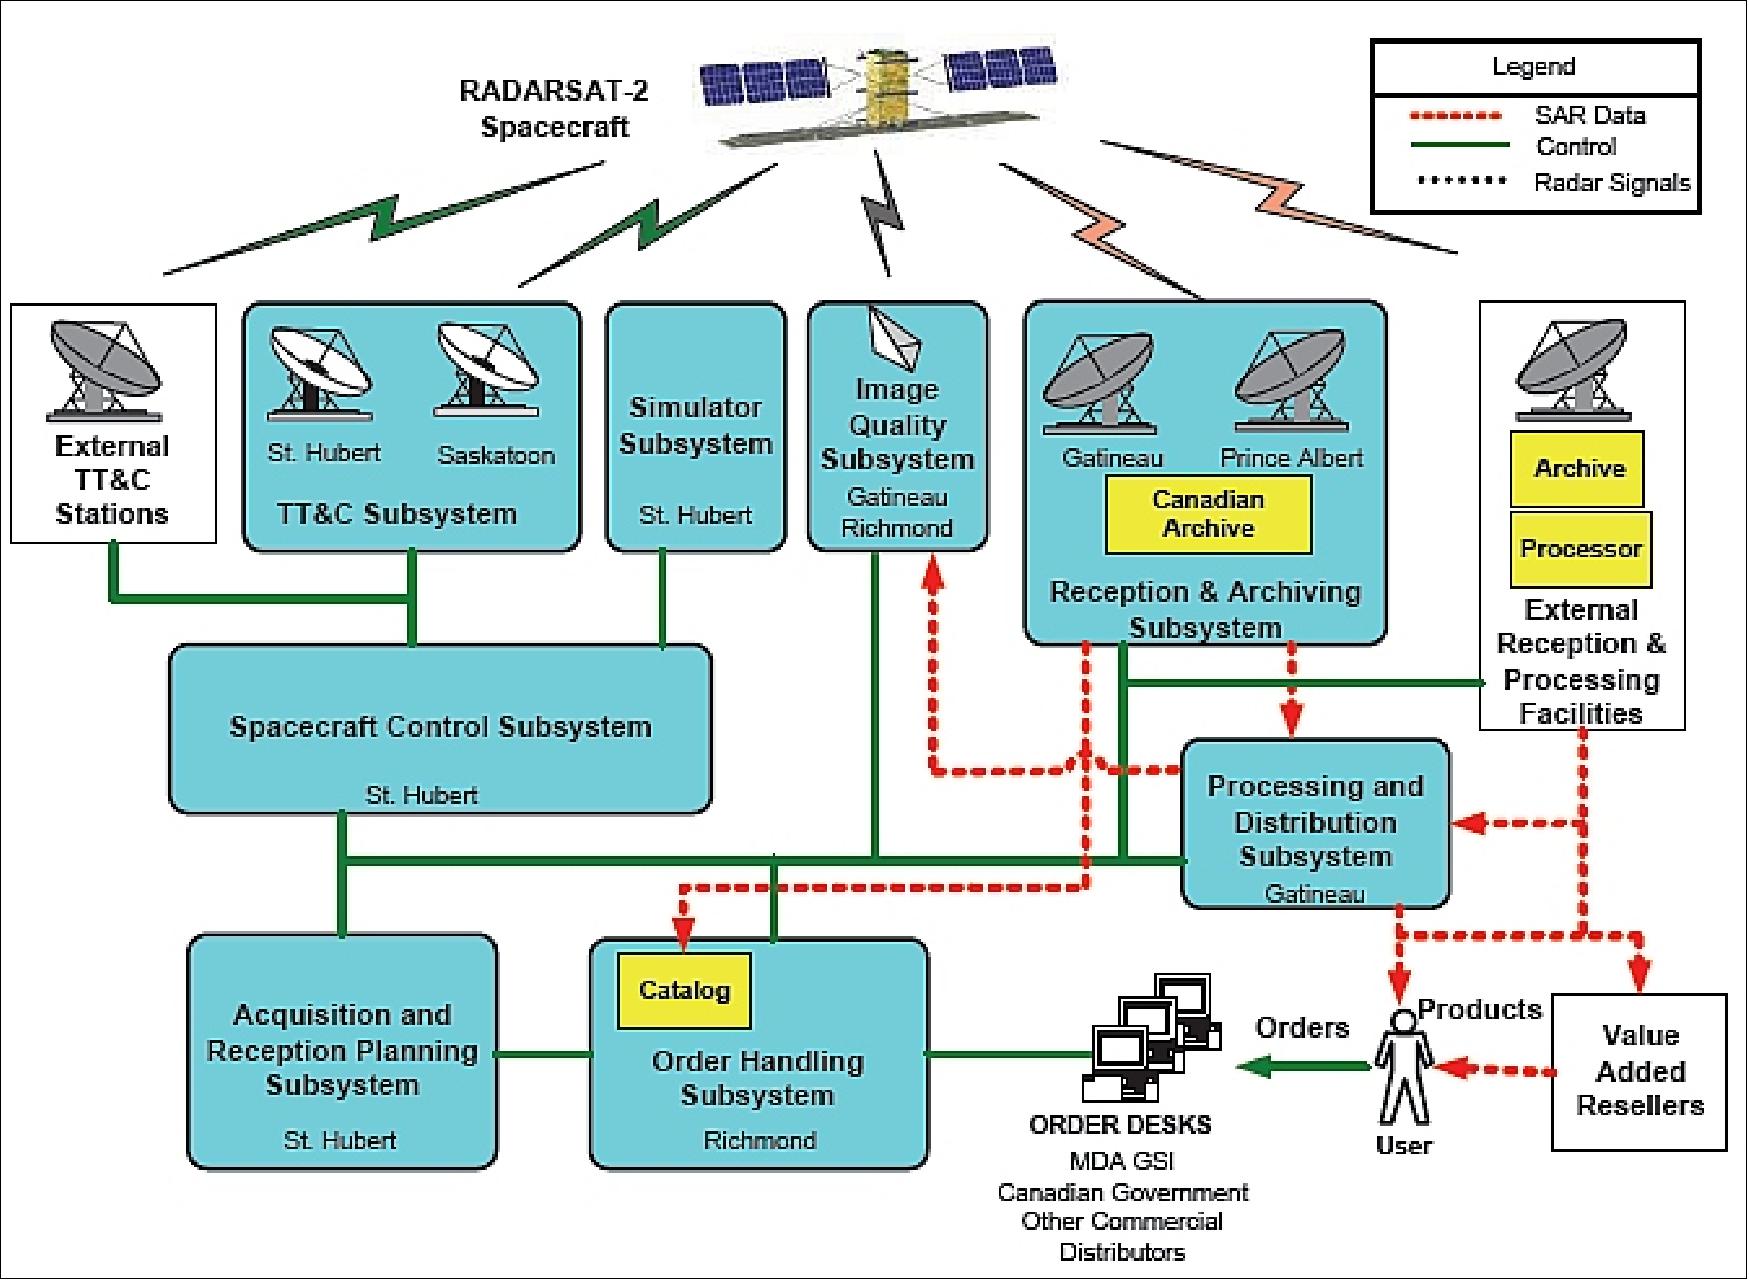
Ground Segment
The ground segment architecture is broken down into several subsystems as shown in Figure 22 (modular distributed system). Where possible, the existing RADARSAT-1 ground segment facilities and infrastructure are being reused. However, almost all software and computer hardware has been replaced by new systems. The use of up to date technology allows lower maintenance and operational cost while providing improved functionality. 85) 86) 87)
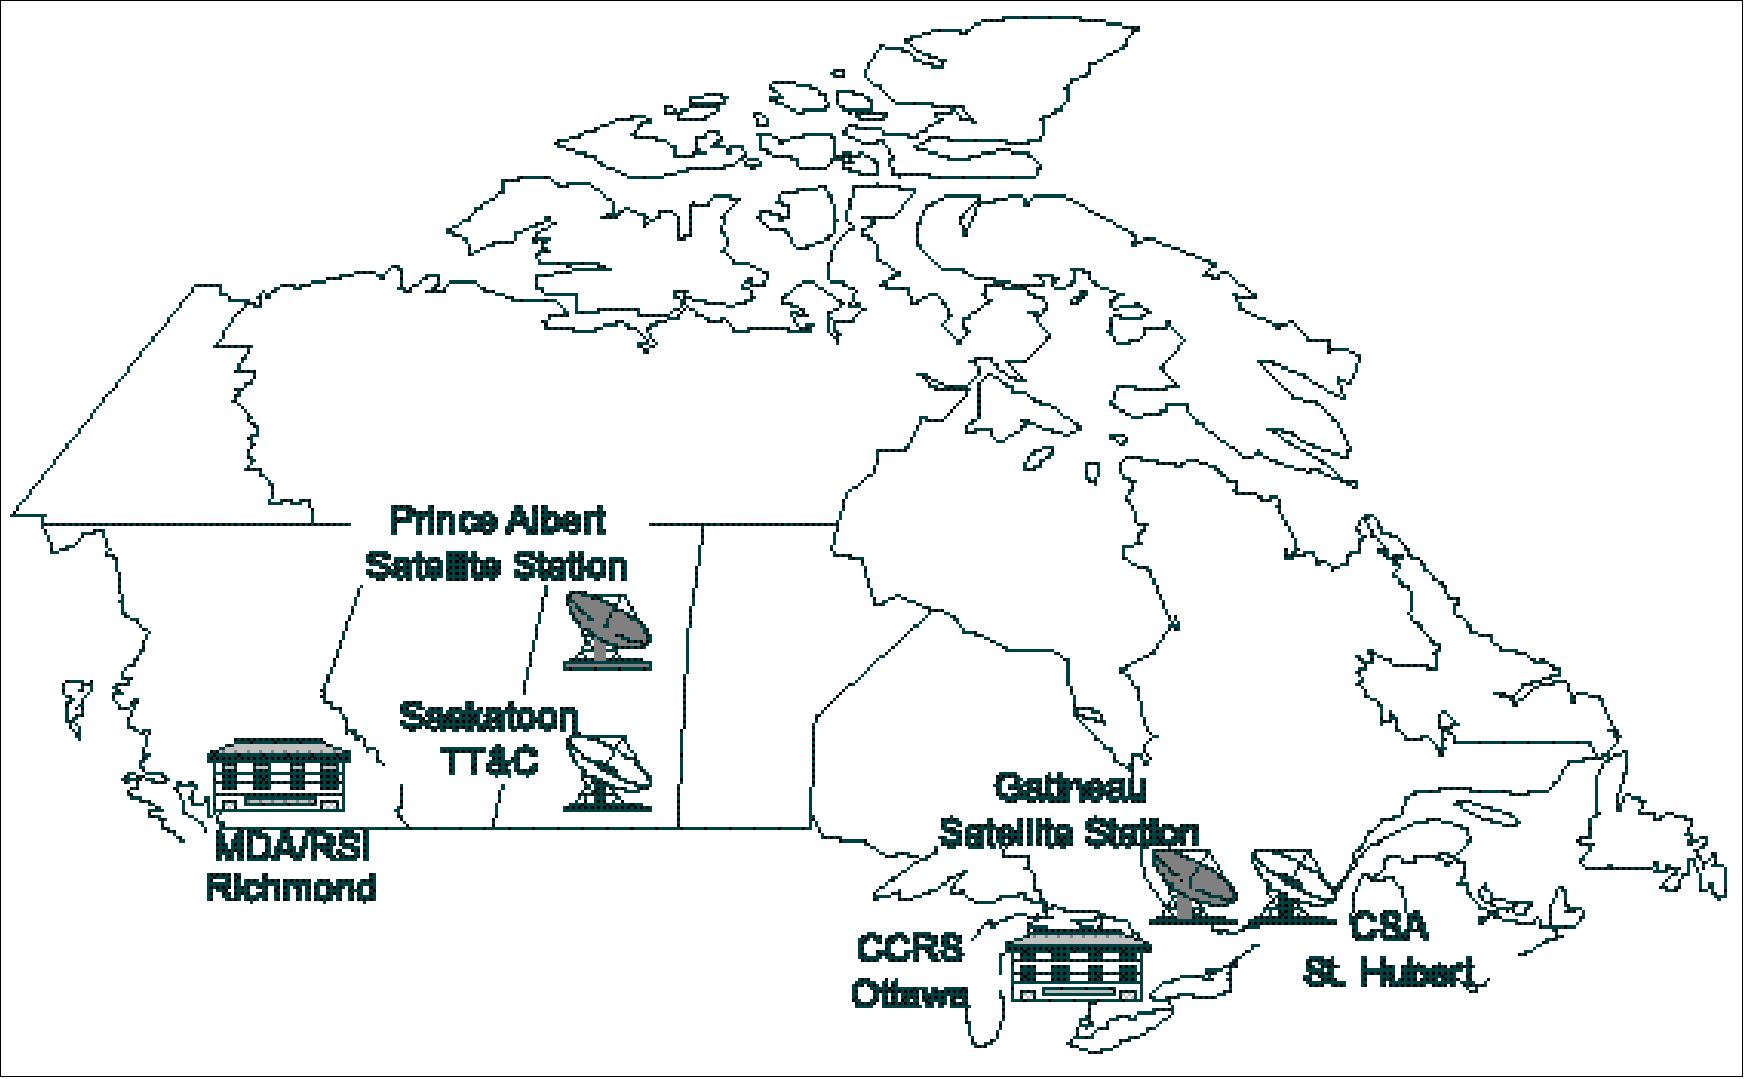
The RADARSAT-2 ground segment was upgraded from the RADARSAT-1 infrastructure and includes a Mission Control Facility at the CSA Headquarters at St. Hubert (near Montréal), Québec, and TT&C stations at St. Hubert and at Saskatoon, Saskatchewan. The CSA order desk will coordinate all government user requests for RADARSAT-2 data. MDA is responsible for the sale and distribution of RADARSAT-2 data to all commercial users. In May 2006, an MDA MOC (Mission Operations Center) was installed in St. Hubert.
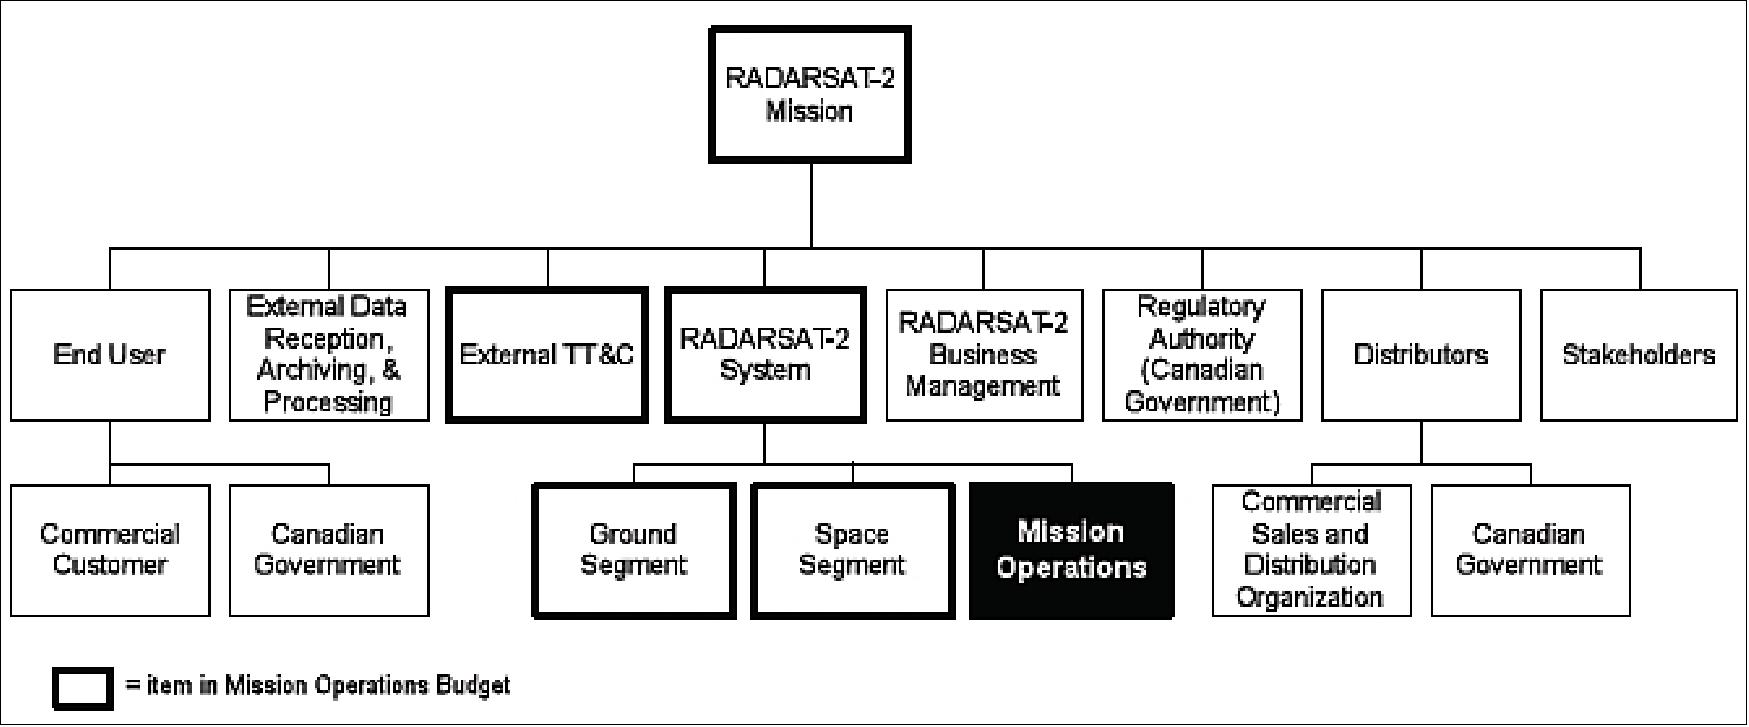
The RADARSAT-2 mission components are shown in Figure 24. In addition to internal and external system components and mission operations, the mission involves the data users, MDA business management, and the regulatory authority. The Canadian Government is a major mission stakeholder and receives data in return for its investment in the system development. RADARSAT-2 mission management concerns management of and/or interfacing with these components to ensure orderly conduct of the mission to meet mission objectives (Ref. 57).
RADARSAT-2 operations are characterized by intensive, highly automated, intermittent TT&C pass operations, supported by complex planning cycles to convert client orders into imaging and data downlink plans and to prepare on-board command schedules and upload command sequences. A multi-mission approach for operations provides cost and risk savings for participating missions.
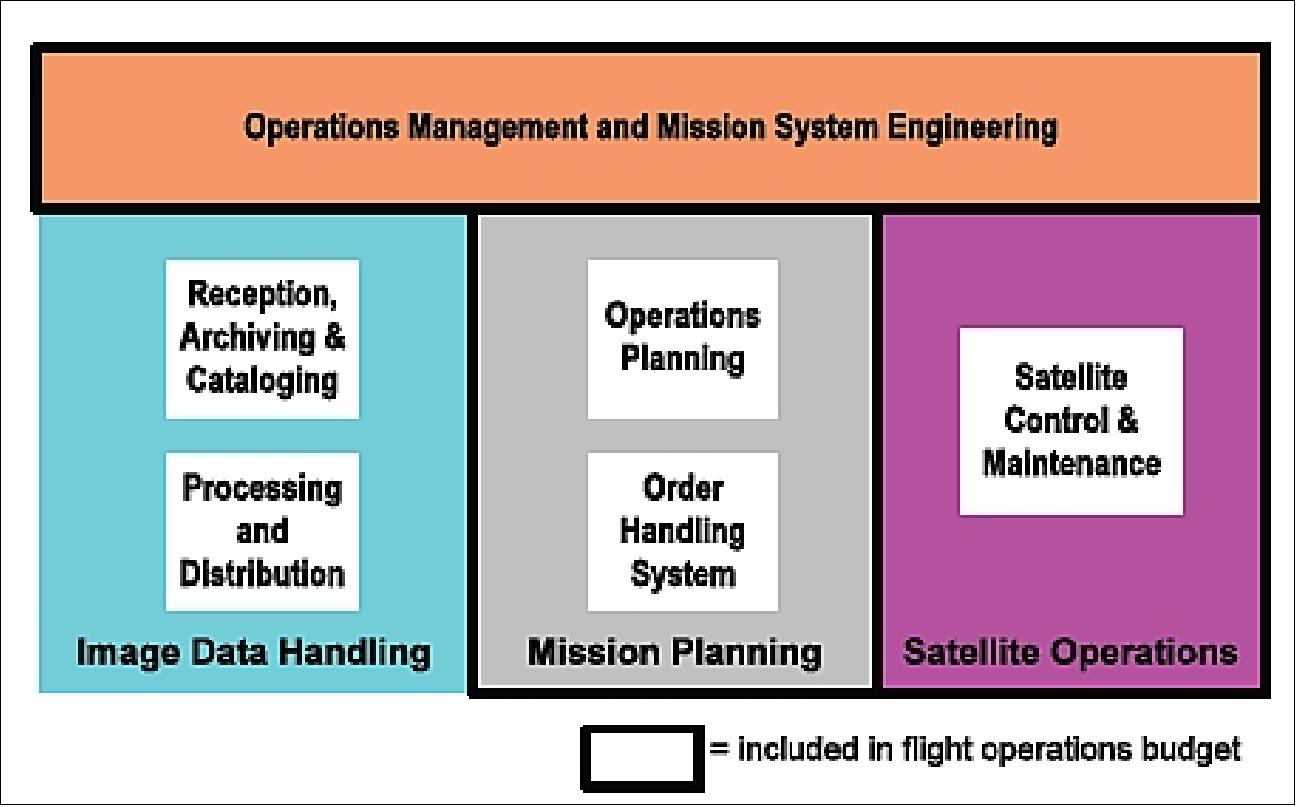
RADARSAT-2 routine phase mission operations are functionally arranged as shown in Figure 25. These provide for the day-to-day end-to-end system operations and maintenance of the satellite and ground segment, including overall system and operations management, planning of satellite and ground reception activities in response to client orders, satellite command and control, and Canadian SAR data reception, archiving, cataloguing, processing and distribution. Operations development established plans for these functional areas.
For a commercial mission, operations costs are an important metric. Early during development a cost model was established. This was updated throughout development so that cost metrics could be reviewed at design milestones and for comparison of operations approaches. MDA senior management took, and continue to take, a particular interest in reviewing the status and planning for mission operations costs in view of their impact on RADARSAT-2 business success. This led to frequent corporate reviews during development and to the setting of cost budget targets and goals which drove planning and implementation decisions (Ref. 57).
Regulatory environment: During RADARSAT-2 development a new regulatory environment was introduced in Canada governing commercial satellite remote sensing operations – the "Remote Sensing Space Systems Act". This has had the effect that key mission and system requirements and plans, such as operational orbit parameters and control, performance of products generated from the SAR Payload, and the need to maintain and execute an end-of-life decommissioning plan, have become legal as well as mission responsibilities. An additional system activity reporting burden has also been imposed at mission level.
A system impact of this new regime concerned the changes needed to order handling to automate the otherwise operator intensive and potentially error-prone new "access control" rules for imagery imposed on clients by the regulations. A further mission management impact concerns the need for formal permission to enhance system capability in areas which improve licensed performance (Ref. 57).
In the spring of 2010, RADARSAT-2 is starting in its third year in orbit and in its third year routine phase operations. Despite the system complexity, commissioning was completed relatively smoothly. System and operations performance in the routine phase has met and surpassed system requirements. A maintenance policy was adopted early in development and its implementation has proved to be successful. The mission operations processes and system were adapted in response to a new regulatory environment introduced shortly before launch. A mission operations risk management process has been adopted and includes orbital collision avoidance measures. A number of operations and system enhancements have been implemented in parallel with continuing operations. The system and operations will continue to evolve to meet business needs (Ref. 57).
Polar Project Epsilon (First Attempts)
Leveraging the programmability of the RADARSAT-2 sensor, MDA developed and assessed two new ScanSAR beam modes: a 450 km wide ship detection optimized beam mode in the HH polarization channel, and a 530 km wide multi-purpose beam mode in the HH and HV polarization channels. These new beam modes are significantly better, offering nearly uniform ship detection of much smaller vessels across the full swath width, when compared to the existing RADARSAT-2 ScanSAR beam modes. 88)
Approach: To aid in the development of improved SAR images, MDA first constructed a tool which takes as input the relevant characteristics of a proposed SAR beam mode and outputs a statistically probable Minimum Detectable Ship Length (MDSL) metric at a 90% confidence level. This tool makes use of an empirical relationship between ship length and RCS (Radar Cross Section).
The tool makes the simplifying assumption that the entire RCS of the vessel is contained within a single resolution cell. This is valid since our objective is to assess the detectability of small ships which do satisfy this assumption. The tool is likely to underestimate the length of larger ships in the case where the RCS is spread over several resolution cells. Due to the complexity associated with ship orientation and length-to-width ratio, no attempt has been made to model larger ships to a higher fidelity, and therefore caution must be used when interpreting the absolute value of the MDSL metric reported.
The tool simulates, in a statistical sense, vessel detection being performed by a Constant False Alarm Rate (CFAR) filter using a K distribution. Here, the simulation is set to allow a maximum of 2 false alarms per 3600 km along-track. While a plethora of notable ship detection algorithms are currently available, this simplified tool allows to make useful relative comparisons between the existing RADARSAT-2 beam modes and these new beam modes to guide the beam mode design.
Recognizing that maritime domain awareness applications are not solely about vessel detection, the project developed two classes of beam modes: those which are optimized for vessel detection performance at the expense of other maritime applications, and multi-purpose beam modes which provide improved vessel detection performance, relative to the traditional beam modes, while continuing to support other maritime applications.
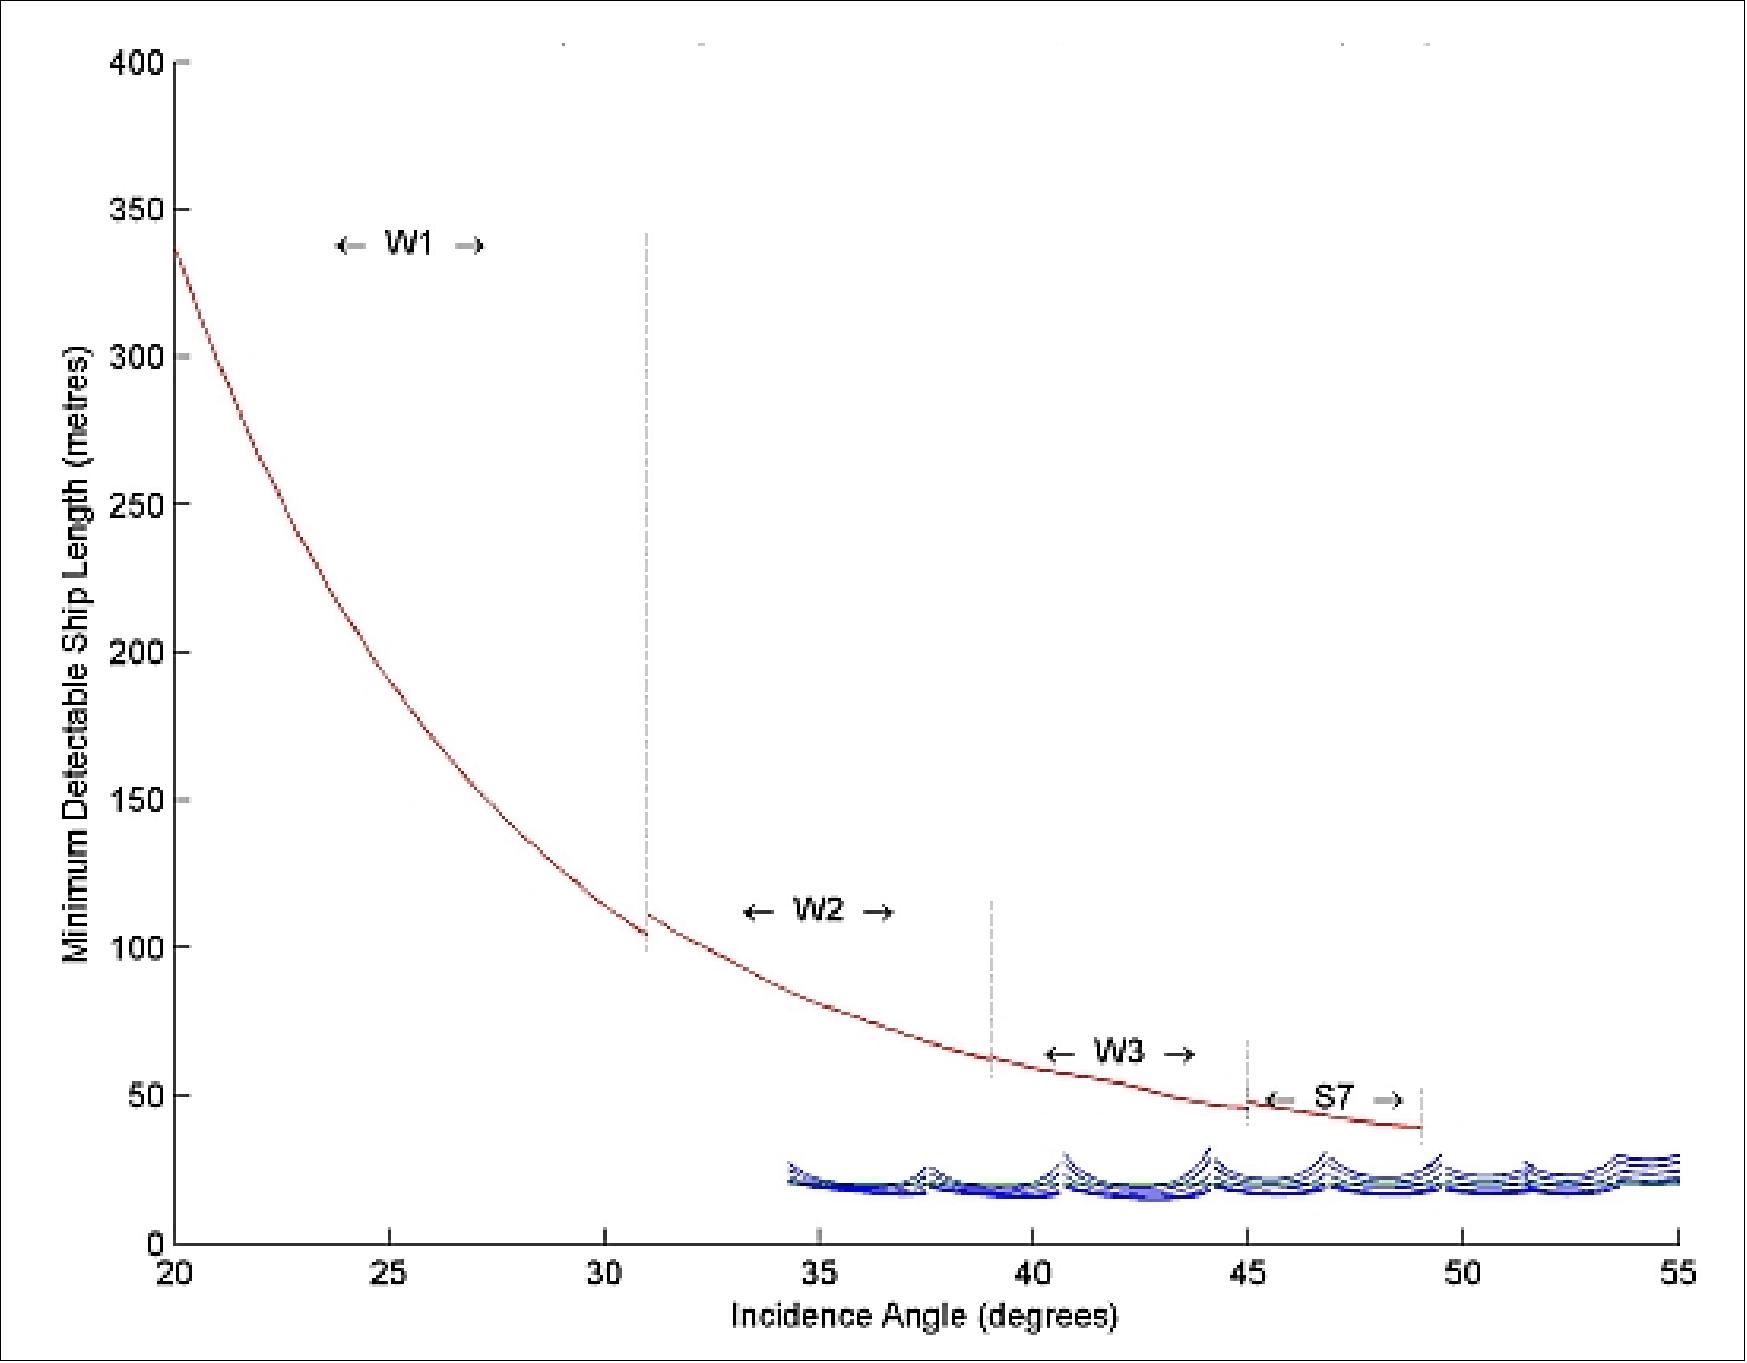
• The vessel detection optimized beam mode is 450 km wide, comprised of seven sub-beams (in the HH polarization channel only) spanning incidence angles ranging from 34º to 57º, and which makes use of the "dual-receive aperture" capability of the RADARSAT-2 sensor. The high data rate associated with the 50 MHz pulse, the high PRFs (Pulse Repetition Frequencies) and the dual-receive necessitated compressing the data using 1-bit block adaptive quantization (BAQ) encoding ito achieve real-time imaging and downlinking.
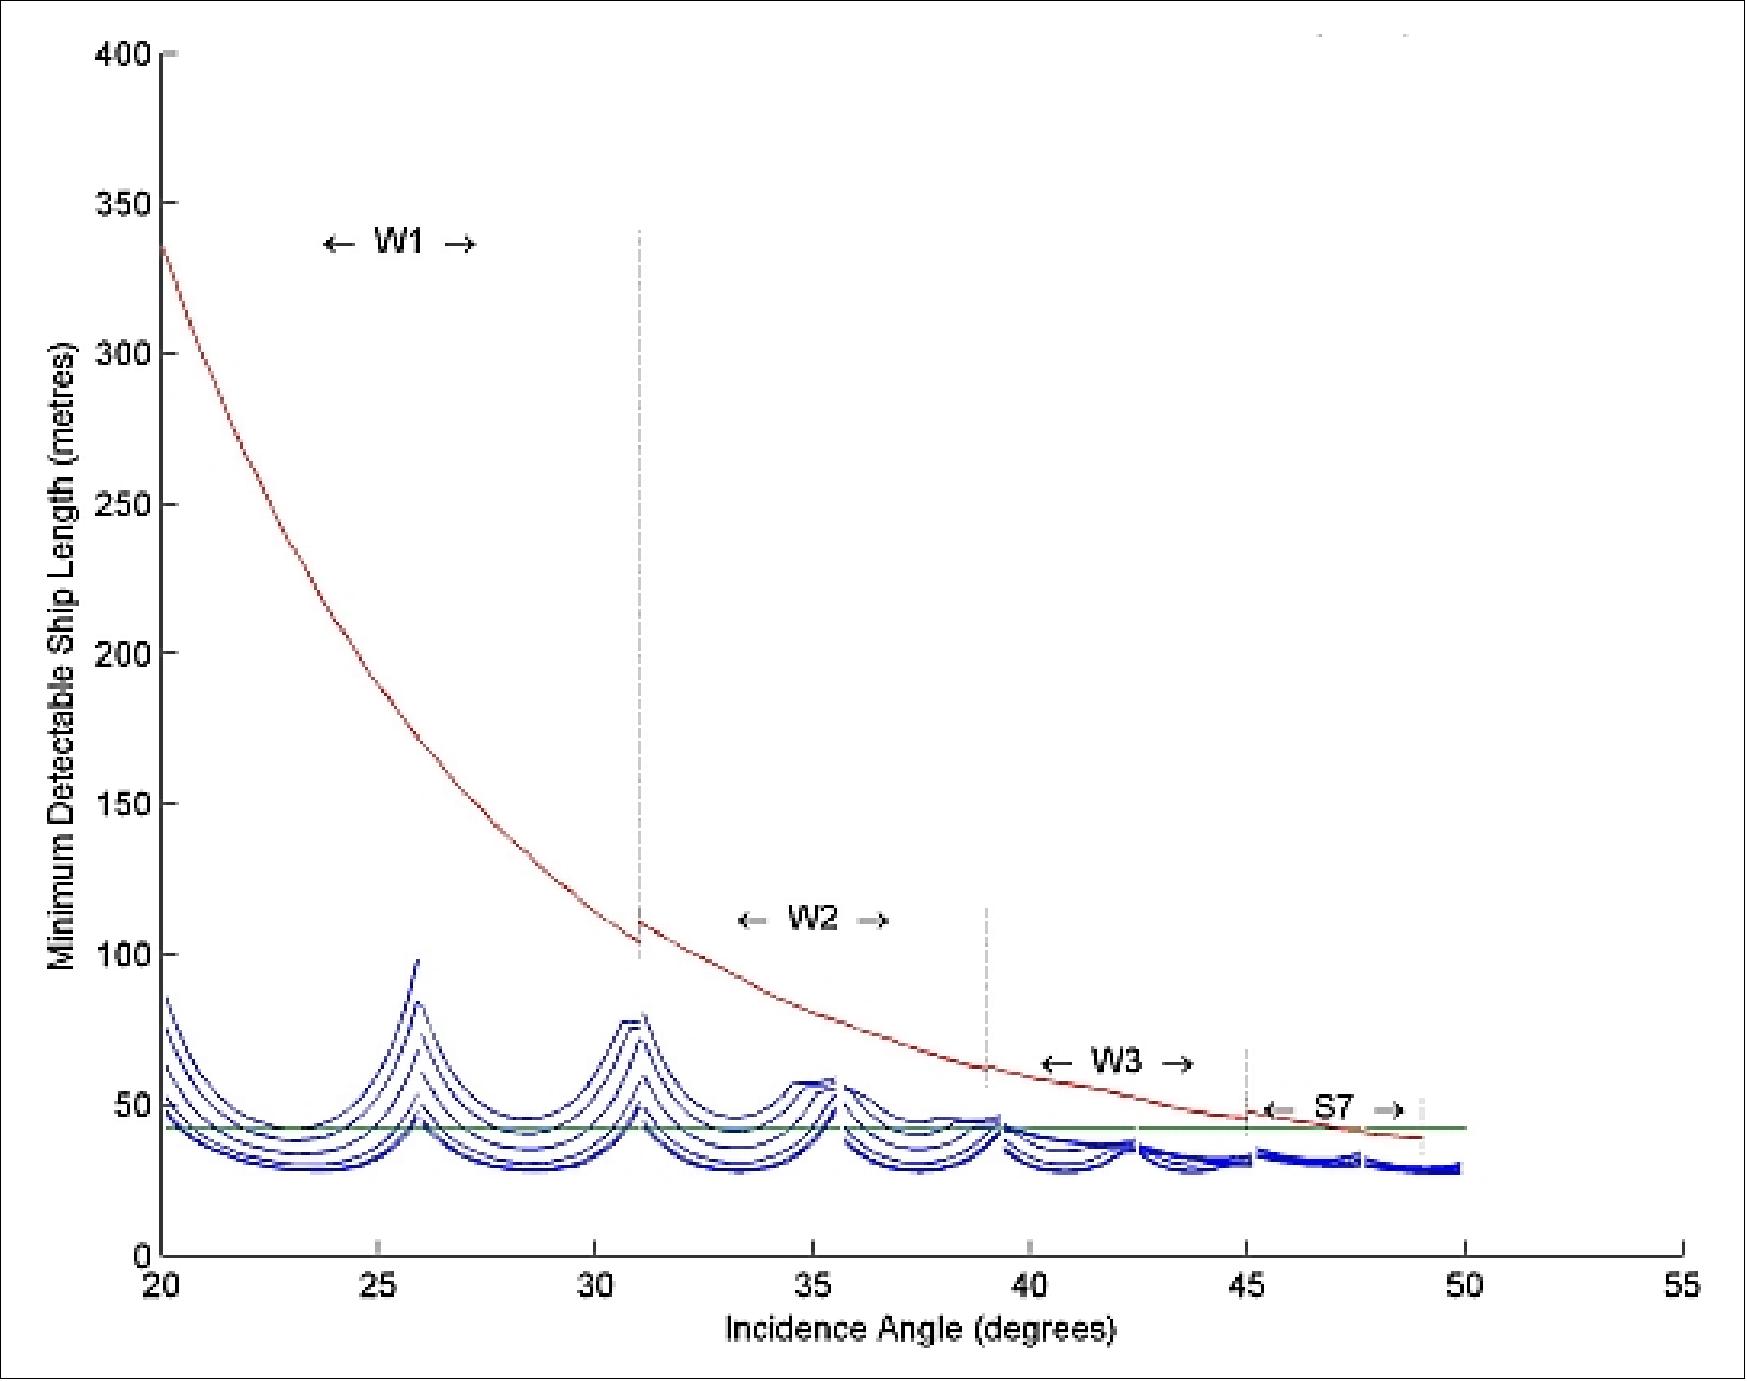
• The multi-purpose beam mode is 530km wide, comprised of eight sub-beams (in the HH and HV polarization channels) spanning incidence angles ranging from 20º to 50º. The high PRFs and the applications-driven need for low noise and dual-polarization with a minimum of 2-bit BAQ encoding made it necessary to use the 17 MHz pulse in order to achieve real-time imaging and downlinking.
Figures 26 and 27 illustrate the 90% confidence level MDSL metric versus incidence angle for the case of wind at 8 m/s at an angle of 45º relative to the beam. These plots compare the ScanSAR Wide beam mode (red lines) with the new ship detection optimized and multi-purpose beam modes (blue lines). Since both of these new beam modes have only one look in the azimuth direction, there will be a two-dimensional variation in the SAR sensor noise, leading to a corresponding variation in the MDSL metric (each of the blue lines represents a different position in azimuth within a burst) that has been described as an "egg carton."
Beam mode | Minimum Beam Mode Detectable Ship Length (MDSL) metric | |
8 m/s wind speed | 14 m/s wind speed | |
New 450 km wide vessel detection | 15-20 m | 28-48 m |
New 530 km wide multi-purpose | 38-45 m | 74-105 m |
ScanSAR narrow (HH polarization) | 25-95 m | 51-190 m |
ScanSAR wide (HH polarization) | 29-358 m | 61-639 m |
The two newly designed ship-detection application-specific ScanSAR beam modes have demonstrated that both beam modes offer marked improvement over the existing ScanSAR beam modes in terms of ship detection performance. While more detailed analysis remains to be carried out, the multi-purpose beam mode has been shown to be capable of supporting other ocean surveillance applications such as ice analysis, oil and pollution monitoring, ocean wave analysis, and wind retrievals.
References
1) D. De Lisle, L. Brûlé, M. Reza Sahebi, B. Hawkins, K. Murnaghan, W. Branson, G. Staples, "Pre-Launch Activities in Preparation for RADARSAT-2," Proceedings of EUSAR 2006, Dresden, Germany, May 16-18, 2006
2) L. Brûlé, D. De Lisle, H. Baeggli, J. Graham, "RADARSAT-2 Program Update," Proceedings of IGARSS 2005, Seoul, Korea, July 25-29, 2005
3) A. Hillman, D. Comi, W. Branson, P. Rolland, "Countdown for RADARSAT-2 System Operations," Proceedings of IGARSS 2005, Seoul, Korea, July 25-29, 2005
4) http://www.asc-csa.gc.ca/eng/satellites/radarsat2/default.asp
5) P. Fox, "The RADARSAT-II Mission," Proceedings of IGARSS'99, Hamburg, Vol. III, June28 - July 2, 1999, pp. 1500-1502
6) H. Baeggli, L. Brûlé, J. Smyth, "RADARSAT-2 Program Update," Proceedings of IAC 2004, Vancouver, Canada, Oct. 4-8, 2004, IAC-04-B.2.01
7) L. C. Morena, K. V. James, J. Beck, "An introduction to the RADARSAT-2 mission", Canadian Journal of Remote Sensing, Volume30, No. 3, June 2004, pp. 221-234
8) L. Brûlé, H. Baeggli, "RADARSAT-2 Program Update," Proceedings of IGARSS 2002, Toronto, Canada, June 24-28, 2002
9) A. A. Thompson, D. Racine, A. P. Luscombe, "RADARSAT-2 Antenna Calibration Using Ground Receivers/Transmitters," Proceedings of IGARSS 2002, Toronto, Canada, June 24-28, 2002
10) M. Farhat, F. Lauzon, A. Trudeau R. Fiset, "InSAR End-to-End Simulation Environment," Proceedings of IGARSS 2002, Toronto, Canada, June 24-28, 2002
11) P. Fox, A. P. Luscombe, Z. Ali, "The Radarsat-2 Mission, New Modes and Techniques," Proceedings of IAC (International Astronautical Congress), Houston, Tx, Oct. 10-19, 2002, IAC-02-B.3.07
12) Daniel De Lisle, "Capabilities of RADARSAT-2 and use by the Canadian Government," Proceedings of the 4th International POLinSAR 2009 Workshop, Jan. 26-30, 2009, ESA/ESRIN, Frascati, Italy, URL: http://earth.esa.int/workshops/polinsar2009/participants/122/pres_6_DeLisle_122.pdf
13) Pierre D. Beaulne, Charles E. Livingstone, "Evaluation of RADARSAT-2 Yaw Steering for SMTI Applications," Proceedings of EUSAR 2010, 8th European Conference on Synthetic Aperture Radar, June 7-10, 2010, Aachen, Germany
14) C.E. Livingstone, I. Sikaneta, C. Gierull, S. Chiu, P. Beaulne, "RADARSAT-2 System and Mode Description," Proceedings of RTO-MP-SCI-150, paper 15, Neuilly-sur-Seine, France, 2006, URL: http://www.dtic.mil/dtic/tr/fulltext/u2/a469927.pdf
15) A. Ray, G. Goldman, A. Albanese, "Precise Onboard Orbit Determination for RADARSAT-2," NAVITEC 2001, 1st Workshop on Satellite Navigation User Equipment Technologies, Dec. 10-12, 2001, ESA/ESTEC, Noordwijk, The Netherlands
16) MDA provides global fishing watch access to RADARSAT-2 archive to help combat illegal fishing," PR Newswire, 28 June 2022, URL: https://www.prnewswire.com/news-releases/mda-provides-global-fishing-watch-access-to-radarsat-2-archive-to-help-combat-illegal-fishing-301575954.html
17) "Maxar's MDA and Orbital Insight Announce Expanded SAR Satellite Imagery Agreement," MDA News Release, 17 December 2020, URL: https://mda.space/article/maxars-mda-and-orbital-insight-announce-expanded-sar
18) "Making a Connection in the Kingdom of Tonga," NASA Earth Observatory, Image of the Day for 20 November 2019, URL: https://earthobservatory.nasa.gov/images/145877/making-a-connection-in-the-kingdom-of-tonga
19) "Maxar Technologies' MDA Aids Preservation of Indonesian Rainforest with its RADARSAT-2-Powered Forest Alert Service," PR Newswire, 26 February 2019, URL: https://www.prnewswire.com/news-releases/maxar-technologies-mda-aids-preservation-of-indonesian-rainforest-with-its-radarsat-2-powered-forest-alert-service-300802750.html
20) "Maxar and Orbital Insight Expanded SAR Satellite Imagery Agreement," MDA Press Release, 17 December 2018, URL: http://syntheticapertureradar.com/maxar-and-orbital-insight-expanded-sar-satellite-imagery-agreement/
21) Ron Caves, "Evolution of RADARSAT-2 Usage Over a Decade of Operation," EUSAR 2018 (12th European Conference on Synthetic Aperture Radar), Aachen, Germany, June 4-7, 2018
22) M. Chabot, N. Gibb, C. Lambert, C. Patterson, P. Rolland, "10 years of RADARSAT-2 flight operations," Proceedings of IGARSS (International Geoscience and Remote Sensing Symposium), Valencia, Spain, July 23-27, 2018
23) Evgeniy Lebed, Ron Caves, "Recent and Ongoing Developments in using RADARSAT-2 for Maritime Surveillance in Canada," EUSAR 2018 (12th European Conference on Synthetic Aperture Radar), Aachen, Germany, June 4-7, 2018
24) "December 14, 2017 – 10-year anniversary of RADARSAT-2 — '2017 in review – 20 highlights for space, science and the CSA'," CSA, URL: http://www.asc-csa.gc.ca/eng/blog/2017/12/22/2017-in-review-20-highlights-for-space-science-and-the-csa.asp
25) "RADARSAT-2," CSA, 14, Dec. 2017, URL: http://www.asc-csa.gc.ca/eng/satellites/radarsat2/default.asp
26) Casey Lambert, Camille Decoust, Bryan Cooke, " RADARSAT-2 and RCM Conjunction Analysis and Mitigation Operations," SSA Operators' Workshop, Denver, Colorado, Nov. 3-5, 2016, URL: https://advancedssa.com/assets/img/workshop/presentations/RADAR_SAT_2_RCM_Conjunction_Analysis_2016_rev1.pdf
27) Bryan Cooke, Casey Lambert, "RADARSAT-2 Conjunction Tales," SSA Operators' Workshop, Denver, Colorado, Nov. 3-5, 2016, URL: https://advancedssa.com/assets/img/workshop/presentations/SSA_Workshop_Nov2016_BCooke.pdf
28) "MDA Sees Better At Sea... Improves Ocean Applications Imaging Modes For RADARSAT-2," SatNews Daily, Oct. 1, 2015, URL: https://www.satnews.com/story.php?number=706086251
29) M. Chabot, C. Decoust, C. Lambert, P. Rolland, P. Ledantec, D. Williams, "RADARSAT-2 system operations and performance," Proceedings of the IGARSS (International Geoscience and Remote Sensing Symposium) 2015, Milan, Italy, July 26-31, 2015
30) Dean G. Flett, Eric J. Arsenault, Ron W. Pietsch, Daniel Bujold, Stephen Schaller, Satish K. Srivastava, "Enhanced Management of Orders and Conflicts (EMOC) process:coordinating RADARSAT-2 data orders for Canadian government users," Proceedings of the IGARSS (International Geoscience and Remote Sensing Symposium) 2015, Milan, Italy, July 26-31, 2015
31) Information provided by Wendy Keyzer of MDA, Richmond, BC, Canada.
32) M. Chabot, C. Decoust, P. Ledantec, D. Williams, A. Hillman, P. Rolland, R. Périard, "RADARSAT-2 System Operations and Performance," Proceedings of IGARSS (IEEE Geoscience and Remote Sensing Society) 2014, Québec, Canada, July 13-18, 2014
33) Dan Williams, Pierre LeDantec, Marielle Chabot, Anthony Hillman, Kenny James, Ron Caves, Alan Thompson, Cathy Vigneron, Yan Wu, "RADARSAT-2 Image Quality and Calibration Update," Proceedings of EUSAR 2014 (10th European Conference on Synthetic Aperture Radar), Berlin, Germany, June 3-5, 2014
34) "Petermann on the move," ESA, March 17, 2014, URL: http://www.esa.int/spaceinimages/Images/2014/03/Petermann_on_the_move
35) "MDA Joins ESA Third Party Mission Program," GEO Informatics, Dec. 13, 2013, URL: http://www.geoinformatics.com/blog/latest-news/mda-joins-esa-third-party-mission-program
36) "MDA increases provision of RADARSAT-2 information and services in Europe," Oct. 21, 2013, URL: http://www.newswire.ca/en/story/1246103/mda-increases-provision-of-radarsat-2-information-and-services-in-europe
37) "International effort helps users get ready for Sentinel-1," ESA, May 6, 2013, URL: http://www.esa.int/Our_Activities/Observing_the_Earth/Copernicus/International_effort_helps_users_get_ready_for_Sentinel-1
38) G. Davidson, V. Mantle, B. Rabus, D. Williams, D. Geudtner, "Implementation of TOPS mode on RADARSAT-2 in Support of the Sentinel-1 mission," CEOS-WGCV-SAR Subgroup, October, 16, 2013, URL: http://sarcv.ceos.org/site_media/media/documents/16h00_CSA_ASAR_RTOPS_submit.pdf
39) Information provided by Alfred Ng of CSA, Canada.
40) "Traffic monitoring with RADARSAT-2," URL: http://www.fhr.fraunhofer.de/en/businessunits/Air-and-space-based-radar-systems/Traffic-monitoring-with-RADARSAT-2.html
41) Delphine Cerutti-Maori, Ishuwa Sikaneta, Christoph Gierull, "Optimum SAR/GMTI Processing and Its Application to the Radar Satellite RADARSAT-2 for Traffic Monitoring," IEEE Tansactions on Geoscience and Remote Sensing, Vol. 50, Issue 10, Oct. 2010, pp. 3868-3881
42) "MDA to increase its provision of RADARSAT-2 imagery in support of Europe's Global Monitoring for Environment and Security program," MDA, July 20, 2012, URL: http://www.mdacorporation.com/corporate/news/pr/pr2012072001.cfm
43) Phillipe Rolland, Marielle Chabot, René Périard, Pierre Ledantec, Camille Decoust, "RADARSAT-2 Mission Operations Status," Proceedings of IGARSS (International Geoscience and Remote Sensing Symposium), Munich, Germany, July 22-27, 2012
44) "RADARSAT-2 data contributes to a new understanding of Antarctic terrain," CSA, August 18, 2011, URL: http://www.asc-csa.gc.ca/eng/media/news_releases/2011/0818.asp
45) "New NASA satellite map shows complete Antarctic ice flow," URL: http://blog.al.com/space-news/2011/08/new_nasa_satellite_map_shows_c.html
46) Bernd Scheuchl; Jeremie Mouginot; Eric Rignot, "Antarctic Ice Velocity Mapped from Space: A Game Changing New Product," September 2011, URL: http://www.waisworkshop.org/presentations/2011/Session4/Scheuchl.pdf
47) "NASA Research Yields Full Map of Antarctic Ice Flow," NASA/JPL, August 18, 2011, URL: http://www.jpl.nasa.gov/news/news.cfm?release=2011-256
48) E. Rig not, J. Mouginot, B. Scheuchl, "Ice Flow of the Antarctic Ice Sheet," Science, Sept. 9, 2011, Vol. 333, No 6048, pp. 1427-1430, DOI: 10.1126/science.1208336
49) "MDA to provide radar information in support of maritime safety to the U.S. National Geospatial-Intelligence Agency," MDA, Sept. 23, 2011, URL: http://www.mdacorporation.com/corporate/news/pr/pr2011092304.cfm
50) A. Hillman, P. Rolland, M. Chabot, R. Périard, P. Ledantec, N. Martens, "RADARSAT-2 Mission Operations Status," Proceedings of IGARSS (International Geoscience and Remote Sensing Symposium), Vancouver, Canada, July 24-29, 2011
51) Daniel De Lisle, "RADARSAT-2 Government of Canada Data Utilization," Proceedings of IGARSS (International Geoscience and Remote Sensing Symposium), Vancouver, Canada, July 24-29, 2011
52) Anthony Luscombe, Pierre leDantec, "RADARSAT-2 Image Quality and Calibration Update –Use of Database Information," Proceedings of the CEOS SAR Cal/Val Workshop, Zürich, Switzerland, Aug. 25-27, 2010
53) A. Hillman, P. Rolland, R. Périard, T. Luscombe, M. Chabot, C. Chen, N. Martens, "RADARSAT-2 Continuing System Operations and Performance," Proceedings of IGARSS (IEEE International Geoscience and Remote Sensing Symposium) 2010, Honolulu, HI, USA, July 25-30, 2010
54) Tonje Nanette Arnesen Hannevik, "RADARSAT-2 new modes,"FFI (Norwegian Defence Research Establishment), July 10, 2012, URL: http://www.ffi.no/no/Rapporter/12-01094.pdf
55) Bob Slade, "RADARSAT-2 Product Description," MDA, RN-SP-52-1238, Issue ⅛: April 15, 2011 [web source no longer available]
56) Marco van der Kooij, "Examples of InSAR and other land applications RADARSAT-2," Remote Sensing – The Synergy of High Technologies, Moscow, Russia, April 25-27, 2012, URL: http://www.sovzondconference.ru/upload/medialibrary/cb1/cb18010512d05be407b24c02757ef2ed.pdf
57) Anthony Hillman, "RADARSAT-2 Mission Management – experience from commercial remote sensing flight operations," Proceedings of the SpaceOps 2010 Conference, Huntsville, ALA, USA, April 25-30, 2010, paper: AIAA 2010-1950
58) Jeff Hurley, "Operational Review: RADARSAT-1 & -2," SEASAR Workshop 2010, January 25-29, 2010, Frascati, Italy, URL: http://earth.eo.esa.int/workshops/seasar2010/8_Hurley.pdf
59) A. Hillman, P. Rolland, R. Périard, A. Luscombe, M. Chabot, C. Chen, N. Martens, "RADARSAT-2 continuing system operations and performance," Proceedings of IGARSS (IEEE International Geoscience and Remote Sensing Symposium) 2010, Honolulu, HI, USA, July 25-30, 2010
60) "RADARSAT-2 images used to monitor Haitian disaster to assess and support rescue," Jan. 29, 2010
61) Ahmed Mahmood, "RADARSAT-1, RADARSAT-2 and RCM," GSCB ()Ground Segment Coordination Body) Workshop, June 18-19, 2009, ESA/ESRIN Frascati, Italy, URL: http://earth.esa.int/gscb/papers/3.3_Mahmood.pdf
62) A. Hillman, P. Rolland, R. Périard, A. Luscombe, M. Chabot, C. Chen, N. Martens, "RADARSAT-2 Initial System Operations and Performance," Proceedings of IGARSS (IEEE International Geoscience and Remote Sensing Symposium) 2009, Cape Town, South Africa, July 12-17, 2009
63) Anthony Luscombe, "Image Quality and Calibration of RADARSAT-2," Proceedings of IGARSS (IEEE International Geoscience and Remote Sensing Symposium) 2009, Cape Town, South Africa, July 12-17, 2009
64) Information provided by Daniel De Lisle of CSA, St. Hubert, Quebec, Canada
65) D. De Lisle, "RADARSAT-2 Program Update," Proceedings of EUSAR 2008, 7th European Conference on Synthetic Aperture Radar, June 2-5, 2008, Friedrichshafen, Germany
66) A. A. Thompson, A. Luscombe, K. James, P. Fox, "RADARSAT-2 Mission Status: Capabilities Demonstrated and Image Quality Achieved," Proceedings of EUSAR 2008, 7th European Conference on Synthetic Aperture Radar, June 2-5, 2008, Friedrichshafen, Germany
67) A. Luscombe, P. LeDantec, K. James, A. Thompson, P. Fox, "RADARSAT-2 SAR Imaging Performance and Calibration," Proceedings of EUSAR 2008, 7th European Conference on Synthetic Aperture Radar, June 2-5, 2008, Friedrichshafen, Germany
68) Luc Brûlé, Jill Smyth, Daniel DeLisle, Michael Manore, Mario Lagrange, Jean-Marc Chouinard, "RADARSAT-2: Capabilities and Benefits for the Canadian Government," Proceedings of the 59th IAC (International Astronautical Congress), Glasgow, Scotland, UK, Sept. 29 to Oct. 3, 2008, IAC-08.B1.5.11
69) G. C. Staples, J. Hornsby, "Turning the Scientifically Possible into the Operationally Practical: RADARSAT-2 Polarimetry Applications," Proceedings of IGARSS 2002, Toronto, Canada, June 24-28, 2002
70) P. Arsenault, , C. Grenier, I. Barnard, A. Baylis, "RADARSAT-2 Antenna Measured Beam Pattern Performance and Comparison with Software Predictions," Proceedings of EUSAR 2006, Dresden, Germany, May 16-18, 2006
71) C. Grenier, I. Barnard, P. Arsenault, "The RADARSAT-2 Synthetic Aperture Radar Phased Array Antenna Performance Analysis Methodology," Proceedings of EUSAR 2004, Ulm, Germany, May 25-27, 2004
72) A. Luscombe, A. Thompson, K. James, P. Fox, "Calibration Techniques for the RADARSAT-2 SAR System," Proceedings of EUSAR 2006, Dresden, Germany, May 16-18, 2006
73) R. Touzi, R.K. Hawkins, S. Côté, "Data Quality Assessment of Polarimetric Radarsat-2: Preliminary Results," Proceedings of the 4th International POLinSAR 2009 Workshop, Jan. 26-30, 2009, ESA/ESRIN, Frascati, Italy, URL: http://earth.esa.int/workshops/polinsar2009/participants/265/pres_5_Touzi_265.pdf
74) A. Brand, C. Grenier, I. Barnard, "RADARSAT-2 T/R Module Development," Proceedings of the 13th Canadian Astronautics Conference, ASTRO 2006, Montreal, QC, Canada, organized by CASI (Canadian Astronautics and Space Institute), April 25-27, 2006
75) S. Riendeau, C. Grenier, "RADARSAT-2 Antenna," Proceedings of the 2007 IEEE Aerospace Conference, Big Sky, MT, March 3-10, 2007
76) S. Chiu, C. Gierull, "Multi-Channel Receiver Concepts for RADARSAT-2 Ground Moving Target Indication," Proceedings of EUSAR 2006, Dresden, Germany, May 16-18, 2006
77) P. D. Beaulne, C. H. Gierull, C. E. Livinstone, I. C. Sikaneta, S. Chiu, S. Gong, M. Quinton, "Preliminary design of a SAR-GMTI processing system for RADARSAT-2 MODEX data," Proceedings of IGARSS 2003, Toulouse, France, July 21-25, 2003
78) P. D. Beaulne, C. E. Livingstone, "An Experiment Plan to Test RADARSAT's-2 GMTI Capabilities," Proceedings of EUSAR 2006, Dresden, Germany, May 16-18, 2006
79) Shen Chiu, Chuck Livingstone, Ishuwa Sikaneta, Christoph Gierull, Pete Beaulne, "RADARSAT-2 Moving Object Detection Experiment (MODEX)," Proceedings of IGARSS 2008 (IEEE International Geoscience & Remote Sensing Symposium), Boston, MA, USA, July 6-11, 2008
80) T. Luscombe, "RADARSAT-2: Early Results," EOBN 2008 (Earth Observation Business Network), May 13-14, 2008, Richmond, BC, Canada
81) R. J. Quinn, "Transformation in Maritime Domain Awareness: Project Polar Epsilon and Automated Identification System," Proceedings of the 13th Canadian Astronautics Conference, ASTRO 2006, Montreal, QC, Canada, organized by CASI (Canadian Astronautics and Space Institute), April 25-27, 2006
82) P. J. Butler, "Project Polar Epsilon: Joint Space-based Wide Area Surveillance and Support Capability," Proceedings of IGARSS 2005, Seoul, Korea, July 25-29, 2005
83) J. Howes, "Polar Epsilon: Joint Space-Based Wide Area Surveillance and Support Capability," EOBN 2008 (Earth Observation Business Network), May 13-14, 2008, Richmond, BC, Canada
84) P. J. Butler, "Project Polar Epsilon: Joint Space-Based Wide Area Surveillance and Support Capability," Proceedings of IGARSS 2005, Seoul, Korea, July 25-29, 2005, Vol. 2, pp. 1194-1197
85) S. K. Srivastava, P. Rolland, "Meeting Global Customers Needs of RADARSAT-2 Data," 58th IAC (International Astronautical Congress), International Space Expo, Hyderabad, India, Sept. 24-28, 2007, IAC-07-B1.4.04
86) P. Meisl, A. Bohane, "RADARSAT-2 Program," Ground Segment Coordination Body Workshop, ESA/ESRIN, Frascati, Italy, June 19-20, 2007, URL: http://www.congrex.nl/07c24/papers/08_Meisl.pdf
87) P. Meisl, C. Pearce, D. Comi, "RADARSAT-2 ground segment," Canadian Journal of Remote Sensing, Vol. 30, No 3, 2004, pp. 295-303
88) K. Beckett, A. Thompson, A. Luscombe, G. Stirling, "Optimization of RADARSAT-2 SAR Imagery for Vessel Detection Applications," Proceedings of the SPIE Remote Sensing Conference, Toulouse, France, Vol. 7826, Sept. 20-23, 2010, paper: 7825-10, 'Remote Sensing of the Ocean, Sea Ice, and Large Water Regions 2010,' edited by Charles R. Bostater Jr., Stelios P. Mertikas, Xavier Neyt, Miguel Velez-Reyes, doi: 10.1117/12.865058
Spacecraft Launch Mission Status Sensor Complement MODEX Experiment
Ground Segment References Back to Top