SDO 2019 (Solar Dynamics Observatory mission in the period 2019)
SDO mission status and imagery in the period 2019
• June 24, 2020: As of June 2020, NASA’s Solar Dynamics Observatory – SDO – has now been watching the Sun non-stop for over a full decade. From its orbit in space around Earth, SDO has gathered 425 million high-resolution images of the Sun, amassing 20 million gigabytes of data over the past 10 years. This information has enabled countless new discoveries about the workings of our closest star and how it influences the solar system. 1)
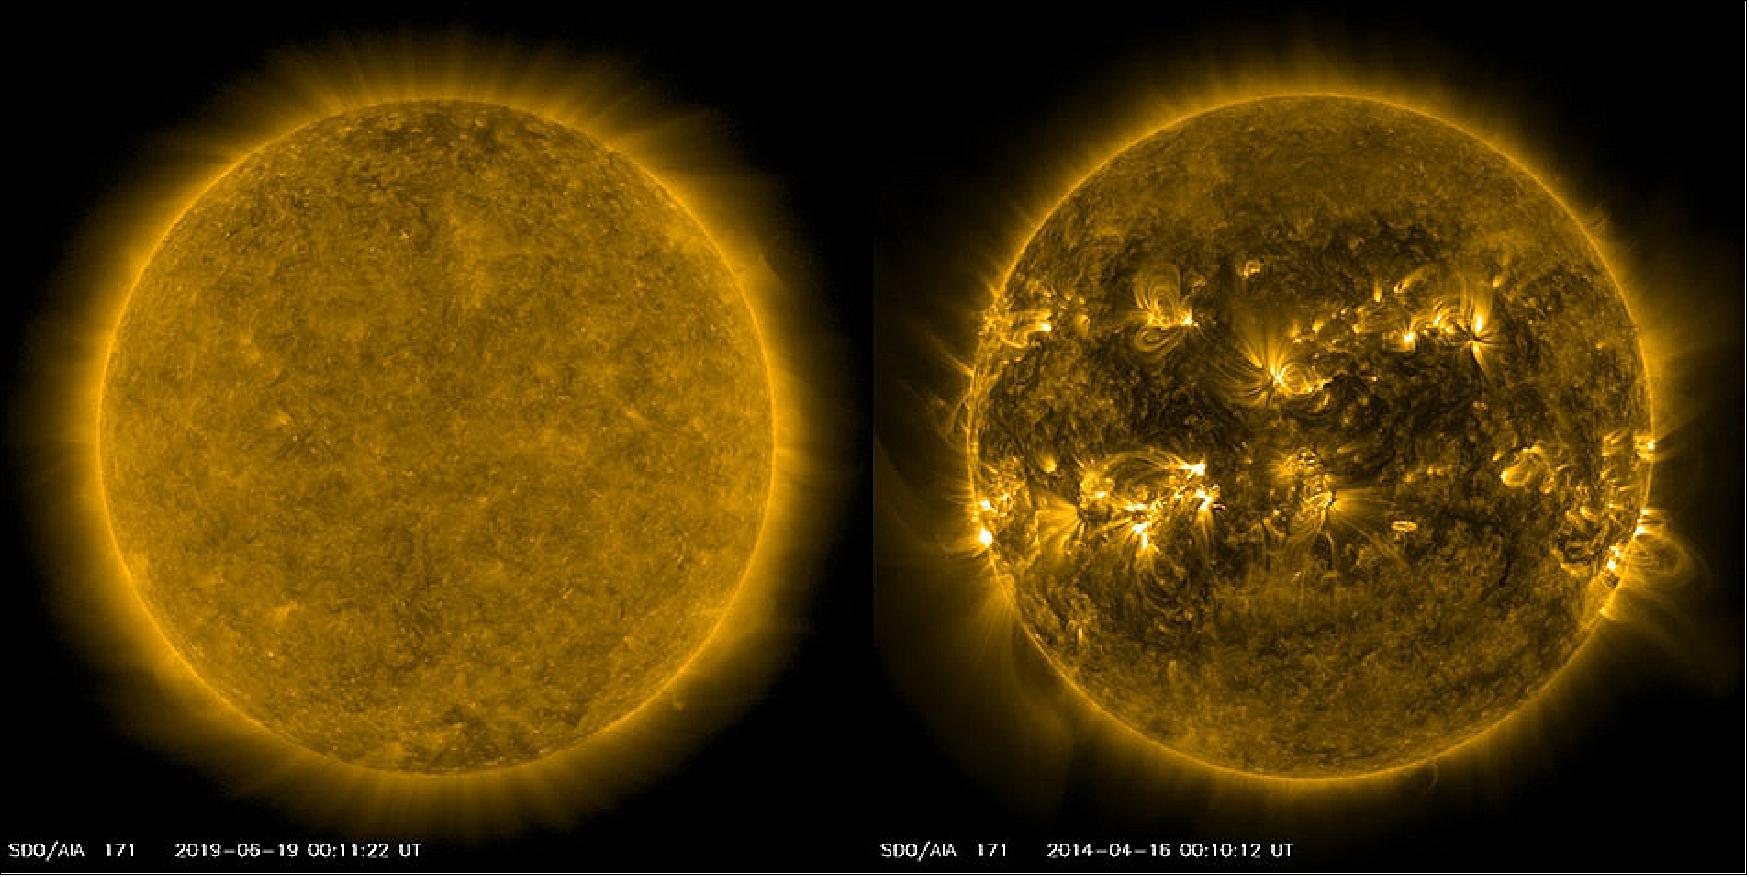
- With a triad of instruments, SDO captures an image of the Sun every 0.75 seconds. The Atmospheric Imaging Assembly (AIA) instrument alone captures images every 12 seconds at 10 different wavelengths of light. This 10-year time lapse showcases photos taken at a wavelength of 17.1 nanometers, which is an extreme ultraviolet wavelength that shows the Sun’s outermost atmospheric layer – the corona. Compiling one photo every hour, the movie condenses a decade of the Sun into 61 minutes. The video shows the rise and fall in activity that occurs as part of the Sun’s 11-year solar cycle and notable events, like transiting planets and eruptions. The custom music, titled “Solar Observer,” was composed by musician Lars Leonhard.
- While SDO has kept an unblinking eye pointed toward the Sun, there have been a few moments it missed. The dark frames in the video are caused by Earth or the Moon eclipsing SDO as they pass between the spacecraft and the Sun. A longer blackout in 2016 was caused by a temporary issue with the AIA instrument that was successfully resolved after a week. The images where the Sun is off-center were observed when SDO was calibrating its instruments.
- SDO and other NASA missions will continue to watch our Sun in the years to come, providing further insights about our place in space and information to keep our astronauts and assets safe.
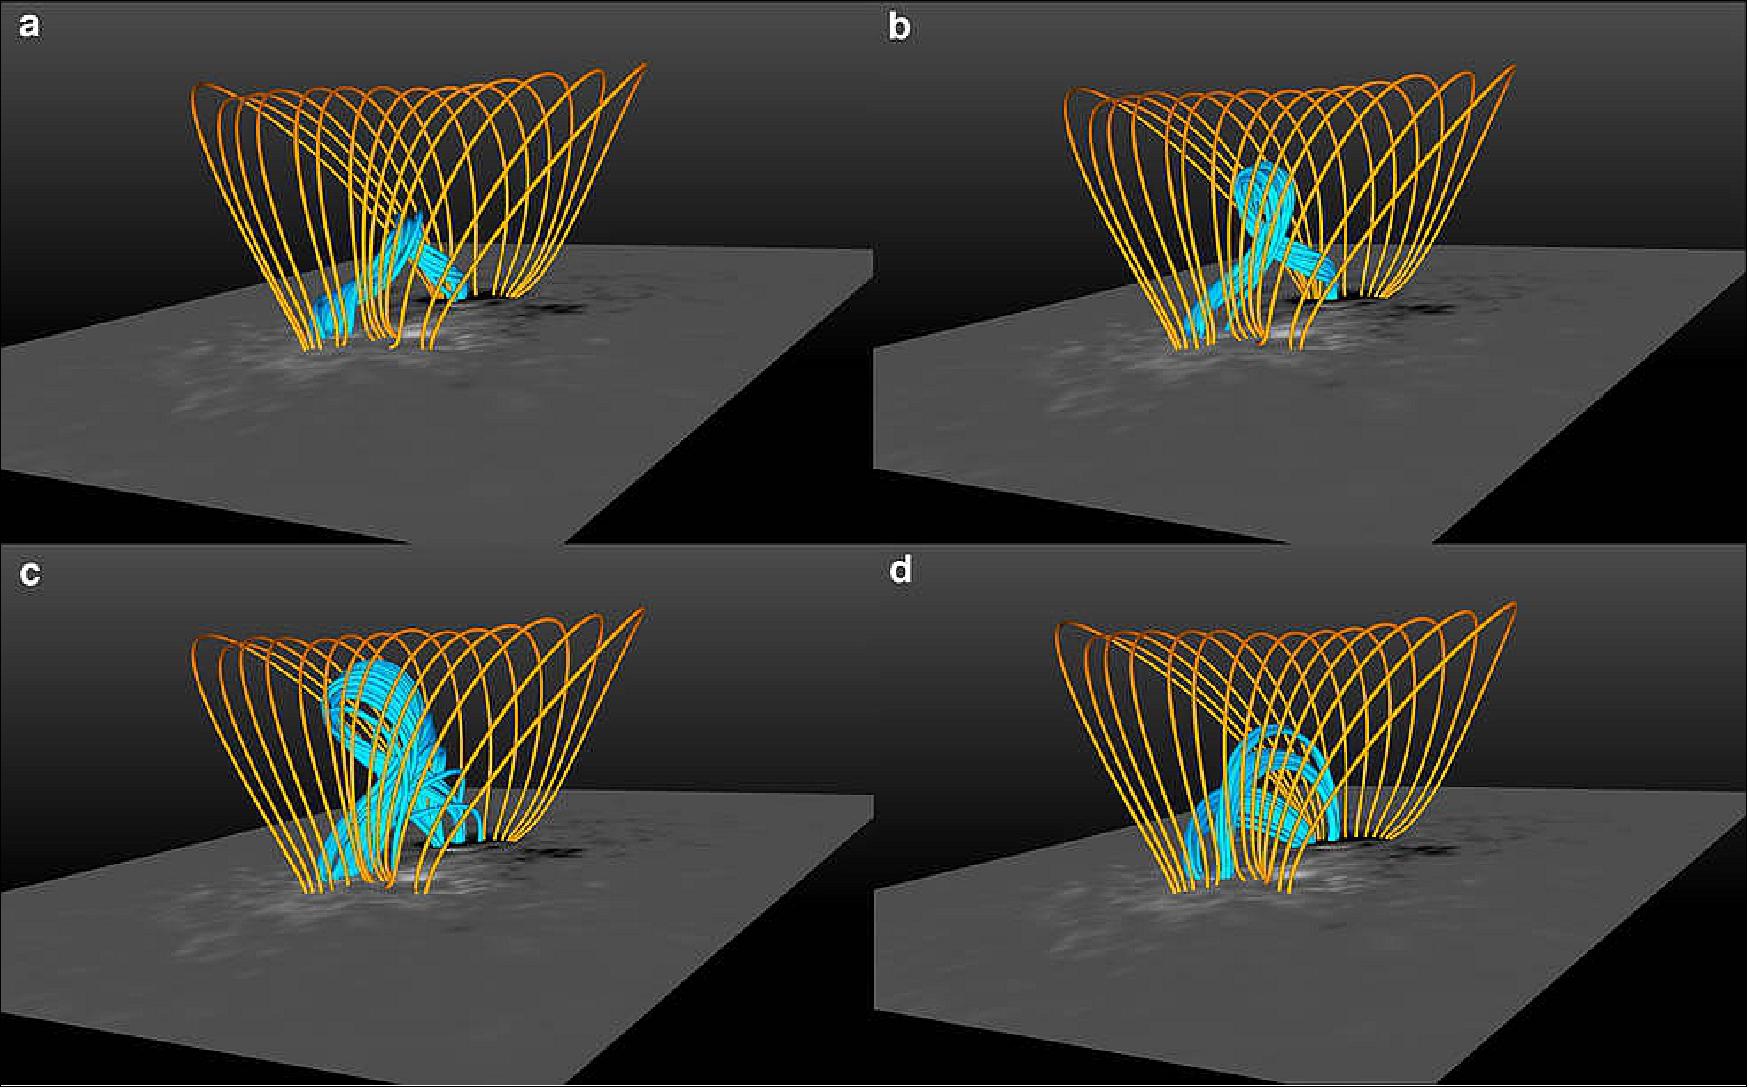
• December 17, 2019: NASA’s Solar Dynamics Observatory has observed a magnetic explosion the likes of which have never been seen before. In the scorching upper reaches of the Sun’s atmosphere, a prominence — a large loop of material launched by an eruption on the solar surface — started falling back to the surface of the Sun. But before it could make it, the prominence ran into a snarl of magnetic field lines, sparking a magnetic explosion. 2)
- Scientists have previously seen the explosive snap and realignment of tangled magnetic field lines on the Sun — a process known as magnetic reconnection — but never one that had been triggered by a nearby eruption. The observation, which confirms a decade-old theory, may help scientists understand a key mystery about the Sun’s atmosphere, better predict space weather, and may also lead to breakthroughs in the controlled fusion and lab plasma experiments.
- “This was the first observation of an external driver of magnetic reconnection,” said Abhishek Srivastava, solar scientist at Indian Institute of Technology (BHU), in Varanasi, India. “This could be very useful for understanding other systems. For example, Earth’s and planetary magnetospheres, other magnetized plasma sources, including experiments at laboratory scales where plasma is highly diffusive and very hard to control.”
- Previously a type of magnetic reconnection known as spontaneous reconnection has been seen, both on the Sun and around Earth. But this new explosion-driven type — called forced reconnection — had never been seen directly, thought it was first theorized 15 years ago. The new observations have just been published in the Astrophysical Journal. 3)
- The previously-observed spontaneous reconnection requires a region with just the right conditions — such as having a thin sheet of ionized gas, or plasma, that only weakly conducts electric current — in order to occur. The new type, forced reconnection, can happen in a wider range of places, such as in plasma that has even lower resistance to conducting an electric current. However, it can only occur if there is some type of eruption to trigger it. The eruption squeezes the plasma and magnetic fields, causing them to reconnect.
- While the Sun’s jumble of magnetic field lines are invisible, they nonetheless affect the material around them — a soup of ultra-hot charged particles known as plasma. The scientists were able to study this plasma using observations from NASA’s SDO (Solar Dynamics Observatory), looking specifically at a wavelength of light showing particles heated 1-2 million kelvins (1.8-3.6 million F).
- The observations allowed them to directly see the forced reconnection event for the first time in the solar corona — the Sun’s uppermost atmospheric layer. In a series of images taken over an hour, a prominence in the corona could be seen falling back into the photosphere. En route, the prominence ran into a snarl of magnetic field lines, causing them to reconnect in a distinct X shape.
- Spontaneous reconnection offers one explanation for how hot the solar atmosphere is — mysteriously, the corona is millions of degrees hotter than lower atmospheric layers, a conundrum that has led solar scientists for decades to search for what mechanism is driving that heat. The scientists looked at multiple ultraviolet wavelengths to calculate the temperature of the plasma during and following the reconnection event. The data showed that the prominence, which was fairly cool relative to the blistering corona, gained heat after the event. This suggests forced reconnection might be one way the corona is heated locally. Spontaneous reconnection also can heat plasma, but forced reconnection seems to be a much more effective heater — raising the temperature of the plasma quicker, higher, and in a more controlled manner.
- While a prominence was the driver behind this reconnection event, other solar eruptions like flares and coronal mass ejections, could also cause forced reconnection. Since these eruptions drive space weather — the bursts of solar radiation that can damage satellites around Earth — understanding forced reconnection can help modelers better predict when disruptive high-energy charged particles might come speeding at Earth.
- Understanding how magnetic reconnection can be forced in a controlled way may also help plasma physicists reproduce reconnection in the lab. This is ultimately useful in the field of laboratory plasma to control and stabilize them.
- The scientists are continuing to look for more forced reconnection events. With more observations they can begin to understand the mechanics behind the reconnection and often it might happen.
![Figure 3: Forced magnetic reconnection, caused by a prominence from the Sun, was seen for the first time in images from NASA’s Solar Dynamics Observatory, or SDO. This image shows the Sun on May 3, 2012, with the inset showing a close-up of the reconnection event imaged by SDO’s AIA (Atmospheric Imaging Assembly) instrument, where the signature X-shape is visible [image credit: NASA/SDO/Abhishek Srivastava/IIT(BHU)]](https://eoportal.org/ftp/satellite-missions/s/SDO2019-110320211/SDO2019_Auto3.jpeg)
• July 24, 2019: In a pair of new papers, scientists paint a picture of how solar cycles suddenly die, potentially causing tsunamis of plasma to race through the Sun’s interior and trigger the birth of the next sunspot cycle only a few short weeks later. 4)
- The new findings provide insight into the mysterious timing of sunspot cycles, which are marked by the waxing and waning of sunspot activity on the solar surface. While scientists have long known that these cycles last approximately 11 years, predicting when one cycle ends and the next begins has been challenging to pin down with any accuracy. The new research could change that.

- The new findings provide insight into the mysterious timing of sunspot cycles, which are marked by the waxing and waning of sunspot activity on the solar surface. While scientists have long known that these cycles last approximately 11 years, predicting when one cycle ends and the next begins has been challenging to pin down with any accuracy. The new research could change that.
- In one of the studies, which relies on nearly 140 years of solar observations from the ground and space, the scientists are able to identify “terminator” events that clearly mark the end of a sunspot cycle. With an understanding of what to look for in the run up to these terminators, the authors predict that the current solar cycle (Solar Cycle 24) will end in the first half of 2020, kicking off the growth of Solar Cycle 25 very shortly after.
- In a second study, motivated by the first, scientists explore the mechanism for how a terminator event could trigger the start of a new sunspot cycle using a sophisticated computer model. The resulting simulations show that “solar tsunamis” could provide the connection and explain the Sun’s remarkably rapid transition from one cycle to the next.
- Both studies were led by the National Center for Atmospheric Research (NCAR).
- “The evidence for terminators has been hidden in the observational record for more than a century, but until now, we didn’t know what we were looking for,” said NCAR scientist Scott McIntosh, who directs the center’s High Altitude Observatory and worked on both studies. “By combining such a wide variety of observations over so many years, we were able to piece together these events and provide an entirely new look at how the Sun’s interior drives the solar cycle.”
- The research was funded by the National Science Foundation, which is NCAR’s sponsor, NASA’s Living with a Star program, and the Indo-US Joint Networked R&D Center.
Flickers of light reveal mysteries
- Sunspot cycles are born after solar minimum, a period when the face of the Sun is quiet. As the cycle continues, more and more sunspots emerge, first appearing at about 35 degrees latitude in both hemispheres and slowly marching toward the equator over a decade before they fade again into the next solar minimum. The rough midpoint of this progression is solar maximum, when sunspots are the most abundant.
- Predicting the timing of sunspot evolution is a major scientific goal, in part because sunspot activity is tied to the solar storms that can disrupt Earth's upper atmosphere and affect GPS signals, power grids, and other critical technologies. But such predictions have proven challenging.
- For example, the Sun is currently in a solar minimum. Scientist know the relative peace means that the current solar cycle is wrapping up, but it has been difficult to say whether the new cycle will begin in a few months or a few years. McIntosh and his colleagues think their studies can provide more clarity, both into the timing of cycles and also into what drives the cycles themselves.
- The researchers began by studying the movement of coronal bright points – ephemeral flickers of extreme ultraviolet light in the solar atmosphere. By observing bright points, which occur even in the relative calm of a solar minimum, the scientists think they have gained a more complete view of the solar cycle than if they focused only on sunspot activity.
- The bright points first appear at higher latitudes than sunspots (around 55º) and migrate toward the equator at approximately 3º latitude per year, reaching the equator after a couple decades. The paths traced by the bright points overlap with sunspot activity in the mid-latitudes (around 35º) until they both reach the equator and disappear. This disappearance, which the researchers call a terminator event, is followed very shortly after with a large burst of bright point activity at the mid-latitudes, marking the beginning of the next sunspot cycle.
- In the new study that identifies terminator events, published in the journal Solar Physics, the scientists corroborate the bright point observations with a number of other observations from a variety of spacecraft- and ground-observing facilities stretching back over 13 solar cycles. 5)
- “We were able to identify these terminators by looking at data from a whole range of different measures of solar activity – magnetic fields, spectral irradiance, radio flux – in addition to the bright points,” said University of Maryland scientist Bob Leamon, a co-author of the paper who is also a researcher at NASA’s Goddard Space Flight Center. “The results demonstrate that you really need to be able to step back and use all the available data to appreciate how things work – not just one spacecraft or one observation or one model.”
Tsunami connections
- McIntosh and his team have identified that coronal bright points allow them to better “see” the solar cycle unfolding. But why does the sunspot cycle start surging in the midlatitudes a few weeks after the terminator?
- The paper on solar tsunamis, led by NCAR scientist Mausumi Dikpati and published in Scientific Reports, explores the possible mechanisms behind the observations. It suggests that coronal bright points are markers for the movement of the Sun’s “toroidal magnetic fields,” which wrap around the Sun like rubber bands stretching in the east-west direction and migrate slowly toward the equator over the same two decades. 6)
- When these toroidal magnetic fields bob to the surface, they create sunspots along with the bright points they were already producing. As they travel, they also act as magnetic dams, trapping plasma behind them. When the toroidal magnetic fields from the Sun's northern and southern hemispheres touch in the middle, their opposing charges cause their mutual annihilation, releasing the pent-up fluid behind them in a tsunami. This fluid rushes forward, collides, and then ripples backward, traveling toward the poles at a rate of about 300 meters per second.
- As the solar tsunami reaches the Sun's mid-latitudes, it encounters the toroidal magnetic fields of the next cycle, which are already marching toward the equator (this progression is marked by the path of coronal bright points) but traveling deeper within the Sun's interior. The tsunami buoys those magnetic fields, lifting them toward the surface and producing the remarkable surge of bright points – and accompanying sunspot activity – that marks the beginning of the new sunspot cycle.
- "We have observed the sunspot cycle for hundreds of years, but it's been a mystery what mechanism could transport a signal from the equator, where the cycle ends, to the Sun's mid-latitudes, where the next cycle begins, in such a relatively short amount of time," said Dikpati.
- As a body, the research provides a new way of thinking about the workings of the solar interior that challenges some of the conventional thinking about processes on the Sun. Whether or not the research is on the right track – and could improve our predictive capabilities – will soon get its first test.
- There are a number of instruments that are ideally suited to observe the inevitable end of the current solar cycle and the start of the next, according to the authors. These include the Parker Solar Probe, which launched last August, the STEREO-A spacecraft, the Solar Dynamics Observatory, the Daniel K. Inouye Solar Telescope, and other assets.
- “In the next year, we should have a unique opportunity to extensively observe a terminator event as it unfolds and then to watch the launch of Sunspot Cycle 25,” McIntosh said. “We believe the results, especially if the terminator arrives when predicted, could revolutionize our understanding of the solar interior and the processes that create sunspots and shape the sunspot cycle.”
• April 5, 2019: For five months in mid 2017, Emily Mason did the same thing every day. Arriving to her office at NASA’s Goddard Space Flight Center in Greenbelt, Maryland, she sat at her desk, opened up her computer, and stared at images of the Sun — all day, every day. “I probably looked through three or five years' worth of data,” Mason estimated. Then, in October 2017, she stopped. She realized she had been looking at the wrong thing all along. 7)
- Mason, a graduate student at The Catholic University of America in Washington, D.C., was searching for coronal rain: giant globs of plasma, or electrified gas, that drip from the Sun’s outer atmosphere back to its surface. But she expected to find it in helmet streamers, the million-mile tall magnetic loops — named for their resemblance to a knight’s pointy helmet — that can be seen protruding from the Sun during a solar eclipse. Computer simulations predicted the coronal rain could be found there. Observations of the solar wind, the gas escaping from the Sun and out into space, hinted that the rain might be happening. And if she could just find it, the underlying rain-making physics would have major implications for the 70-year-old mystery of why the Sun’s outer atmosphere, known as the corona, is so much hotter than its surface. But after nearly half a year of searching, Mason just couldn’t find it. “It was a lot of looking,” Mason said, “for something that never ultimately happened.”
- The problem, it turned out, wasn’t what she was looking for, but where. In a paper published today in the Astrophysical Journal Letters, Mason and her coauthors describe the first observations of coronal rain in a smaller, previously overlooked kind of magnetic loop on the Sun. After a long, winding search in the wrong direction, the findings forge a new link between the anomalous heating of the corona and the source of the slow solar wind — two of the biggest mysteries facing solar science today. 8)

How It Rains on the Sun
- Observed through the high-resolution telescopes mounted on NASA’s SDO spacecraft, the Sun – a hot ball of plasma, teeming with magnetic field lines traced by giant, fiery loops — seems to have few physical similarities with Earth. But our home planet provides a few useful guides in parsing the Sun’s chaotic tumult: among them, rain.
- On Earth, rain is just one part of the larger water cycle, an endless tug-of-war between the push of heat and pull of gravity. It begins when liquid water, pooled on the planet’s surface in oceans, lakes, or streams, is heated by the Sun. Some of it evaporates and rises into the atmosphere, where it cools and condenses into clouds. Eventually, those clouds become heavy enough that gravity’s pull becomes irresistible and the water falls back to Earth as rain, before the process starts anew.
- On the Sun, Mason said, coronal rain works similarly, “but instead of 60-degree water you’re dealing with a million-degree plasma.” Plasma, an electrically-charged gas, doesn’t pool like water, but instead traces the magnetic loops that emerge from the Sun’s surface like a rollercoaster on tracks. At the loop’s foot points, where it attaches to the Sun’s surface, the plasma is superheated from a few thousand to over 1.8 million degrees Fahrenheit. It then expands up the loop and gathers at its peak, far from the heat source. As the plasma cools, it condenses and gravity lures it down the loop’s legs as coronal rain.

- Mason was looking for coronal rain in helmet streamers, but her motivation for looking there had more to do with this underlying heating and cooling cycle than the rain itself. Since at least the mid-1990s, scientists have known that helmet streamers are one source of the slow solar wind, a comparatively slow, dense stream of gas that escapes the Sun separately from its fast-moving counterpart. But measurements of the slow solar wind gas revealed that it had once been heated to an extreme degree before cooling and escaping the Sun. The cyclical process of heating and cooling behind coronal rain, if it was happening inside the helmet streamers, would be one piece of the puzzle.
- The other reason connects to the coronal heating problem — the mystery of how and why the Sun’s outer atmosphere is some 300 times hotter than its surface. Strikingly, simulations have shown that coronal rain only forms when heat is applied to the very bottom of the loop. “If a loop has coronal rain on it, that means that the bottom 10% of it, or less, is where coronal heating is happening,” said Mason. Raining loops provide a measuring rod, a cutoff point to determine where the corona gets heated. Starting their search in the largest loops they could find — giant helmet streamers — seemed like a modest goal, and one that would maximize their chances of success.
- She had the best data for the job: Images taken by NASA’s SDO (Solar Dynamics Observatory), a spacecraft that has photographed the Sun every twelve seconds since its launch in 2010. But nearly half a year into the search, Mason still hadn’t observed a single drop of rain in a helmet streamer. She had, however, noticed a slew of tiny magnetic structures, ones she wasn’t familiar with. “They were really bright and they kept drawing my eye,” said Mason. “When I finally took a look at them, sure enough they had tens of hours of rain at a time.”
- At first, Mason was so focused on her helmet streamer quest that she made nothing of the observations. “She came to group meeting and said, ‘I never found it — I see it all the time in these other structures, but they’re not helmet streamers,’” said Nicholeen Viall, a solar scientist at Goddard, and a coauthor of the paper. “And I said, ‘Wait ...hold on. Where do you see it? I don’t think anybody’s ever seen that before!’”
A Measuring Rod for Heating
- These structures differed from helmet streamers in several ways. But the most striking thing about them was their size.
- “These loops were much smaller than what we were looking for,” said Spiro Antiochos, who is also a solar physicist at Goddard and a coauthor of the paper. “So that tells you that the heating of the corona is much more localized than we were thinking.”
- While the findings don’t say exactly how the corona is heated, “they do push down the floor of where coronal heating could happen,” said Mason. She had found raining loops that were some 30,000 miles high, a mere two percent the height of some of the helmet streamers she was originally looking for. And the rain condenses the region where the key coronal heating can be happening. “We still don’t know exactly what’s heating the corona, but we know it has to happen in this layer,” said Mason.

A New Source for the Slow Solar Wind
- But one part of the observations didn’t jibe with previous theories. According to the current understanding, coronal rain only forms on closed loops, where the plasma can gather and cool without any means of escape. But as Mason sifted through the data, she found cases where rain was forming on open magnetic field lines. Anchored to the Sun at only one end, the other end of these open field lines fed out into space, and plasma there could escape into the solar wind. To explain the anomaly, Mason and the team developed an alternative explanation — one that connected rain on these tiny magnetic structures to the origins of the slow solar wind.
- In the new explanation, the raining plasma begins its journey on a closed loop, but switches — through a process known as magnetic reconnection — to an open one. The phenomenon happens frequently on the Sun, when a closed loop bumps into an open field line and the system rewires itself. Suddenly, the superheated plasma on the closed loop finds itself on an open field line, like a train that has switched tracks. Some of that plasma will rapidly expand, cool down, and fall back to the Sun as coronal rain. But other parts of it will escape – forming, they suspect, one part of the slow solar wind.
- Mason is currently working on a computer simulation of the new explanation, but she also hopes that soon-to-come observational evidence may confirm it. Now that Parker Solar Probe, launched in 2018, is traveling closer to the Sun than any spacecraft before it, it can fly through bursts of slow solar wind that can be traced back to the Sun — potentially, to one of Mason’s coronal rain events. After observing coronal rain on an open field line, the outgoing plasma, escaping to the solar wind, would normally be lost to posterity. But no longer. “Potentially we can make that connection with Parker Solar Probe and say, that was it,” said Viall.
Digging Through the Data
- As for finding coronal rain in helmet streamers? The search continues. The simulations are clear: the rain should be there. “Maybe it’s so small you can’t see it?” said Antiochos. “We really don’t know.”
- But then again, if Mason had found what she was looking for she might not have made the discovery — or have spent all that time learning the ins and outs of solar data.
- “It sounds like a slog, but honestly it’s my favorite thing,” said Mason. “I mean that’s why we built something that takes that many images of the Sun: So we can look at them and figure it out.”
• On the evening of March 6, 2019, the Moon started to transit the Sun, then doubled back and retraced its steps in the other direction — at least, that's what it looked like from the perspective of NASA's SDO (Solar Dynamics Observatory) mission in orbit around Earth. 9)

- SDO sees lunar transits regularly, when the Moon passes in front of its view of the Sun. The Moon's unusual apparent behavior during this particular transit is a phenomenon similar to retrograde motion: When a celestial object appears to move backwards because of the way that different objects move at different speeds at different points in their orbits. In this case, the first part of the transit — when the Moon moves left to right — appears to be "reverse" motion. SDO overtakes the Moon, moving at about 1.9 miles per second perpendicular to the Sun-Earth line compared to the Moon's 0.6 miles per second, making the Moon appear to move in the opposite direction you would see if you were standing still on Earth.
- The second part of the transit — when the Moon appears to pause and rewind — happens as SDO enters the dusk part of its orbit and begins moving away from the Moon, nearly parallel to the shadow it's casting through space. At that point, the Moon once again moves faster than SDO – when compared to the Sun-Earth line – overtaking it. So the spacecraft now sees it move in the other direction — the same direction that a stationary observer on Earth would see.
- This isn't the first time that SDO has seen the Moon seem to move in two different directions during a lunar transit. This time, the Moon just happened to remain in SDO's sight as it began the dusk part of its orbit, leading to the freeze-frame effect.
- This lunar transit lasted about four hours, from 5 p.m. to 9:07 p.m. EST, and, at peak, the Moon covered 82 percent of the Sun's face. The Moon's edge appears sharp because the Moon has no atmosphere. On the other hand, Earth eclipses of the Sun have a blurry edge when seen by SDO, because the gases in Earth's atmosphere let through only part of the Sun's light.
• February 7, 2019: New research undertaken at Northumbria University, Newcastle (UK) shows that the Sun's magnetic waves behave differently than currently believed. Their findings have been reported in the latest edition of the prominent journal, Nature Astronomy. 10)
- After examining data gathered over a 10-year period, the team from Northumbria's Department of Mathematics, Physics and Electrical Engineering found that magnetic waves in the Sun's corona - its outermost layer of atmosphere - react to sound waves escaping from the inside of the Sun.
- These magnetic waves, known as Alfvénic waves, play a crucial role in transporting energy around the Sun and the solar system. The waves were previously thought to originate at the Sun's surface, where boiling hydrogen reaches temperatures of 6,000 K and churns the Sun's magnetic field.
- However, the researchers have found evidence that the magnetic waves also react — or are excited — higher in the atmosphere by sound waves leaking out from the inside of the Sun.
- The team discovered that the sound waves leave a distinctive marker on the magnetic waves. The presence of this marker means that the Sun's entire corona is shaking in a collective manner in response to the sound waves. This is causing it to vibrate over a very clear range of frequencies.
- This newly-discovered marker is found throughout the corona and was consistently present over the 10-year time-span examined. This suggests that it is a fundamental constant of the Sun — and could potentially be a fundamental constant of other stars.
- The findings could therefore have significant implications for our current ideas about how magnetic energy is transferred and used in stellar atmospheres.
- Dr Richard Morton, the lead author of the report and a senior lecturer at Northumbria University, said: "The discovery of such a distinctive marker — potentially a new constant of the Sun — is very exciting. We have previously always thought that the magnetic waves were excited by the hydrogen at the surface, but now we have shown that they are excited by these sound waves. This could lead to a new way to examine and classify the behavior of all stars under this unique signature. Now we know the signature is there, we can go looking for it on other stars. 11)
- "The Sun's corona is over one hundred times hotter than its surface and energy stemming from the Alfvénic waves is believed to be responsible for heating the corona to a temperature of around one million degrees. The Alfvénic waves are also responsible for heating and accelerating powerful solar wind from the Sun which travels through the solar system. These winds travel at speeds of around a million miles per hour. They also affect the atmosphere of stars and planets, impacting on their own magnetic fields, and cause phenomena such as aurora."
- Dr Morton added: "Our evidence shows that the Sun's internal acoustic oscillations play a significant role in exciting the magnetic Alfvénic waves. This can give the waves different properties and suggests that they are more susceptible to an instability, which could lead to hotter and faster solar winds."
- The research was funded by the UK Science and Technology Facilities Council and the US Air Force Office of Scientific Research. It was undertaken by Dr Morton and Professor James McLaughlin from Northumbria's Solar Physics research group, together with Dr Micah Weberg, who recently moved from Northumbria to Washington DC's Naval Research Laboratory.
- The study of the Alfvénic wave motions is supported by extreme ultraviolet images of the corona from the 17.1 nm (Fe IX) channel of the AIA (Atmospheric Imaging Assembly) instrument on-board NASA's SDO (Solar Dynamics Observatory), which enables direct measurement of the transverse oscillatory displacements of the corona’s fine-scale magnetic structure.
1) Mara Johnson-Groh, Rob Garner, ”Watch a 10-Year Time Lapse of Sun From NASA’s SDO,” NASA Feature, 24 June 2020, URL: https://www.nasa.gov/feature/
goddard/2020/watch-a-10-year-time-lapse-of-sun-from-nasa-s-sdo
2) Mara Johnson-Groh, Rob Garner, ”NASA’s SDO Sees New Kind of Magnetic Explosion on Sun,” NASA Feature, 17 December 2019, URL: https://www.nasa.gov/feature/
goddard/2019/nasa-s-sdo-sees-new-kind-of-magnetic-explosion-on-sun
3) A. K. Srivastava, S. K. Mishra, P. Jelínek, Tanmoy Samanta, Hui Tian, Vaibhav Pant, P. Kayshap, Dipankar Banerjee, J. G. Doyle, and B. N. Dwivedi, ”On the Observations of Rapid Forced Reconnection in the Solar Corona,” The Astrophysical Journal, Volume 887, Number 2, Published: 17 December 2019, https://doi.org/10.3847/1538-4357/ab4a0c
4) Laura Snider, ”‘Terminators’ on the Sun trigger plasma tsunamis and the start of new solar cycles,” UCAR, 24 July 2019, URL: https://news.ucar.edu/132675/
terminators-sun-trigger-plasma-tsunamis-and-start-new-solar-cycles
5) Scott W. McIntosh, Robert J. Leamon,Ricky Egeland,Mausumi Dikpati,Yuhong Fan,Matthias Rempel, ”What the Sudden Death of Solar Cycles Can Tell Us About the Nature of the Solar Interior,” Solar Physics, Vol. 294:88, 09July 2019, https://doi.org/10.1007/s11207-019-1474-y
6) Mausumi Dikpati, Scott W. McIntosh, Subhamoy Chatterjee, Dipankar Banerjee, Ron Yellin-Bergovoy & Abhishek Srivastava, ”Triggering The Birth of New Cycle’s Sunspots by Solar Tsunami,” Scientific Reports, Vol. 9, Article number: 2035, Published: 14 February 2019, https://doi.org/10.1038/s41598-018-37939-z, URL: https://www.nature.com/articles/s41598-018-37939-z.pdf
7) Miles Hatfield , Rob Garner, ”Unexpected Rain on Sun Links Two Solar Mysteries,” NASA, 5 April, 2019, URL: https://www.nasa.gov/feature/goddard/2019/unexpected-rain-on-sun-links-two-solar-mysteries
8) E. I. Mason, Spiro K. Antiochos, and Nicholeen M. Viall, ”Observations of Solar Coronal Rain in Null Point Topologies,” The Astrophysical Journal Letters, Volume 874, Number 2, Published on 5 April 2019, https://doi.org/10.3847/2041-8213/ab0c5d
9) Sarah Frazier, Rob Garner ”NASA's Solar Dynamics Observatory Catches Lunar Freeze Frame,” NASA, 7 March 2019, URL: https://www.nasa.gov/feature/goddard/2019
/nasas-solar-dynamics-observatory-catches-lunar-freeze-frame
10) ”Evidence for a new fundamental constant of the sun,” Science Daily, 7 February 2019, URL: https://www.sciencedaily.com/releases/2019/02/190207111256.htm
11) R. J. Morton, M. J. Weberg & J. A. McLaughlin, ”A basal contribution from p-modes to the Alfvénic wave flux in the Sun’s corona,” Nature Astronomy Letters, Published: 28 January 2019, https://doi.org/10.1038/s41550-018-0668-9, URL: https://tinyurl.com/yx8ubr2j
12) ”Solar Dynamics Observatory (SDO): Year One,” NASA, 23 July 2018, URL: https://www.youtube.com/watch?v=tlk36vnKzx8
The information compiled and edited in this article was provided by Herbert J. Kramer from his documentation of: ”Observation of the Earth and Its Environment: Survey of Missions and Sensors” (Springer Verlag) as well as many other sources after the publication of the 4th edition in 2002. - Comments and corrections to this article are always welcome for further updates (herb.kramer@gmx.net).