WorldView-3
EO
Operational (extended)
Maxar
WV110
Launched in 2014, WorldView-3 (WV-3) is a commercial high-resolution imaging satellite operated by DigitalGlobe, now operated under Maxar Technologies, from the USA. WorldView-3 added to DigitalGlobe’s existing constellation of QuickBird, WorldView-1 and WorldView-2, with WorldView-4 joining the constellation in 2016.
Quick facts
Overview
| Mission type | EO |
| Agency | Maxar |
| Mission status | Operational (extended) |
| Launch date | 13 Aug 2014 |
| Instruments | WV110 |
| CEOS EO Handbook | See WorldView-3 summary |
Related Resources
Summary
Mission Capabilities
WorldView-3 carries the WV-3 Imager (also known as WV110), which has 29 spectral bands, including a panchromatic band, eight multispectral bands, eight shortwave infrared bands, and 12 CAVIS (Clouds, Aerosols, Vapours, Ice, and Snow) bands. The WV-3 Imager covers a much wider range of the electromagnetic spectrum than most other commercial satellites, allowing for automated spectral classification to determine what types of material are contained within a pixel. This is commonly used in Environmental Monitoring (ENVI), with many examples in forestry, where users want to monitor tree health and pest infestation in remote regions. While these types of analyses are usually performed using hyperspectral data, WorldView-3 brings a limited version of this capability to users at a reduced price.
The CAVIS bands monitor the atmosphere and provide correction data to improve WorldView-3's high-resolution imagery when it images Earth objects through haze, soot, dust or other obscurants.
Performance Specifications
The WV-3 Imager provides one of the highest resolution commercial data products, at just 30cm. This performance has allowed for new applications for satellite data, including counting bird populations in remote locations. The satellite covers a ground swath of 13.1km, also supporting multiple swath imaging for mosaic image creation and stereo imaging. WV-3 has a predicted absolute geolocation accuracy of less than 3.5m CE90 (Circular Error of 90%) without ground control.
The satellite is in a sun-synchronous orbit, at an altitude of 617 km and inclination of 98°. The LTDN (Local Time on Descending Node) is at 1330 hours, and the period is 97 minutes.
Space and Hardware Components
The BCP 5000 bus, designed by BATC (Ball Aerospace & Technologies Corporation), was used for the WV-3 spacecraft. It has a design life of 7.25 years, with an estimated service life of 10-12 years, alongside increased power, resolution, agility, target selection, flexibility, transmission capability and data storage.
WorldView-3 (WV-3)
Spacecraft Launch Mission Status Sensor Complement References
WorldView-3 is a next generation commercial imaging mission of DigitalGlobe Inc., Longmont, CO, USA. With the addition of WV-3 to its satellite constellation (in addition to QuickBird, WorldView-1 and WorldView-2), DigitalGlobe will be capable of collecting ~1 billion km2 of Earth imagery per year.
In August 2010, DigitalGlobe was awarded an SLA (Service Level Agreement) with NGA (National Geospatial-Intelligence Agency) within its Enhanced View program. The contract deals with the purchase of satellite imagery and includes also an NGA cost share for the development and launch of the WorldView-3 spacecraft. DigitalGlobe plans a launch of WorldView-3 for the end of 2014. 1)
DigitalGlobe is adding a SWIR (Shortwave Infrared) sensing capability (8-band instrument) to its planned WorldView-3 satellite that will open up a host of new civil and military applications. 2) 3)
WorldView-3 provides 31 cm panchromatic resolution, 1.24 m MS (Multispectral) resolution, 3.7 m SWIR (Short-Wave Infrared) resolution, and 30 m CAVIS ( Clouds, Aerosols, Vapors, Ice, and Snow) resolution. CAVIS will monitor the atmosphere and provide correction data to improve WorldView-3's imagery when it images earth objects through haze, soot, dust or other obscurants. WorldView-3 has an average revisit time of < 1 day and is capable of collecting up to 680,000 km2 per day, further enhancing the DigitalGlobe collection capacity for more rapid and reliable collection. 4) 5)
Spacecraft
On August 30, 2010, DigitalGlobe awarded contracts to BATC (Ball Aerospace & Technologies Corporation) and to ITT Industries to build the WorldView-3 spacecraft and imager, respectively. 6) 7) 8) 9)
The BCP 5000 bus is being used for the WorldView-3 spacecraft. The high-performance BCP 5000 has a design life of more than seven years, and provides a platform with increased power, resolution, agility, target selection, flexibility, transmission capability and data storage. Ball provided the BCP 5000 under a fixed-price contract.
WorldView-3 builds upon WorldView-2 and WorldView-1 technology by carrying forward the satellites' advanced CMGs (Control Moment Gyroscopes). The CMGs, developed at BATC, reorient a satellite over a desired collection area in 4-5 seconds, compared to 30-45 seconds needed for traditional reaction wheels.
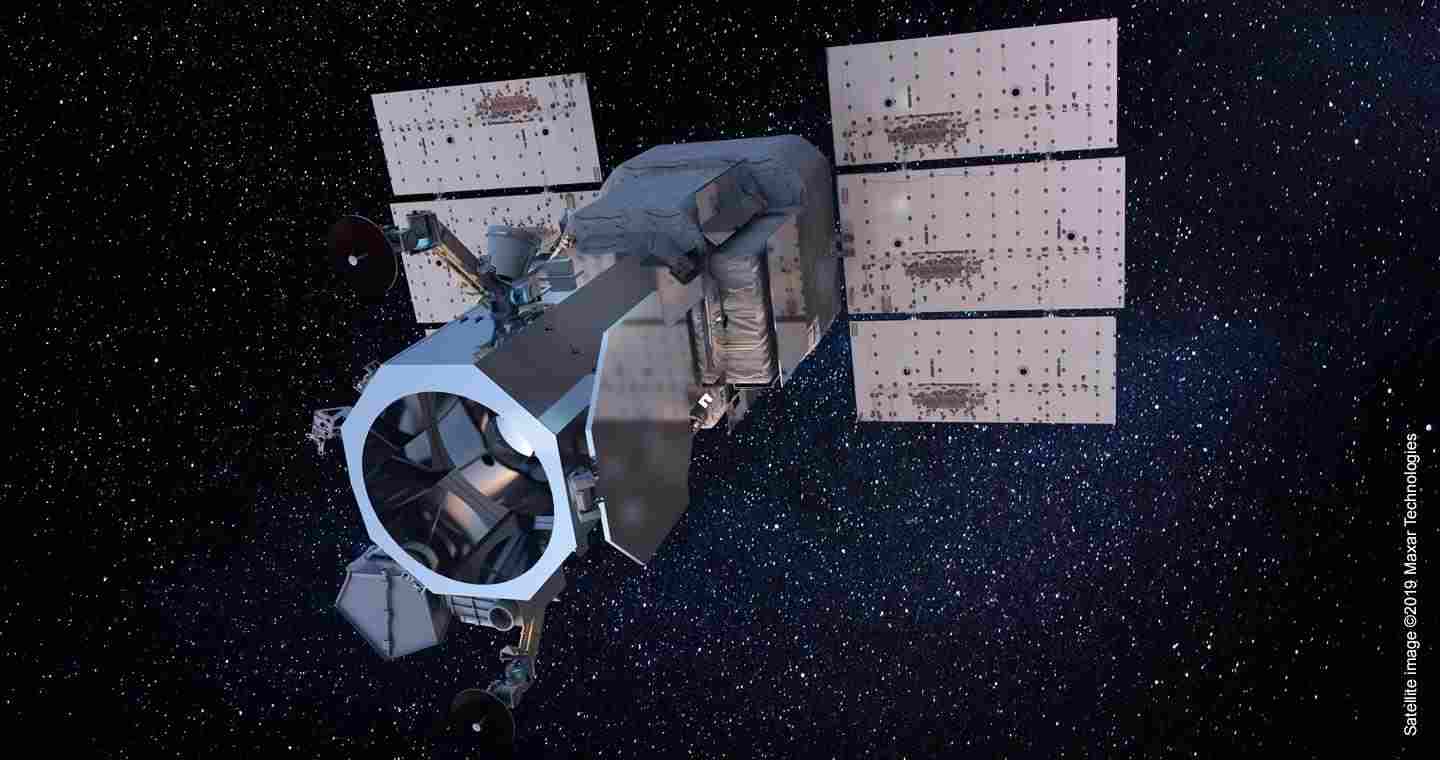
Spacecraft size | 5.7 m tall x 2.5 m across; 7.1 m across with the solar panels deployed |
Spacecraft mass | 2812 kg |
Spacecraft power | 3.1 kW solar array, 100 Ahr battery |
Design life | 7.25 years, estimated service life: 10 to 12 years |
ADCS (Attitude Determination and Control Subsystem) | - Type: 3-axis stabilized |
Spacecraft pointing | - Accuracy: < 500 m at image start/stop; Knowledge: Supports geolocation accuracy |
Retargeting agility | Time to slew 200 km: 12 s |
Onboard data storage | 2.199 Tbit solid state memory with EDAC |
RF communications | Image & ancillary data: 800 and 1200 Mbit/s, X-band |
Project Development Status
• On August 1, 2014, DigitalGlobe announced its plans to accelerate the launch of WorldView-4, previously named GeoEye-2, to mid-2016 to meet demand from DigitalGlobe’s Direct Access and other commercial customers. 11)
• June 27, 2014: BATC has delivered the next-generation commercial remote sensing satellite built for DigitalGlobe, to the launch facility at Vandenberg Air Force Base, California. The WorldView-3 spacecraft passed a full suite of environmental, functional and performance tests in preparation for integration with the launch vehicle, along with thorough pre-ship reviews by Ball Aerospace and DigitalGlobe. 12)
• On June 11, 2014, Digital Globe announced that it received notice from the U.S. Department of Commerce on its application to allow the company to sell its highest-quality and industry-leading commercial satellite imagery. Effective immediately, DigitalGlobe will be permitted to offer customers the highest resolution imagery available from their current constellation. Additionally, the updated approvals will permit DigitalGlobe to sell imagery to all of its customers at up to 0.25 m panchromatic and 1.0 m multispectral GSD (Ground Sample Distance) beginning six months after its next satellite WorldView-3 is operational. The launch of Worldview-3 is scheduled for August 2014. 13)
- As a result of the U.S. Government’s recent decision to allow DigitalGlobe to sell the highest quality imagery that will be available, the company has seen sufficient demand that justifies the accelerated launch of WorldView-4 (formerly GeoEye-2)providing its customers with assured access to 30 cm resolution imagery – the highest resolution imagery commercially available.
• In January 2014, BATC has completed integration of the WorldView-3 spacecraft. With the imagery sensor and associated electronics now integrated, the completed satellite bus is ready for system-level performance testing, followed by thermal vacuum and environmental testing.
• DigitalGlobe can now confirm that it plans to complete WorldView-3 on its original schedule to be ready for launch in mid-2014 in order to meet the requirements of its EnhancedView contract with the U.S. government. That contract calls for completion and launch of WorldView-3, which will offer the most spectral diversity available commercially and be the first to offer multiple Short-Wave Infrared bands that allow for accurate imaging through haze, fog, dust, smoke and other air-born particulates. DigitalGlobe's largest customer, NGA (National Geospatial-Intelligence Agency), has confirmed the requirements of DigitalGlobe's EnhancedView contract remain unchanged.
• Accordingly, following its just completed combination with GeoEye, DigitalGlobe intends to complete the construction of GeoEye-2 in 2013 and to preserve it as a ground spare to meet customer demand or as a replacement for other on-orbit satellites. Previously, GeoEye had expected to launch GeoEye-2 in 2013 (Ref. 14).
• DigitalGlobe and GeoEye merged on January 31, 2013 to become one company, DigitalGlobe. On February 4, 2013, DigitalGlobe announced that its previously planned satellite construction program related to its third WorldView-class satellite remains on track. 14)
Launch: WorldView-3 was launched on August 13, 2014 (18:30:30 UTC) on an Atlas-V 401 vehicle of LMCLS (Lockheed Martin Commercial Launch Services) from VAFB, CA. 15) 16)
Orbit: Sun-synchronous orbit, altitude = 617 km, inclination = 98º, LTDN (Local Time on Descending Node) = 13:30 hours, period = 97 minutes.
Mission Status
• July 6, 2022: Scientists have used Earth observation data to reveal enormous methane plumes spilling out from an offshore oil and gas production rig in the Gulf of Mexico. 17)This represents a significant breakthrough in the monitoring of industrial methane emissions from space. The analysis – led by scientists from the Universitat Politècnica de València – drew on data from the WorldView-3 satellite, which were delivered on a free basis via ESA’s Third Party Missions (TPM) programme. It also used imagery collected by the US-led Landsat-8 mission.
- Using satellites to monitor methane emissions from offshore oil and gas infrastructure could make important contributions to climate change mitigation efforts. However, despite the rapid development of space-based methane plume detection methods over land, it remains difficult to use remote sensing missions to monitor these emissions over sea. Methane detection from space involves the use of shortwave infrared wavelengths. But the high absorption of this radiation by water limits the amount of light bouncing back to the satellite’s sensor, making it problematic to distinguish methane emissions. As part of the analysis, the researchers overcame this challenge by using an imaging mode in which the angular configuration of the satellite is adjusted.
- The initial aim of the analysis was to explore the feasibility of using WorldView-3 to monitor offshore methane plumes. 18)The satellite’s instrument – called the WorldView-110 camera – captures images in a number of spectral ranges, including eight bands of the short-wave infrared range. These data have a high resolution of 3.7 m and a high signal-to-noise ratio, which makes it a powerful mission for methane mapping.
• October 19, 2020: Scientists from NASA’s Goddard Space Flight Center in Greenbelt, Maryland, and international collaborators demonstrated a new method for mapping the location and size of trees growing outside of forests, discovering billions of trees in arid and semi-arid regions and laying the groundwork for more accurate global measurement of carbon storage on land. 19) The team mapped how tree crown diameter, coverage, and density varied depending on rainfall and land use. Both NASA and the international team used commercial satellite images from DigitalGlobe, which were high-resolution enough to spot individual trees and measure their crown size. The images came from the commercial QuickBird-2, GeoEye-1, WorldView-2, and WorldView-3 satellites.
- Mapping non-forest trees at this level of detail would take months or years with traditional analysis methods, compared to a few weeks for this study. The use of very high-resolution imagery and powerful artificial intelligence represents a technological breakthrough for mapping and measuring these trees. The dry areas lack detailed mapping concerning tree density and carbon content. They appear as white areas on maps and are essentially masked out. Traditional satellites cannot discern individual trees; they only perceive a forest as a whole. However, advanced equipment like Worldview-3 can capture more detailed images, enabling accurate mapping of these regions, including isolated trees.. 20)
• August 5, 2020: All three of Maxar’s WorldView-class satellites (WorldView-1, WorldView-2 and WorldView-3) collected high resolution images of Beirut on August 5th, following the explosion at the city’s port. 21)
• August 27, 2019: Maxar Technologies, the corporation that owns Digitalglobe, announced that it had been awarded a new, four-year contract with the U.S. National Geospatial-Intelligence Agency (NGA) for the Global EGD ( Enhanced GEOINT Delivery) program. The contract, which begins September 1, 2019, is valued at $44 million for the base year and includes three option years at the same value that would extend the contract through August 2023. This allows them to continue providing approximately a quarter million U.S. Government users with online and offline, on-demand access to high resolution commercial satellite imagery from satellites such as Worldview-3. 22)
• October 11, 2017: DigitalGlobe has released high-resolution satellite images of the wildfires burning in Northern California. This imagery shows the fires in Santa Rosa, California, area, taken on October 10 and 11, 2017. 23)The October 10 images were collected using the SWIR (Shortwave Infrared) sensor on DigitalGlobe’s WorldView-3 satellite, which was able to pierce through the wildfire smoke to see where the fires were burning on the ground. For comparison, the ground and the fire line are completely obstructed by smoke in the natural color image of the same area.
• May 4, 2017: Scientists have started counting individual birds from space. They are using the highest-resolution satellite images available to gauge the numbers of Northern Royal albatrosses. The audit, led by experts at the BAS (British Antarctic Survey), represents the first time any species on Earth has had its entire global population assessed from orbit. 27) 28) Ordinarily, these birds are very difficult to appraise because their nesting sites are so inaccessible. In March 2015, the U.S. Congress relaxed restrictions on the spatial resolution of commercial satellite imagery from 50 to 30 cm, ushering in a new era of super-high resolution optical satellite imagery for scientific and other applications. The threshold size of objects that can be seen from space is now much smaller, and the definition and the reliability with which they can be discriminated are much improved. This more than doubles the potential density of pixels from 4 pixels/m2 (for a 50 cm resolution image) to 10.4 pixels/m2 (31 cm resolution). For wildlife applications, there are therefore now more species for which individual animals are potentially visible, or can be visualized at considerably higher definition by satellite.
- Accuracy of satellite remote-sensing of great albatrosses: The count of apparently occupied sites from the WorldView-3 satellite imagery of Bird Island provided a reasonable match with the number of Wandering Albatross nests in which eggs were laid, based on ground counts. Based on the oblique digital photographs, the expected number of individuals in the satellite image was 754 x 1.111 = 837.7 birds, which is 6.5% lower than the number of AOSs counted from the satellite image.
• September 30, 2016: DigitalGlobe's online Basemap Suite has achieved a significant milestone, offering more than 250 million km2 of high-resolution 30 cm commercial satellite imagery. This includes over 500 population centers in the Basemap +Metro product now available at 30 cm resolution and 1,700 cities available at 50 cm or better resolution. In total, the Basemap Suite now features 1.5 billion km2 of high-accuracy, high-resolution imagery. 29)
• June 23, 2016: The WorldView-1/-2/-3, GeoEye-1 and QuickBird mission archive and new acquisitions are now available for research and application development.The products can be made available for free upon project proposal submission via the WorldView, GeoEye-1, and QuickBird information areas on ESA's Earth Online Portal. 30)
• May 2016: WorldView-3 geolocation accuracy: A study of NGA was presented at JACIE 2016 describing the WorldView-3 geolocation accuracy. Metric Design and Internal Geometric Calibration involved a GPS receiver on-board used to determine orbital position. Inertial Reference Units and Star Trackers used to determine pointing direction. Sensor and its relationship to GPS and star trackers are highly calibrated.31) 32)
Sample size of 27 WorldView-3 Basic 1B Mono Images (Physical Model) |
| ||
| Sample Mono HE90 (m) | Confidence Statements | Nominal Nadir Pixels |
Panchromatic | 2.8 | >94% confidence that True CE90 <3.8 m | 9.0 |
8-Band MSI | 3.5 | >94% confidence that True CE90 <5.0 m | 2.8 |
8-Band SWIR | 5.9 | >94% confidence that True CE90 <7.6 m | 1.6 |
| |||
Sample size of 27 WorldView-3 Basic 1B Mono Images, RPC(Rational Polynomial Coefficients) |
| ||
| Sample Mono HE90 (m) | Confidence Statements | Nominal Nadir Pixels |
Panchromatic | 2.9 | >94% confidence that True CE90 <3.7 m | 9.4 |
8-Band MSI | 3.2 | >94% confidence that True CE90 <4.5 m | 2.6 |
8-Band SWIR | 4.6 | >94% confidence that True CE90 <6.1 m | 1.2 |
Same 217 points measured in Pan, MSI, and SWIR images. Images related using Basic 1B photogrammetric sensor models.
| Physical Model RMSE (Root Mean Square Error) | RPC (Rational Polynomial Coefficients) RMSE |
MSI- Panchromatic | 1.6 m (1.3 pixels) | 1.2 m (0.9 pixels) |
SWIR - Panchromatic | 4.3 m (1.2 pixels) | 3.3 m (0.9 pixels) |
SWIR - MSI | 3.3 m (0.9 pixels) | 2.7 m (0.7 pixels) |
- To summarise the accuracy study there were 217 measured points on 27 Basic 1B images. Absolute geolocation accuracy (no ground control points) measured: Panchromatic: 2.8-2.9 meters HE90 (Horizontal Error 90%), 8-Band MSI: 3.2-3.5 meters HE90, 8-Band SWIR: 4.6-5.9 meters HE90. Error propagation and sensor co-registration results are reasonable and the RPC (Rational Polynomial Coefficients) fits Physical Model within 1 to 1.5 pixels. Band-to-Band co-registration monitored SWIR bands within 0.35 pixels and CAVIS bands within 0.25 pixels.
• August 13, 2015: One year prior, WorldView-3 successfully launched into orbit, one of the first super-spectral, high-resolution commercial satellites. With 30 cm panchromatic resolution that collects five times more data than 70 cm imagery, SWIR (Shortwave Infrared) bands allowed for accurate imaging through haze, fog, dust, smoke and other airborne particles; and eight multispectral bands. 33) WorldView-3 enabled DigitalGlobe to contribute to disaster and humanitarian relief efforts and support commercial applications
- During the 7.8 magnitude earthquake that struck central Nepal on April 25, 2015, the multispectral imagery captured by WorldView-3 was made freely available online along with pre-event imagery to aid in the global crisis response. DigitalGlobe also collaborated with WRI (World Resources Institute) to map burn scars from the rash of fires that began on May 29, 2015, in Indonesia’s Tesso Nilo National Park. WorldView-3’s 30 cm resolution and SWIR technology enabled WRI to more accurately determine the extent of land affected by forest and bush fires as well as the degree of illegal encroachment on the protected park.
- WorldView-3’s CAVIS sensor offers the capability to improve imagery by compensating for conditions – clouds, aerosol, vapor, ice and snow. When CAVIS data is collected, it can improve the accuracy of WorldView-3’s surface reflectance, improving image quality with better colors and more consistency. A research paper published in the Journal of Applied Remote Sensing in May 2015 confirmed WorldView-3’s eight SWIR bands provide extensive new mineral mapping capabilities. Using the SWIR sensor, WorldView-3 offers more accurate information for geology, mining, agriculture and many other applications. 34) Subscription-based solutions like GBDX, powered by higher quality information from WorldView-3, are driving innovation in commercial applications. This includes monitoring pipelines, forecasting big data commodities, and automated feature extraction. Additionally, WorldView-3's various spectral bands and 30 cm imagery enable civil governments to gather valuable data for crop inventory and health assessment in specific regions. This information aids government officials in making informed decisions regarding policy and food security.
Sample size of 33 WorldView-3 Basic 1B Stereo Pairs PM (Physical Sensor Model) | ||
Sample Mono HE90 (Horizontal Error 90%) | 3.8 m | > 96% confidence that True CE90 < 4.1 m |
Sample Stereo HE90 | 3.7 m | > 96% confidence that True CE90 < 4.3 m |
Sample Stereo VE90 (Vertical Error 90%) | 2.7 m | > 96% confidence that True LE90 < 5.0 m |
| ||
Sample size of 33 WorldView-3 Basic 1B Stereo Pairs RPC (Rational Polynominal Coefficient Model) | ||
Sample Mono HE90 | 3.9 m | > 96% confidence that True CE90 < 4.1 m |
Sample Stereo HE90 | 3.8 m | > 96% confidence that True CE90 < 3.9 m |
Sample Stereo VE90 | 2.7 m | > 96% confidence that True LE90 < 6.3 m |
• April 29, 2015, DigitalGlobe released the initial results from the Tomnod crowdsourcing campaign in response to the earthquake that struck Nepal on April 25. The damage mapping campaign would continue, and volunteers were encouraged to visit the Tomnod website to contribute their time and efforts. 38)
• April 26, 2015: In response to the devastating 7.8 magnitude earthquake that struck central Nepal on April 25, DigitalGlobe made high resolution satellite imagery of the affected areas freely available online to all groups involved in the response and recovery effort.
- DigitalGlobe activated FirstLook, the subscription service that provides emergency management and humanitarian workers with fast, web-based access to pre- and post-event images of the impacted area. DigitalGlobe captured imagery of the area through heavy cloud cover with its WorldView-1, WorldView-2, WorldView-3, and GeoEye-1 satellites. In addition, DigitalGlobe activated Tomnod, a crowdsourcing platform that allowed web-connected volunteers around the globe to help disaster response teams by mapping damage from this earthquake. This covered for the weaknesses in the satellite imagery.
• March 3, 2015: DigitalGlobe announced that they would be selling the new 30 cm imagery to customers. Until then it was illegal for US companies to sell satellite imagery at that resolution. Aerial imagery is typically of similar or higher resolution and is not subject to that restriction, but for global coverage and bulk image capturing satellites appear more cost effective. 39)
• February 25, 2015: DigitalGlobe made an announcement about the complete availability of their 30 cm satellite imagery products. It marked an industry milestone, as it built upon the quality of the company's images and their resolution standards. By providing access to the higher resolution commercial satellite imagery captured by their WorldView-3 satellite, customers in various sectors, including civil government, defense and intelligence, energy, mining, and global development, could benefit from the imagery. The wide variety of uses could lead to improved operational efficiency and cost management, more effective disaster planning and recovery, a better customer experience in consumer-facing, map-centric market segments, and more efficient humanitarian assistance. 40) 41)
• October 30, 2014: WorldView-3’s super-spectral 30 cm imagery allows for fast and precise mapping of various features globally.
• September 3, 2014: The integration of the eight SWIR (Shortwave Infrared) bands into the super-spectral WV-3 imager provides a new observation quality to DigitalGlobe’s WorldView-3 spacecraft. It permits the capture of high-resolution imagery through a thick cloud of smoke of an active forest fire, marking the first time this capability has been commercially available from a satellite platform. Figure 21 shows an active fire beneath a thick cloud of smoke in California’s Klamath National Forest. The SWIR bands penetrate smoke to differing degrees. Hot spots are clearly visible even without being shown at full resolution. 44) 45)• August 21, 2014, the DigitalGlobe team completed the focusing and achieved IOC (Initial Operational Capability) on the entire suite of WorldView-3’s super-spectral bands. 46)
• August 19, 2014, six days after launch, the DigitalGlobe team completed commissioning of the satellite bus and opened the door on the main telescope to begin observing the changing planet. DigitalGlobe formally notified NOAA of WorldView-3’s IOC, which means that beginning on February 21, 2015, the company will be able to deliver 30 cm imagery to all its customers. In the meantime, DigitalGlobe will make 40 cm panchromatic and 1.6 m multispectral data available to its customers when WorldView-3 completes its validation and testing. They are sharing imagery that has been re-sampled to 40 cm, with the compressed “jpg" images available at https://app.box.com/s/ahcvedf8f1c44bg74nl8
Sensor Complement
WV-3 Imager
The WV-3 Imager, including the SWIR sensor and optics, was designed and built by ITT Exelis. The telescope primary mirror features an aperture diameter of 110 cm. In total, the WV-3 imager has 29 spectral bands including a panchromatic band, eight multispectral bands, 8 shortwave infrared bands and 12 CAVIS bands (Table 7). Scanning technique: pushbroom with a 35,000 pixel dectector array for PAN and a 9,300 pixel detector array for multispectral bands. Note: The WV-3 Imager is also referred to as WV110 (same camera as in WorldView-2).
- In September 2010, Exelis was selected to build the imaging system, which will include a sensor subsystem and an optical telescope unit, for DigitalGlobe's WorldView-3 spacecraft.
- The CDR (Critical Design Review) for the imaging payload of WorldView-3 was completed on April 14, 2011.
- In Sept. 2013, Exelis delivered an integrated, super-spectral payload consisting of a telescope, sensor and shortwave infrared system for the WorldView-3 satellite. 47)
Note: On October 31, 2011, ITT Corporation spun off its defense and water technology businesses to form three separate, publicly-traded companies: 48)
1) Xylem Inc., a water technology and services company headquartered in White Plains, NY.
2) Exelis Inc. (or ITT Exelis), a defense technology business headquartered in Tysons Corner, VA. ITT Exelis Geospatial Systems of Rochester, N.Y., is supplying the sensor complement of WorldView-3.
3) ITT Corporation, a global manufacturing company headquartered in White Plains, NY.
Note: In May 2015, Harris Corp. of Melbourne, FL. acquired Exelis Inc. of Fort Wayne, IN. 49)
Exelis has designed and built imaging systems for each of DigitalGlobe’s current satellite constellation, including WorldView-1, WorldView-2, Ikonos-2, GeoEye-1, GeoEye-2 and QuickBird.
WorldView-3 combines the most productive high resolution commercial sensor subsystem available with a highly accurate and stable optical telescope unit. In addition of offering 0.31 m resolution panchromatic and 8-band MS imagery, WorldView -3 was licensed by NOAA to collect 8-band SWIR (Shortwave Infrared) imagery. This will make DigitalGlobe the only company with multiband SWIR capabilities, greatly expanding the range of customer applications enabled by the DigitalGlobe constellation. 50) 51) 52)
The WV-3 imager achieves a ground resolution of 31 cm in the panchromatic band at nadir, 1.24 m in the multispectral bands, 3.7 m in the SWIR range and 30 m for CAVIS. Off-nadir resolutions (20°) are 0.34 m for PAN, 1.38 m for MS and 4.1 m for SWIR.
WorldView-3 covers a ground swath of 13.1 km, supporting multiple swath imaging for mosaic image creation and stereo imaging. The satellite can acquire five strips to create an image of an area of 66.5 km x 112 km in a single pass. For stereo imaging, two pairs of images, measuring 26.6 km x by 112 km, can be acquired in one pass. With its high agility, WorldView-3 delivers a revisit time of under one day for any given location on Earth with a 1 m ground resolution or better. Revisit times for an off-nadir angle of 20º or less is on the order of 4.5 days.
Spectral range | Band name | Spectral band | GSD (Ground Sample Distance) |
Panchromatic band (1) | 450 - 800 nm | Nadir: 0.31 m, 20º off-nadir: 0.34 m | |
MS (Multispectral) bands (8) | Coastal Blue | 400 - 450 nm | Nadir: 1.24 m |
Blue | 450 - 510 nm | ||
Green | 510 - 580 nm | ||
Yellow | 585 - 625 nm | ||
Red | 630 - 690 nm | ||
Red edge | 705 - 745 nm | ||
Near-IR1 | 770 - 895 nm | ||
Near-IR2 | 860 - 1040 nm | ||
Multiband (8 bands) in SWIR | SWIR-1 | 1195 - 1225 nm | Nadir: 3.70 m |
SWIR-2 | 1550 - 1590 nm | ||
SWIR-3 | 1640 - 1680 nm | ||
SWIR-4 | 1710 - 1750 nm | ||
SWIR-5 | 2145 - 2185 nm | ||
SWIR-6 | 2185 - 2225 nm | ||
SWIR-7 | 2235 - 2285 nm | ||
SWIR-8 | 2295 - 2365 nm | ||
|
|
|
|
CAVIS bands (12) | Desert clouds | 405 - 420 nm | Nadir: 30 m |
Aerosols-1 | 459 - 509 nm | ||
Green | 525 - 585 nm | ||
Aerosols-2 | 620 - 670 nm | ||
Water-1 | 845 - 885 nm | ||
Water-2 | 897 - 927 nm | ||
Water-3 | 930 - 965 nm | ||
NDVI-SWIR | 1220 - 1252 nm | ||
Cirrus | 1350 - 1410 nm | ||
Snow | 1620 - 1680 nm | ||
Aerosol-3 | 2105 - 2245 nm | ||
Aerosol-3 | 2105 - 2245 nm | ||
Data quantization | 11 bit/pixel Pan and MS; 14 bit/pixel SWIR | ||
Swath width | 13.1 km | ||
Revisit frequency | 1 m GSD: < 1.0 day | ||
Geolocation accuracy | < 3.0 m CE90 (Circular Error of 90%) | ||
The WV-3 imager allows to observe a much wider range of the electromagnetic spectra than most other commercial satellites, and will allow the data user to start looking for the individual spectral signatures of materials. Figure 23 shows the spectral signatures of three minerals. The light blue regions on the plot denote the VNIR bands covered by WV-2 and WV-3. The light red regions denote the SWIR bands covered by the 8 new WV-3 bands. This shows just how much further the new bands penetrate into the electromagnetic spectrum. The spectral profiles of each pixel in an image can be compared to a spectral library (such as the reflectance spectra shown) to classify what material is contained within that pixel. 53)
This type of automated spectral classification is commonly carried out in ENVI (Environmental Monitoring) with hyperspectral data (from satellites containing hundreds of spectral bands) which can sometimes be costly to acquire. However, the ability to remotely monitor materials is invaluable to a great number of industries for example in forestry applications where we see users wanting to monitor tree health and pest infestation in remote regions. WorldView-3 brings a limited version of this capability to users at a reduced price, so one still can't expect the accuracy of a hyperspectral satellite, but it really is a step beyond the features we could extract from multispectral data. Digital Globe’s marketing refers to this observation scheme as ‘super-spectral’.
CAVIS ( Clouds, Aerosols, Vapors, Ice, and Snow)
The CAVIS imager is provided by BATC (Ball Aerospace and Technologies Corporation). The objective of CAVIS is to monitor the atmosphere and provide correction data to improve WorldView-3's high-resolution imagery when it images Earth objects through haze, soot, dust or other obscurants. The CAVIS imager has standalone optics and a focal-plane package, it features a resolution of 30 m.
The CAVIS instrument brings an unprecedented level of consistency in data, paving the way to standardization of satellite imagery. CAVIS corrects for the inconsistencies caused by certain conditions, offering standardized imagery no matter where or when the data was captured. This standardization will introduce a new age of automated information extraction and feature detection.
CAVIS performance parameters: 55)
• Image simultaneous with main instrument
• 7 VNIR + 5 SWIR bands
• 30 m resolution
• Swath is slightly wider than main instrument.
DigitalGlobe developed a fully automated framework for atmospherically compensating very high spatial resolution imagery from QB (QuickBird), WV1 (WorldView-1), and WV2 (WorldView-2).
This technology [DG-AComp (DigitalGlobe-Automatic Compensation)] has several advantages:
• enables the extraction of information using physical quantities, not just scene statistics (“surface reflectance” vs. “DN counts”)
• enables the extraction of information using physical quantities, not just scene statistics (“surface reflectance” vs. “DN counts”)
• facilitates cross-sensor processing
• fast processing via HPC (High Performance Computing).
Validation:
- DG-AComp results are compared to in-situ measurements, and to two commercially available techniques, such as QUAC (Quick Atmospheric Correction) and FLAASH (Fast Line-of-sight Atmospheric Analysis of Spectral Hypercubes).
- QUAC is a fully automated method (as DG-AComp), and this represents the baseline to compare DG-AComp with.
- FLAASH requires the knowledge of atmospheric components (aerosol, water vapor, etc.), and it represents one of the most accurate method currently available. In this presentation, the atmospheric values automatically retrieved by DG-AComp are used as inputs to drive FLAASH.
References
1) “DigitalGlobe Secures $3.55 Billion EnhancedView Agreement with National Geospatial Intelligence Agency (NGA),” August, 9, 2010, URL: http://media.digitalglobe.com/index.php?s=43&item=225
2) Warren Fester, “DigitalGlobe Adding Infrared Capability to WorldView-3 Satellite,” Space News, April 17, 2012, URL: http://spacenews.com/earth_observation/120417-digitalglobe-adding-ir-worldview3.html
3) “DigitalGlobe Unveils New Details of WorldView-3 Satellite,” Space Daily, April 24, 2012, URL: http://www.spacedaily.com/reports/DigitalGlobe_Unveils_New_Details_of_WorldView_3_Satellite_999.html
4) WorldView-3,” DigitalGlobe Data Sheet, URL: https://web.archive.org/web/20130116094939/https://www.digitalglobe.com/downloads/WorldView3-DS-WV3-Web.pdf
5) “WorldView-3 Satellite Sensor,” Satellite Imaging Corporation, URL: http://www.satimagingcorp.com/satellite-sensors/worldview-3.html
6) “Ball Aerospace and ITT Corporation to Construct Company’s Fourth Digital Imagery Satellite,” August 30, 2010, URL: http://media.digitalglobe.com/index.php?s=43&item=228
7) Peter B. de Selding, “DigitalGlobe Awards $307 M in Contracts for WorldView-3 Satellite,” Space News, Sept. 6, 2010, p. 6
8) “Ball Aerospace Begins Integration Phase for DigitalGlobe's WorldView-3 Satellite,” BATC News Release, April 8, 2013, URL: http://www.ballaerospace.com/page.jsp?page=30&id=525
9) http://www.ballaerospace.com/page.jsp?page=294
10) “Ball Aerospace Completes Integration of WorldView-3 Spacecraft,” PR Newswire, Jan. 27, 2014, URL: http://www.prnewswire.com/news-releases/ball-aerospace-completes-integration-of-worldview-3-spacecraft-242192151.html
11) “DigitalGlobe—Accelerating The Launch + A Name Change (Satellite—Launch Preparations),” Satnews Daily, August 1, 2014, URL: http://www.satnews.com/story.php?number=2018960113#
12) “WorldView-3 Remote Sensing Spacecraft Arrives at Vandenberg Air Force Base for Mid-August Launch,” BATC, June 27, 2014, URL: http://www.ballaerospace.com/page.jsp?page=30&id=596
13) “U.S. Department of Commerce Relaxes Resolution Restrictions DigitalGlobe Extends Lead in Image Quality,” DigitalGlobe, June 11, 2014, URL: [web source no longer available]
14) “DigitalGlobe's WorldView-3 Satellite Continues on Track for Mid-2014 Launch - Company Will Complete GeoEye-2 Satellite to Preserve as Ground Spare,” DigitalGlobe Press Release, Feb. 4, 2013, URL: [web source no longer available]
15) “United Launch Alliance Atlas V Launches WorldView-3 Satellite for DigitalGlobe,” ULA, Aug. 13, 2014, URL: http://www.ulalaunch.com/ula-atlas-v-launches-worldview3-satellite.aspx
16) Patrick Blau, “WorldView-3 successfully delivered to Orbit by Atlas V ,” Spaceflight 101, August 13, 2014, URL: http://www.spaceflight101.com/atlas-v---worldview-3-launch-updates.html
17) ”WorldView-3 helps to track offshore methane plumes from oil and gas,” ESA EOGateway News, 6 July 2022, URL: https://earth.esa.int/eogateway/news/worldview-3-helps-to-track-offshore-methane-plumes-from-oil-and-gas
18) Itziar Irakulis-Loitxate, Javier Gorroño, Daniel Zavala-Araiza, and Luis Guanter, ”Satellites Detect a Methane Ultra-emission Event from an Offshore Platform in the Gulf of Mexico,” Environmental Science & Technology Letters 2022, Vol. 9, Issue 6, pp: 520-525 (Anthropogenic Impacts on the Atmosphere), URL: https://pubs.acs.org/doi/pdf/10.1021/acs.estlett.2c00225
19) Jessica Merzdorf, ”NASA Supercomputing Study Breaks Ground for Tree Mapping, Carbon Research,” NASA Feature, 16 October 2020, URL: https://www.nasa.gov/feature/goddard/2020/nasa-supercomputing-study-breaks-ground-for-tree-mapping-carbon-research
20) Martin Brandt, Compton J. Tucker, Ankit Kariryaa, Kjeld Rasmussen, Christin Abel, Jennifer Small, Jerome Chave, Laura Vang Rasmussen, Pierre Hiernaux, Abdoul Aziz Diouf, Laurent Kergoat, Ole Mertz, Christian Igel, Fabian Gieseke, Johannes Schöning, Sizhuo Li, Katherine Melocik, Jesse Meyer, Scott Sinno, Eric Romero, Erin Glennie, Amandine Montagu, Morgane Dendoncker & Rasmus Fensholt, ”An unexpectedly large count of trees in the West African Sahara and Sahel,” Nature, Published: 14 October 2020, https://doi.org/10.1038/s41586-020-2824-5
21) ”Maxar’s WorldView Satellites Reveal The Before + After Of Beirut Explosion,” Satnews, 5 August 2020, URL: https://news.satnews.com/2020/08/05/maxars-worldview-satellites-reveal-the-before-after-of-beirut-explosion/
22) ”Maxar Technologies Awarded Four-Year Global EGD Contract by the U.S. Government for On-Demand Access to Mission-Ready Satellite Imagery,” Maxar Press Release, 27 August 2019, URL: http://investor.maxar.com/investor-news/press-release-details/2019/Maxar-Technologies-Awarded-Four-Year-Global-EGD-Contract-by-the-US-Government-for-On-Demand-Access-to-Mission-Ready-Satellite-Imagery/default.aspx
23) ”Northern California Firestorm Imagery Captured by DigitalGlobe's WorldView-3 and GeoEye-1 Satellites,” Satnews Daily, Oct. 11, 2017, URL: http://www.satnews.com/story.php?number=1629667837
24) ”DGI imagery- Northern California Wildfires,” URL: https://edelmanftp.app.box.com/s/vq5h4noaj9tz09ucvhda635xeosgrmyy/file/237059153795
25) ”MDA Completes Acquisition of DigitalGlobe, Creates Industry Leader in Satellite Systems, Earth Imagery, Geospatial Solutions and Analytics,” MDA Press Release, Oct. 5, 2017. URL: https://mdacorporation.com/news/pr/pr2017100509.html
26) Henry Caleb, ”MDA closes DigitalGlobe merger, rebrands as Maxar Technologies,” Space News, Oct. 5, 2017, URL: http://spacenews.com/mda-closes-digitalglobe-merger-rebrands-as-maxar-technologies/
27) Jonathan Amos, ”Albatrosses counted from space,” BBC, 4 May 2017, URL: http://www.bbc.com/news/science-environment-39797373
28) Peter T. Fretwell, Paul Scofield, Richard A. Phillips, ”Using super-high resolution satellite imagery to census threatened albatrosses,” Ibis, 3 May 2017, DOI: 10.1111/ibi.12482, URL: http://onlinelibrary.wiley.com/doi/10.1111/ibi.12482/full
29) ”DG's Basemap expanded to include 250M square kilometers at 30cm,” Space Daily, Sept. 30, 2016, URL: http://www.spacedaily.com/reports/DigitalGlobes_Basemap_Suite_Expands_to_Include_250_Million_Square_Kilometers_of_30_cm_Imagery_999.html
30) ”WorldView-1/-2/-3, GeoEye-1 and QuickBird data available,” ESA User Services News, June 23, 2016, URL: https://web.archive.org/web/20161216095937/https://earth.esa.int/web/guest/missions/user-services-news/-/article/worldview-1-2-3-geoeye-1-and-quickbird-data-available
31) Paul Bresnahan, Robert Powers, Luis HenryVazquez, ”WorldView-3 Geolocation Accuracy and Band Co-Registration Analysis,” 15th JACIE (Joint Agency Commercial Imagery Evaluation) Workshop, co-located with ASPRS Imaging and Geospatial Technology Forum, Fort Worth, Texas, USA, April 12-14, 2016, URL: https://calval.cr.usgs.gov/wordpress/wp-content/uploads/WV03-JACIE-2016-Approved-for-Public-Release-16-232.pdf
32) Chris Comp, David Mulawa, Nancy Podger, Bill Baugh, ”DigitalGlobe WorldView-3 SWIR Instrument Calibration and Applications,” 15th JACIE (Joint Agency Commercial Imagery Evaluation) Workshop, co-located with ASPRS Imaging and Geospatial Technology Forum, Fort Worth, Texas, USA, April 12-14, 2016, URL: https://calval.cr.usgs.gov/wordpress/wp-content/uploads/JACIE_2016_COMP_20160421_FINAL.pdf
33) Tim Hascall, ”Celebrating WorldView-3’s first year in orbit,” DigitalGlobe, Aug. 14, 2015, URL: https://web.archive.org/web/20160608201100/www.digitalglobeblog.com/2015/08/14/celebrating-worldview-3s-first-year-in-orbit/
34) Fred A. Kruse, William M. Baugh, Sandra L. Perry, ”Validation of DigitalGlobe WorldView-3 Earth imaging satellite shortwave infrared bands for mineral mapping,” Journal of Applied Remote Sensing, Volume 9, Issue 1, 'Remote Sensing Applications and Decision Support,' May 27, 2015. doi:10.1117/1.JRS.9.096044, URL: http://remotesensing.spiedigitallibrary.org/article.aspx?articleid=2300382
35) http://www.euspaceimaging.com/satellites
36) Paul Bresnahan, Evan Brown, Luis Henry Vazquez, ”WorldView-3 Absolute Geolocation Accuracy Evaluation,” NGA (National Geospatial-Intelligence Agency), 14th JACIE (Joint Agency Commercial Imagery Evaluation) Workshop, Tampa, FL, USA, May 5-7, 2015, URL: https://calval.cr.usgs.gov/wordpress/wp-content/uploads/15-349-WorldView-3-Absolute-Geolocation-Accuracy-Evaluation-JACIE2015.pdf
37) “DigitalGlobe opens access to satellite data to support disaster response efforts in Nepal,” DigitalGlobe, April 26, 2015, URL: https://blog.maxar.com/open-data-program/2015/digitalglobe-opens-access-to-satellite-data-to-support-disaster-response-efforts-in-nepal
38) “DigitalGlobe releases preliminary Nepal earthquake crowdsourcing results,” DigitalGlobe, April 29, 2015, URL: https://web.archive.org/web/20170204090745/http://blog.digitalglobe.com/2015/04/29/digitalglobe-releases-preliminary-nepal-earthquake-crowdsourcing-results/
39) ”DigitalGlobe now selling 30cm imagery,” Google Earth Blog,, March 3, 2015, URL: http://www.gearthblog.com/blog/archives/2015/03/digital-globe-now-selling-30cm-imagery.html
40) “DigitalGlobe Announces Availability of 30 cm Satellite Imagery to All Customers,” DigitalGlobe, Feb. 25, 2015, URL: [web source no longer available]
41) “30 cm imagery is here!,” DigitalGlobe, URL: https://web.archive.org/web/20220809130119/https://microsites.digitalglobe.com/30cm/
42) “Top Satellite Image of 2014 is a Gem for Geologists!,” DigitalGlobe, Jan. 9, 2015, URL: https://web.archive.org/web/20190226224243/http://blog.digitalglobe.com/news/top-satellite-image-of-2014-is-a-gem-for-geologists/
43) DigitalGlobe Unveils 30 cm Imagery from WorldView-3,” Digital Globe, Oct. 30, 2014, URL: https://web.archive.org/web/20160406223119/www.digitalglobeblog.com/2014/10/30/digitalglobe-unveils-30-cm-imagery-from-worldview-3/
44) “Seeing a Better World™ - Revealing the Hidden World with Shortwave Infrared (SWIR) Imagery,” Digital Globe, Sept. 3, 2014, URL: https://web.archive.org/web/20200129210143/http://blog.digitalglobe.com/technologies/revealing-the-hidden-world-with-shortwave-infrared-swir-imagery/
45) “Exelis—WorldView-3 Sees Through The Smoke, Thanks To SWIR (Imagery),” Satnews Daily, Sept. 24, 2014, URL: http://www.satnews.com/story.php?number=1579958507#
46) “WorldView-3: First Images!,” DigitalGlobe, August 26, 2014, URL: https://blog.maxar.com/
47) “Exelis delivers first-of-its-kind commercial payload to DigitalGlobe for WorldView-3 satellite,” Exelis, Sept. 10, 2013, URL: [web source no longer available]
48) Irene Lockwood, “ITT’s Commercial Imaging Payload Passes Major Milestone,” ITT Press Release, April 14, 2011, URL: https://web.archive.org/web/20160414211513/www.exelisinc.com/news/pressreleases/Documents/Archived%20Press%20Releases/2011/news_2011-04-14.pdf
49) ”Harris Corporation Completes Acquisition of Exelis,” Press Release, May 29, 2015, URL: https://web.archive.org/web/20151229112503/www.exelisinc.com/news/pressreleases/Pages/Harris-Corporation-Completes-Acquisition-of-Exelis.aspx
50) http://www.satimagingcorp.com/satellite-sensors/WorldView3-DS-WV3-Web.pdf
51) Giovanni Marchisio, “An Overview of the WorldView-3 Sensor,” Geospatial World Forum, Geneva Switzerland, May 5-9, 2014, URL: http://www.geospatialworldforum.org/2014/presentation/Sensors/WGF%202014b%20-%20Giovanni%20Marchisio%20-%20DigitalGlobe_PDF.pdf
52) ”WorldView-3 Data Sheet,” DigitalGlobe, URL: https://web.archive.org/web/20170221044017/http://global.digitalglobe.com/sites/default/files/DG_WorldView3_DS_forWeb_0.pdf
53) “What can we look forward to from WorldView-3,” Exelis, April 2, 2014, URL: https://web.archive.org/web/20160702064231/http://www.harrisgeospatial.com/Learn/Blogs/TabId/836/ArtMID/2928/ArticleID/13879/What-can-we-look-forward-to-from-WorldView-3.aspx
54) Chris Comp, David Mulawa, ”WorldView-3 Geometric Calibration,” 14th JACIE (Joint Agency Commercial Imagery Evaluation) Workshop, Tampa, FL, USA, May 5-7, 2015, URL: https://calval.cr.usgs.gov/wordpress/wp-content/uploads/JACIE_2015_COMP_final2.pdf
55) Fabio Pacifici, “An automatic atmospheric compensation algorithm for very high spatial resolution imagery .. and its comparison to FLAASH and QUAC,” URL: https://calval.cr.usgs.gov/wordpress/wp-content/uploads/pacifici1.pdf
Spacecraft Launch Mission Status Sensor Complement References Back to top