EnviSat (Environmental Satellite)
EO
ESA
Atmosphere
Ocean
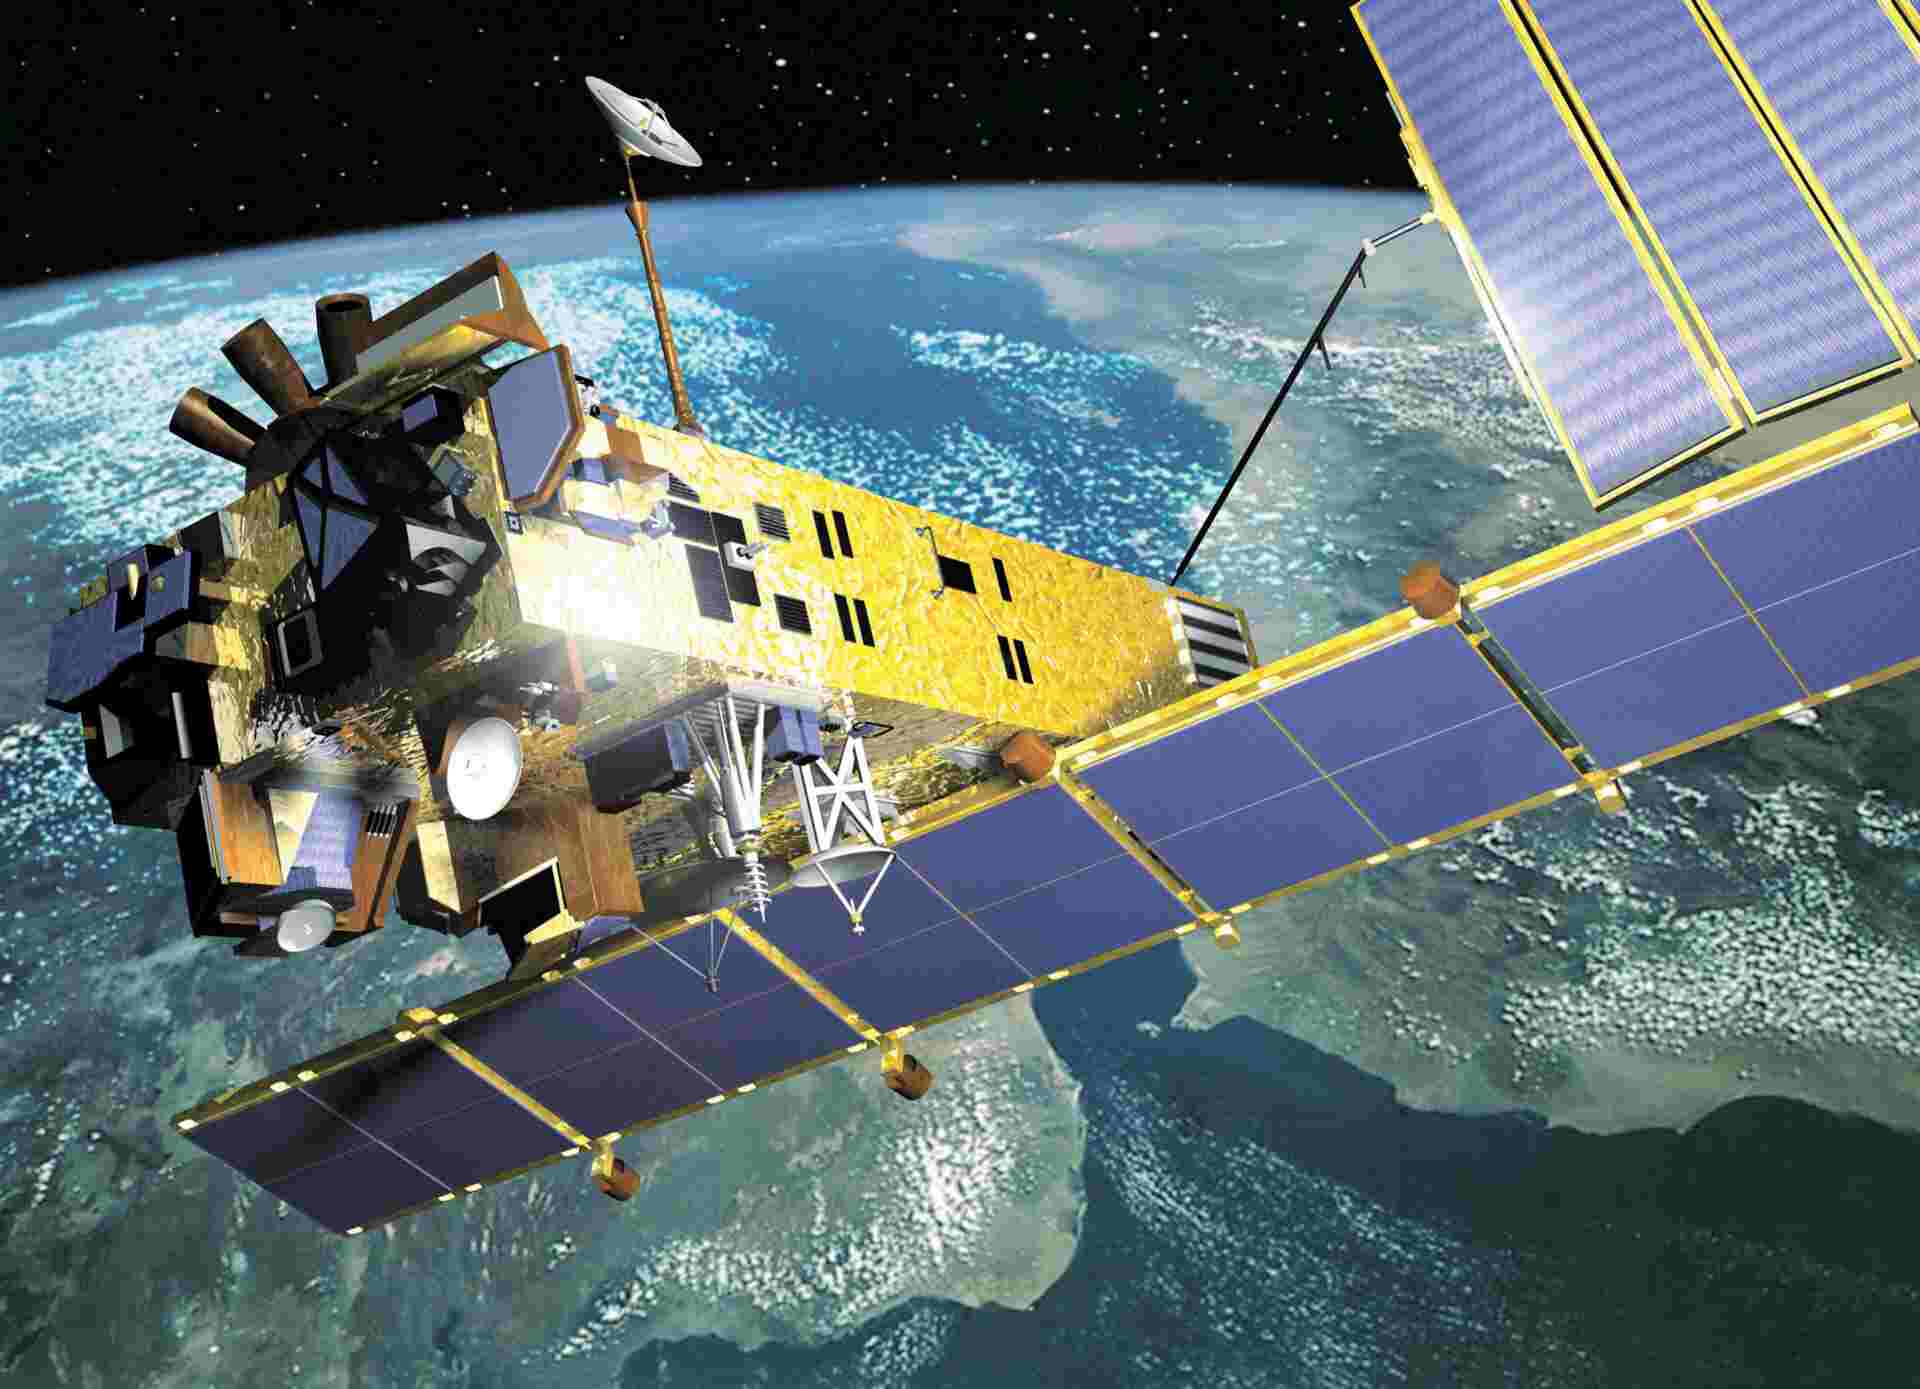
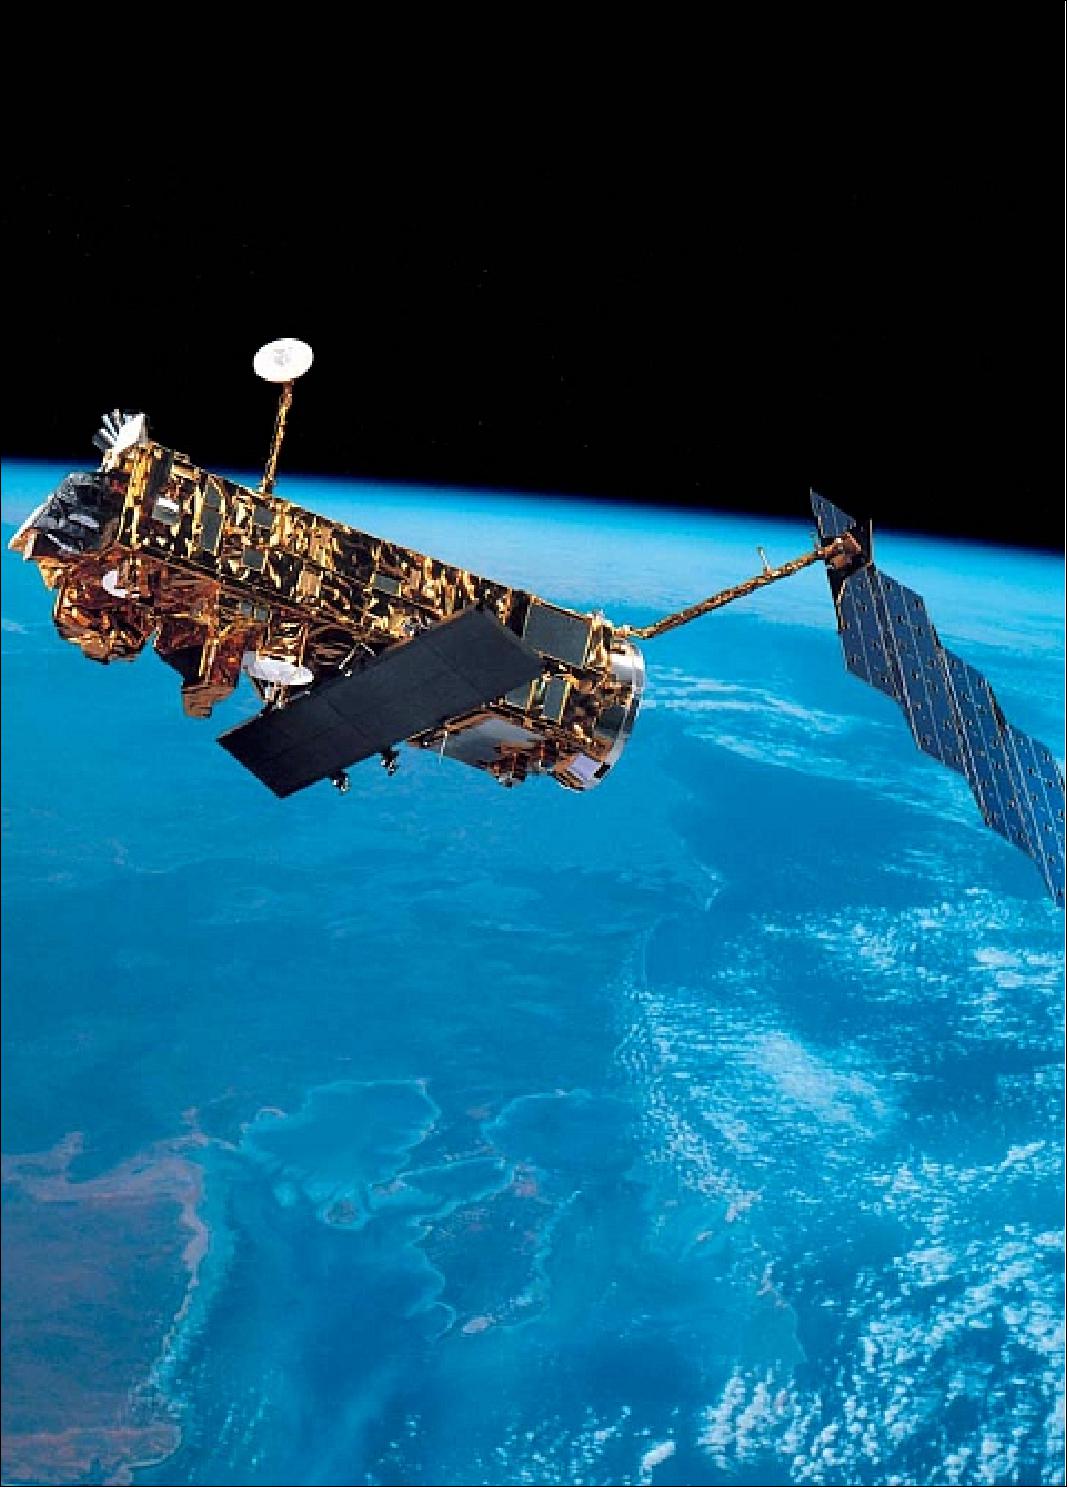
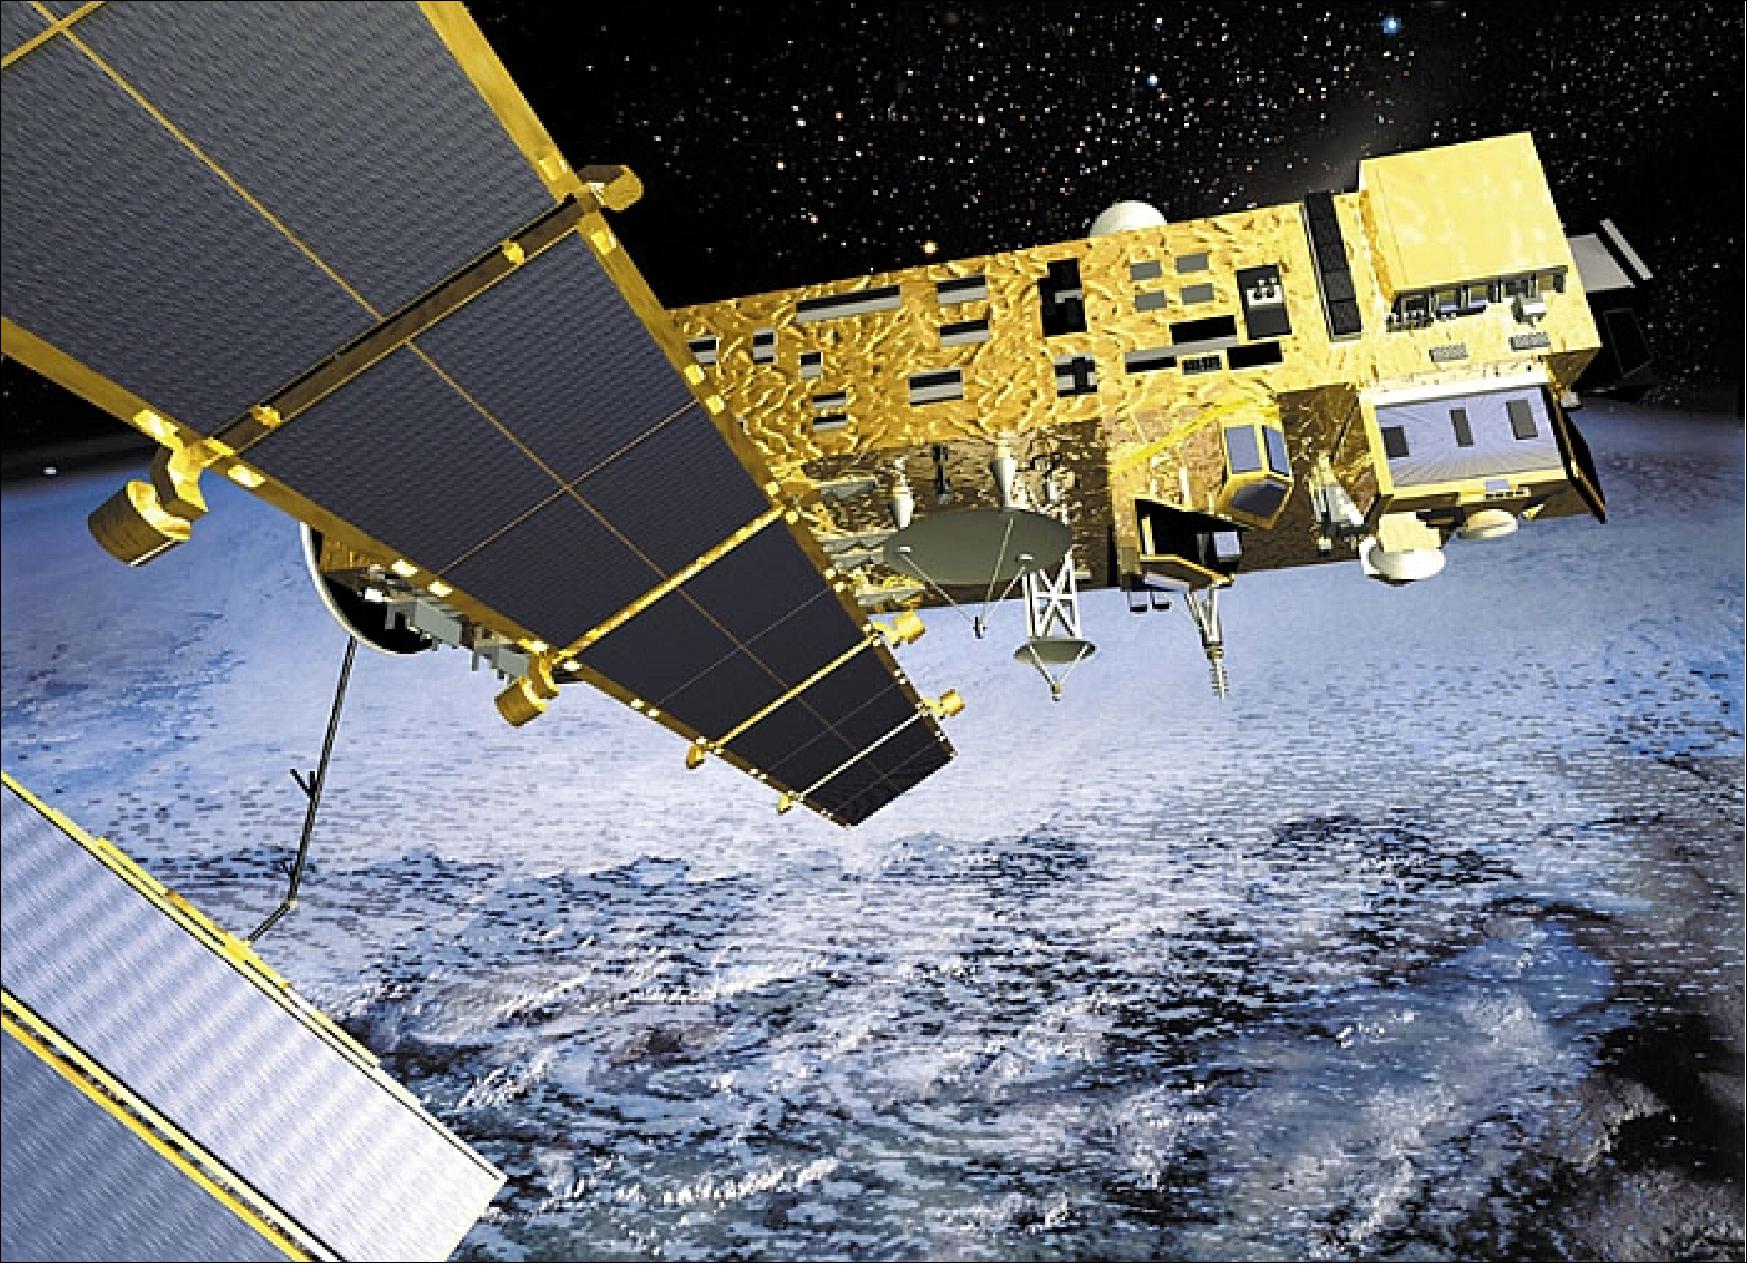
EnviSat was a satellite mission monitoring Earth’s environment. EnviSat application areas included meteorology, climatology, environment, atmospheric chemistry, vegetation, hydrology, land use, and ocean and ice processes.
Quick facts
Overview
| Mission type | EO |
| Agency | ESA |
| Mission status | Mission complete |
| Launch date | 01 Mar 2002 |
| End of life date | 08 Apr 2012 |
| Measurement domain | Atmosphere, Ocean, Land, Gravity and Magnetic Fields, Snow & Ice |
| Measurement category | Cloud type, amount and cloud top temperature, Atmospheric Temperature Fields, Cloud particle properties and profile, Ocean colour/biology, Aerosols, Multi-purpose imagery (ocean), Radiation budget, Multi-purpose imagery (land), Surface temperature (land), Vegetation, Albedo and reflectance, Gravity, Magnetic and Geodynamic measurements, Surface temperature (ocean), Atmospheric Humidity Fields, Ozone, Trace gases (excluding ozone), Landscape topography, Ocean topography/currents, Sea ice cover, edge and thickness, Soil moisture, Snow cover, edge and depth, Ocean surface winds, Ocean wave height and spectrum, Ice sheet topography |
| Measurement detailed | Cloud top height, Ocean imagery and water leaving spectral radiance, Aerosol absorption optical depth (column/profile), Ocean chlorophyll concentration, Cloud optical depth, Aerosol optical depth (column/profile), Cloud type, Color dissolved organic matter (CDOM), Cloud imagery, Aerosol Extinction / Backscatter (column/profile), Cloud liquid water (column/profile), Land surface imagery, Vegetation type, Earth surface albedo, Short-wave Earth surface bi-directional reflectance, Land cover, Atmospheric specific humidity (column/profile), O3 Mole Fraction, Atmospheric temperature (column/profile), Land surface temperature, Sea surface temperature, CFC-11 (column/profile), CH4 Mole Fraction, N2O (column/profile), HNO3 (column/profile), Ocean surface currents (vector), Land surface topography, Wind vector over sea surface (horizontal), CFC-12 (column/profile), NO2 Mole Fraction, Ocean suspended sediment concentration, ClONO2 (column/profile), Sea-ice cover, Snow cover, Soil moisture at the surface, Wind speed over sea surface (horizontal), BrO (column/profile), Sea-ice thickness, Iceberg fractional cover, Significant wave height, Photosynthetically Active Radiation (PAR), Bathymetry, Geoid, NO (column/profile), Fraction of Absorbed PAR (FAPAR), Dominant wave direction, Sea level, CO2 Mole Fraction, Iceberg height, OClO (column/profile), CO Mole Fraction, Sea-ice type, Glacier motion, Ocean dynamic topography, Dominant wave period, SO2 Mole Fraction, Sea-ice sheet topography |
| Instruments | AATSR, DORIS-NG, RA-2, GOMOS, SCIAMACHY, MERIS, MIPAS, MWR, ASAR (image mode), ASAR (wave mode), ENVISAT Comms, ASAR |
| Instrument type | Imaging multi-spectral radiometers (vis/IR), Atmospheric chemistry, Communications, Precision orbit, Imaging multi-spectral radiometers (passive microwave), Radar altimeters, Imaging microwave radars, Atmospheric temperature and humidity sounders |
| CEOS EO Handbook | See EnviSat (Environmental Satellite) summary |
Related Resources
Summary
Mission Capabilities
EnviSat was a research mission that carried ten instruments and provided a wealth of data related to Earth’s health and climate change. EnviSat carried the Medium Resolution Imaging Spectrometer (MERIS), Michelson Interferometer for Passive Atmospheric Sounding (MIPAS), Radar Altimeter-2 (RA-2), Laser Retro-Reflector (LRR), Microwave Radiometer (MWR), Advanced SAR (ASAR), Global Ozone Monitoring by Occultation of Stars (GOMOS), Scanning Imaging Absorption Spectrometer for Atmospheric Cartography (SCIAMACHY), Advanced Along Track Scanning Radiometer, provided by the UK and Australia (AATSR), and Doppler Orbitography and Radiopositioning Integrated by Satellite (DORIS).
Performance Specifications
ASAR operated at C-band of 5.331 GHz and was regarded as an advanced version of the Synthetic Aperture Radar (SAR) instruments on board, providing a swath coverage of over 400 km wide using ScanSAR techniques, with a swath width of up to 100 km. AATSR had a swath width of 500 km and a spatial resolution of 1 km x 1 km. MERIS had 1150 km total swath with a Field of View (FOV) of 68.5°.
EnviSat was in a near-circular sun-synchronous orbit at an altitude of 800 km and an inclination of 98.55°. The Local Time on Descending Node (LTDN) was at 1000 hours with an orbit period of 100.6 minutes and an exact repeat cycle of 35 days.
Space and Hardware Components
EnviSat consisted of the Polar Platform (PPF) bus and the payload complement. The PPF included the service module (SM) that provided the standard satellite support functions and the payload module (PLM) that provided the accommodation and supported subsystems such as data handling, power and communications to the payload complement.
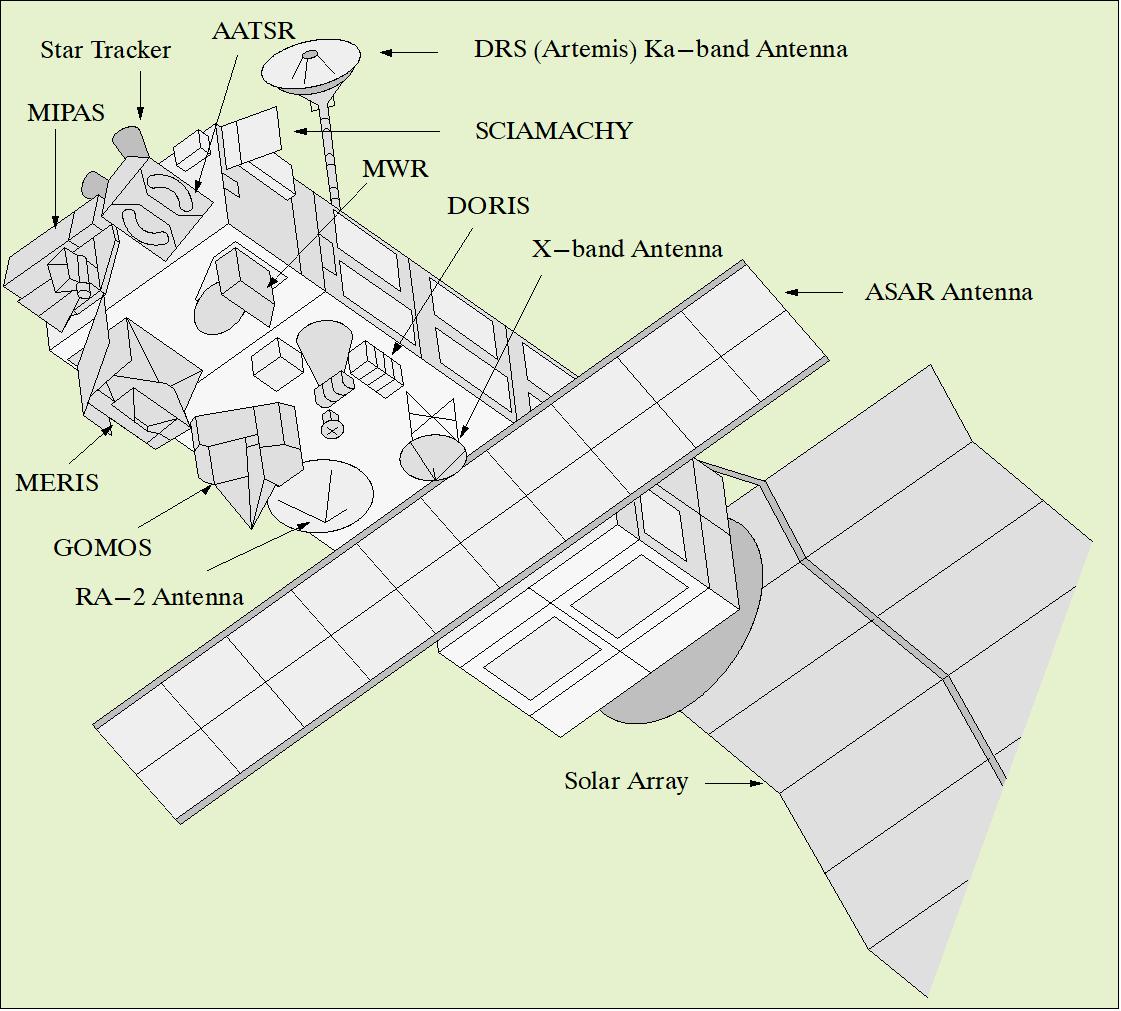
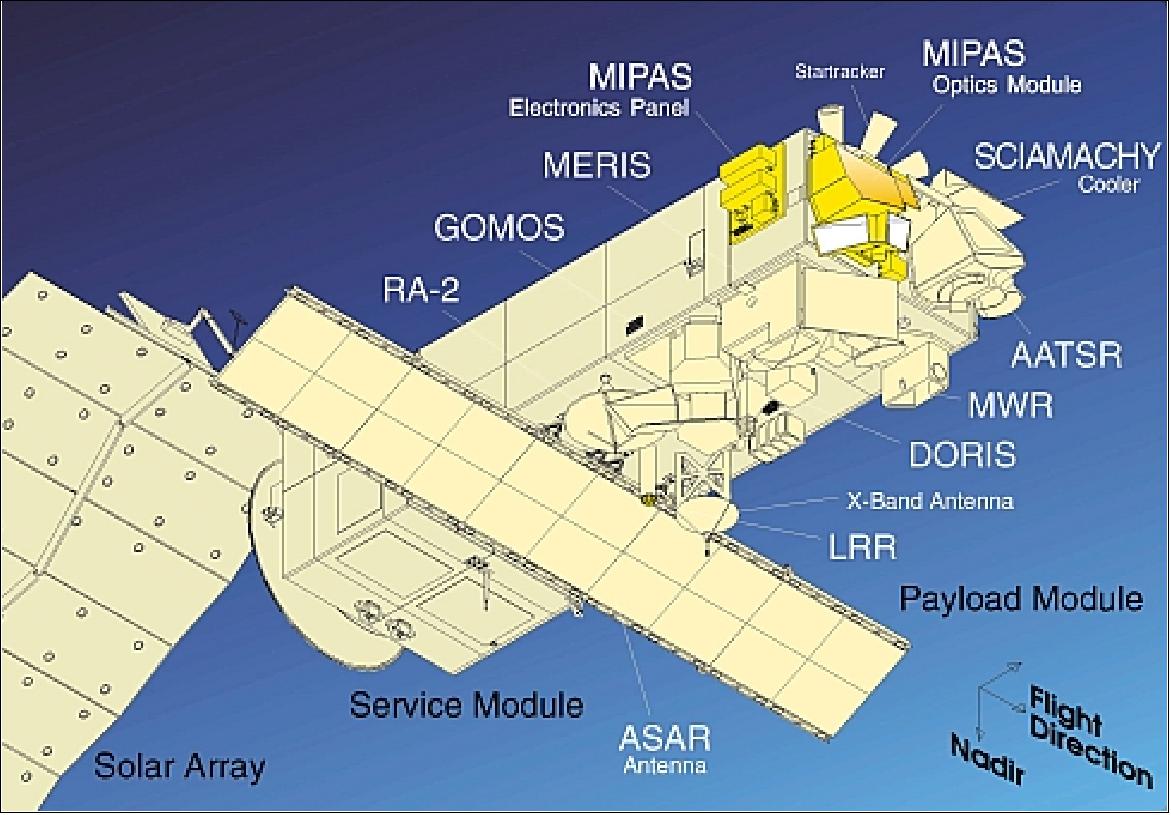
The SM was derived from the SPOT Maverick-II (Mk-II) bus design, built around a Carbon Fibre Reinforced Plastic (CFRP) cone as the primary structure with a launcher interface at one end and the propulsion module at the other. The PLM had externally mounted antennas of ASAR and RA-2, and MERIS, MIPAS, GOMOS optical assembly, SCIAMACHY, MWR and DORIS on a payload carrier. Additionally, it included a payload equipment bay which housed internally-mounted instruments (ASAR, RA-2, GOMOS) and subsystems like instrument control and data handling as well as X-band and Ka-band communications.
EnviSat (Environmental Satellite)
Overview Spacecraft Launch Mission Status Sensor Complement Ground Segment References
EnviSat is an Earth observation mission of ESA (European Space Agency). The overall objectives are studying and monitoring the Earth's environment on various scales, from local through regional to global.
- Monitoring and management of the Earth's resources, both renewable and nonrenewable.
- Continuation and improvement of the services provided to the worldwide operational meteorological community.
- Contribution to the understanding of the structure and dynamics of the Earth's crust and interior.
Major disciplines covered: meteorology, climatology, environment, atmospheric chemistry, vegetation, hydrology, land use, and ocean and ice processes. 1) 2) 3) 4)
The EnviSat program of ESA is a renamed successor program to the original POEM (Polar Orbit Earth-Observation Missions) utilising the Polar Platform (PPF). 5) 6) 7) 8) 9)
Background:
Originally, two parallel and staggered mission series were proposed in the POEM program. The first series was planned with a Morning Orbit (M), and the second series with an (After) Noon Orbit (N).
The objectives of the M-series were dedicated to studies in meteorology/atmosphere/ocean/ice/environment, while the N-Series was considered for the study of land resources/atmosphere/environment. This scenario was followed in 1991 by the POEM-1 mission (a single satellite mission) which fulfilled both environmental and meteorological mission objectives.
The updated POEM program of 1992/93 considers a split scenario of two dedicated missions called EnviSat (Environmental Satellite) and MetOp (Meteorology Operational Programme). The key element of the split scenario is the transfer of the meteorological instrument package onto a separate platform with a morning orbit devoted primarily to operational meteorology and climate monitoring. This allows the EnviSat mission to focus on environmental issues that are more research-oriented with a package of essentially preoperational instruments.
The development of the payload instruments for EnviSat started after the split of POEM-1 into EnviSat and MetOp at the Ministerial ESA council meeting in December 1993.
Spacecraft
Configuration
The EnviSat satellite comprises the PPF bus and the payload complement. The PPF itself comprises:10) 11) 12)
1) The service module (SM) is providing the standard satellite support functions
2) The payload module (PLM) is providing accommodation and supporting subsystems (data handling, power, communications) to the payload complement.
Service Module
The SM is derived from the SPOT Mk-II bus design. The PPF has been developed and integrated by EADS Astrium Ltd. [formerly MMS (Matra Marconi Space), Bristol, UK] as the prime contractor. The SM is built around a CFRP (Carbon Fiber Reinforced Plastic) cone as the primary structure, with a launcher interface at one end and the propulsion module at the other. Both interfaces are made of aluminum.
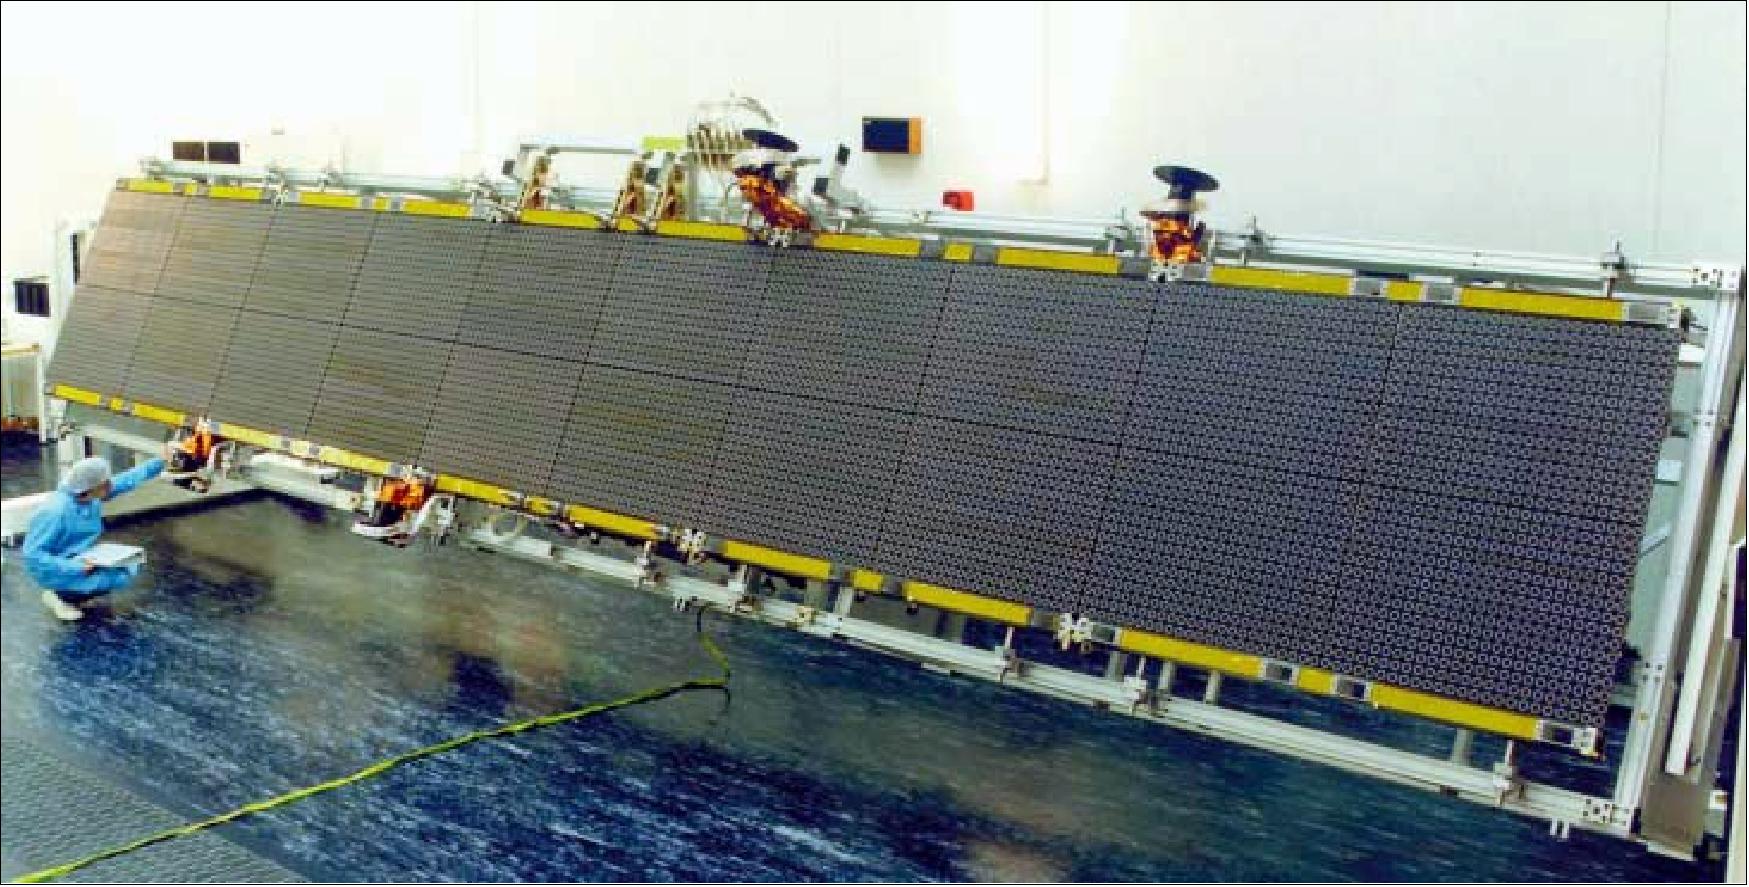
A box-shaped metallic structure, with aluminum honeycomb panels, supports the electronic equipment and surrounds the central cone. The SM includes eight batteries and a solar array. Once deployed, the array is rotated to point continuously towards the sun using a solar-array drive mechanism, which is attached to the base of the central cone. The propulsion module on top of the cone contains four tanks, which hold over 300 kg of hydrazine.
A single central computer containing both command and control and AOCS functions performs onboard data management. It controls the SM equipment via a standard onboard data-handling bus. The central computer also communicates with the central computer of the PLM via the same bus.
Payload Module
The PLM provides the physical accommodation for the instruments, as well as a range of instrument-related services, such as power switching, integrated payload command and control, data storage, and downlinking. The structure of the PLM consists of a 1.2 m diameter CFRP tube and a set of CFRP sandwich panels, forming the webs and external faces of the PLM box. The structure is conceived as a stack of four bays, each 1.6 m high. The bay furthest from the SM (bay 4) is designed to be removable from the other three.
The PLM features externally mounted antennas (of ASAR and RA-2) and the following instruments (MERIS, MIPAS, GOMOS optical assembly, SCIAMACHY, MWR, and DORIS) on a payload carrier. In addition, there is a payload equipment bay that houses internally-mounted instruments (ASAR, RA-2, GOMOS) and subsystems like instrument control and data handling as well as X-band and Ka-band communications. The industrial team for the EnviSat payload has been led by EADS Astrium (formerly DASA/DSS).
The PLM avionics is decoupled from the Service Module. It provides its own power distribution, operates its own OBDH (On-Board Data Handling) bus, and is controlled by a specific PMC (Payload Module Computer), which performs tasks including scheduling of the commanded mission, monitoring of the PLM systems (Payload Equipment Bay avionics, and payload instruments).
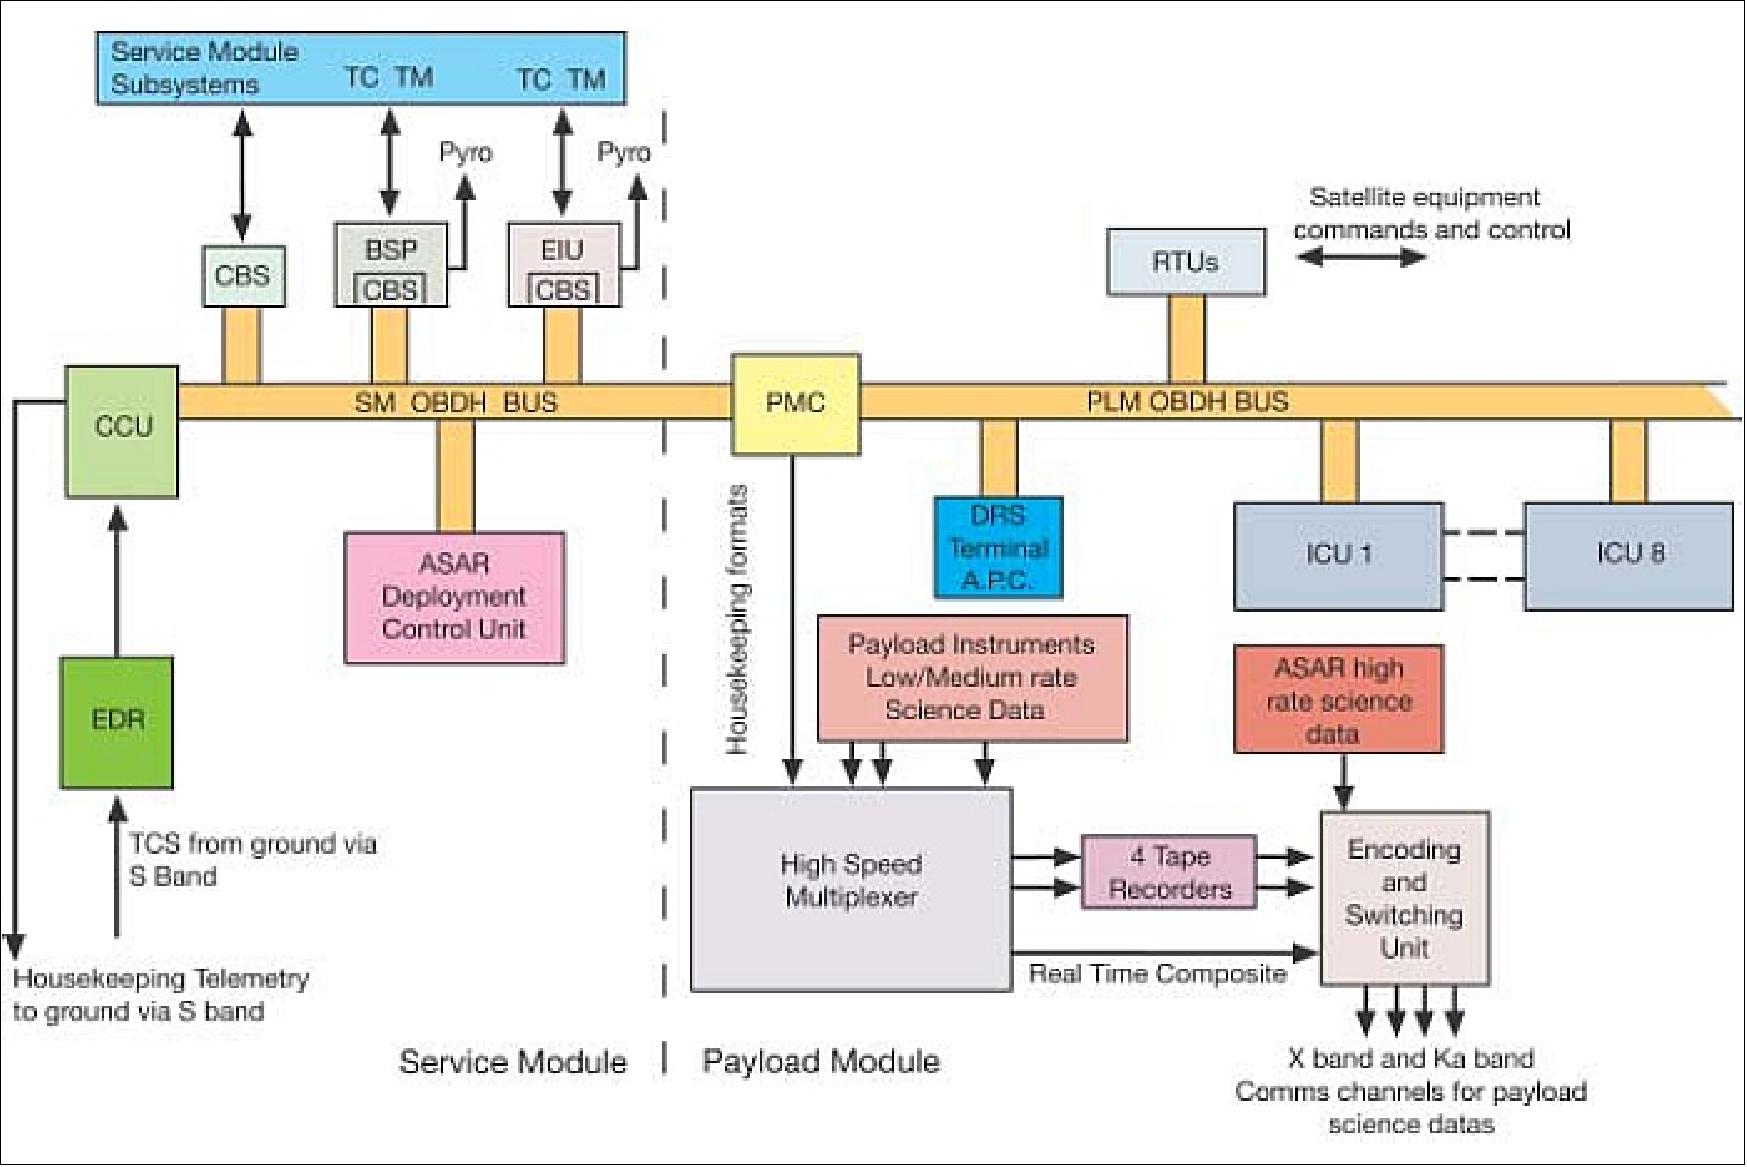
The PMC operates as the payload-instrument master controller. It communicates with the SM via the SM OBDH bus, and commands and controls all the PLM equipment and instruments via a separate PLM OBDH bus. It also routes housekeeping telemetry back to the PMC for transmission to the SM (Figures 5 and 6).
ICUs (Instrument Control Units) are responsible for the instrument command and control functions, ranging from the management of telemetry/telecommand flows between the PLM OBDH and the payload instrument units (MWR, DORIS), to the management of instrument internal data buses and of communication with secondary scientific processors connected to them (MERIS, RA-2, ASAR). Each payload instrument is equipped with an ICU, as is the Ka-band antenna pointing controller.
Parameter | Description |
S/C dimensions | - Launch configuration: 10.5 m length; 4.57 m envelope diameter |
S/C stabilisation | Three-axis stabilised, attitude pointing: < 0.1º (3σ); attitude measurement: < 0.03º (3σ) |
S/C mass | 8140 kg including 319 kg of hydrazine |
Payload mass | 2050 kg (instruments and interfacing hardware) |
S/C power | - 6.5 kW (EOL) with single-sided solar arrays, size of solar panel: 5 m x 14 m |
Payload power | 1.9 kW sunlight and eclipse average (peak = 4.1 kW) |
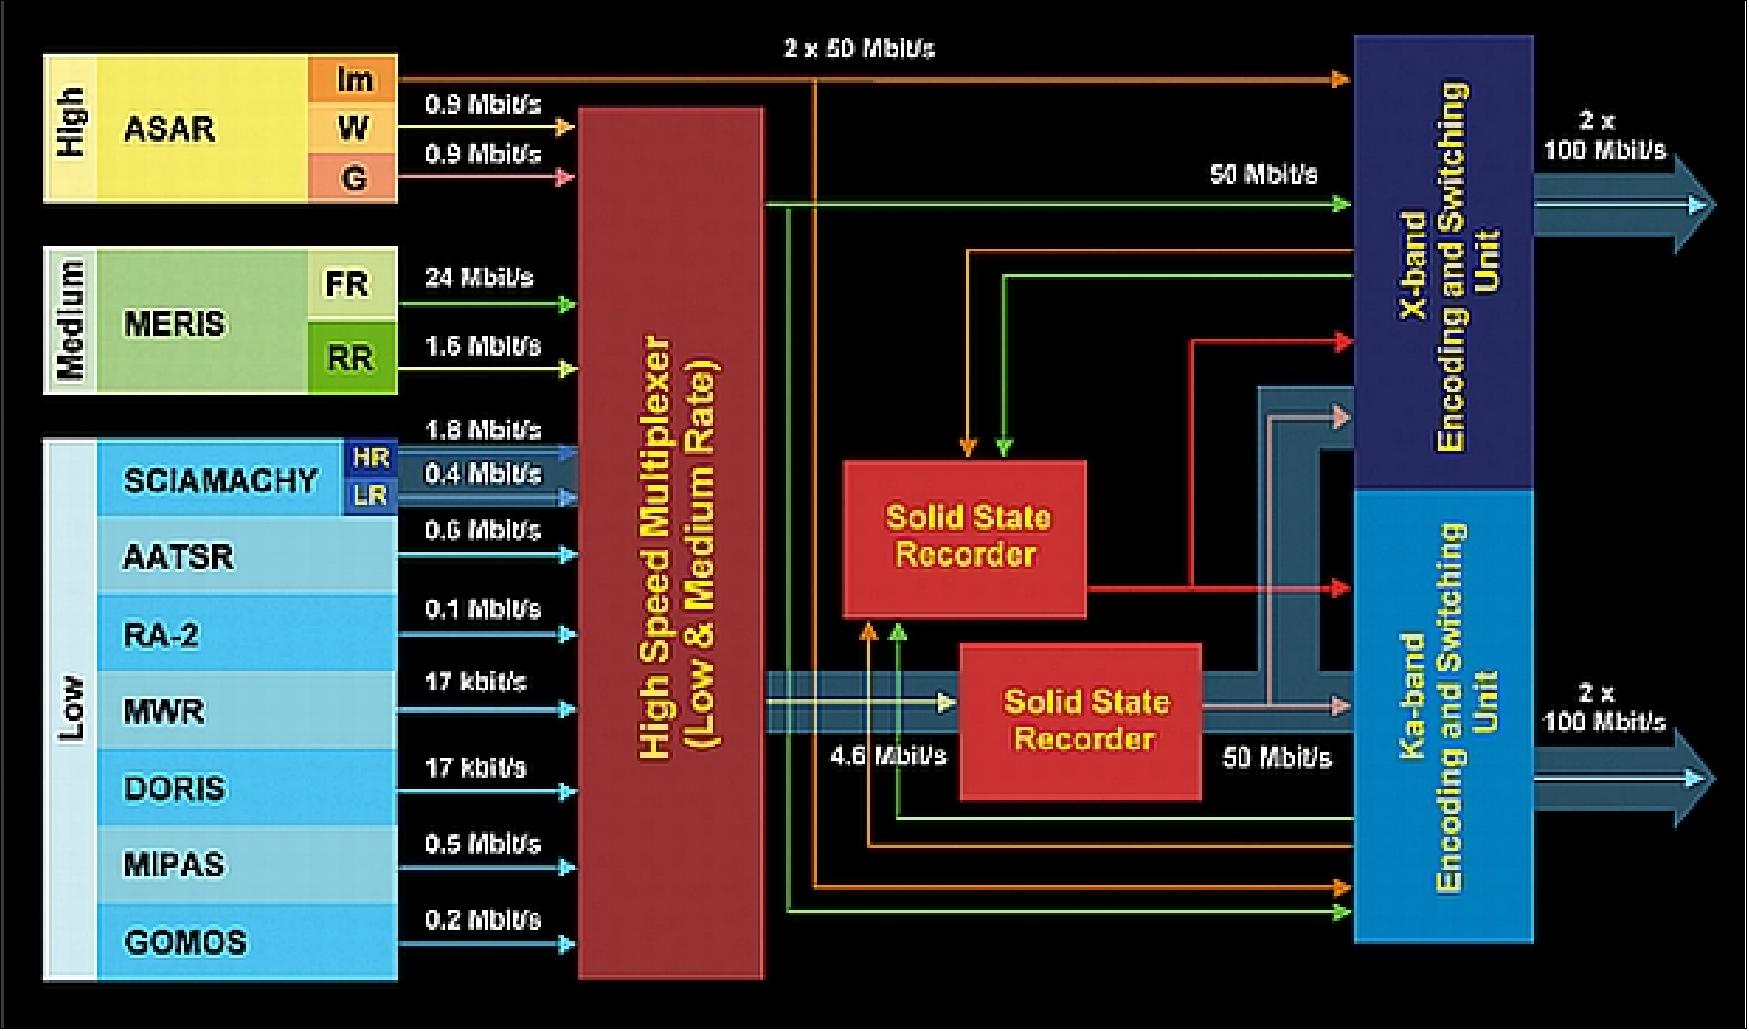
Onboard data storage | - One tape recorder of 30 Gbit, a LBR (Low Bit Rate) recording rate capability of 4.6 Mbit/s and a replay rate of 50 Mbit/s. |
Payload data transmission | - 2 Ka-band channels each at 50/100 Mbit/s via DRS (Artemis) for payload data |
RF links | S-band direct to/from ground via DRS for TT&C |
RF link operation | Half link operation uses BPSK modulation, full link operation with QPSK |
Command & Control | 2 kbit/s uplink and 4.096 kbit/s downlink in S-band (TT&C function) |
AOCS (Attitude and Orbit Control Subsystem): The AOCS provides three-axis stabilisation of the satellite body, which remains fixed in the local orbital reference frame. It ensures acceptable pointing and pointing-stability performance for the payload instruments and sensors:
The AOCS sensors are:
• A set of four independent two-axis gyroscopes: two are used for nominal operations, with the other two remaining in cold backup
• Two DES (Digital Earth Sensors): one is used for nominal operations, while the other is kept in cold redundancy
• Two DSS (Digital Sun Sensors): one is used for nominal operations, while the other is kept in cold redundancy. DSS is not used for attitude control in SYSM
• Three SST (Stellar Star Trackers): any pair used for SYSM, with the third kept in cold redundancy.
The AOCS actuators are:
• Sixteen thrusters, 8 allocated to each nominal and redundant actuator chains. They are used for initial attitude control, in- and out-of-plane maneuvers, and safe mode. The backup thrusters are kept in cold redundancy.
• Five reaction wheels, each with a 40 Nm/s capacity (two wheels on Y- and Z-axis, one wheel on X-axis)
• Four magnetorquers, forming two pairs. They are actuated at the correct satellite orbital phase (depending on their alignment wrt the Earth's gravity field) to control the maximum spin rate of the reaction wheels on the relevant axis.
• Four tanks containing 300 kg of hydrazine for initial orbit acquisition and orbit maintenance activities.
• A solar array drive mechanism (MEGS) to control the solar array's rotation (1 rotation per orbit). At a second level, the MEGS is also controlled to compensate for the solar array perturbations due to flexible modes, which are detected by the gyroscopes. Note: MEGS is of the SPOT platform family heritage.
The prime satellite AOCS operational mode is stellar yaw-steering, deriving the satellite attitude from the SSTs (Stellar Star Trackers) and the satellite rates from the gyroscopes. Commands are sent to the SST sensors using a ground-based star catalog tuned to the spectral characteristics of the SST optics. The time of detection of the commanded star, and its position within the SST field of view allow the onboard software to derive an attitude measurement for the satellite.
Measurement and data handling
This onboard function is responsible for the acquisition, formatting, recording, and communication to the PDGS (Payload Data Ground Segment) of measurement data generated by the EnviSat payload (Figure 5). The HSM (High-Speed Multiplexer) collects ISP (Instrument Source Packets) in CCSDS format generated by the sensor complement. It formats and encodes these ISP data into Virtual Channel Data Units that are multiplexed together to produce two types of data frames generating CADUs (Channel Access Data Units). One frame is for recording by one of the two solid-state recorders or by the tape recorder, the other is for the real-time generation to the PDGS.
The CADU data streams are collected by the ESU (Encoding and Switching Unit), which routes each of the different CADU data streams to either the X-band or the Ka-band communication subsystem. The ESU also collects the two 50 Mbit/s data streams from the ASAR payload instrument and routes them either directly to the communication systems or to one of the two solid-state recorders for later dumping.
The satellite command and control system
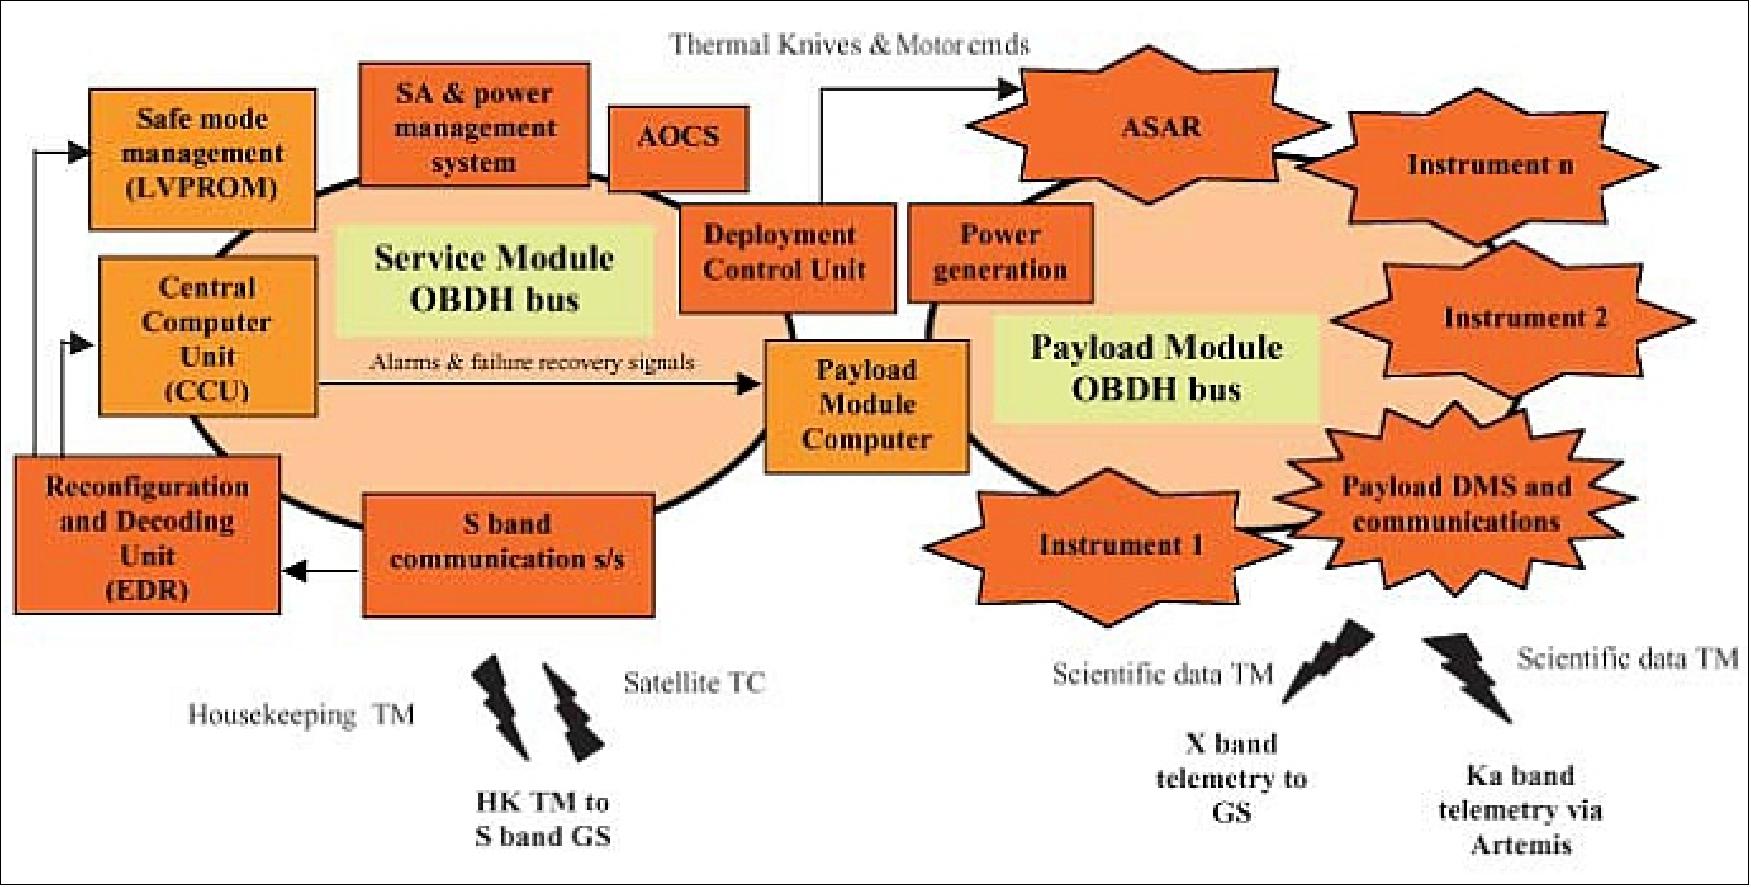
This system is organised around two OBDH systems (Figure 6), a master SM data-handling system, and a PLM data-handling system, slaved to the SM OBDH bus. Each module has a dedicated computer to which equipment items are connected through the OBDH digital serial data busses.
The SM data-handling subsystem performs the processing and storage of housekeeping data, the management of telecommand and housekeeping telemetry (at the interface with the S-band ground stations), the data-bus control, the satellite alarms management, and the clock generation to all OBDH peripherals, including the PLM.
The data-handling subsystem is based on a CCU (Central Communication Unit), which handles the exchange of information between the ground and the SM equipment via the OBDH data bus. It contains an ultrastable oscillator, from which all satellite timing is generated. The CCU communicates through the SM OBDH bus with the Payload Management Computer located within the PLM. The CCU also serves as the main computer for the AOCS. Dedicated control algorithms and monitoring functions are implemented into the CCU software.
RF communications
EnviSat is equipped with two distinct payload communication subsystems accommodated within the Payload Equipment Bay.
The X-band communication subsystem has three communication channels operable independently and, if need be, simultaneously. Each channel features a QPSK (Quadrature Phase-Shift Keying) modulator via a shaped reflector antenna. The three frequency carriers used by this subsystem are 8.1, 8.2, and 8.3 GHz.
The Ka-band assembly is also composed of a three-channel communication subsystem. The assembly uses a 2 m deployable mast located on the opposite side of the satellite to the Earth. The mast is equipped with an azimuth and elevation pointing mechanism, which steers a 90 cm-diameter Cassegrain antenna pointed to the ARTEMIS satellite. Pointing commands are generated by an Antenna Pointing Controller, which is accommodated together with the RF part of the assembly within the Payload Equipment Bay. The Ka-band frequencies are 26.85, 27.10 and 27.35 GHz. The system operates in an open loop, which means that the ARTEMIS Ka-band transponder is tracking EnviSat using its telemetry, without the need for an extra tracking beacon or tracking receiver.
Data transmission
The satellite is capable of providing simultaneous operation of X-band and Ka-band channels.
• Global mission data (low rate) = 4.6 Mbit/s - `global mission' involves the operation of all low data instrument modes, whenever observation conditions permit, with the onboard data recording. The nominal operation involves one tape dump per orbit at 50 Mbit/s.
• Regional mission data (the term `regional mission' implies real-time data acquisition via ARTEMIS or via X-band ground stations.). This includes:
- ASAR data in its imaging modes with a real-time dedicated channel at 100 Mbit/s
- MERIS full resolution data multiplexed with low-rate instrument data. This includes half of a 50 Mbit/s channel. The other half of the channel is used for tape recorder dumps. In the absence of a dump, this channel is operated at half rate (BPSK modulation at 50 Mbit/s versus QPSK for 100 Mbit/s).
The S-band communication assembly provides a bi-directional telemetry and telecommand link with the ground and is used for overall satellite commanding, monitoring, and control. It provides a 2 kbit/s forward and 4 kbit/s return S-band link to the ground, via two S-band antennas operating with cardioid radiation patterns and opposite circular polarisations. Omni-directionality of the link allows communication in any non-nominal attitude. The S-band transponder modulates housekeeping telemetry, demodulates telecommands, and supports ranging and range rating by the terrestrial command and control ground stations.
Launch
The launch of EnviSat took place on March 1, 2002, on an Ariane-5 launch vehicle from Kourou, with a nominal lifetime of 5 years (including 6-months commissioning phase). Spacecraft operations are being conducted at ESA/ESOC, the payload center is at ESA/ESRIN. 13)
Orbit: Near-circular sun-synchronous orbit; altitude = 800 km; LTDN (Local Time on Descending Node) = 10 hours, inclination = 98.55º, orbit period = 100.6 minutes, exact repeat cycle of 35 days. EnviSat has the same ground track as ERS-2 (within ±1 km) with its orbit 30 minutes ahead of ERS-2.
Mission Status
• March 1, 2022: This date marked the twenty year anniversary of EnviSat launch. This research mission, which carried 10 instruments, would become a beacon for the development of future Earth observation satellites. In orbit for 10 years, double its projected lifespan, this flagship mission provided planetary and climate change data. 14)
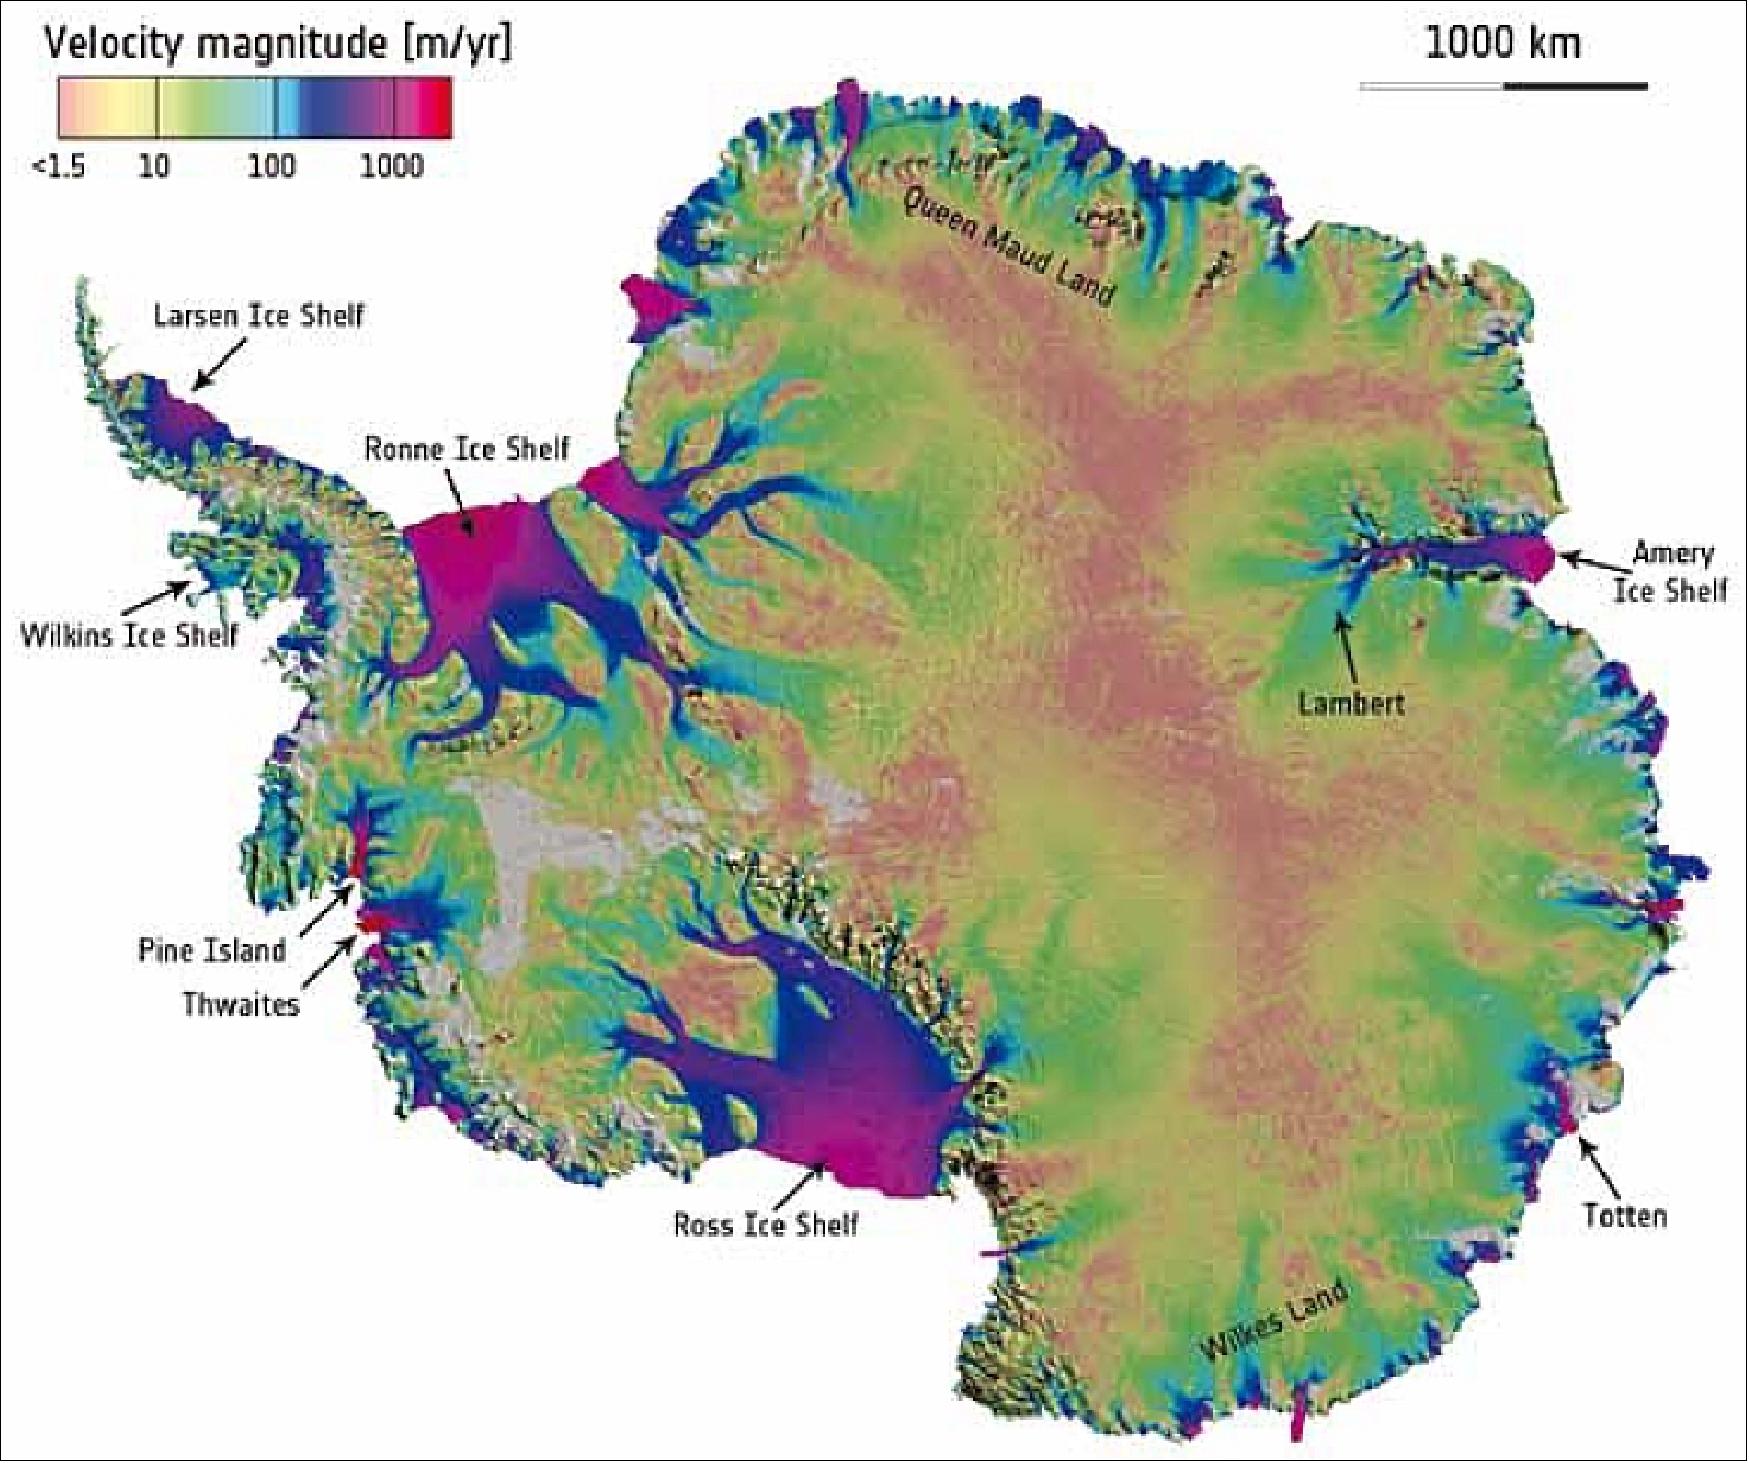
• December 1, 2016: Since the launch of the first Earth-observing satellites in the 1970s, numerous missions from international space organizations have taken to the sky. Today, decades of data are helping scientists to build a better picture of changes to our planet. 15) Between 2008 and 2009, a 750 km2 area of ice in the northern Antarctic – known as the Wilkins Ice Shelf – partly disintegrated. At the time, ESA's EnviSat satellite monitored the event with the help of the DLR German Aerospace Center's TerraSAR-X mission. While the event itself made headlines, scientists got to work studying the ice's behaviour before the breakup and continued to monitor the area for years afterwards. In a study published recently, a team of researchers from the German university Erlangen-Nürnberg examined data dating back to 1994 from the ERS mission to map the ice speed on the Wilkins Ice Shelf (Figure 10) up through 2010 using EnviSat, TerraSAR-X and Japan's ALOS. 16)
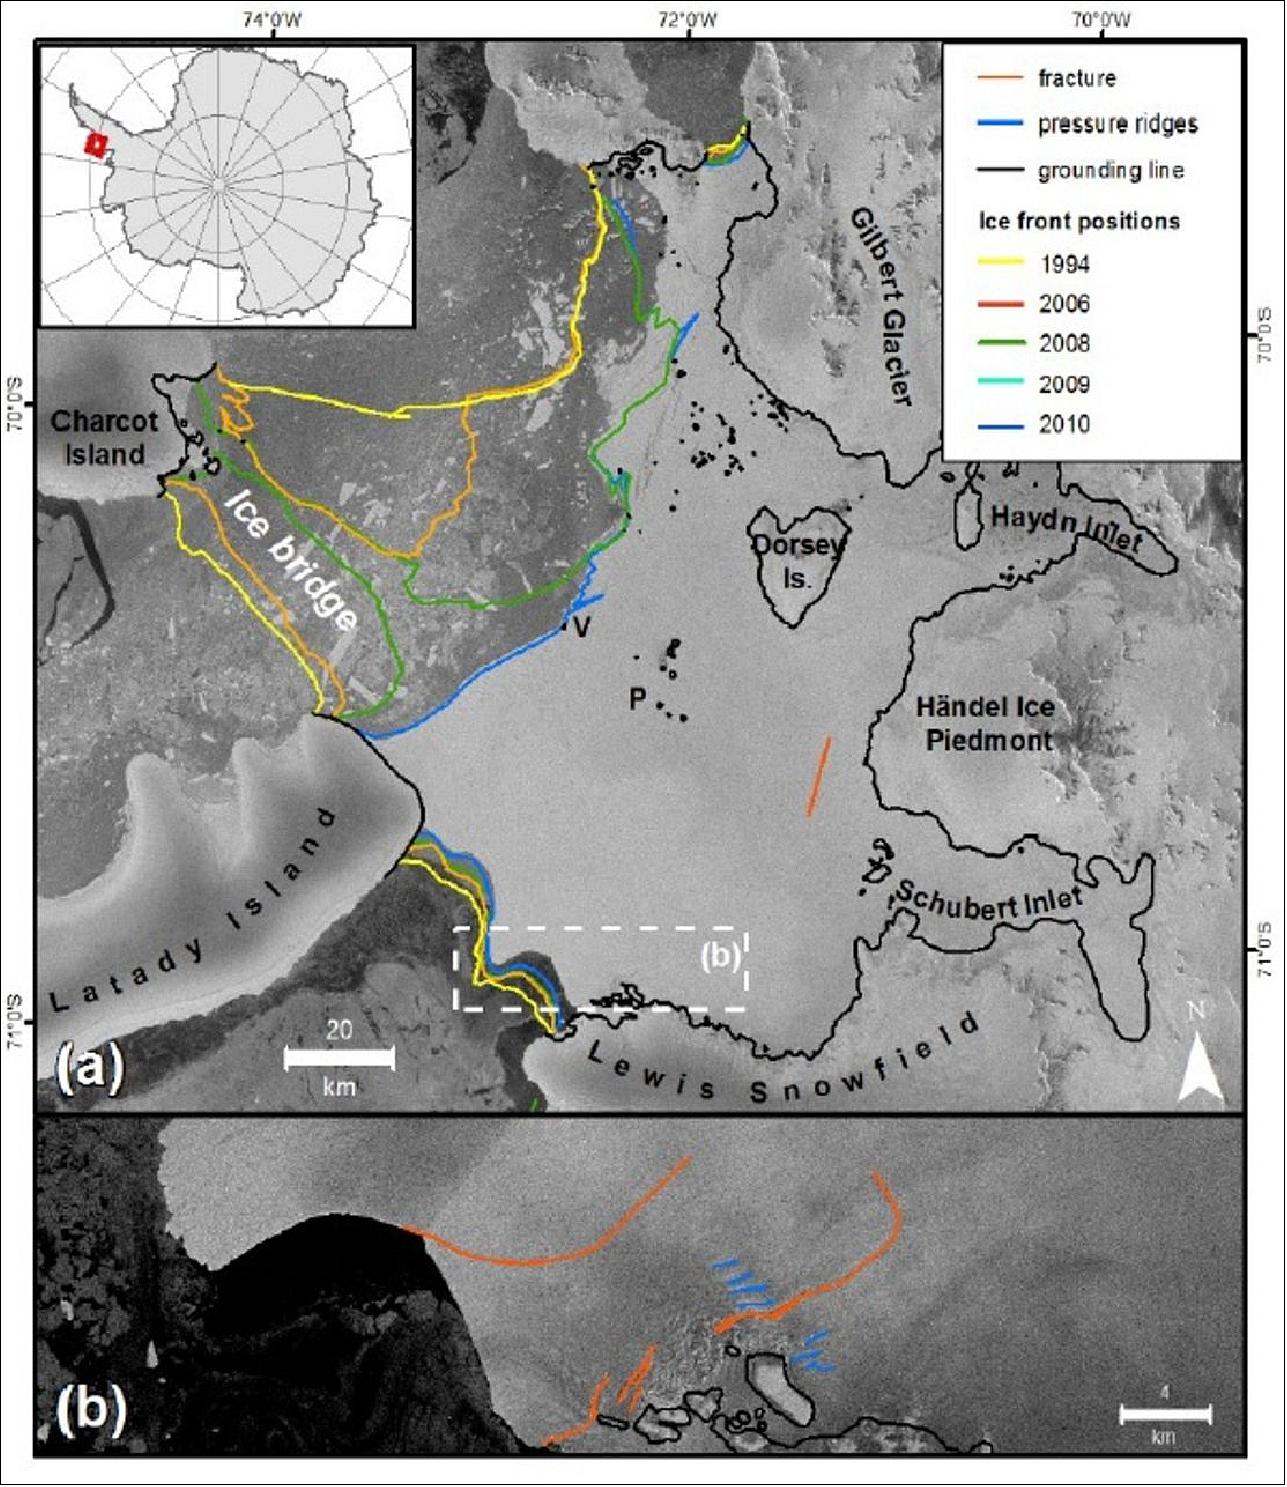
- Access to information from different satellites carrying similar sensors allows scientists to obtain a more complete picture of an area of interest. For example, EnviSat continued to monitor the Wilkins Ice Shelf until its mission ended in 2012, but Germany's TerraSAR-X, Canada's RADARSAT, and Italy's COSMO-SkyMed continued to collect data over the area. Today, the Sentinel-1 mission ensures global satellite radar coverage into the future, and the Copernicus program's free and open data policy also allows access to these important data. As with any technology, formats change over time. Data from EnviSat or the even older ERS radar mission is not identical to those from Sentinel-1. ESA is addressing this issue through the Long Term Data Preservation Program, which ensures that both old and new satellite data and associated information are properly preserved and available for scientists, policy-makers, and value-adding companies.
![Figure 11: Surface velocities of Wilkins Ice Shelf in 1994–96 and between 2006 and 2010 derived from ERS-1/2 and ALOS PALSAR. The position of the grounding line in 1995–96 is marked as a black line [image credit: JAXA, ESA, the image contains modified Copernicus Sentinel data (2015)] 17)](https://eoportal.org/ftp/satellite-missions/e/Envisat_01_03_2022/Envisat_Auto33.jpeg)
• February 2016: Past data from EnviSat continued to aid scientists When climate alters the amount of rainfall on land, bringing drought or flood, it gets a lot of attention. However, an often overlooked factor in the global climate system is rainfall at sea. 18) 19)Ground-based radar has limited range, and gages on islands or buoys can only give scattered readings making it very difficult to estimate the overall extent of rainfall on the ocean's surface. One proposed solution is to use satellite-based radar that can detect the ripples and splashes caused by falling raindrops. To evaluate this method, analysis was conducted of radar observations from the ESA's EnviSat satellite—in particular, a 2006 storm in the Luzon Strait that was also in a range of ground-based radar in Taiwan. They found that when the rainfall increased, as measured by the ground radar, so did the backscattering radar signature from space—but only to a point. When the rainfall increased to monsoon-like levels its radar signature as seen from space actually shrank. To determine exactly what it was that the radar was detected, the authors also captured super-slow-motion footage of water droplets impacting a tank of water. They found that the biggest features weren't the ripples or the craters from the falling raindrops, but rather the rebounding "stalks" that form as the impact ring of water collapses back in on itself (Ref. 19).

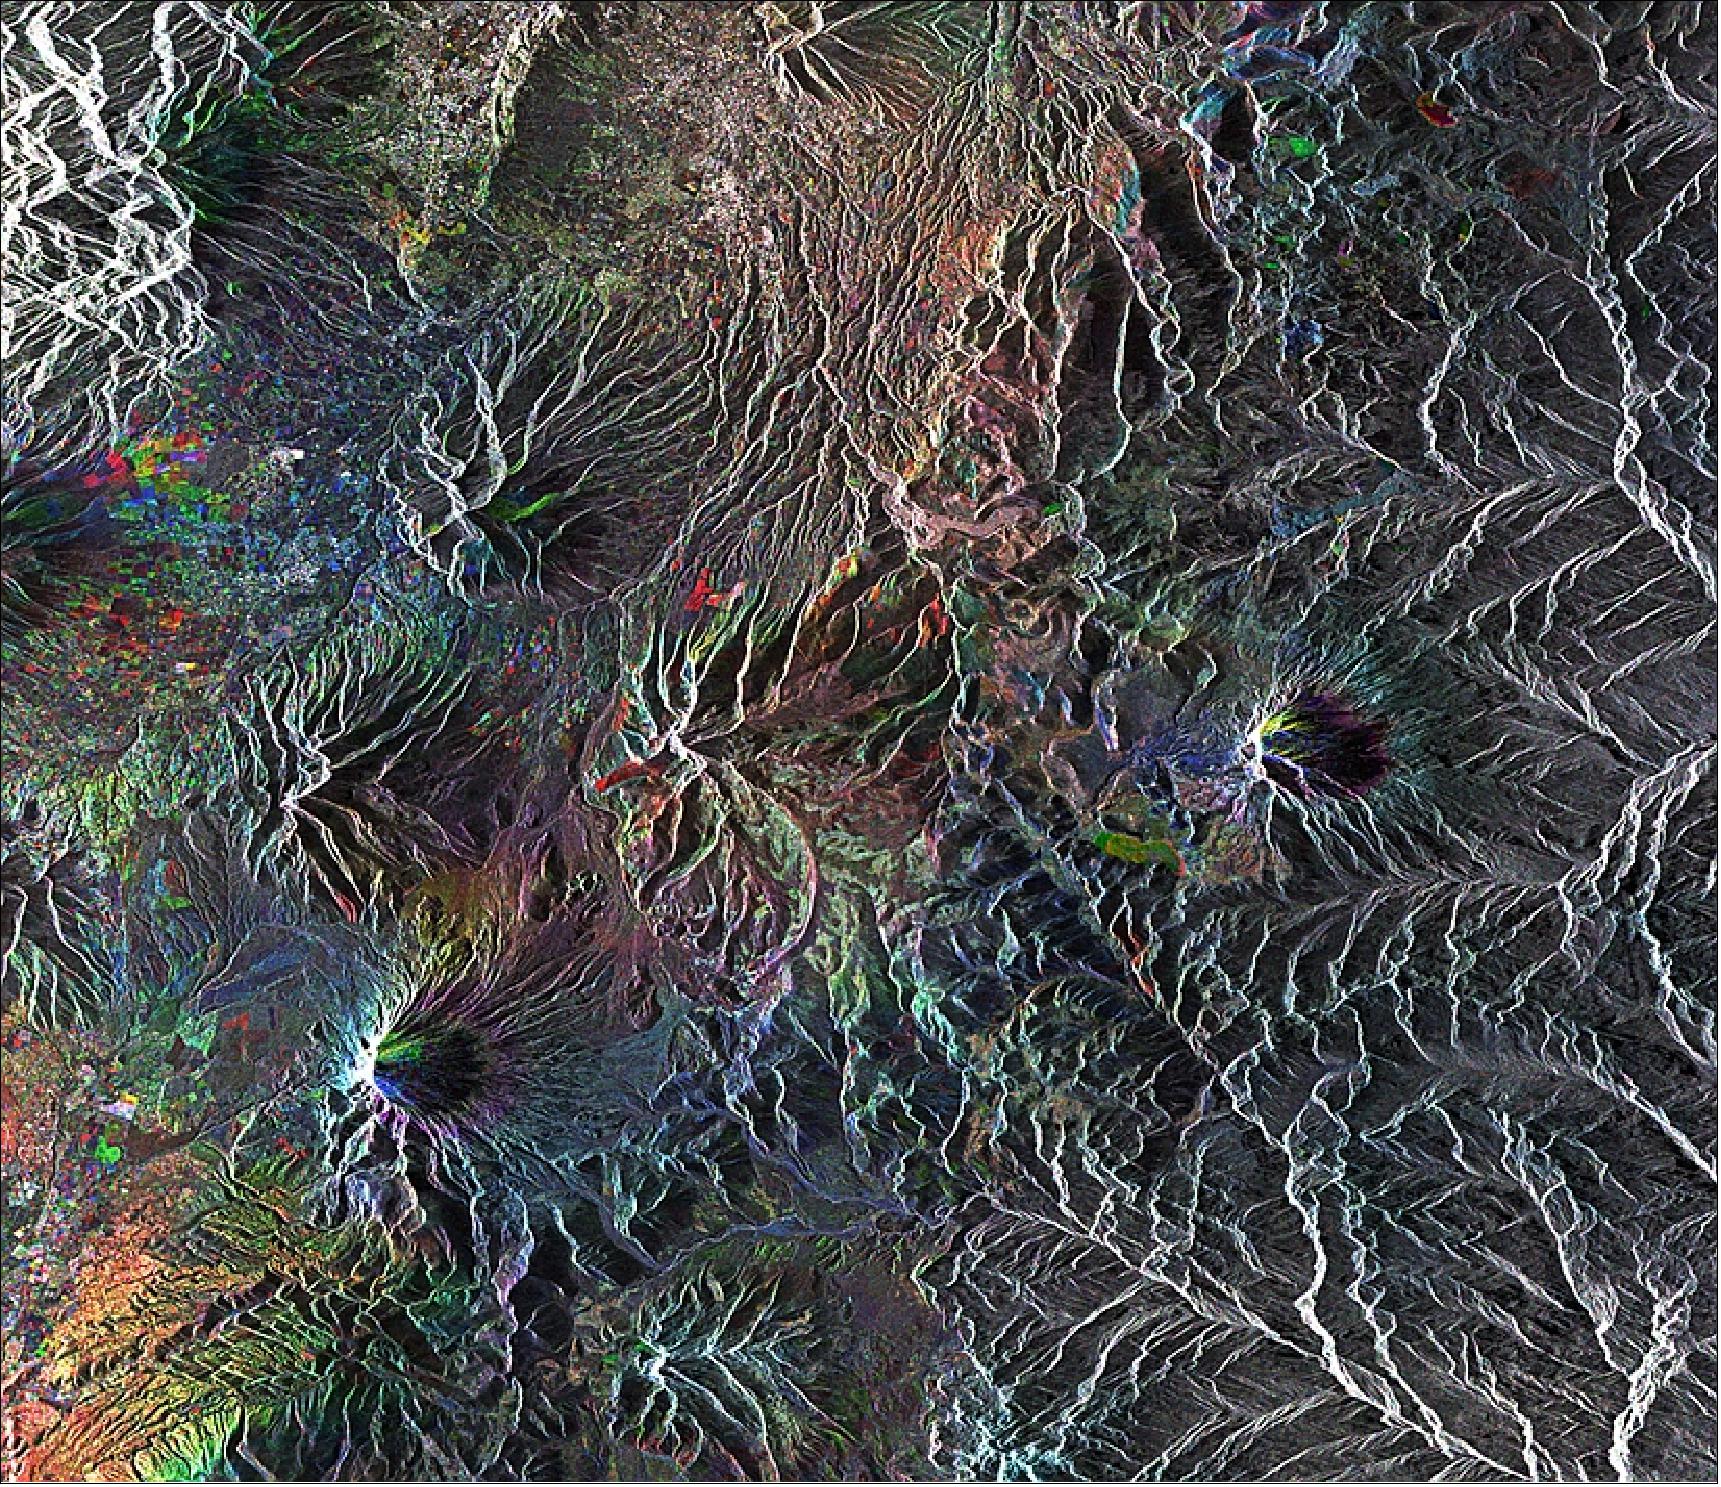
• February 28, 2014: The image of Figure 13 (Ecuador's Highlands) was created at ESA by combining three EnviSat radar passes from 4 June 2006, 20 January 2008, and 24 January 2010 over the same area. The image is ESA's 'Earth observation image of the week' on Feb. 28, 2014. 22) The belt was formed as a result of the Nazca and Antarctic tectonic plates moving under the South American plate – a geological process called ‘subduction'. Near the bottom-left corner is the Cotopaxi stratovolcano. — On the center-right side of the image is the Antisana volcano. What looks like white glaciers at the peaks of these mountains are actually artifacts of the radar echo – the surfaces of the summits are more or less directly facing the satellite, so the radar signal reflects straight back to the antenna.
• November 15, 2013: The Dasht-e Lut salt desert in southeast Iran is captured in this EnviSat image (Figure 15). The desert is often labelled the ‘hottest place on Earth' as satellites measured record surface temperatures there for several years. The highest land surface temperature ever recorded was in the Lut Desert in 2005 at 70.7ºC, as measured by NASA's Aqua satellite. 23)
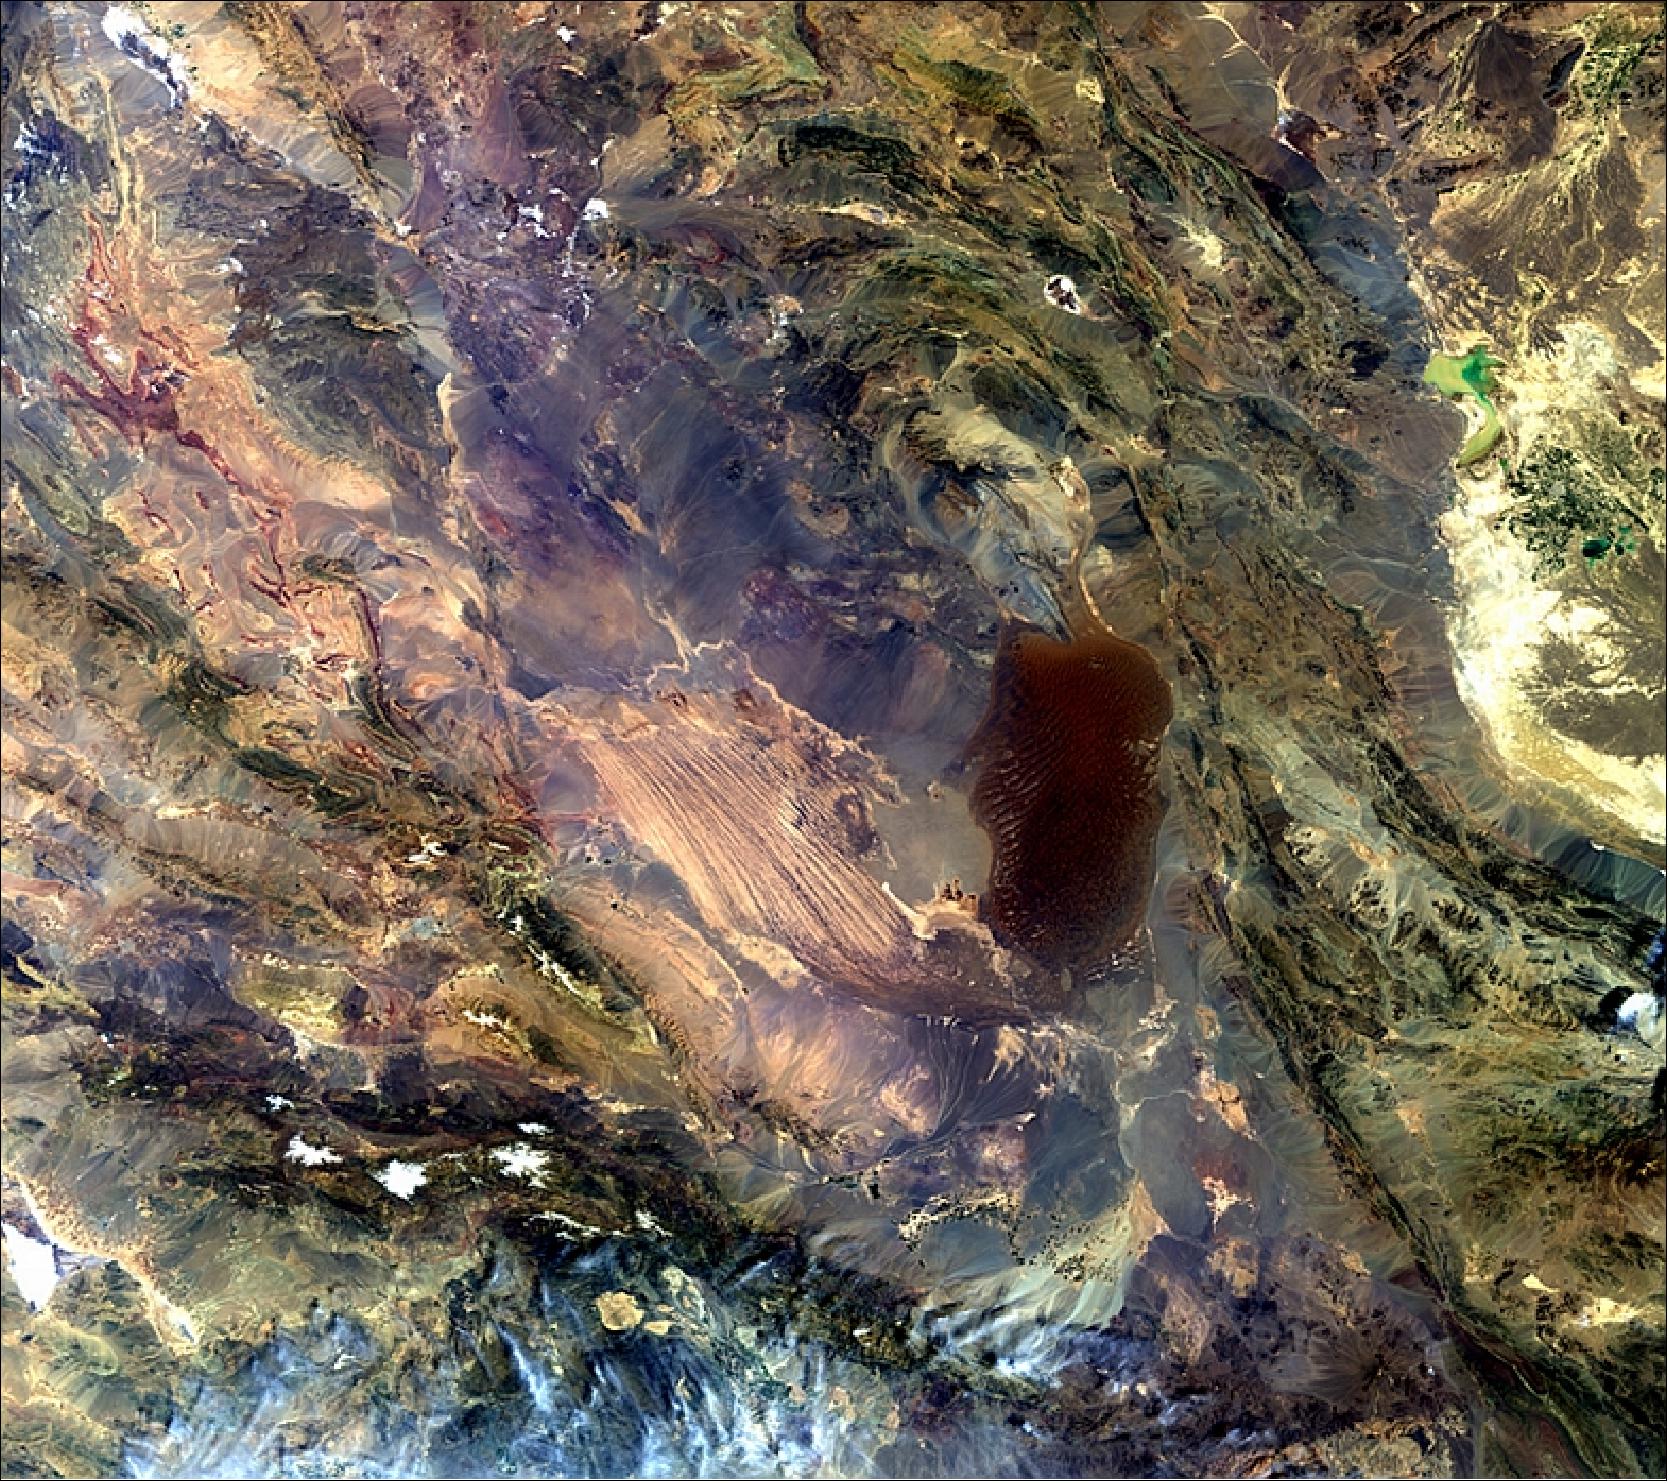
- In the upper-right section, one can see a light green, shallow body of water that straddles Iran's border with Afghanistan. With their arid surroundings, the wetlands in this border region have been a major source of food and fresh water for thousands of years, as well as an important stop for migratory birds. A major earthquake struck about 100 km east of the snow-caps in 2003, its epicenter near the ancient city of Bam (the lower-central portion of the image).
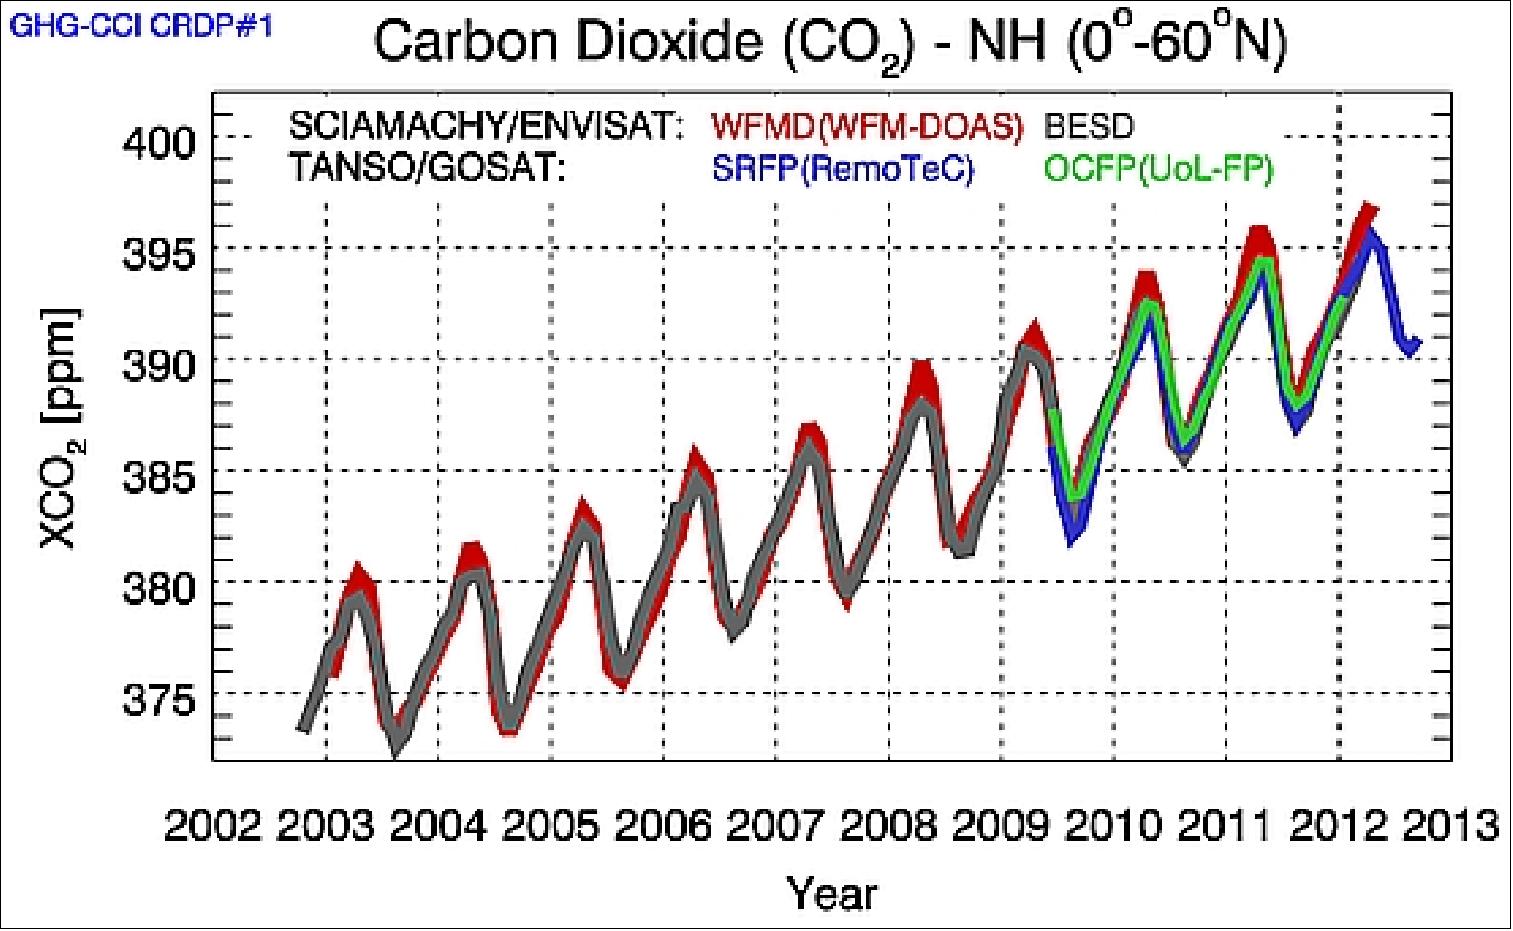
• September 2013: Data from EnviSat contributed to ten years of satellite observations of greenhouse gases revealed that carbon dioxide in our atmosphere continues to increase despite international efforts to reduce carbon emissions. Satellites also show that recent methane increases are likely due to man-made emissions. Atmospheric carbon dioxide and methane are the two most important man-made greenhouse gases responsible for global warming. The main reason for the increase in carbon dioxide over the last ten years is emissions from burning fossil fuels, such as coal, oil, and gas. For methane, the reason is less clear but is most likely due to increasing man-made emissions, combined with natural variations caused by wetland emissions and biomass burning. In addition to the increase in greenhouse gases, the satellites also show many other features such as the gases' detailed geographical patterns and fluctuations with time. 25)
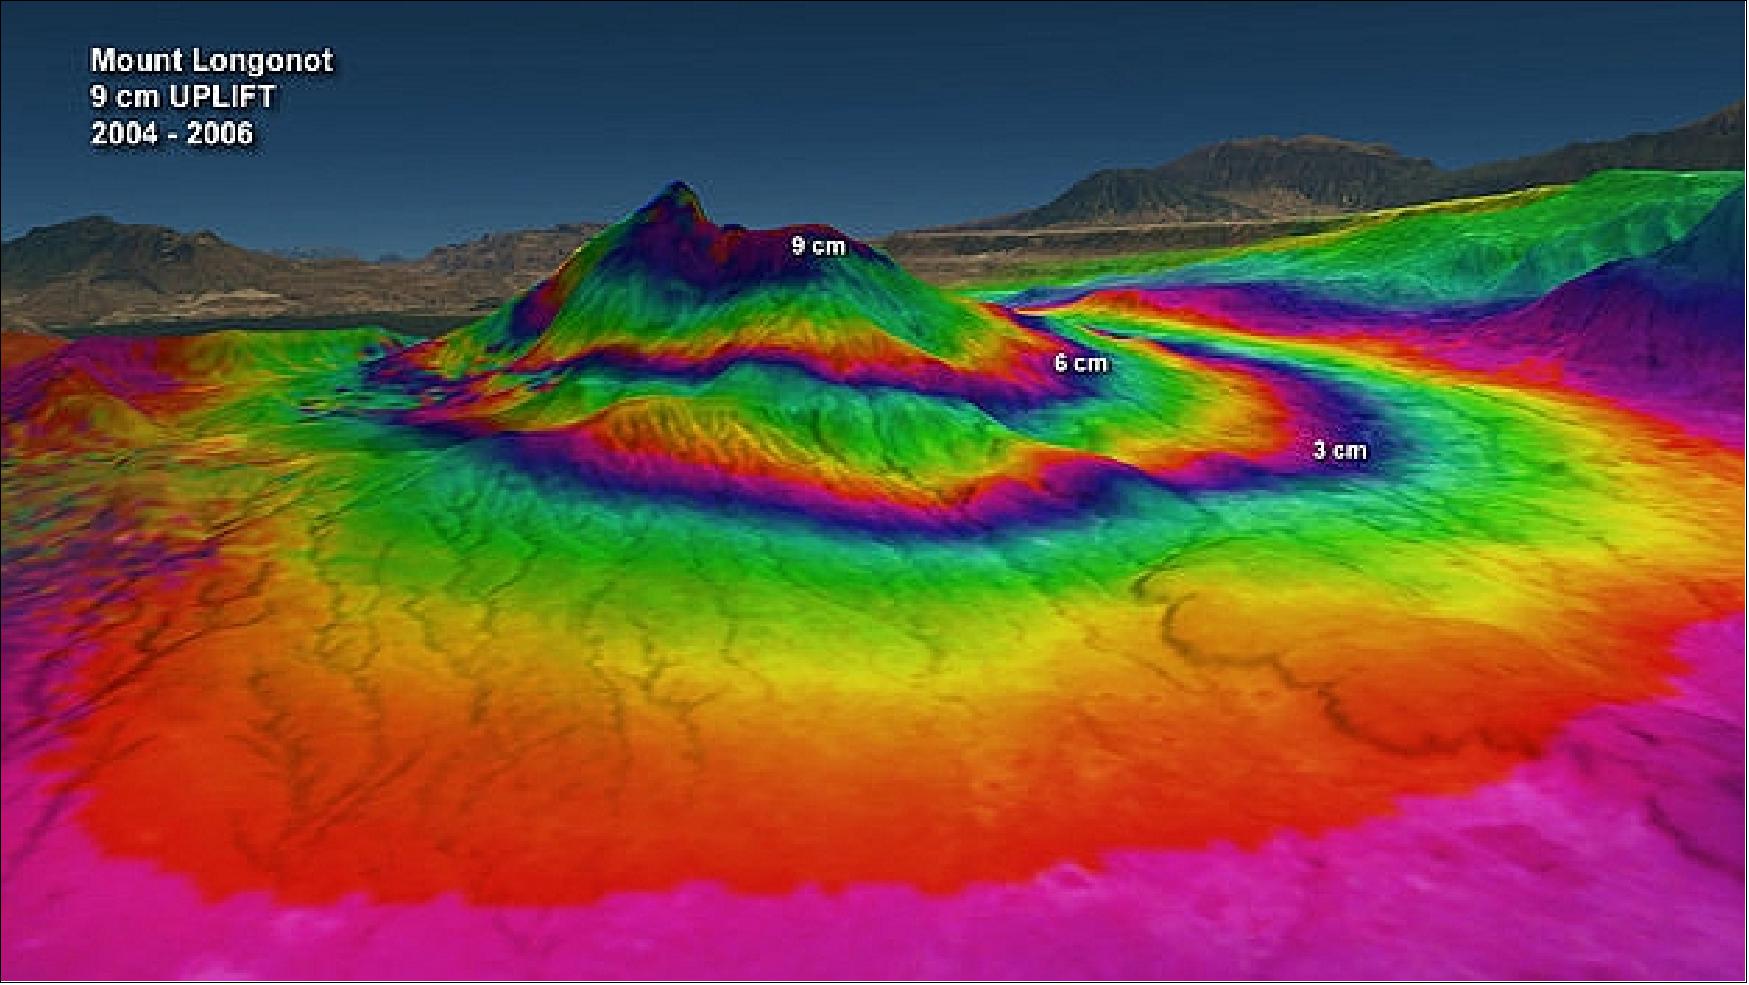
• August 2013: The satellite radars of EnviSat and ALOS detected volcanic movement in the East African Rift Valley. 26) EnviSat found that the dormant Mount Longonot in Kenya rose by 9 cm from 2004 to 2006. Tectonic activity such as the movement of magma underground may have caused this deformation of the surface above. Radars can also identify fault lines – such as the radar on the Japanese ALOS satellite. Ground displacement following a series of earthquakes around Karonga, Malawi, was detected in the interferogram, revealing details of a fault line.
• July 2013: ESA featured the image of the Virunga Mountains as the image of the week, 15-19 July 2013 in the 'Earth from Space video program.' 27)
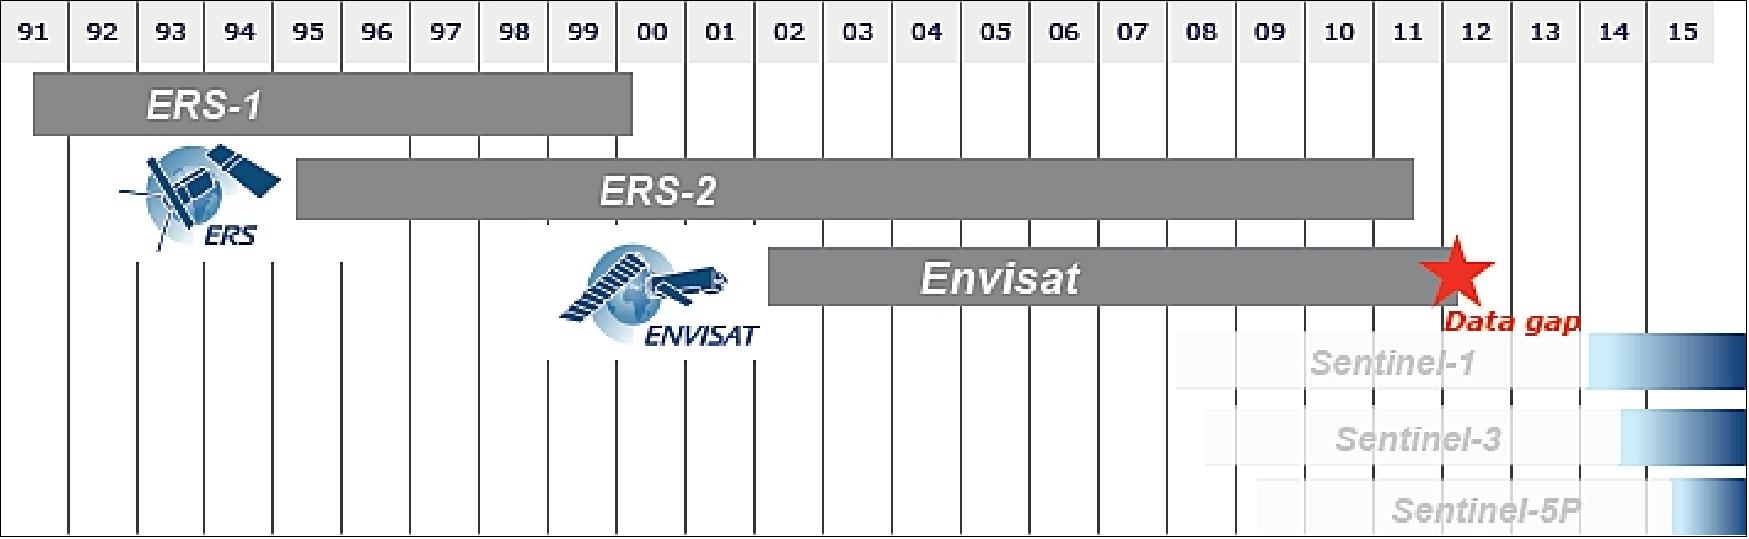
• July 2012: The lack of overlap between the EnviSat and Sentinel satellites (2012 - 2014) operations created a data gap. ESA is trying to reduce the impact of the data gap with two types of initiatives: 28) The first is increasing presence of non-ESA data. Several satellite operators have offered their collaboration (e.g. operators of SAR missions in Europe/Canada); discussions have started. Data gap actions will very partially compensate for the lack of EnviSat data, i.e. only the Sentinel missions will fully substitute the EnviSat data flow. The second is reinforcement of archived data exploitation (EnviSat / ERS). Increased availability of datasets online, e.g. SAR data for Geohazard Supersites (InSAR datasets), SAR data over polar areas.
• May 9, 2012: ESA declared the end of the EnviSat mission. A team of engineers attempted to regain control of EnviSat, investigating possible reasons for the problem. Despite continuous commands sent from a widespread network of ground stations, there has been no reaction yet from the satellite. 29) As there were no signs of degradation before the loss of contact, the team has been collecting other information to help understand the satellite's condition. These include images from ground radar and the French Pleiades satellite. Although the chances of recovering EnviSat were extremely low, the investigation team continued attempts to re-establish contact while considering failure scenarios for the next two months. However, at this point EnviSat had already operated for double its planned lifetime, making it well overdue for retirement (Ref. 29).
• April 8, 2012: Contact with EnviSat was unexpectedly lost, preventing the reception of any data as the spacecraft passed over the Kiruna ground station in Sweden. 30)
• March 1, 2012: The EnviSat spacecraft was 10 years on orbit - doubling its planned five-year lifetime, orbiting Earth more than 50,000 times. An estimated 2000 scientific publications have been based on this information. 31)
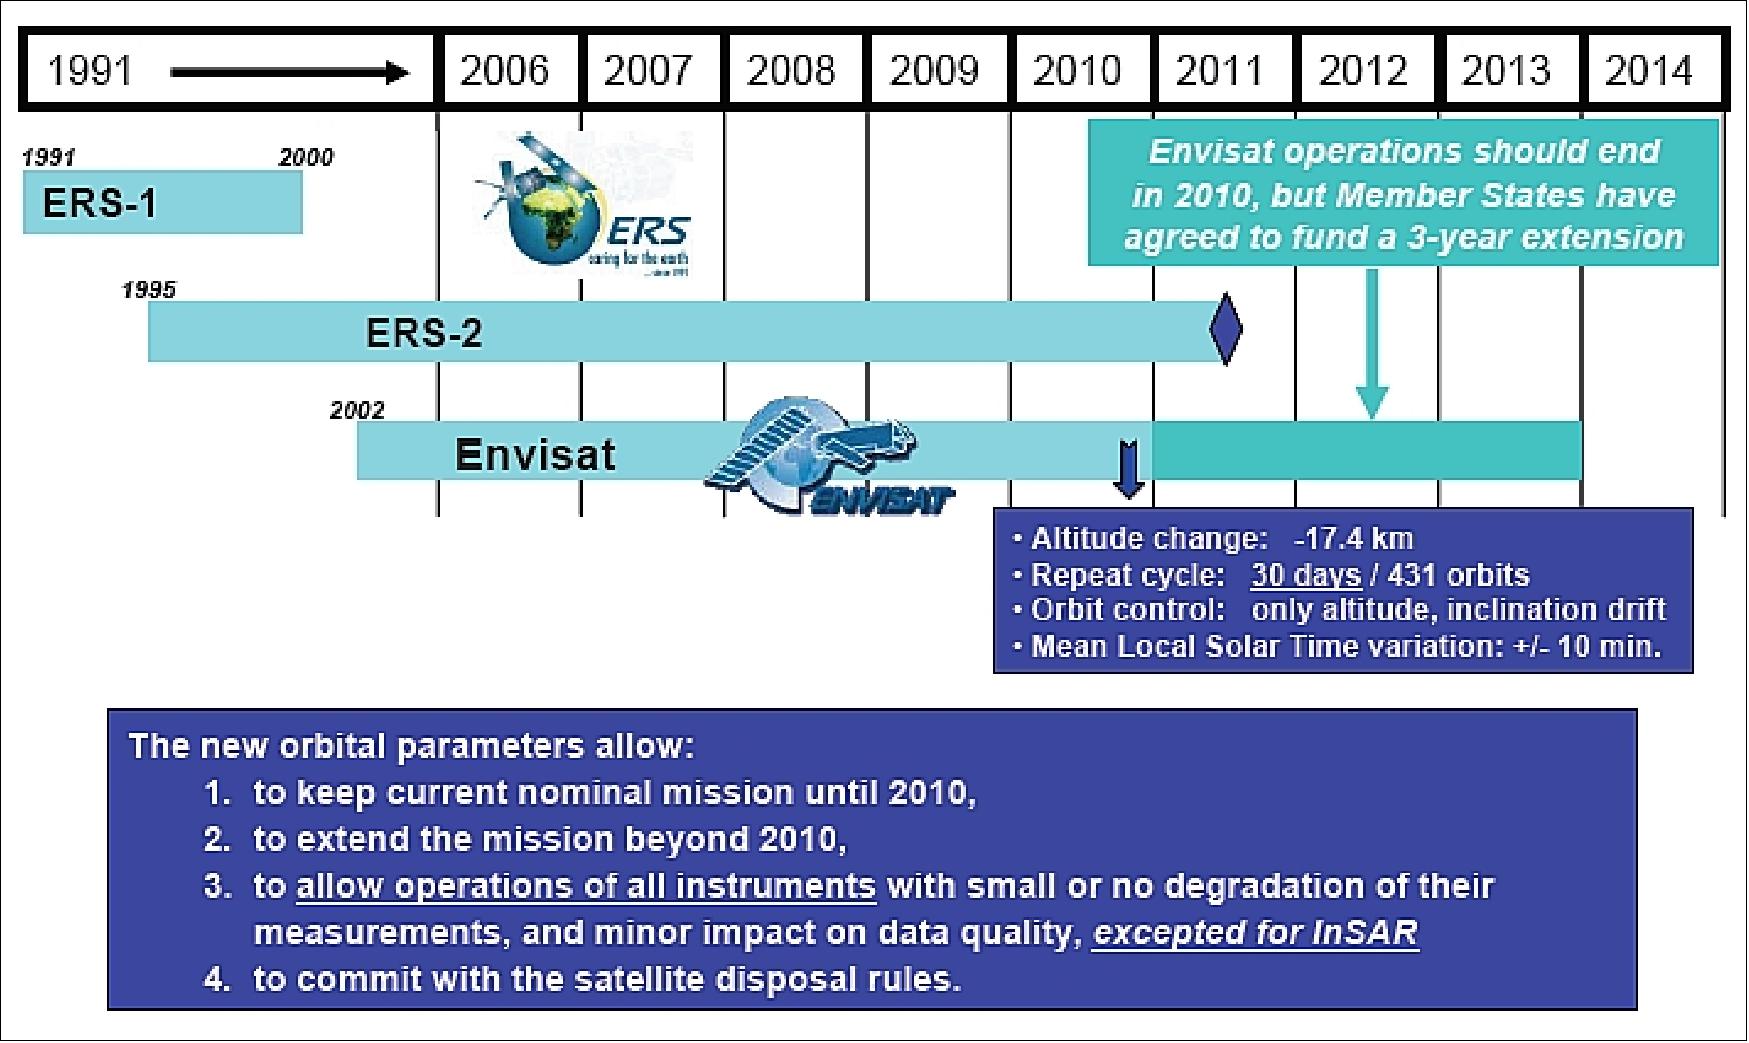
• Early 2012: The EnviSat spacecraft was operational in early 2012. The constraints apply as reported earlier - i.e., in its new orbit configuration (30-day repeat cycle) implemented since October 2010 (no orbit maintenance was performed anymore to save fuel; this caused a slight drift in the orbit inclination).
• October 2011: EnviSat is operating nominally, except for the GOMOS instrument, which has been suffering from several anomalies since August 2011. 33) 34)
• September. 22, 2011: ESA's EnviSat observation satellite completed its 50,000th Earth orbit - traveling 2.25 billion km since its launch on March 1, 2002. 35)
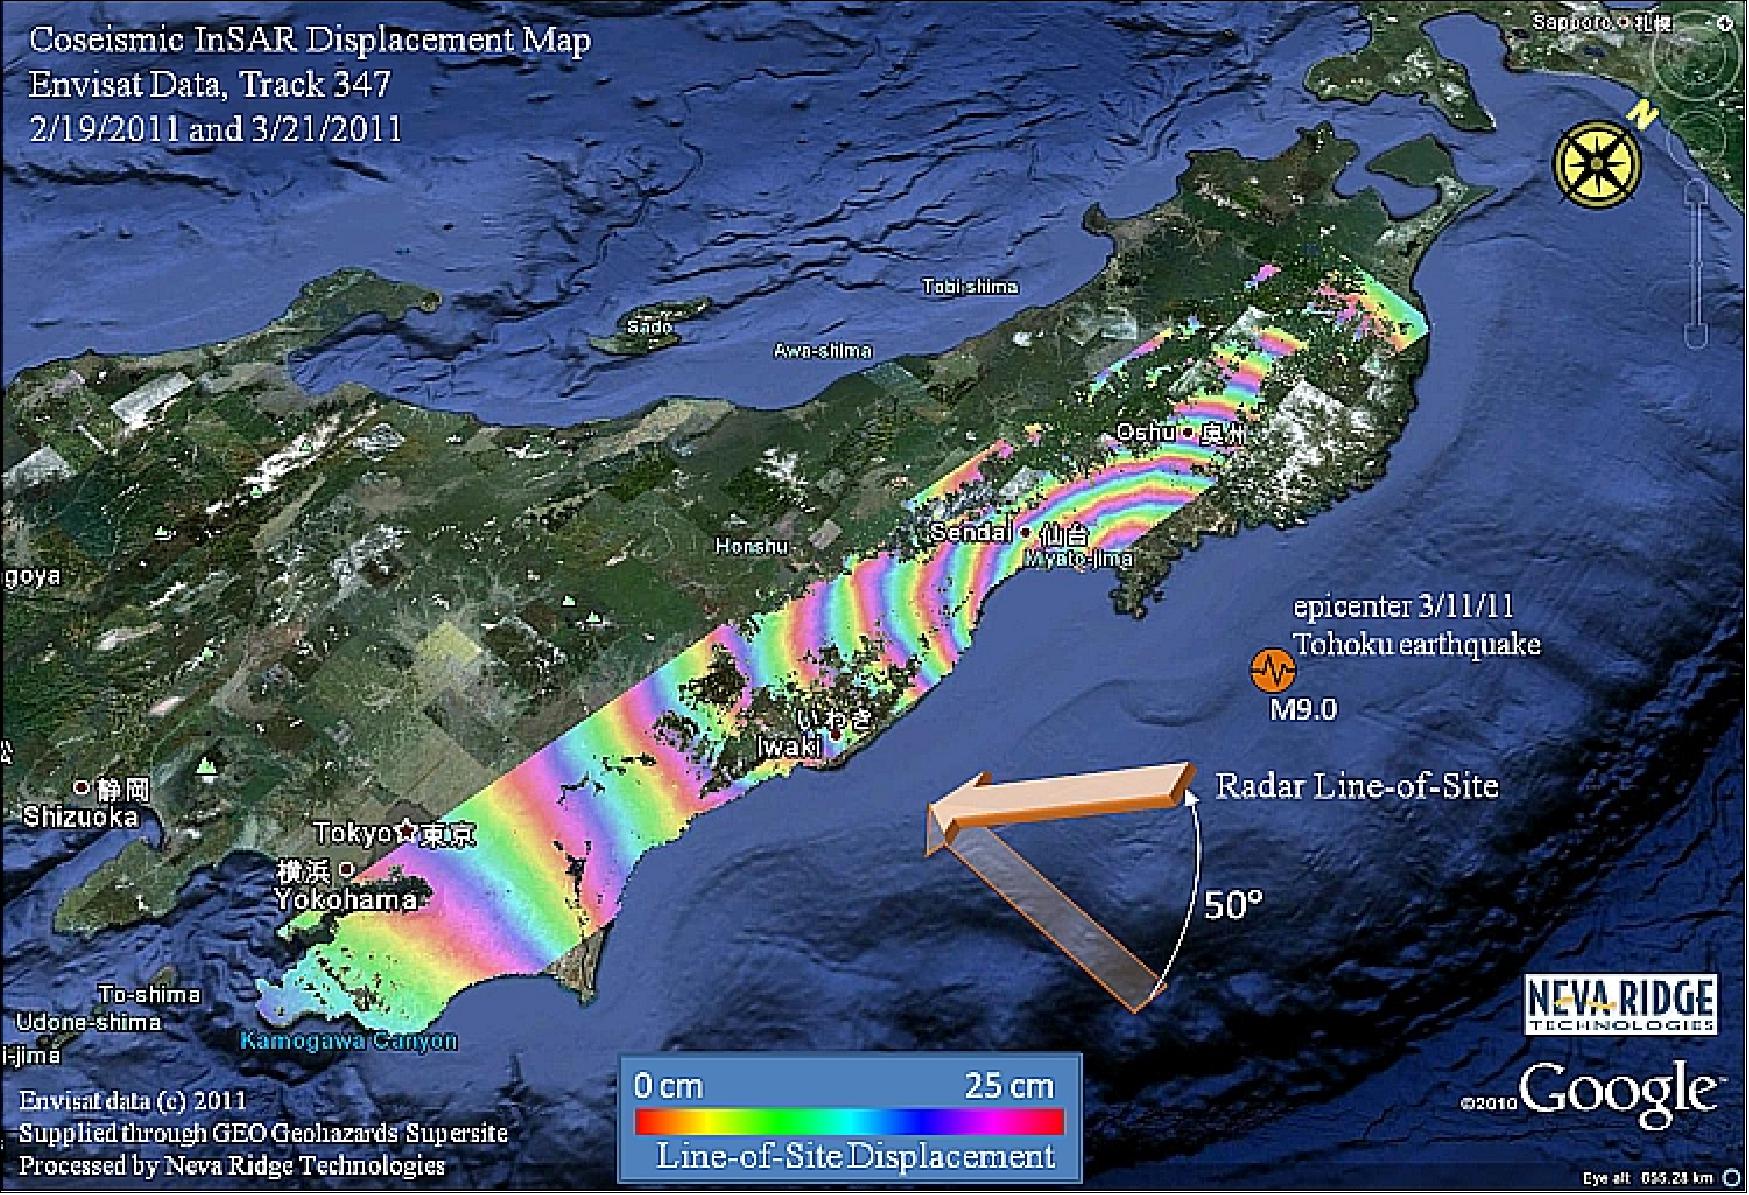
• Summer 2011: EnviSat is fully operational in its new orbit configuration (30-day repeat cycle) implemented in October 2010. All instruments are providing high-quality data, with no anomalies during recent months. 39) To reduce hydrazine consumption, the tight repetitive orbital control required by SAR Interferometry is no longer maintained in the new orbit configuration. However, the careful implementation allows tight orbital control within a latitude band centered around 38 degrees, where many tectonics and volcanology areas are located. This allowed EnviSat to provide a detailed map of the ground displacements following the disastrous earthquake in Japan in March 2011.
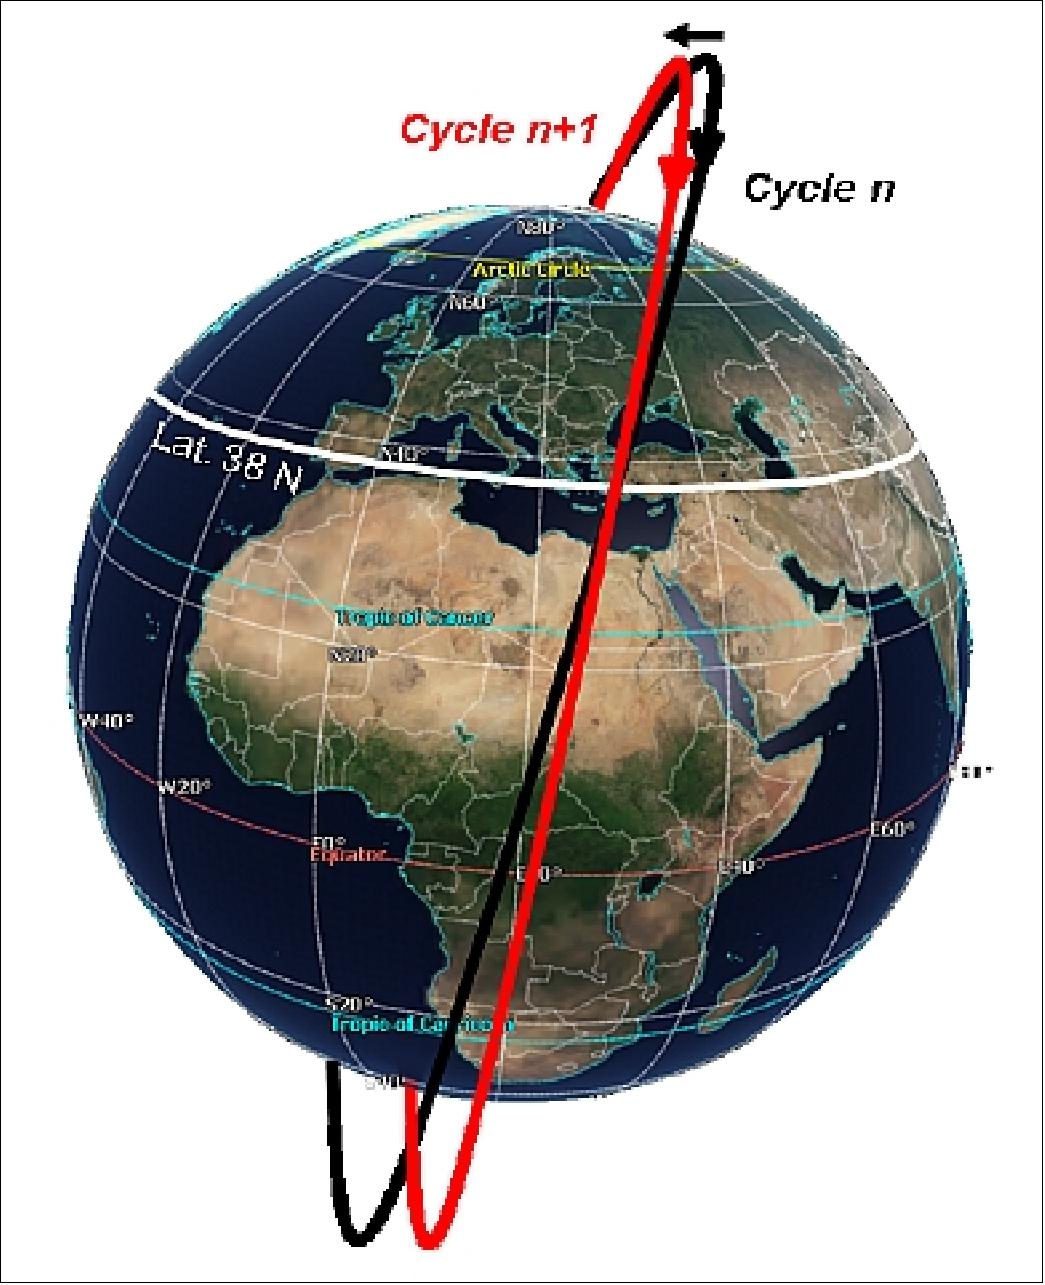
• 2011: The EnviSat spacecraft and its payload are operational in the extended mission phase (phase E3). The mission is expected to remain operational until sometime in 2014. However, in its new lower orbit of 783 km (since the end of Oct. 2010) with no orbit maintenance services, the orbit inclination will drift. 41) The new orbit configuration supports all current EnviSat applications except InSAR (SAR Interferometry) applications which will be supported with some restrictions. These restrictions are due to the drift of the on-ground satellite track, as a consequence of discontinuing the orbit inclination control. For this reason, a refinement will be implemented on the new orbit configuration to mitigate the negative impact on InSAR applications: the orbital node will be rotated to minimise the InSAR baseline drift at a pre-defined latitude of 38º, instead of the equator. This will allow maintaining DinSAR (Differential SAR Interferometry) applications over a narrow geographical latitude range covering most of the major tectonic and volcanic areas. The rotation of the orbital node around 38º N on descending node allows for covering South Italy, California, Turkey, Iran, and Japan (Figure 25).
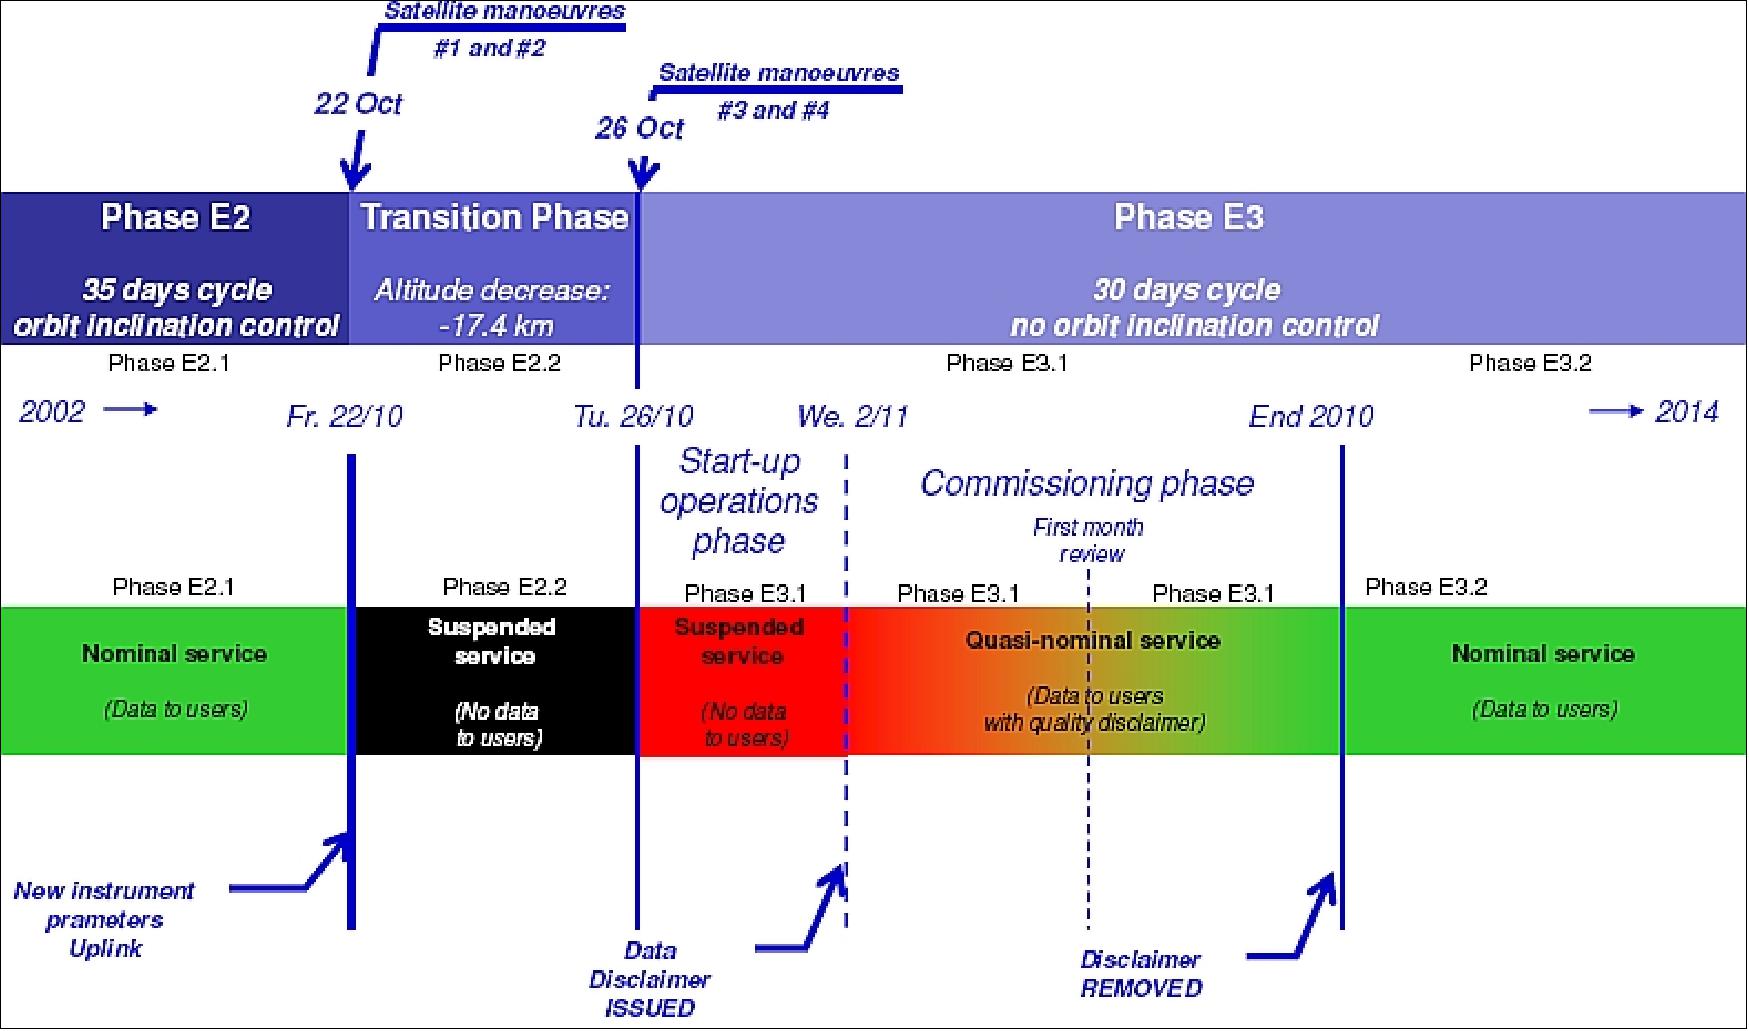
• October 26, 2010: The EnviSat project of ESA is reporting that the EnviSat orbit has been lowered to an altitude of ~783 km ("EnviSat2010+). EnviSat's instruments were slowly switched back on starting on 27 October, and the satellite is now gradually resuming its normal activities. A mini-commissioning phase is scheduled for November and December 2010. 43) By the end of 2010, most of the onboard hydrazine of EnviSat would be exhausted. However, concerns were expressed by the user community about the expected data gap starting in the fall of 2010 between EnviSat and the next generation of EO satellites, in particular the Sentinel missions. Hence, a new concept for extending the EnviSat mission even beyond 2010 has therefore been analysed and defined by the ESA internal "EnviSat 2010+" project, which is based on an altitude lowering and a new orbit control concept. 44)
• July 2010: Adding to their unique information from previous tandem missions, ESA's ERS-2 and EnviSat satellites were paired up again – for the last time. Data from this final duet are generating 3D models of glaciers and low-lying coastal areas. 45) The fourth tandem interferometric campaign, from July to October 2010, focused on low-lying coastal areas, such as New Orleans in the USA and the Po River Mouth in Italy. This information will be used for various applications in many different fields, in particular for creating accurate DEMs of coastal areas that could be used to help manage floods.
• February 2010: EnviSat / ERS-2 SAR tandem interferometry mission. The third pairing took place from February to April 2010 with both satellites acquiring radar data for the first time over Antarctica's coastal glaciers and ice shelves just 30 minutes apart.
• May 2010: ESA provided freely available SAR datasets of EnviSat and ERS-2 to the user community in the aftermath of the devastating Haiti earthquake which took place on Jan. 12, 2010. 46) The EnviSat platform and payload complement show an overall excellent status after eight years of operations. Some sporadic known instrument anomalies are quickly recovered; new ones are taken care of by specialist teams. The average availability (actual vs. planned) of the payload complement has increased from 91.9 % (2003) to 99.2% (2008). In some cases, slight degradations in performance can be attributed to aging, in a few cases, onboard redundant elements had to be activated after problems occurred on the respective prime sides. The overall status is summarised in Table 2 (Ref. 44).
Instrument or subsystem | Type | Status | Grade |
ASAR | Payload | Data subsystem on redundant side. 26 T/R Modules partly/not available. | Good |
MERIS | Payload | Nominal performance | Excellent |
AASTR | Payload | Nominal performance | Excellent |
RA-2 | Payload | Both supporting S-band transmitters failed, main Ku channels ok. | Good |
MWR | Payload | 36.6 GHz channel degradation, corrected on ground | Good |
DORIS | Payload | Redundant side in use | Good |
SCIAMACHY | Payload | Nominal performance | Excellent |
MIPAS | Payload | Nominal performance in reduced resolution | Excellent |
GOMOS | Payload | Instrument on redundant side, B-side mirror degradation | Fair |
PEB | Data handling | Constant 4-Byte shift in the HK telemetry data stored in the X-band data stream; Ka-band antenna elevation heater permanently failed – heating through direct solar radiation in parking position. | Good |
Power/Thermal | Platform | Nominal performance | Excellent |
Central flight software | Onboard software | Nominal; since Nov 2006 several permanent single bit errors affecting one of the two memory modules, | Good |
Propulsion, fuel | Platform | Main limiting factor of the mission | Critical |
• June 2009: The ESA Member States unanimously voted to extend the EnviSat mission through to 2013. The decision to extend the EnviSat mission operations, taken during the last ESA Earth Observation Program Board meeting, is a recognition of the success of the mission, in terms of the wide number of scientific and operational users served and the good technical status of the satellite after seven years of operations. 49)
• December 2007: A similar problem, to November 2006, affected another page of the prime memory module. The risk of mission interruption caused by the increased probability of a double-bit error being detected could only be reduced by switching to the redundant memory module. 53)
- In view of probable additional memory degradations, a number of software evolution activities were initiated with Astrium SAS: making the central flight software more robust to double-bit errors detected in the redundant memory, modifying the scrubbing routine to allow the exclusion of address ranges from the scrubbing itself or only at the reporting level and reviewing the CFS (Central Flight Software) in view of the removal of functions specific to the LEOP (Launch and Early Orbit Phase) and not used for the routine phase. An extension to the EnviSat operational lifetime was under discussion at the time of the second memory page anomaly and it was clear that failure to recover some memory redundancy could jeopardise approval. This was achieved by modifying the FDIR (Failure Detection Isolation and Recovery) behavior in case of a double-bit flip detection in redundant memory and improving the scrubbing task to make it tolerant to permanent errors Ref 53).
• September 2007: EnviSat / ERS-2 SAR tandem interferometry missions. The objective was to measure the velocity of fast-moving polar glaciers (> 200 m/year). ERS/EnviSat SAR data should be suited to map velocities of 1 cm between the two 30-minute passes and to generate accurate low-relief Digital Elevation Models. This is of particular interest for many low-elevation delta regions, in particular for polar areas (North Canada, North Russia) where there is no available SRTM DEM information. 51)
- The second tandem mission started on November 23, 2008, and ended in late April 2009 (both spacecraft acquired data over the same area just 28 minutes apart). The second campaign was due to end in late January 2009 but could be extended through to late April 2009 due to the excellent performance of the satellites and the strong teamwork between the mission data teams at ESRIN, and ESOC. After the completion of the tandem mission, ERS-2 drifted naturally (without maneuvering) to its reference orbit. 52) The first SAR tandem mission took place from September 2007 to February 14, 2008. This required a temporal modification of the ERS-2 orbit (2 km offset versus nominal ground track) to have optimal interferometric baselines between ERS-2 and EnviSat (30 min. separation).
• March 01, 2007: An anomaly of the USO (Ultra Stable Oscillator) was affecting the RA-2 instrument operations since Feb. 2006. As of March 1, 2007, the altimetric range jump, provoked by the USO anomaly, has been compensated through on-ground corrections of the RA-2 data.
• Janruary 2007: Fuel budget: The consumption of hydrazine for the routine orbit control is satisfactory. The current hydrazine availability, approximately 165 kg, should allow nominal operation of the satellite up to 2010 (theoretical maximum assuming no anomalies and current orbit control strategy). Mission extension: EnviSat initially intended to stay in orbit for five years. However, given the overall excellent standing of the satellite and its sensor complement, the ESA Ministerial Council agreed in December 2005 in Berlin, Germany, to fund the EnviSat mission until 2010. This decision was driven by requests from the Earth Science community and the need to fulfill the needs of the GMES program in its early phase. 57)
• November 06, 2006: A sudden jump was observed in the number of memory single event upsets reported by the Service Module. The problem was isolated by using memory redundancy. A memory test function was developed by Astrium SAS and loaded onboard as a patch. Analysis performed using this led to a diagnosis of a bit plane failure affecting an unknown number of memory cells in the prime memory module.
• April 2006: The instrument performance is regarded as "fair", and the radiometric and spectral performance is regarded as excellent. 54) 55) 56)
• August 2005: The GOMOS instrument performs again very satisfactorily since operations resumed with a reduced azimuth range observation (implementation of a workaround solution allowing the tracking of the most interesting stars).
• January 2005: MIPAS provided measurements at a reduced spectral resolution (about 40%) on a regular basis, but not continuously: According to the PI, the information content was only insignificantly reduced. GOMOS experienced a major failure on the nominal side since February 2003. The performance of the Steering Front Mechanism of the redundant side degraded since January 2005, due to the malfunctioning of the Telescope Elevation Drive. Since January 2005, the GOMOS instrument data measurements were suspended, following an anomaly preventing the instrument from rallying targeted stars.
• March 26, 2004: The MIPAS instrument switched off, due to a problem with moving retroreflectors. The MIPAS instrument operated at reduced spectral resolution for tests in August and December 2004.
• January 28, 2004: ESA's EnviSat spacecraft completed its ten thousandth orbit of the Earth. 58)
• 2003: Routine operations of EnviSat started.
Sensor Complement
Sensor operations strategy: Continuous operations around the orbit of GOMOS, MIPAS, SCIAMACHY, AATSR, RA-2, MWR, and DORIS. Onboard recording of all the above-mentioned low-rate instrument data outside the visibility range of ESA X-band stations. 59)
ASAR can be operated in the high-rate mode for up to 30 minutes per orbit, including 10 minutes in the eclipse phase. MERIS can be operated only out of eclipse and when the sun's zenith angle at the subsatellite point is less than 80º (this corresponds to about 43% of the orbit).
1) Instruments provided by ESA
- MERIS (Medium Resolution Imaging Spectrometer)
- MIPAS (Michelson Interferometer for Passive Atmospheric Sounding)
- RA-2 (Radar Altimeter-2, a Laser Retro-Reflector (LRR) is included)
- MWR (Microwave Radiometer)
- ASAR (Advanced SAR)
- GOMOS (Global Ozone Monitoring by Occultation of Stars), chemistry and dynamics of the upper atmosphere
2) Announcement of Opportunity (AO) Instruments
- SCIAMACHY (Scanning Imaging Absorption Spectrometer for Atmospheric Cartography, provided by Germany and The Netherlands)
- AATSR (Advanced Along Track Scanning Radiometer, provided by the UK and Australia), see also ATSR (ERS-1, -2)
- DORIS, provided by France
MERIS (Medium Resolution Imaging Spectrometer)
MERIS is a passive optical pushbroom wide-field instrument (CCD technology) intended to measure reflected radiation from the Earth's surface, the ocean, and from clouds with high spectral resolution (high radiometric resolution in the VIS range). MERIS features individual gain settings to optimise the dynamic range of each of its fifteen bands (the ability to reprogram the position and width of the spectral bands in flight). MERIS was built by Alcatel Space Industries, France (formerly Aerospatiale). 60) 61) 62) 63)
MERIS objectives/applications:
- Ocean: monitoring marine biophysical and biochemical parameters (chlorophyll, gelbstoff concentrations, suspended particles). Mapping of sea pollution, coastal erosions, sea ice.
- Atmosphere: monitoring cloud distribution, cloud altitude, water vapor column content, aerosols
- Land: monitoring vegetation/biomass, inland water, agriculture/forestry. Mapping snow and ice, vegetation stress, and calamities (fires) 64)
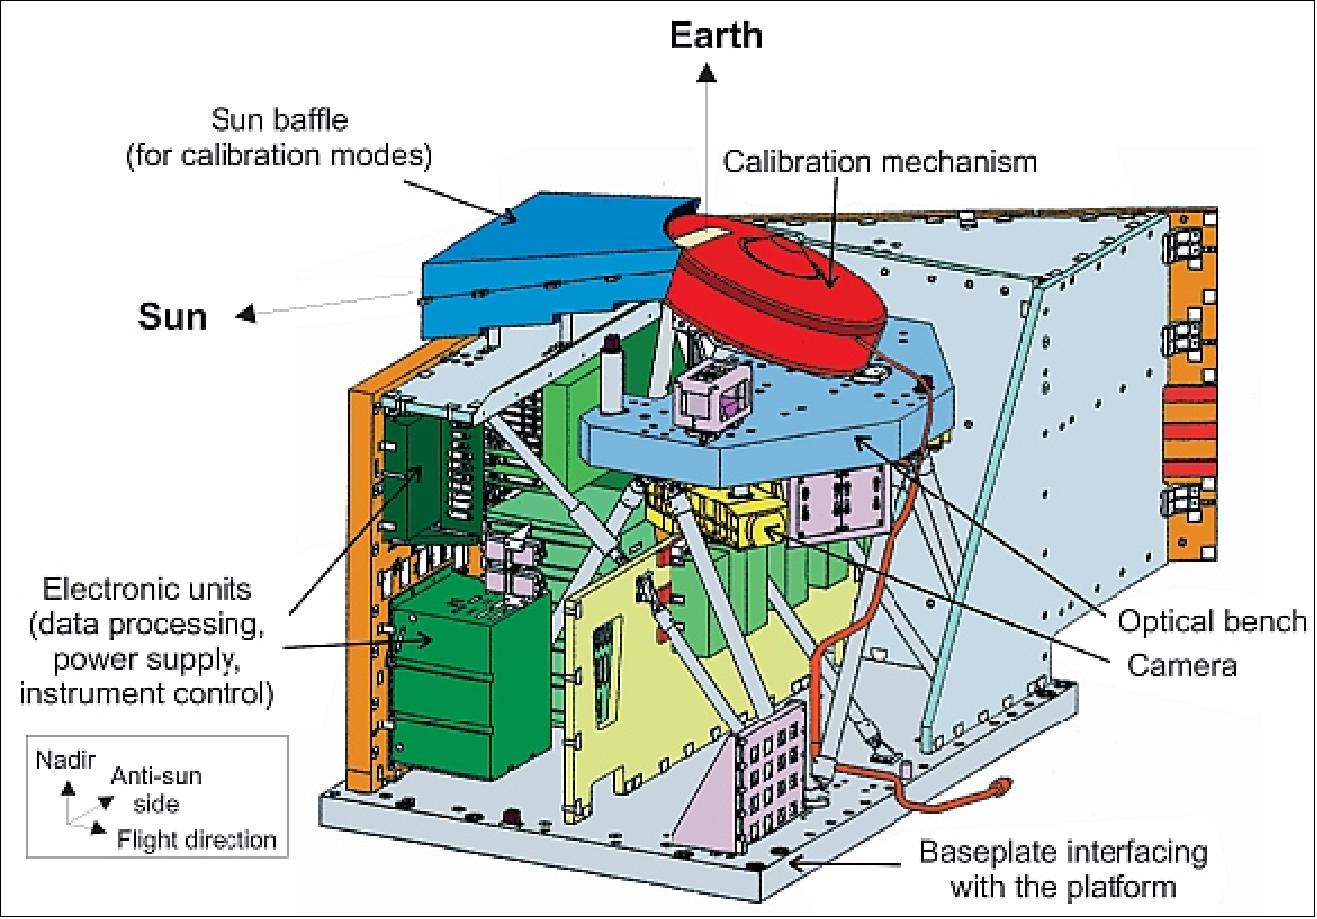
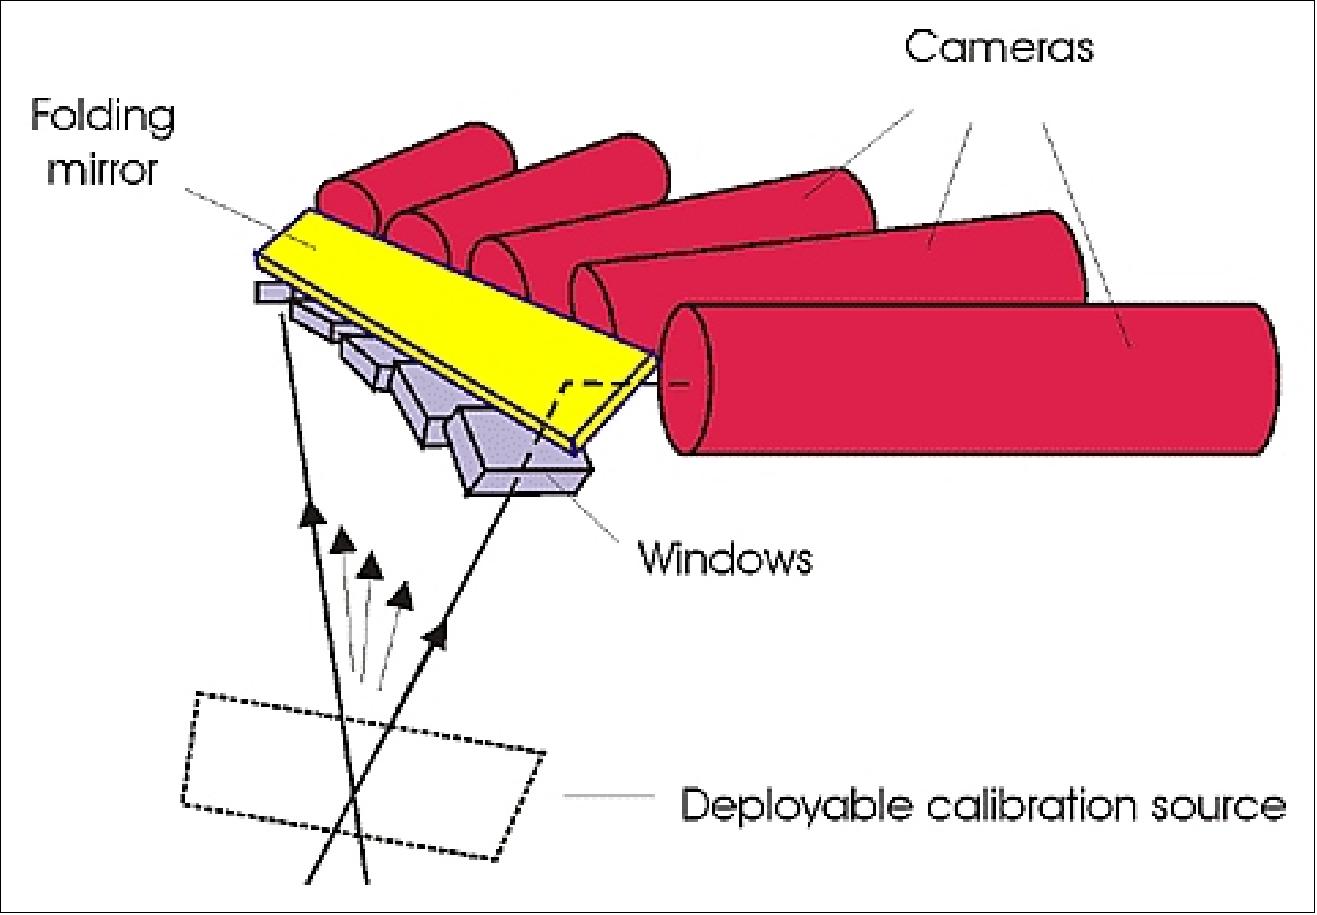
The MERIS instrument is a programmable, high-spectral resolution imaging spectrometer measuring in the spectral region of 390 - 1040 nm. The total swath is covered by five identical modules (cameras) each having a 14º FOV, with 0.4º overlap between adjacent cameras (1150 km total swath, with a FOV of 68.5º). The cameras are arranged in a fan-shaped configuration and view the Earth through five depolarising windows with a common depointing prism.
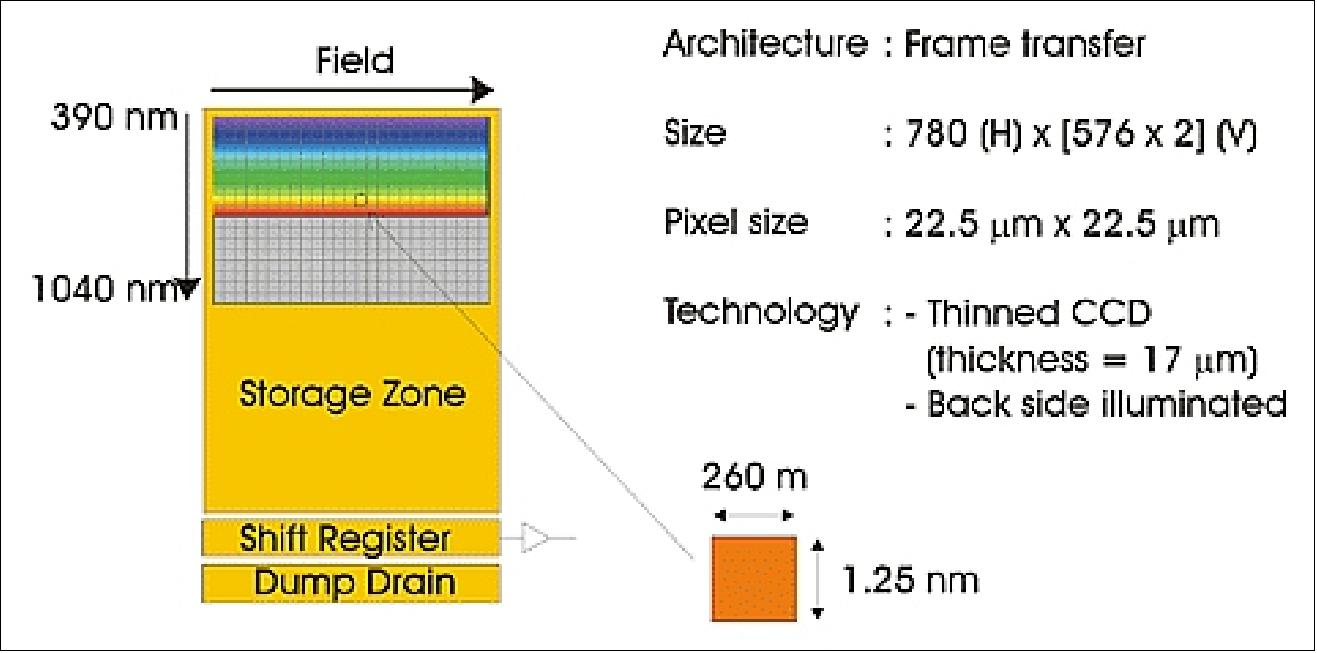
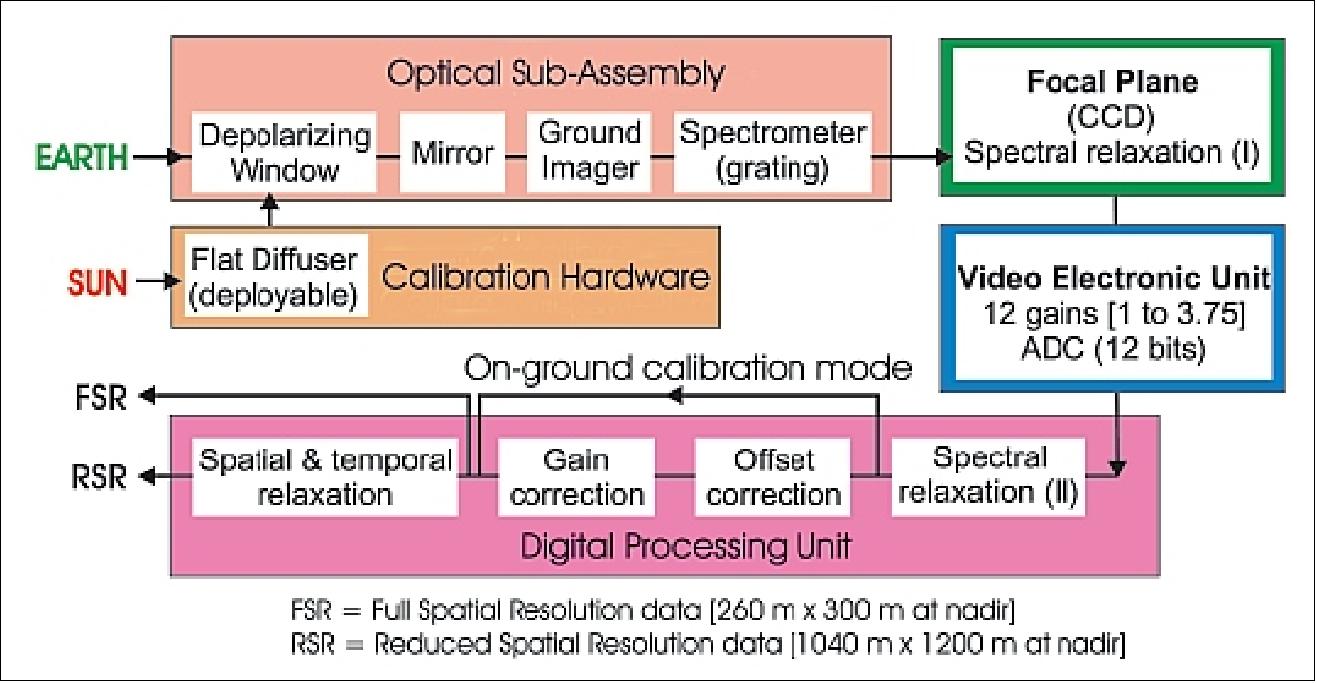
An image is formed at the entrance slit of a grating imaging spectrometer, which disperses the image spectrum on an area array CCD detector matrix (576 lines x 780 columns, the element size is 22.5 µm x 22.5 µm). The CCDs (thinned backside illuminated) are operated in frame-transfer mode. The CCDs are coupled to a Peltier cooler to keep the temperature at -22ºC. A five-channel VEU (Video Electronic Unit) performs 12-bit A/D conversion of the video signals provided by the five CCDs (each CCD has 740 useful pixels per line and 576 lines). After onboard digital conversion, the data is corrected in real-time with the calibration coefficients to produce raw image data in 15 spectral bands. 65) 66) 67)
The MERIS optics subsystem consists of an external window, a folding mirror, an off-axis catadioptric-ground imager, and a spectrometer of concentric design. The windows are used to scramble the incident polarised radiation thereby making the instrument less sensitive to polarisation changes. The dispersive element of the spectrometer is a low-groove-density holographic grating.
Instrument calibration is performed at the orbital south pole, where the calibration flat-plate diffuser is illuminated by the sun by rotating a calibration mechanism (the reference for absolute calibration is based on an assumed solar irradiance at the time of calibration).
Four in-flight calibration sequences are defined:
• Dark calibration, During calibration the signal is recorded with the Earth and sun aperture closed to provide, in the case of radiometric calibration, a uniform (spectrally and spatially) radiance source, and in the case of spectrometric calibration, a radiance source with a spectral signature.
• Radiometric gain calibration (a white diffuser plate, the sun illuminated, is inserted at the cross-over point of the five cameras FOVs). The diffuser provides a reflectance standard across the entire spectral range and FOV.
• Diffuser aging characterisation (exposure to the sun for 1 hr during the mission life)
• Wavelength referencing (another diffuser is used with known absorption peaks)
Spectral characteristics: |
|
Radiometric characteristics: |
|
Spatial resolutions: |
|
Integration time/frame | about 44 ms |
TFOV, swath width | ±34.2º or about 1150 km, providing global coverage every 3 days. |
Operational modes: |
|
Data localisation accuracy | < 2 km without use of landmarks |
Instrument mass, power, size | 200 kg, 175 W (average), 1.8 m x 0.9 m x 1.0 m |
Band No. | Band center (nm) | Bandwidth (nm) | Application |
1 | 412.5 | 10 | Yellow substance and turbidity |
2 | 442.5 | 10 | Chlorophyll absorption maximum |
3 | 490 | 10 | Chlorophyll and other pigments |
4 | 510 | 10 | Turbidity, suspended sediment and red tides |
5 | 560 | 10 | Chlorophyll, suspended sediment |
6 | 620 | 10 | Suspended sediment |
7 | 665 | 10 | Chlorophyll absorption |
8 | 681.25 | 7.5 | Chlorophyll fluorescence, red edge |
9 | 708.75 | 10 | Aerosol, red edge transition |
10 | 753.75 | 7.5 | Oxygen absorption reference band, vegetation |
11 | 760.625 | 3.75 | O2 absorption R-branch |
12 | 778.75 | 15 | Aerosol, vegetation |
13 | 865 | 20 | Aerosols correction over ocean |
14 | 885 | 10 | Water vapor absorption reference |
15 | 900 | 10 | Water vapor absorption, vegetation |
MERIS operation:
The MERIS instrument can only observe out of eclipse and when the sun's zenith angle at the subsatellite point is below 80º. The instrument can be operated either in "averaging" or in "direct and averaging" observation modes. In averaging mode, the data are spatially averaged onboard to produce an additional but separate data stream at 1200 m resolution, referred to as RSR (Reduced Spatial Resolution). When in direct and averaging mode, the instrument delivers, in addition to the RSR data, FSR (Full Spatial Resolution) data at 300 m resolution in the same 15 spectral bands. FSR data is available for up to 20 minutes per orbit.
MIPAS (Michelson Interferometer for Passive Atmospheric Sounding)
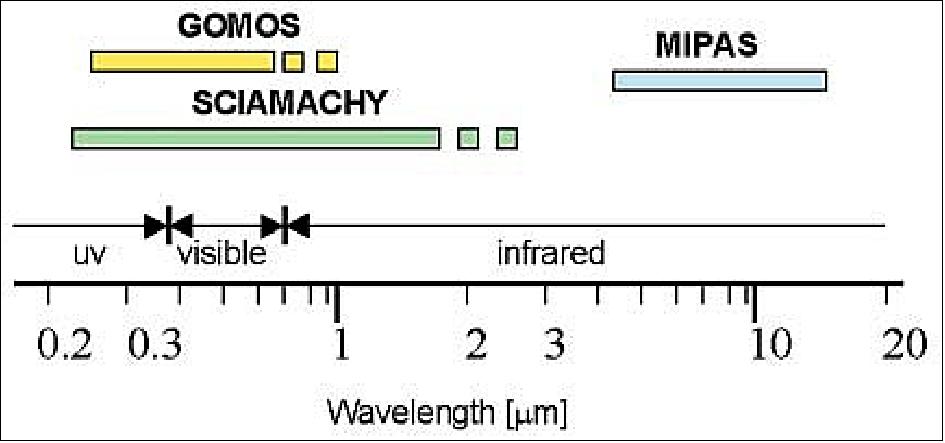
MIPAS is a high-resolution FTS (Fourier-Transform Spectrometer) instrument designed to measure concentration profiles of atmospheric constituents on a global scale. MIPAS is a limb emission sounding instrument operating in the spectral region between 4.15 and 14.6 µm (685-2410 cm-1), observing during the day and night phases of the orbit, measuring simultaneously a large variety of relevant trace gases (over 20), including the complete family of nitrogen-oxygen compounds and several CFCs, especially in the stratosphere and in cloud-free regions in the upper troposphere. In 1989 ESA selected MIPAS as an `ESA developed instrument' for the POEM/EnviSat program. The MIPAS satellite instrument development by EADS Astrium GmbH (as prime contractor, formerly DASA/DSS) resulted from a heritage of airborne MIPAS instruments. 68) 69) 70) 71) 72) 73)
Major MIPAS objectives:
• Chemistry of the stratosphere: O3 (global and polar), NO, NO2, HNO3, HNO4, N2O5, ClONO2, COF2, HOCl.
• Climate research: (global distribution of relevant parameters and clouds) eg., O3, CH4, H2O, N2O, CFCs, (F11, F12, F22, CCl4, CF4), CO, OCS, aerosols and clouds.
• Transport processes (tropospheric-stratospheric exchange): O3, CH4, N2O, C2H2, C2H6, SF6
• Upper tropospheric chemistry: NO, CO, CH4, O3, HNO3
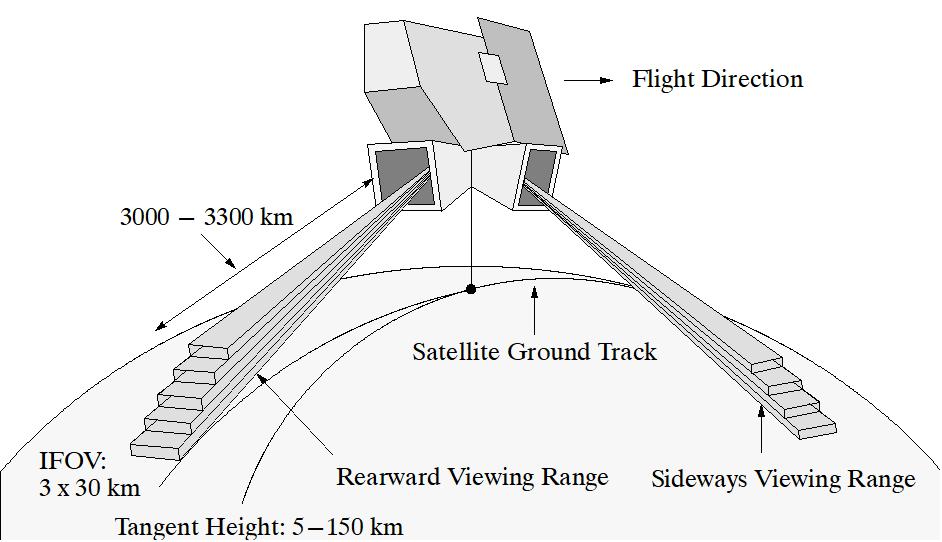
MIPAS makes measurements in either of two pointing regimes: rearwards within a 35º wide range (anti-flight direction), and sideways within a 30º wide range on the anti-sun side. The rearward viewing geometry is the prime measurement mode of MIPAS. The sideways observation mode is intended to cover special events (volcanic eruptions, etc.). As a result of the limb viewing geometry, the distance between the instrument and the tangent point of the target area is between 3000 and 3300 km, depending on the tangent height.
MIPAS measures a series of spectra from different tangent heights. The spectrometer transforms the spectra into a modulated signal, the interferogram, where all IR bands are present simultaneously. The spectrometer output consists of such interferograms for each observed scene. One basic elevation scan sequence comprises 16 high-resolution spectra (or up to 75 spectra with reduced spectral resolution) and takes 75 seconds. A typical elevation scan starts at about 50 km tangent height and descends in 3 km steps to 8 km (any limb heights from 150 km downwards in 5 km steps can be performed). Instrument pointing accuracy is of utmost importance to measure at a predetermined limb height with a standard deviation below 600 m. This in turn requires an S/C pointing knowledge of > 0.01º (1 σ) to the nadir.
The MIPAS instrument has a total mass of 327 kg and power consumption of 210 W.
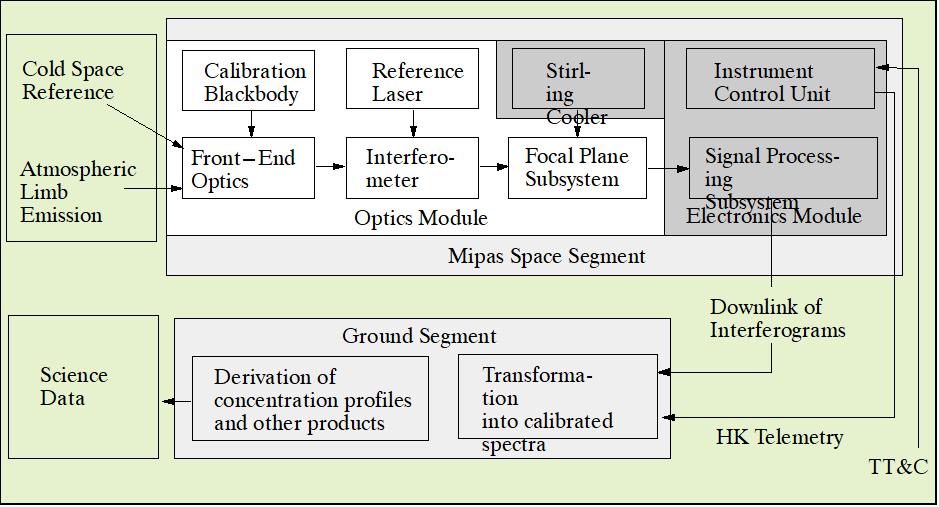
It consists of the following basic modules:
• Optics module: with front-end optics (comprising the azimuth and elevation scan units and a receiving telescope), Michelson interferometer, focal plane subsystem, calibration blackbody, and reference laser.
• Electronics module: with signal processing subsystem, instrument control unit, and Stirling cooler, on a common carrier plate.
Observation geometry |
|
Spectral coverage |
|
Radiometric parameters |
|
Measurement duration |
|
Instrument operation | continuously over full orbit |
From the telescope, the radiation is directed to the interferometer. The input signals are divided at the beamsplitter inside the interferometer and directed to cube corners moving at a constant velocity of 25 mm/s along a path of 100 mm. This permits a spectrum to be recorded in 4s. Depending on the optical path difference in the two interferometer arms, the recombined signal is an intensity-modulated interferogram.
[The Michelson interferometer provides an unapodized spectral resolution of better than 0.035 cm-1 throughout the spectral range. This is necessary to resolve the lines in the spectrum and to reduce the interference of overlapping spectral features. With this high spectral resolution, MIPAS provides a total of about 60,000 independent spectral samples in each spectrum.]
- The output signal (interferogram) enters the focal-plane subsystem where beam size matching, beam splitting, and optical filtering are performed. After optical filtering, the input spectrum is separated into eight narrow spectral bands for detection by eight HgCdTe detectors operating at about 70 K for maximum sensitivity. The detectors are of the photoconductive type in the spectral region from about 7-14.6 µm, and of the photovoltaic type in the region 4-7 µm. The detectors are cooled by a pair of synchronised Stirling cycle coolers. The detector output is filtered and compressed in the signal processing subsystem, which outputs the interferograms and ancillary data for ground processing. 74)
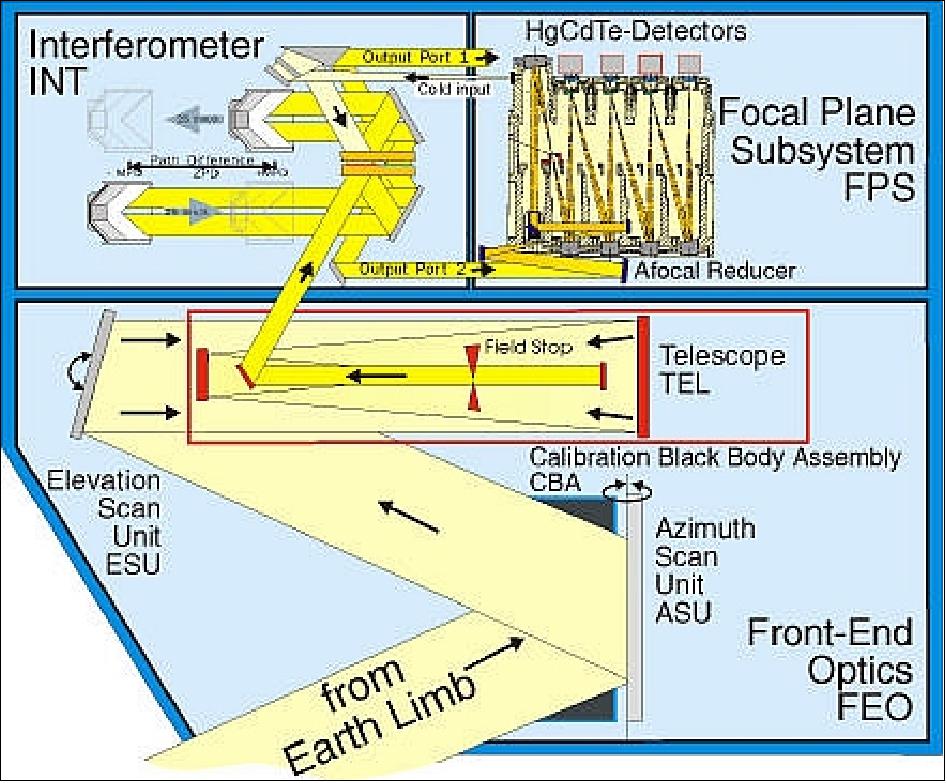
The calibration blackbody is mounted in the azimuth scan unit, it is used for the in-flight calibration of the instrument responsivity. MIPAS performs regular in-orbit calibration sequences.
• Radiometric offset calibration: This is done every two to four scans and prior to every elevation scan sequence to correct for the instrument's self-emission
• Gain calibration: This occurs about once a week, applying a two-point calibration method, where radiances from deep space and an internal blackbody are observed in sequence.
• Line of sight calibration (used for inflight determination of the line-of-sight pointing direction): Performed every week. This is based on star observations crossing the instrument FOV and subsequent correlation of actual and predicted time of star crossing.
• Spectral calibration: Performed every two scans. The calibration parameters are retrieved from subsets of the atmospheric limb measurements so that the routine scene data acquisition is not interrupted.
• Instrument line shape calibration is performed once a week. This involves retrieval from subsets of the routine scene data.

MIPAS instrument status 2008
The MIPAS instrument switched off on March 26, 2004, due to a problem with moving retroreflectors. Since then, the MIPAS instrument has been operated at reduced spectral resolution for tests in August and in December 2004. Since January 2005, MIPAS is providing measurements at a reduced spectral resolution (about 40%) on a regular basis, but not continuously: According to the PI, the information content is only insignificantly reduced. 75)
Particular achievements of MIPAS (2012): 76)
• MIPAS has clearly demonstrated the power of high-resolution infrared limb-emission spectroscopy
- high selectivity, over 30 trace gases, often unique
- excellent vertical resolution, data during day and night
- stability and maturity of infrared technology
• 10 years of operation: a broad variety of applications
- stratospheric chemistry and ozone
- chemistry and transport in the upper troposphere
- mesospheric processes and vertical couplings
- trends, climatologies, global circulation.
ASAR (Advanced SAR)
ASAR is of AMI heritage flown on ERS-1/2 (built by MMS, UK, now EADS Astrium Ltd.).
It measures the radar backscatter of the Earth's surface at C-band with a choice of five polarisation modes:
- VV,
- HH,
- VV/HH,
- HV/HH,
- or VH/VV.
The ASAR instrument comprises two major functional groups, the Antenna Subassembly (ASA), and the Central Electronics Subassembly (CESA).
The antenna array contains 20 tiles (each 1 m x 0.65 m in size) with 16 transmit/receive (Tx/Rx) modules each. The transmit pulse characteristics are: the output is a linear FM up-chirp pulse centered at 124 MHz of the IF carrier. In the RF subsystem, the pulse is up-converted to the RF frequency (5.331 GHz) and amplified. The signal is then passed to the Tx/Rx modules in the tile subsystem.
- In general, the use of digital technologies for signal generation and processing is implemented. These permit chirp versatility in terms of pulse duration and bandwidth required for the operational modes and various swaths of the instrument. On reflection, the AMI of ERS-1/2 used SAW devices for analog chirp generation. 77) 78) 79) 80) 81) 82)
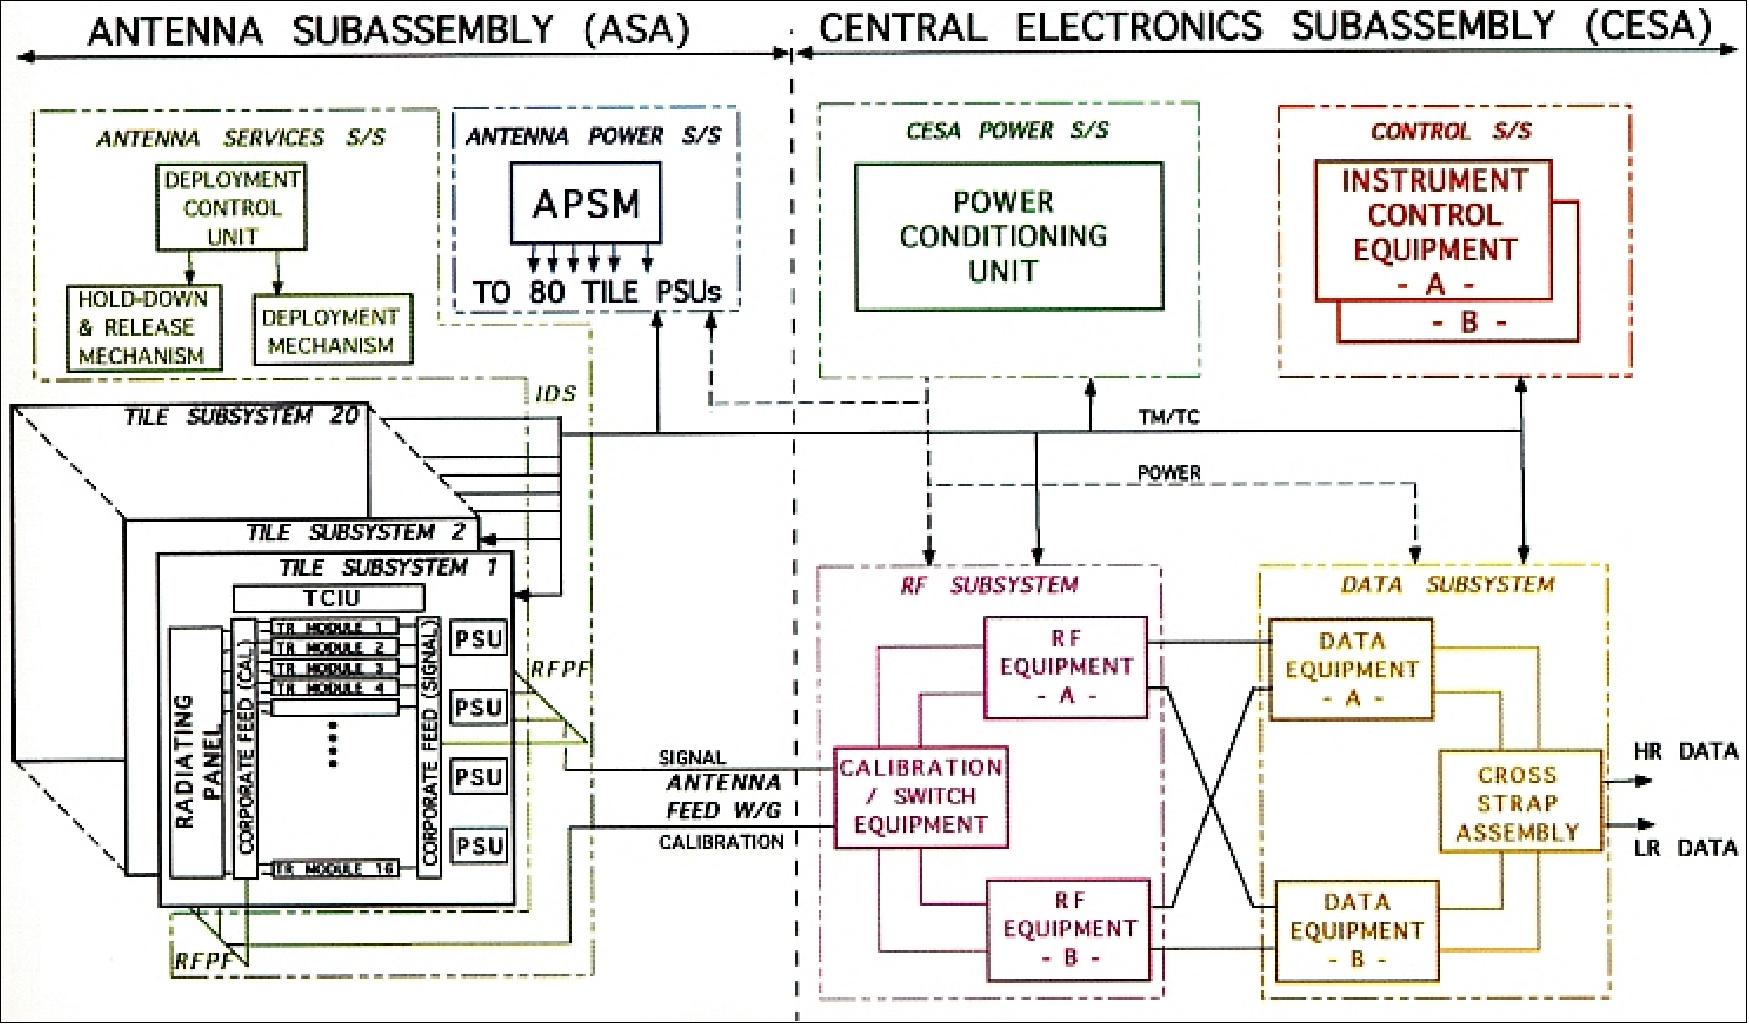
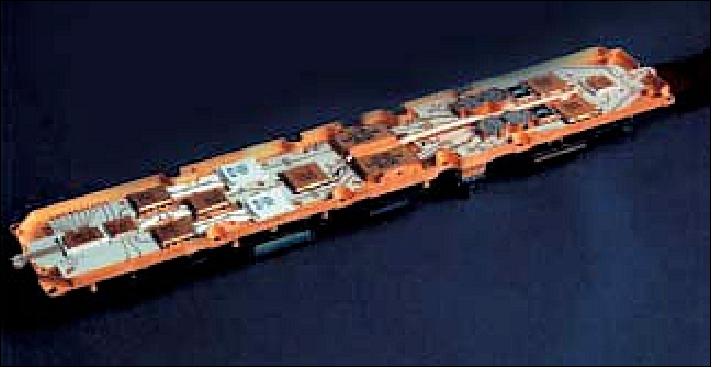
The ASAR active antenna is a phased array of size 1.3 m x 10 m with distributed Tx/Rx modules (320) arranged across the antenna, such that by adjusting individual module phases and gain, the transmit and receive beams may be steered and configured (independent control of the phase and amplitude of the transmitted radiators from different regions of the antenna surface). Use of GaAs MMIC (Monolithic Microwave Integrated Circuit) technology, based on field effect transistors, for amplifiers, switches, attenuators, and phase shifters.
ASAR also provides independent weighting of the received signal to each of these regions. This offers great flexibility in the generation and control of the radar beam, giving the ASAR instrument the capability to operate in a number of different modes (37 different and mutually exclusive high-rate operating modes). These modes use two principal methods of taking measurements; the ASAR instrument may operate as a conventional stripmap SAR or as a ScanSAR. 83)
ASAR stripmap modes (Image and Wave):
When operating as a stripmap SAR, the phased array antenna gives ASAR the flexibility to select an imaging swath by changing the beam incidence angle and the elevation beamwidth. In addition, the appropriate PRF required to ensure acceptable ambiguity performance and to suppress unwanted nadir returns is selected.
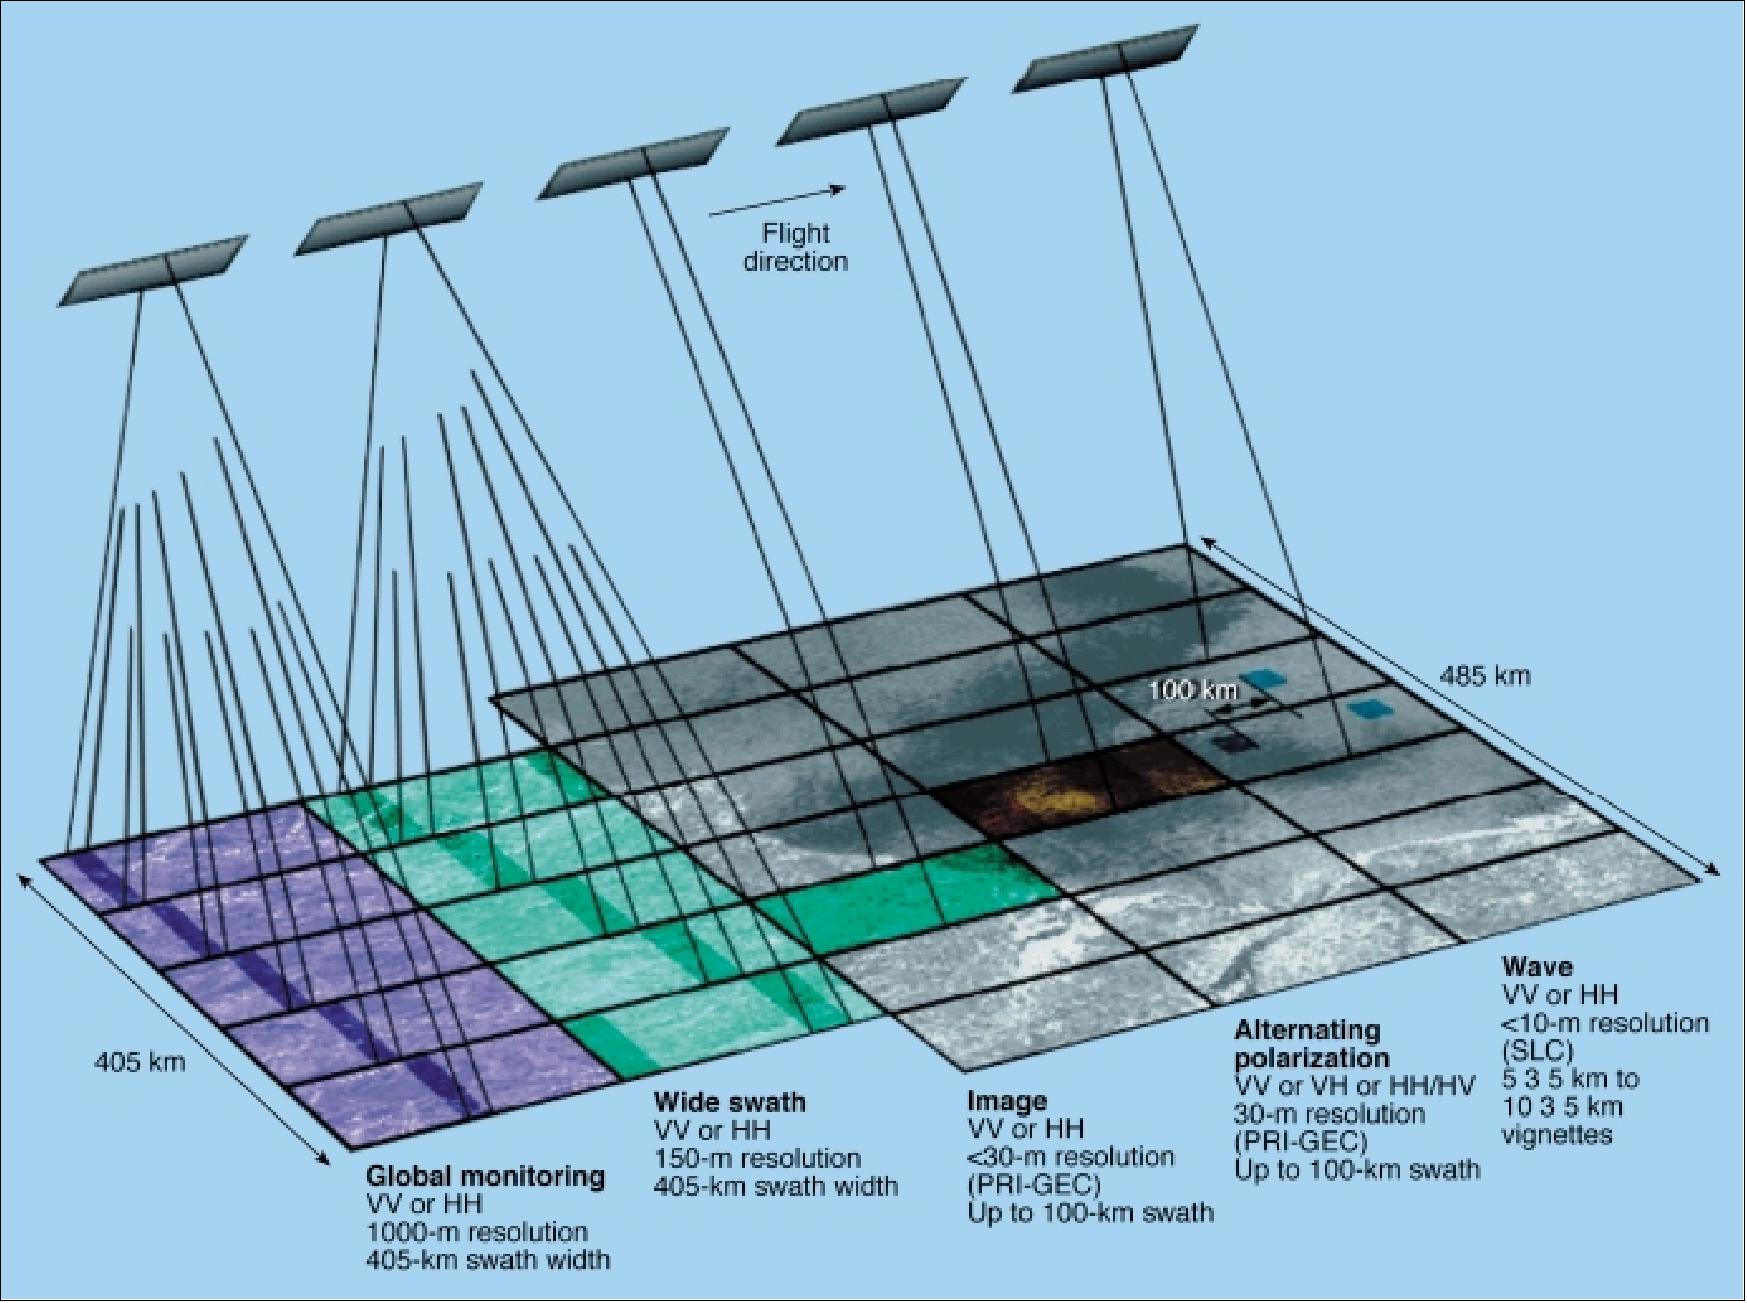
• Image mode: ASAR operates as an imaging radar collecting data in one of seven predetermined but relatively narrow swaths (up to 100 km within a viewing area of about 485 km) with high spatial resolution (30 m). The image mode provides continuous coverage over a single swath that can be pointed anywhere with 15-45º incidence angles. The transmit and receive polarisation may be either HH or VV.
• Wave mode: imaging of small areas of 5 km x 5 km (referred to as vignettes) in frequent intervals over along-track distances of 100 km on ocean surfaces. Measurement of the change in radar backscatter from the sea surface due to ocean surface waves. The wave mode uses the same swaths and polarisations as image mode. The intermittent operation provides a low data rate, such that the data can be stored on board the satellite, rather than being downlinked immediately to a ground station.
ASAR ScanSAR modes (Alternating polarisation, Wide swath, and Global monitoring)
The ScanSAR principle achieves swath widening by the use of an antenna beam that is electronically steerable in elevation. Radar images can then be synthesised by scanning the incidence angle and sequentially synthesising images for the different beam positions. The area imaged from each particular beam forms a sub-swath. The principle of the ScanSAR is to share the radar operation time between two or more separate sub-swaths in such a way as to obtain full image coverage of each. The system transmits pulses to and receives echoes from a sub-swath for a period long enough to synthesise a radar image of the area within the beam footprint at the required resolution. It then switches beams to illuminate a different sub-swath and continues in this manner until the full wide swath is covered. At this point, the system returns to the original sub-swath and the scanning cycle is repeated.
Operating Mode -> | Image Mode | Wide Swath Mode | Alternating/Cross Polarization | Wave Mode | Global |
Polarisation | VV or HH | VV or HH | VV/HH, | VV or HH | VV or HH |
Spatial resolution (along-track and cross-track) | 28 m x 28 m | 150 m x | 29 m x 30 m | 28 m x 30 m | 950 m x |
Radiometric resolution | 1.5 dB | 1.5-1.7 dB | 2.5 dB | 1.5 dB | 1.4 dB |
Swath width | up to 100 km | 400 km | up to 100 km | 5 km vignette | >=400 km |
Ambiguity ratio (point) |
|
|
|
|
|
Ambiguity ratio (distribution) |
|
|
|
|
|
Radiometric stability | 0.32-0.40 dB | 0.32-0.42 dB | 0.50-0.55 dB | 0.55-0.60 dB | 0.46-0.53 dB |
Noise equivalent σ0 | -22 to -22 dB | -21 to -26 dB | -19 to -22 dB | -20 to -22 dB | -32 to -35 dB |
Incidence angle range | 15-45º |
| 15-45º | 15-45º |
|
Center frequency | 5.331 GHz (C-band) | ||||
PRF | 1650 to 2100 Hz | ||||
Chirp bandwidth | up to 16 MHz | ||||
Antenna size | 10 m x 1.3 m (consisting of five 1.3 m x 2 m panels) | ||||
Operation (duty cycle) | up to 30 min/orbit | rest of orbit | |||
Data rate | up to 100 Mbit/s | 0.9 Mbit/s | |||
Power | 1365 W | 1200 W | 1395 W | 647 W | 713 W |
Instrument mass | 832 kg | ||||
• Alternating polarisation mode: provides a choice of HH or VV or cross-polarised imaging of the same scene by interleaving looks with each polarisation along tracks within the synthetic aperture. The mode employs a modified ScanSAR technique. Instead of scanning between different elevation sub-swaths, the alternating polarisation mode (co-polar) scans between two polarisations, HH and VV, within a single swath (which is preselected, as for image and wave modes).
• Wide swath mode: continuous image coverage over a swath width of 405 km (or more), divided into five subspaths ranging from 60 to 100 km in width; the spatial resolution is 150 m.
• Global monitoring mode: provides continuous along-track sampling across a 405 km swath. Allows ASAR to be operated in a reduced spatial resolution mode of 1000 m (with a corresponding reduced data rate for onboard recording). Global monitoring of features such as ice or snow coverage, deforestation, desertification or humidity.
Application
The main objective of ASAR is to provide information on:
- ocean waves,
- sea ice extent and motion,
- snow and ice extent,
- surface topography,
- land surface properties,
- Earth's biomass (especially deforestation in equatorial zones),
- surface soil moisture and wetland extent.
Important applications by ASAR to the global mission include 84)
- Measuring sea-state conditions at various scales
- Mapping ice-sheet characteristics and dynamics
- Mapping sea-ice distribution and dynamics
- Detecting large-scale vegetation changes
- Monitoring natural and man-made pollution over the oceans.
Some ASAR applications for the regional mission are in the following areas:
- Offshore operations in sea ice
- Snow and ice mapping
- Coastal protection and pollution monitoring
- Ship traffic monitoring
- Agriculture and forest monitoring
- Soil moisture monitoring
- Geological exploration, topographic mapping
- Predicting, tracking, and responding to natural hazards
Compared with AMI of ERS-1/2, a single-channel fixed-geometry instrument, ASAR represents a step forward in system flexibility and the scientific value of the data sets.
The new features of ASAR are:
- A digital chirp generator and an improved linear dynamic range
- Flexible swath positioning offers the choice among several image swath positions at various distances from the sub-satellite track, i.e. with different incidence angles
- The dual polarisation capability offers simultaneous operation at H, V, and cross-polarisation combinations
- Wide-swath coverage offers a 405 km swath with 150 m or 1 km resolution imagery
- The enhanced wave-mode acquires imagettes at 100 km intervals in along-track
- An extended duty cycle (operating time) is available at high resolution (30 min of operation, 10 min eclipse)
- Global SAR coverage is possible by using a solid-state onboard recorder and a data relay satellite (ARTEMIS).
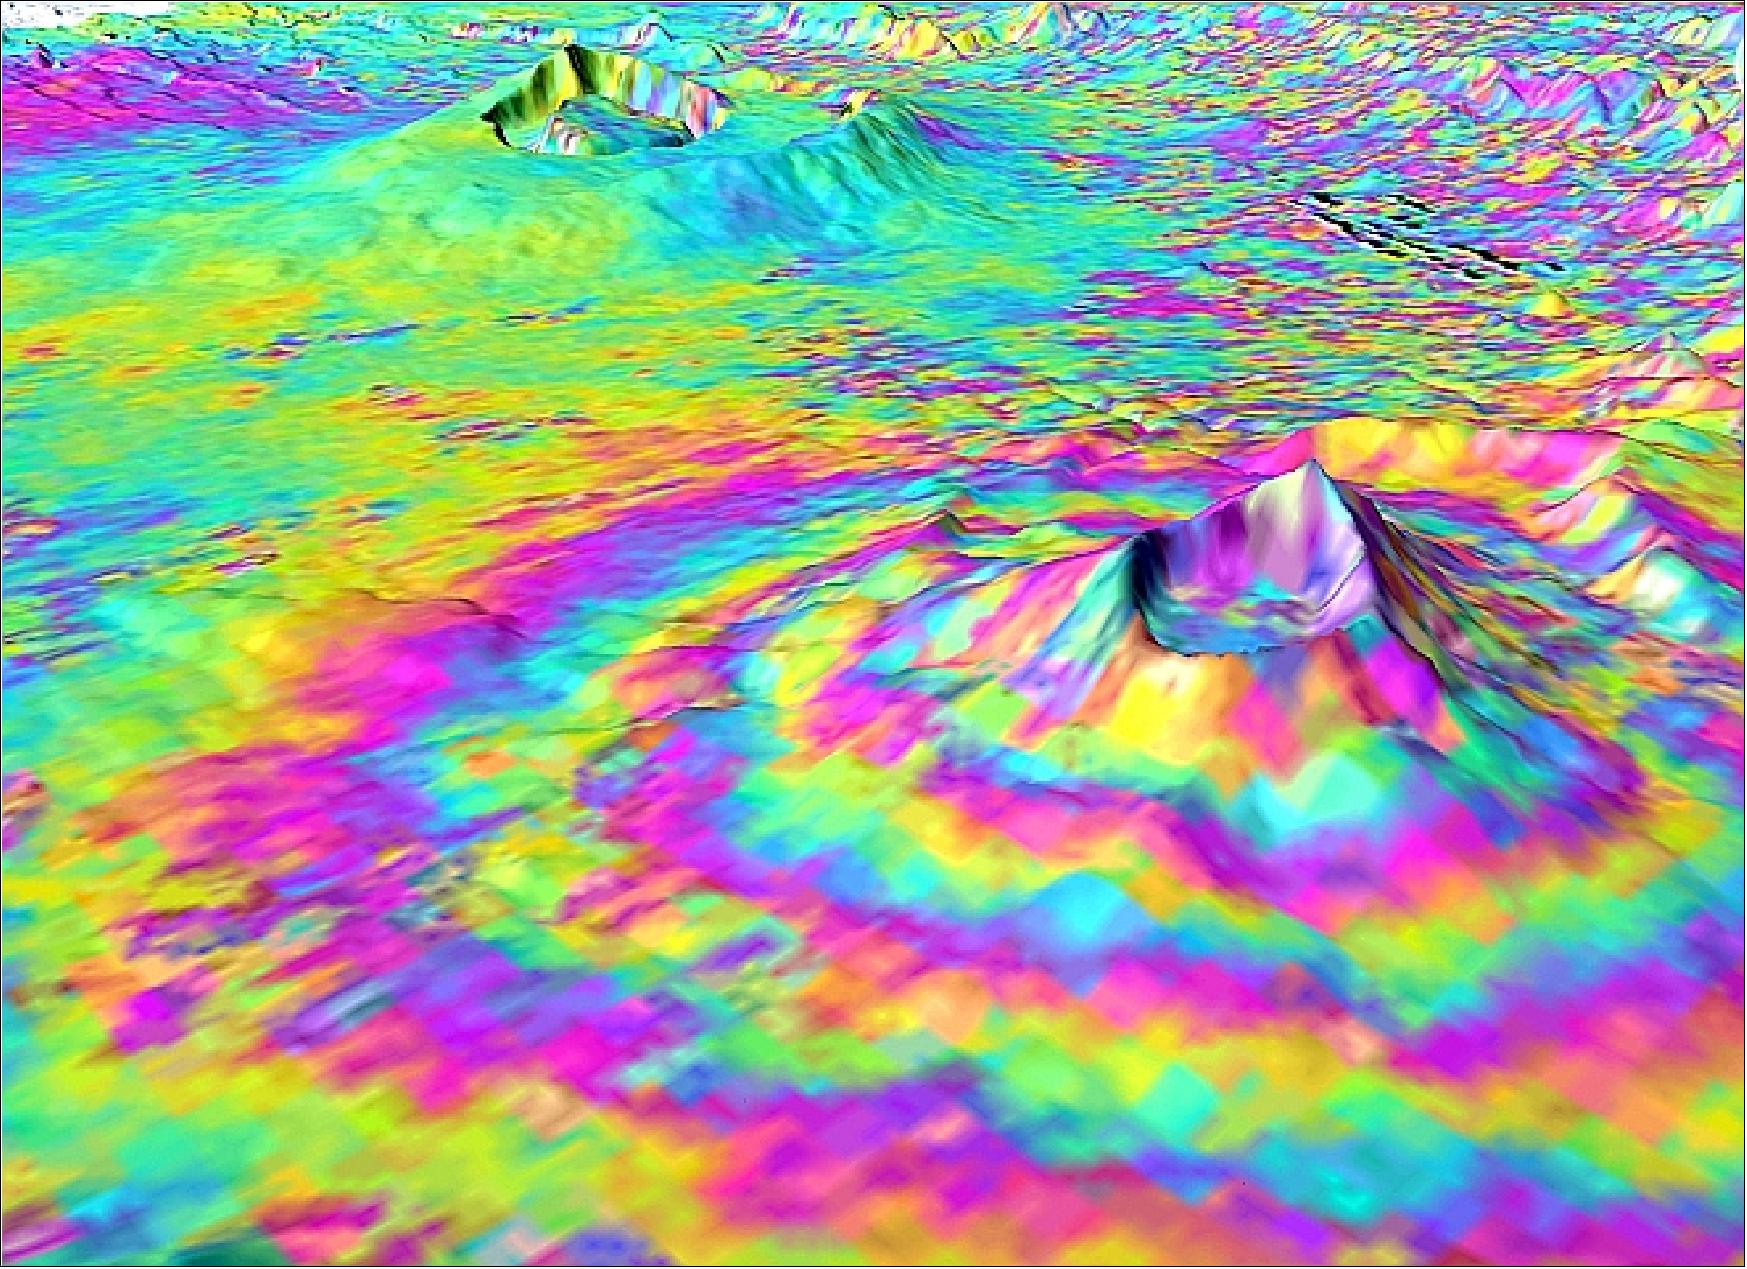
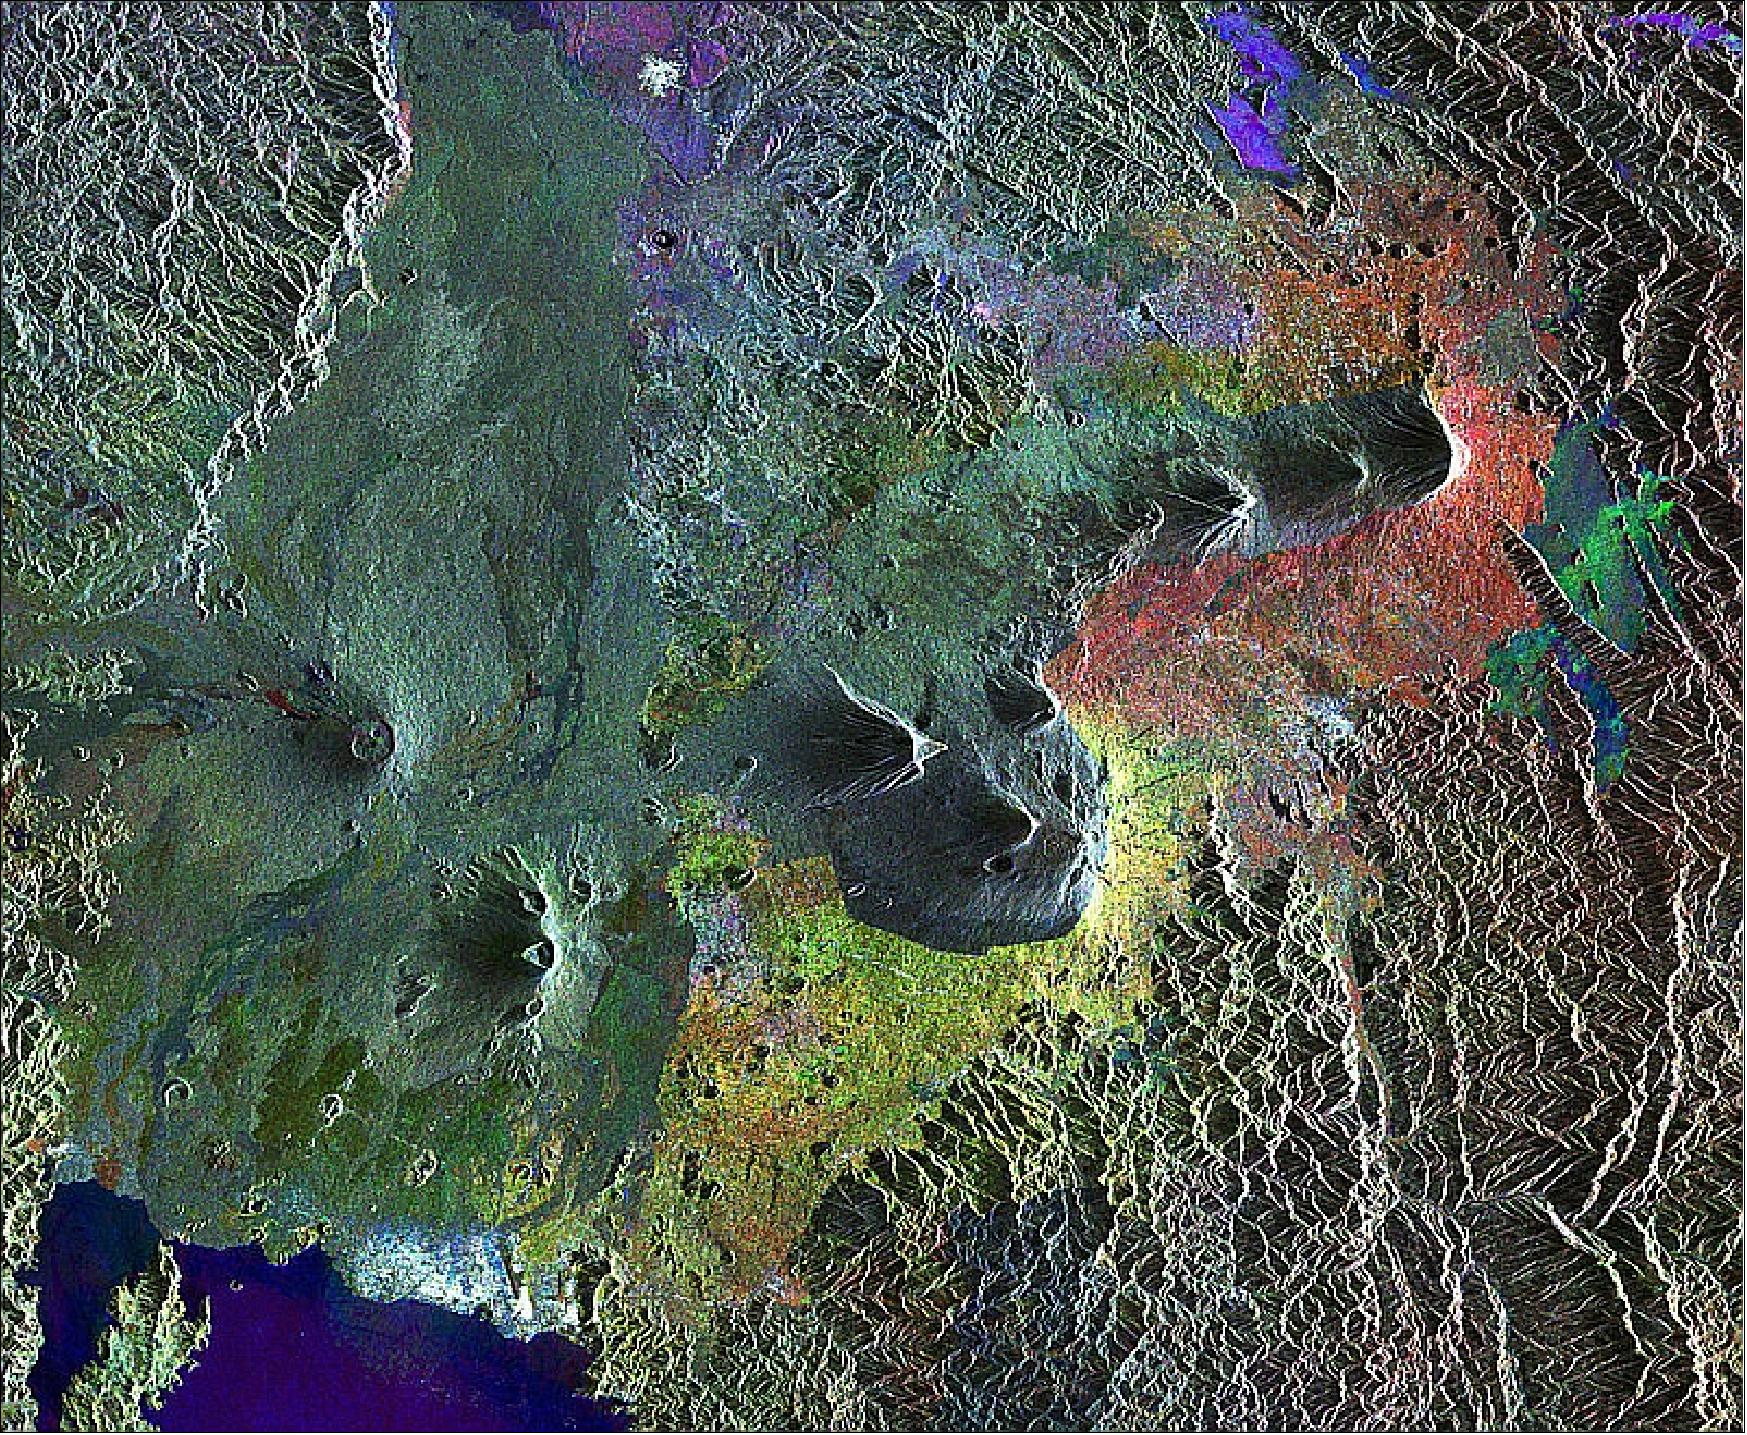
Legend to Figure 45: The interferogram shows small surface displacements that are not visible to the naked eye of the Longonot Volcano (front right). In the background is the Suswa volcano, which was not deforming at this time. Using SAR Interferometry (InSAR) data, a group of scientists discovered that from 1997 – 2000 the volcanoes at Suswa and Menengai (not visible) subsided 2 – 5 cm, and between 2004 and 2006 the Longonot Volcano experienced an uplift of around 9 cm (pictured). Interferogram images appear as rainbow-coloured interference patterns. A complete set of coloured bands, called 'fringes', represents ground movement relative to the spacecraft of half a wavelength, which is 2.8 cm in the case of Envisat's ASAR.
- The proximity of these volcanoes to a major metropolitan area poses a challenge in terms of a large eruption; several are located close to the capital cities Nairobi (Kenya) and Addis Ababa (Ethiopia).
RA-2 (Radar Altimeter-2)
RA-2 provides an extended observation capability of RA-1 heritage flown on ERS-1/2. RA-2 is a nadir-pointing pulse-limited radar altimeter that transmits frequency-modulated (chirp) pulses. This frequency modulation is a coding of the signal which spreads the energy of a short pulse over a longer time interval, thus allowing reduced peak power in the pulse. Alenia Spazio SpA of Rome, Italy is the prime contractor for the ESA instrument.
Frequencies: 13.575 GHz (Ku-band) and a second frequency at 3.2 GHz (S-band) for the measurement and correction of ionospheric delays. Adaptable width/resolution windows (measurements over ice surfaces), autonomous resolution control. 86)
The main objectives of RA-2 are high-precision measurements of distance (time delay) from the satellite to the Earth's surface (topography) and the measurement of the power and the shape of the radar echoes from the ocean, ice, and land.
Ground processing of the radar echo power and shape data enables the determination of wind speed and significant wave height in the observed target area (supporting studies of ocean circulation, bathymetry, gravity anomalies, and marine geoid characteristics). Sea ice monitoring is possible through frequent temporal coverages. 87) 88) 89) 90) 91) 92)
RA-2 transmits radio frequency pulses and measures the run time of the echoes. A model-free tracker in the onboard signal processor keeps the radar echoes within the sampling window. Adaptive height resolution operation is implemented by selecting the bandwidth of the transmitted pulses. As a result, measurements over ocean surfaces are carried out with improved accuracy. Internal calibration measurements are performed periodically in parallel with the tracking functions. For this, the transmit pulse is coupled to the receiver by means of a calibration coupler. Echo samples are processed on the ground to account for correction and calibration data.
In parallel to the nominal collection of echo waveforms, which are collected onboard at a 19 kHz rate, RA-2 has also the capability (on-ground command) to record streams of non-averaged "individual" waveforms. The feature is used to study the physics of the backscattering process.
Altitude | 764 - 824 km range with an accuracy of <4.5 cm |
Backscatter coefficient | -10 dB to +50 dB with an accuracy of <0.4 dB (bias) |
Wave height | 0.5 m to 20 m with an accuracy of <5% or 0.25 m |
Measurement datation | ±100 μs with respect to UTC |
Operating center frequencies | 13.575 GHz (Ku-band), and 3.2 GHz (S-band) |
Chirp bandwidths | 320, 80, 20 MHz CW (Ku-band), 160 MHz (S-band) |
Pulse repetition frequency (PRF) | 1795.33 Hz (Ku-band), 448.83 Hz (S-band) interleaved operation |
Pulse length | 20 μs |
Peak transmission power | 60 W (Ku-band), 60 W (S-band) |
Antenna diameter | 1.5 m |
Antenna beamwidth | 1.33º (Ku-band), 5.25º (S-band) |
IF center frequency | 6.4 MHz |
A/D conversion | 8 bit |
Instrument operation | continuously over full orbit |
FFT resolution | 128 complex points (samples) at 16 bit |
Antenna diameter, beamwidth | 1.2 m, 1.84º (Ku-band), 6.2º (S-band) |
Total mass, power, data rate | 110 kg, 161 W, 100 kbit/s |
LRR (Laser Retroreflector)
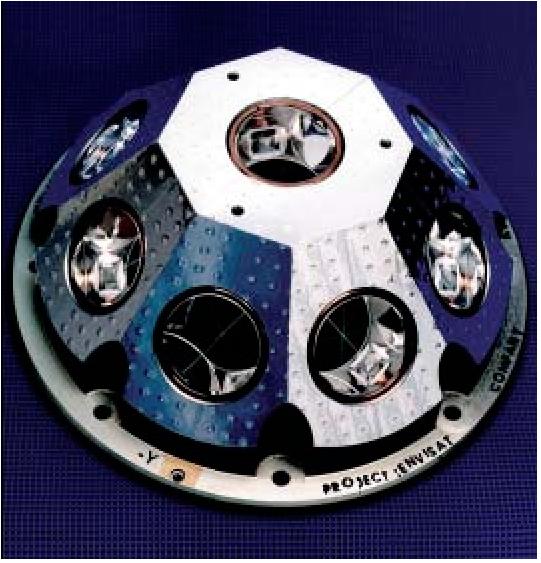
LRR was built by Alcatel Space Industries, France. LRR is mounted on the nadir panel close to the RA-2 antenna to support SLR (Satellite Laser Ranging) services from ground stations as well as RA-2 altitude measurement calibration. The LRR is a passive device that is used as a reflector by SLR stations. The operating principle is to measure the round-trip run time of laser pulses reflected from an array of corner cubes at the satellite. The corner cubes are designed to reflect the incident laser beam back directly, keeping the reflected beam parallel to the incident beam within a few arcseconds. The corner cubes of LRR work at two specified wavelengths: λ = 694 nm and λ = 532 nm. Laser ranging to LRR is possible for view angles of 360º in azimuth and 60º elevation around the perpendicular to the satellite's Z Earth panel. The total mass of LRR is 2 kg.
GOMOS (Global Ozone Monitoring by Occultation of Stars)
GOMOS is a UV/Visible/Near-infrared limb-viewing grating spectrometer, operating in a star occultation mode. GOMOS relies on the self-calibrating occultation method (which minimises the impact of instrument degradation). GOMOS introduces a new measurement principle: using stars rather than the sun or the moon as light sources (occultation measurement method), it achieves permanent, homogeneous global coverage through the measurement of 25 to 40 stars per orbit. The optical configuration, based on two grating spectrometers (range: 250 - 950 nm), permits the measurement of stratospheric profiles of O3, H2O, NO2, NO3, aerosols and temperatures with a 1.7 km vertical resolution. GOMOS was built by EADS Astrium SAS (formerly MMS), France. 93) 94) 95) 96) 97) 98) 99) 100)
Objectives: High accuracy (altitude-resolved) and global long-term monitoring of stratospheric and mesospheric ozone. Global survey of related stratospheric trace gases (NO2, NO3, H2O), aerosols and temperature. Other species (OClO, BrO, ClO) under perturbed chemistry conditions.
The primary GOMOS mission objectives are:
• Measurement of profiles of ozone, NO2, NO3, OClO, temperature, and water vapor
• Day- and night-side measurement capability
• Global coverage with typically over 600 profile measurements per day
• Altitude measurement capability between the tropopause and 100 km
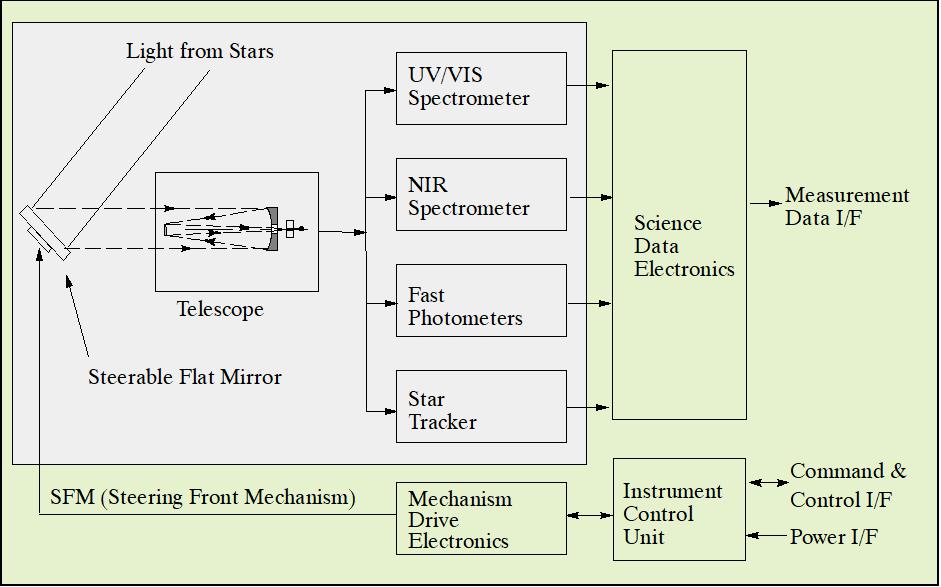
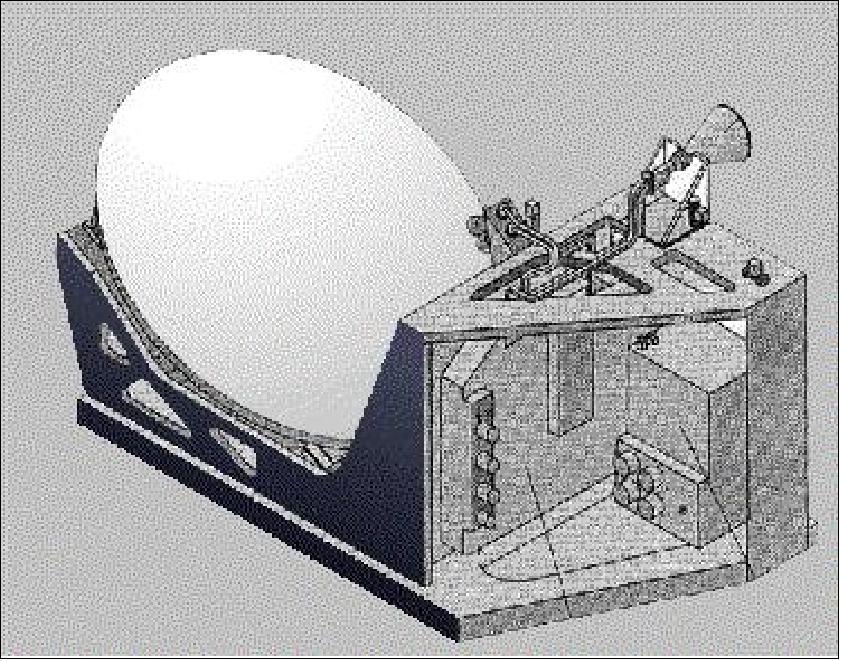
GOMOS instrument: The instrument's optical design (all-reflective system) is based on a single telescope concept: a Cassegrain telescope simultaneously feeding a UV/VIS medium-resolution spectrometer, NIR high-resolution spectrometers, two photometers (monitoring the input signal scintillation) and two (redundant) star trackers. The photometer measurements allow correcting the spectral data from the high-frequency component introduced by the atmospheric scintillations. The telescope, the optics, all sensors, and their associated front-end electronics are mounted on a thermally controlled CFRP optical bench. By using a steerable flat mirror (30 cm x 40 cm) in front of the telescope, GOMOS is able to acquire and track stars down to a magnitude of 5 over a very large angular range (Figure 50).
The two-stage Steering Front Mechanism (SFM) is used to point the line of sight toward the selected star and to track it with very high accuracy as it sets through the atmosphere. SFM has an angular steering range of 100º in azimuth and 8º in elevation, and a pointing accuracy of some 20 μrad at a bandwidth of 5 Hz (a typical scan is 50 s in duration). During the occultation phase, SFM is operated over a reduced FOV (8º in azimuth and 6º in elevation) to provide fine centering of the star image within the spectrometer entrance slit. The SFM relies on a combination of linear motors and flexible joints for its operation. The accurate tracking function is performed via a digital closed control loop using star tracker information read at a 1000 Hz sampling rate. 101) 102)
Parameter | UV/VIS | IR1 Spectrometer | IR2 Spectrometer | Photometers |
Spectral bands | 248-371/387-693 nm | 750-776 nm | 915-956 nm | 644-705 & 466-528 |
Spectral resolution | 0.89 nm | 0.12 nm | 0.12 nm | broadband |
SNR | >12 | >6 | >3 | >15 |
Linearity | 0.5% | <0.33% | <0.34% | N/A |
Spectral stability | 0.04 nm | 0.007 nm | 0.008 nm | N/A |
Altitude range | 20 - 100 km | |||
Vertical resolution | 1.7 km | |||
Operation | continuously over full orbit | |||
A special frame-transfer CCD has been developed for the spectrometers to meet the needs of the GOMOS mission. A thin, backside-illuminated, anti-reflection coated CCD (2 x 143 lines and 1353 columns with 20 x 27 μm pixels), operating in MPP (Multi Pin Phase) mode, serves as the primary detector array. A total of eight CCDs are used (two for the UV/VIS, two for the NIR, two for the fast photometers, and two for the star trackers).
- The entire spacecraft and external GOMOS instrumentation (optomechanical assembly: OMA) is covered by an optomechanical cover responsible for protecting the instrument from light coming from a different direction other than the defined angular range, and for ensuring a stable, defined thermal environment.
Requirements | Typical GOMOS Performance | Design Driver for |
Nr. of occultations/orbit (45 on average) | about 820.000 occultations during 4 year mission | Lifetime of pointing mechanism |
Wide angular coverage | -11º to +91º with respect to flight direction | Large FOV of pointing mechanism |
Altitude resolution/accuracy | 1.7 km/30 m, pointing stability better than 40 μrad | High angular pointing accuracy (pointing servo electronics) |
Spectral resolution of spectrometer (FWHM) | 0.72 / 0.89 nm UV/VIS, min/max | High-transmission optics, high detector sensitivity in the UV |
Photometer frame rate | 1 kHz in the spectral range: | Fast, high-sensitivity detectors |
The occultation-mode operation of GOMOS involves pointing the instrument (telescope) toward preselected stars, acquiring and then tracking them with high accuracy. GOMOS observes stars whose lines of sight are tangential to the Earth's limb. For each individual star, the spectrum measured outside the atmosphere is compared to the spectrum seen through the atmosphere as the star sinks below the horizon. The difference reveals the presence of ozone and other trace gases.
- The instrument has three additional calibration modes to meet the stringent pointing requirements; these are:
• A linearity monitoring mode, allowing calibration for possible nonlinearity of the sensor chains within the large dynamic range.
• A spatial-spread monitoring mode, allowing optimization of the position of the CCD read-out regions with respect to that of the stellar spectrum.
• A uniformity monitoring mode, allowing measurement of the sensitivity difference between the various CCD pixels of a spectral sampling interval.
Some GOMOS instrument parameters:
- Telescope: 30 cm x 20 cm rectangular aperture, FOV: 0.6º, Cassegrain design based on aspherical primary and secondary mirrors;
- cooled 2-D CCD array;
- 2-axis stabilised platform;
- star tracker: ±0.3º FOV;
- total mass: 163 kg;
- power: 146 W;
- data rate: 222 kbit/s;
- data quantisation: 12 bit.
MWR (Microwave Radiometer)
MWR is a nadir-viewing, two-channel Dicke-type radiometer (passive sensor) operating at 23.8 (K-band) and 36.5 (Ka-band) GHz. The main objective of MWR is the measurement of atmospheric humidity as supplementary information for tropospheric path correction of the RA-2 signal, which is influenced by the integrated atmospheric water content and by liquid water. In addition, MWR measurements are useful for the determination of surface emissivity and soil moisture of land, for surface energy budget estimations, investigations to support atmospheric studies, and for ice characterisation. MWR is of ERS-1/2 heritage, built by Thales Alenia Space (formerly Alenia Spazio, Italy). 103) 104) 105)
Some instrument parameters:
- FOV = 20 km diameter at nadir;
- bandwidth = 650 MHz;
- dynamic range = 3 K - 330 K;
- absolute radiometric accuracy ≤ 3 K, radiometric sensitivity <0.4 K;
- operation of instrument: continuously over full orbit.
The microwave radiation is received by an offset feed parabolic reflector antenna (fully integrated into the instrument structure), routed through a Dicke switch assembly to a down converter which translates the K- and Ka-band signals to a suitable IF range.
The antenna subsystem includes a 60 cm reflector with a focal length of 350 mm and an offset angle of 47º. Two feeds are used such that the 23.8 GHz channel is pointing in the forward direction and the 36.5 GHz channel in the aft direction, both beams with a footprint of about 20 km (1.5º beam). These frequencies are separately routed into the RF front-end where to two-point calibration scheme is adopted, namely with hot and cold references. MWR is controlled by a common MWR-DORIS instrument control unit. MWR has independent thermal-control elements (heaters and thermostats) to give its electronic circuits optimum performance.
- Retrieval of antenna and brightness temperature values from measurement data is accomplished by ground processing. This includes ground calibration data, antenna characteristics, and orbit characterisation data.
Operating frequencies | 23.8 GHz (K-band), 36.5 GHz (Ka-band) |
Bandwidth | 650 MHz |
Dynamic range | 3-300 K |
Absolute radiometric accuracy | ≤ 3 K |
Radiometric sensitivity | < 0.5 K |
Operation | continuous |
Mass, power, data rate | 25 kg, 23 W, 16.7 kbit/s |
With one feed horn for each frequency, the MWR points via an offset reflector at an angle close to the nadir. The instrument configuration is chosen such that the 23.8 GHz channel is pointing in the forward direction, and the 36.5 GHz channel is in the backward direction with a footprint of about 20 km diameter for each beam.
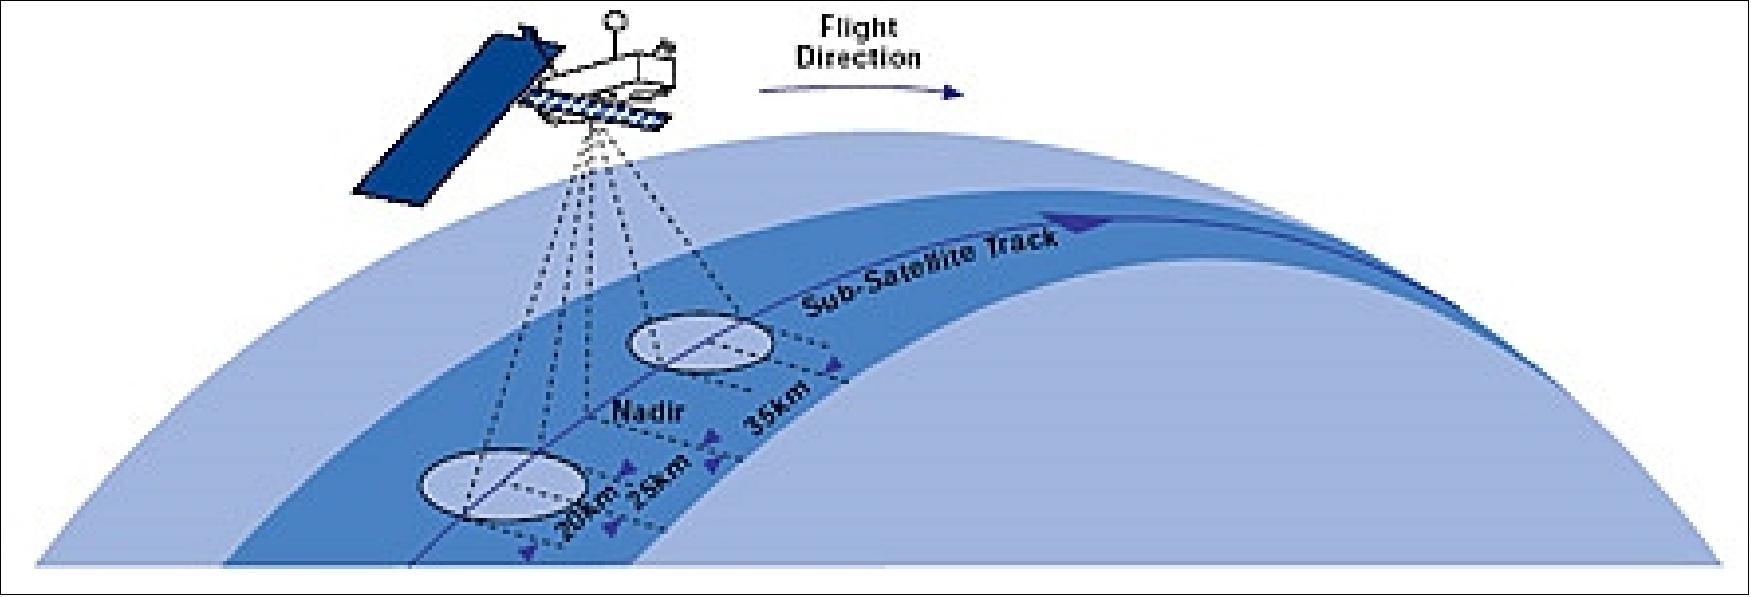
DORIS (Doppler Orbitography and Radiopositioning Integrated by Satellite)
DORIS is a tracking system providing range-rate measurements of signals from a dense network of ground-based beacons. These data are precision processed on the ground providing the satellite orbit with an accuracy of the order of centimeters. They are also processed on board to provide real-time satellite positions with an accuracy of some tens of centimeters. The DORIS system is of SPOT series heritage (first introduced on SPOT-2, Launch Feb. 1990). DORIS is also being flown on the TOPEX/Poseidon mission of NASA/CNES. Its measurements are used to provide very precise orbit restitution of LEO satellites. 106)
DORIS is based upon the accurate measurement of the Doppler shift of RF (radio frequency)signals transmitted from ground beacons and received on board the spacecraft. Measurements are made at two frequencies: 2.03625 GHz for precise Doppler measurements and 401.25 MHz for ionospheric correction of the propagation delay. The 401.25 MHz frequency is also used for measurement time-tagging and auxiliary data transmission.
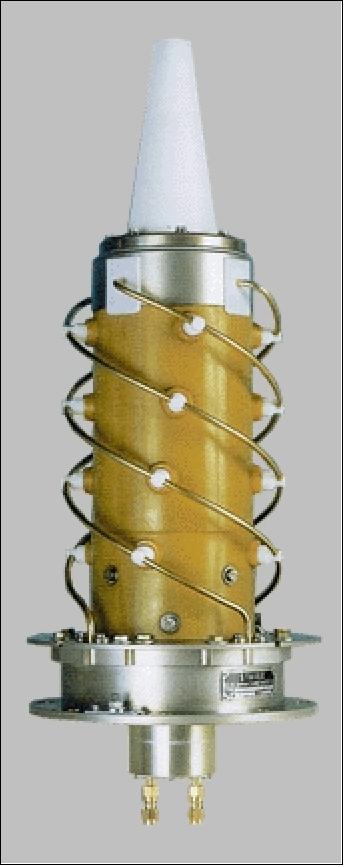
The onboard DORIS instrument consists of:
• A redundant receiver with two receiving chains. The receivers have the capability to track simultaneously two beacons.
• An ultrastable crystal oscillator (USO) identical to the USOs employed in the ground segment of DORIS
• An omnidirectional dual-frequency antenna
• An ICU (Instrument Control Unit) shared with MWR
Every 10 seconds the receiver measures the Doppler shift of the signals continuously transmitted from the ground beacons at the two frequencies of 2036.25 MHz and 401.25 MHz. The onboard USO provides the reference for this measurement with a stability of 5 x 10-13 over 10 to 100 seconds. The Doppler measurements are also processed on board to obtain real-time orbit data with less accuracy.
Doppler measurement | 2.03625 GHz |
Position accuracy: real-time | 1 m |
Velocity accuracy: real-time | < 2.5 mm/s |
Instrument operation | Continuously over full orbit |
Instrument mass, power, data rate | 91 kg (inclusive ICU), 42 W, 16.7 kbit/s |
AATSR (Advanced Along Track Scanning Radiometer)
AASTR is an imaging radiometer operating in four infrared channels (1.6, 3.7, 10.8, and 12.0 μm) and with three visible/reflected channels (0.55, 0.66, 0.87 μm). AATSR retains the full capability of ATSR-2 (flown on ERS-2). 107) 108)
The AATSR instrument was built by the prime contractor Astrium Ltd., UK, and funded by DETR (UK Department of the Environment, Transport and the Regions), DISR (Australian Department of Industry, Science and Resources), and by NERC (UK Natural Environment Research Council). Under DETR's agreements with the Commonwealth of Australia, DISR has provided certain instrument components via contracts with Australian industry, and CSIRO (Commonwealth Science and Industrial Research Organisation) of Canberra have been the interface for science issues. Technical support on data processing is provided by RAL (Rutherford Appleton Laboratory) of Chilton, UK.
Objectives of AATSR:
a) Continuation of precise measurement of Sea Surface Temperature (SST) started with ATSR-1 and ATSR-2;
b) To provide high-quality imagery of TOA (Top-of-Atmosphere) brightness temperature at 1 km resolution covering all parts of the globe except the polar regions,
c) To enable scientific studies of ocean dynamics, land surface properties and the properties of clouds.
AATSR consists of the following elements:
- the IR/VIS radiometer,
- the electronics unit (providing the signal processing function, the scan mirror drive control, and temperature sensor conditioning),
- the blackbody electronics unit (provides control of the blackbody heaters and collects temperature sensor data),
- the cooler control unit (provide the control function for the Stirling-cycle coolers),
- the DEU (Digital Electronics Unit) for instrument control and data formatting functions,
- and the instrument harness. 109)
Channel | Center wavelength | Bandwidth | Primary application |
0.55 µm | 0.555 µm | 20 nm | Chlorophyll |
Spatial resolution | 1 km x 1 km | ||
Radiometric resolution | 0.1 K | ||
Data quantisation | 12 bit | ||
SST accuracy | better than 0.3 K | ||
Swath width | 500 km | ||
Instrument operation | Continuously over full orbit | ||
Data rate, instrument mass, power | 625 kbit/s, 101 kg, 100 W | ||
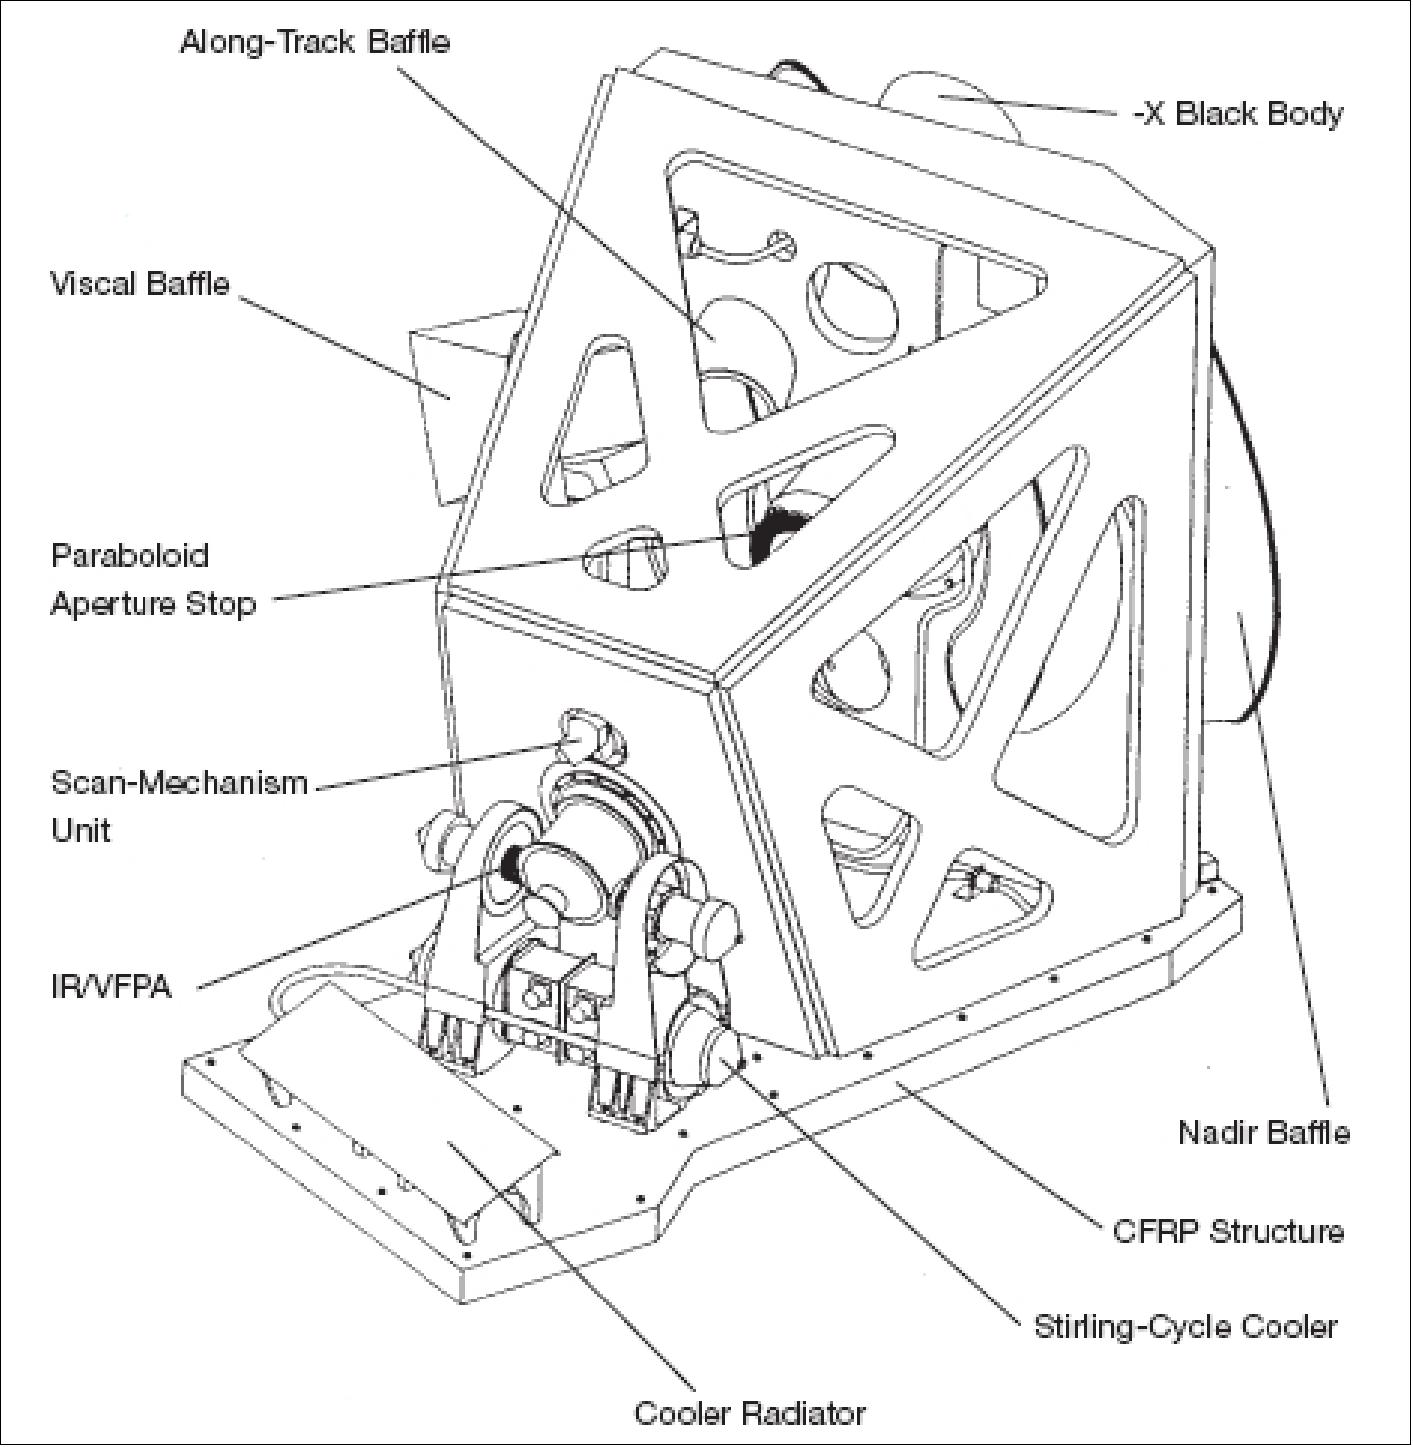
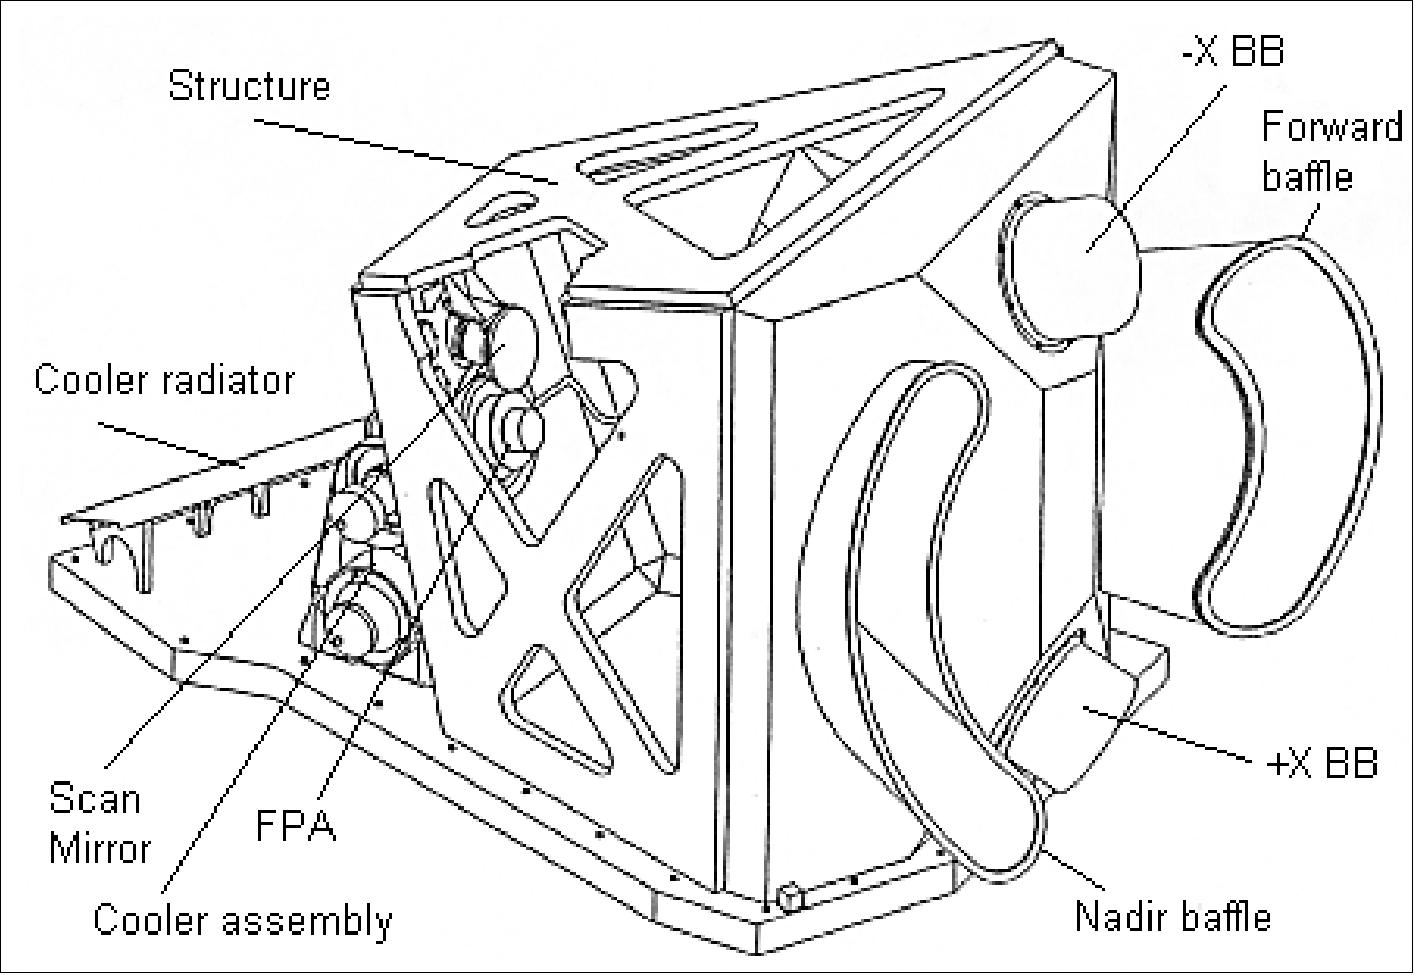
The VIS/IR radiometer includes an inclined plane scan mirror which is rotated continuously in front of a reflecting telescope to provide a conical scan.
The scan axis projects downwards (nadir) and ahead in the along-track direction (about 47º), achieving scanning across the satellite track in two regions:
1) close to the nadir,
2) at an angle to the sea surface normal looking along the track (47º).
The two-angle viewing technique provides improved atmospheric corrections. The focal plane assembly (FPA) is equipped with detectors, one per channel, converting the radiation to electrical signals. A pair of Stirling cycle coolers keep the detector temperature at 80 K. Two blackbody infrared calibration targets, controlled by the blackbody electronics unit and a diffuse reflector visible calibration target, are viewed between the nadir and along-track scans.
AATSR is functionally largely similar to ATSR-2, but components have been redesigned to match the new platform environment of EnviSat. The details of the scan, calibration systems, spatial resolution, and swath have been kept as close as possible to the earlier instruments to ensure data continuity. A major advantage of AATSR over ATSR-2 (on ERS-2) is in the downlinking of data. ATSR-2 had restrictions on the amount of visible channel data that could be downlinked, due to platform constraints, whereas AATSR can send down data from all the channels continuously at full 12-bit radiometric resolution.
SSTs are derived using the 11 and 12 μm channels for daytime data, and the 11, 12, and 3.7 μm channels for nighttime data. In addition, the two VIS channels centered at 0.67 and 0.87 μm provide measurements of the vegetation index in the same way as AVHRR. An additional channel at 0.55 μm is provided, to indicate, from chlorophyll content, the growth stage and health of vegetation.
The Level 1B product (calibrated and geolocated BT/reflectance) is provided at 1km x 1km resolution at the nadir. The Level 2 product containing SST and land parameters is available at 1 km x 1km resolution for regional studies, or spatially averaged over 10 arcmin and 30 arcmin or 17 km and 50 km cells for global measurements.
AATSR features two 500 km wide curved swaths, with 555 pixels across the nadir swath and 371 pixels across the forward swath. Each pixel (or sample) is defined by integrating the detector signals over 75 ±0.75 µs as the scan mirror rotates, thus giving 2000 samples per 150 ms scan (only the useful samples of the earth views and calibration sources are transmitted to the ground. The nominal IFOV is specified to be 1 km x 1 km at the center of the nadir swath; this amounts to an angular IFOV of 265 arcsec x 265 arcsec.
Two surface views:
The surface is first viewed along the direction of the orbit track, at an angle of 55º, as the spacecraft flies toward the scene. Then, 150 seconds later, or when the satellite has moved by about 1000 km forward along the ground track, a second observation is made of the same scene at the subsatellite point (see Figure 56).
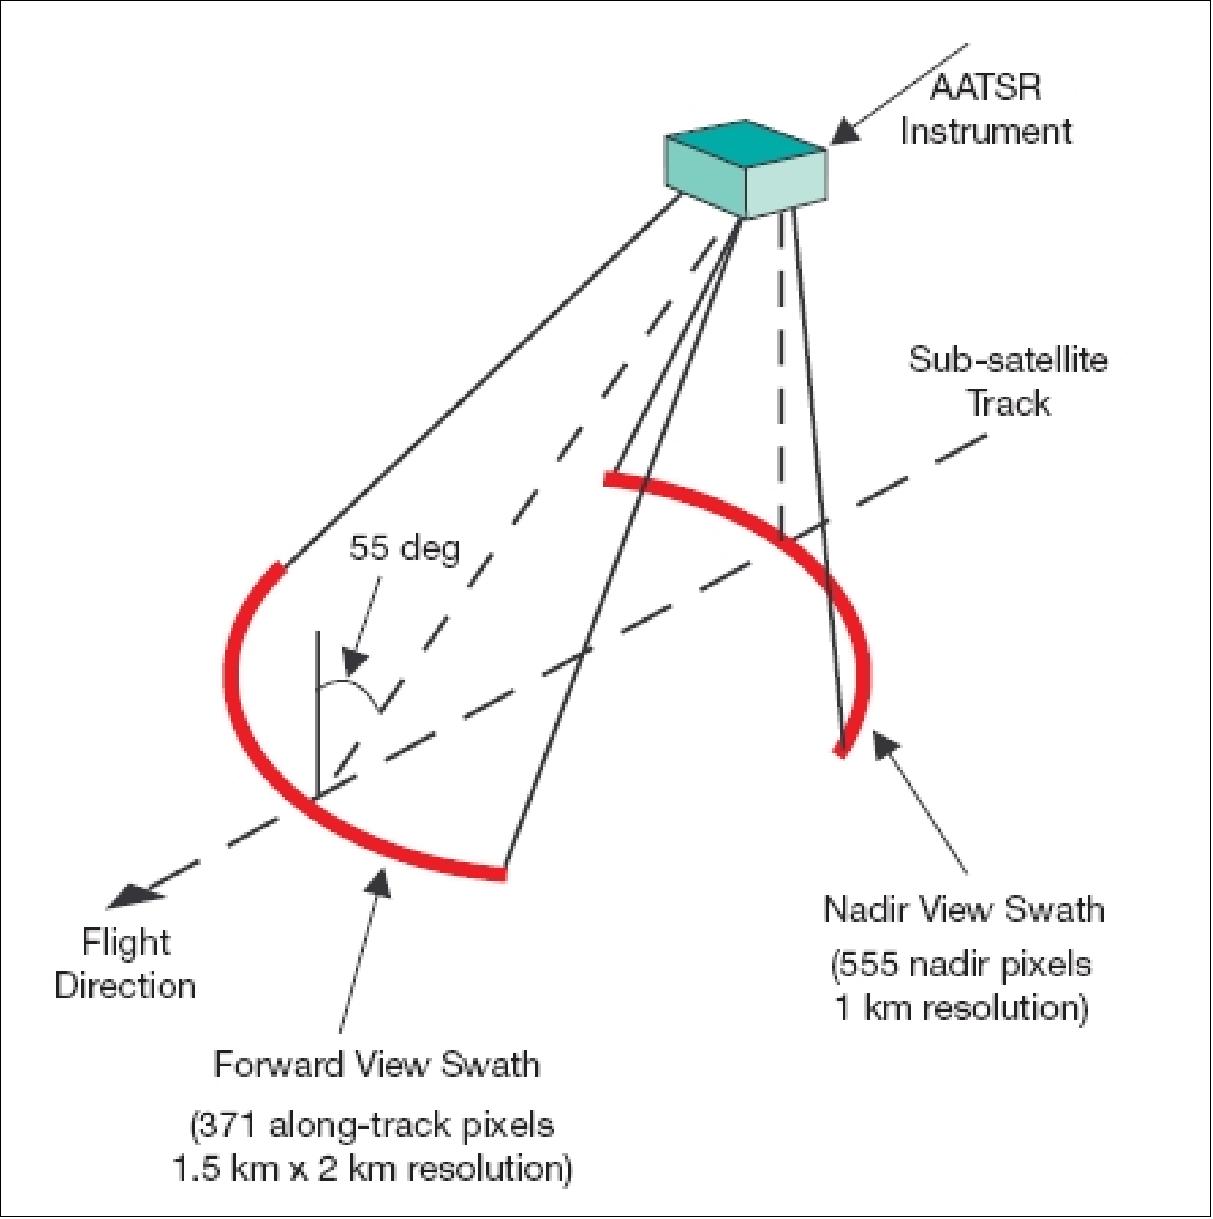
SCIAMACHY (Scanning Imaging Absorption Spectrometer for Atmospheric Cartography)
SCIAMACHY is a cooperative project funded by DLR/NIVR; PIs: J. P. Burrows, University of Bremen; H. van Dop, University of Utrecht; built by DASA/DSS (electrical assembly) and Fokker Space, TNO and SRON (optical assembly and radiant cooler).
SCIAMACHY is a passive spectrometer (of GOME heritage) for the measurement of trace gases in the troposphere and stratosphere, operating by differential optical absorption spectroscopy (DOAS) of solar and lunar radiation in the spectral region between 240 nm and 2400 nm (from UV to SWIR). Parallel application of DOAS and BUV (Backscatter UV) measuring techniques.
Viewing in three different modes: occultation (sun/moon), nadir, and limb scattering.
Data rate: 400 kbit/s for nadir and limb observations; 1.867 Mbit/s for sun occultations. 110) 111) 112) 113) 114) 115)
SCIAMACHY observation objectives:
• Global measurement (abundance and distribution) of trace gases in the troposphere and stratosphere.
• Measurement of aerosol, cloud altitudes, and spectral reflection of the surface.
• Troposphere: O3, O2, O4, NO2, N2O, CO, CO2, CH4 and H2O. Under special conditions also: HCHO, SO2, and NO3
• Stratosphere: O3, O2, NO, NO2, NO3, N2O, CO, CO2, CH4, H2O, and BrO. Observation of the NO column above 40 km. Under ozone hole conditions measurement of OClO and ClO in the lower stratosphere are possible.
The instrument consists of the following systems:
- optical assembly [scanner module (elevation and azimuth scanners), telescope (off-axis parabolic mirror), spectrometer (grating for each band), detector modules (photodiode array detectors), thermal hardware (cooling of the telescope)];
- SCIAMACHY Radiant Cooler [radiator, thermal busses];
- electronic assembly [power, mechanism, and thermal control unit; science data processing unit; an instrument control unit; and the digital bus unit].
Instrument mass = 198 kg; power = 122 W.
Instrument operation: continuously over the full orbit. IFOV=0.045º x 1.8º.
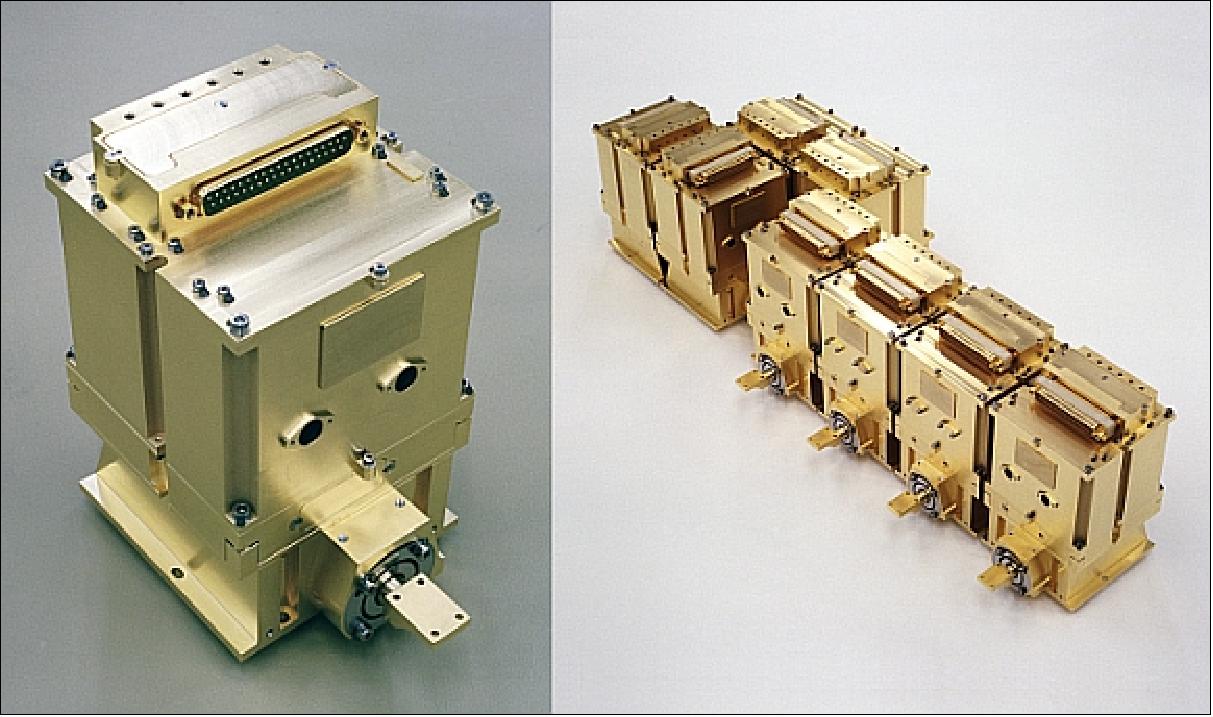
Spectral | Spectral Range (nm) | Spectral | Detector Operating Temperature | Measured Constituents |
1 | 240-314 | 0.24 nm | 200 K | O3, NO, (ClO) |
2 | 309-405 | 0.26 nm | 200 K | O3, O4, BrO, NO2, HCHO, SO2 |
3 | 394-620 | 0.44 nm | 200 K | O2, O3, O4, OClO, NO2, NO3 |
4 | 604-805 | 0.48 nm | 200 K | O2, O4, NO3, H2O |
5 | 785-1050 | 0.54 nm | 200 K |
|
6 | 1000-1750 | 1.48 nm | 200 K | O4, H2O |
7 | 1940-2040 | 0.22 nm | 135 K | CO2, H2O |
8 | 2265-2380 | 0.26 nm | 135 K | CO, CH4, N2O, H2O |
PMD | 310 - 2380 | 67 to 137 |
|
|
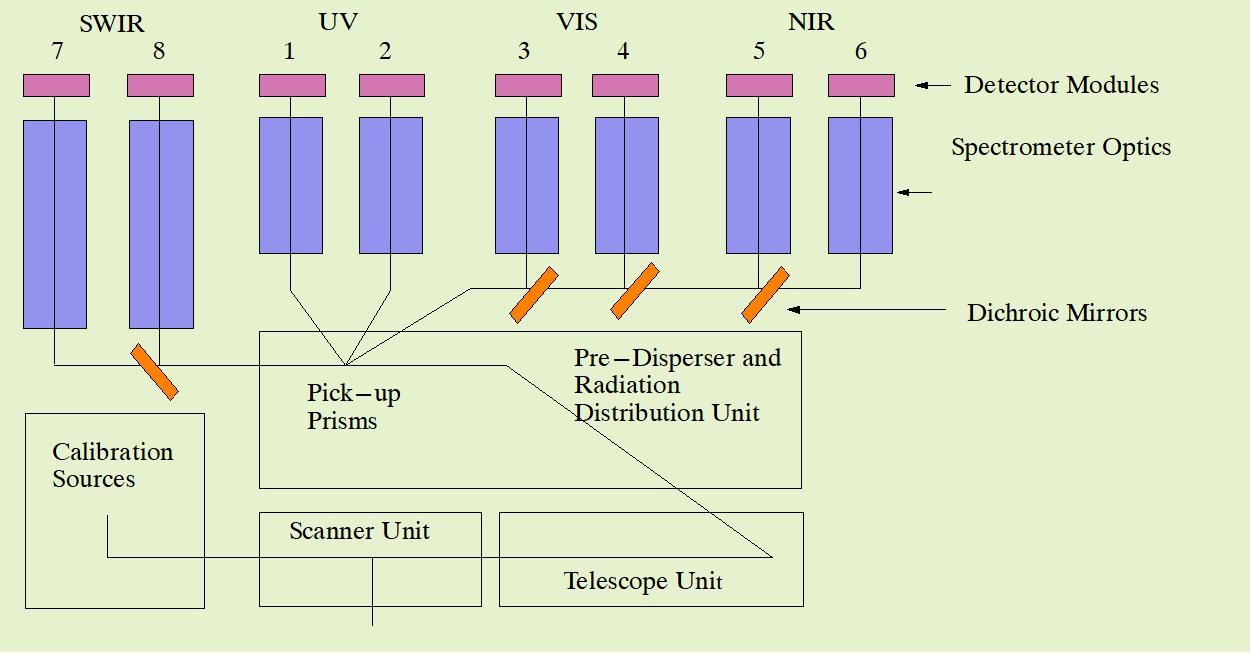

In the optical assembly, the radiation from the atmosphere is fed by the scanner (consisting of azimuth and elevation scanner) into the telescope which directs it onto the entrance slit of the spectrometer. The spectrometer contains a pre-disperser that separates the radiation into three bands, followed by a series of dichroic mirrors which further divide the radiation into eight bands. Each band features a grating to diffract the radiation into a high-resolution spectrum which is then focused onto the detectors (each band has its own 1024-pixel detector array). The pre-disperser also serves as a Brewster window to separate polarised light, a portion of which is sensed by the PMD (Polarisation Measurement Device). The PMD output is later used to correct for the polarisation effects.
SCIAMACHY viewing geometries: 116)
a) Limb-scanning mode (into the flight direction).
Objective: vertical distribution of trace gases and aerosols. In this mode, the instrument is scanning across-track with a swath width of ±500 km with respect to the subsatellite track. Scan layers of 3 km vertical thickness (and 100 km pixel width) are measured up to an altitude of 100 km. In this mode, both elevation and azimuth mirrors are used to record atmospheric spectra.
• Determination of trace gas stratospheric profiles with an improved resolution (compared to nadir)
• Aerosol profiles
b) Nadir-viewing mode.
Objective: global distribution and abundance of trace gases, aerosols, and cloud cover (observation at least once within three days); swath width = 1000 km; scan period=4 s in forward and 1 s in backward motion; pixel size at nadir (resolution) = 32 km along-track x 16 km across-track.
This viewing geometry is particularly suited for the following application:
• Determination of total column amounts of trace gases
• Stratospheric and tropospheric profiles of certain species at limited height resolution
• Cloud detection
• Aerosols
• Surface reflectance
c) Solar and lunar occultation modes (measurements during each orbit).
Objective: high-resolution absorption spectroscopy (DOAS). IFOV = 0.07º (azimuth) x 0.014º (elevation). The sun or moon is either tracked or a vertical scan over the complete sun/moon surface is performed. The obtained spectra can then be compared with suitable calibration spectra to yield the differential absorption of the atmosphere.
Viewing geometry | IFOV | ||
Nadir | 0.045º x 1.8º | ±0.003º | cross-track |
Limb | 0.045º x 1.8º | ±0.003º | cross-track |
Solar occultation | 0.045º x 0.72º | ±0.003º | cross-track |
Moon occultation | 0.045º x 1.8º | ±0.003º | cross-track |
Calibration: In order to guarantee the long-term stability of the scientific measurements, SCIAMACHY can perform many different calibration measurements. The calibration system includes internal calibration lamps; SCIAMACHY is radiometrically calibrated for backscattered UV measurements by direct observation of the sun and the full moon (occasionally). Direct measurements of the sun are also used to obtain the background solar source function for the DOAS measurements. Calibrations can in principle be made every orbit. 117)
Instrument status:
• Using SCIAMACHY data in the timeframe 2003-2009, scientists have detected an increase in atmospheric carbon dioxide (CO2) – one of the most important greenhouse gases that contribute to global warming – by about 2 parts per million (ppm). 118)
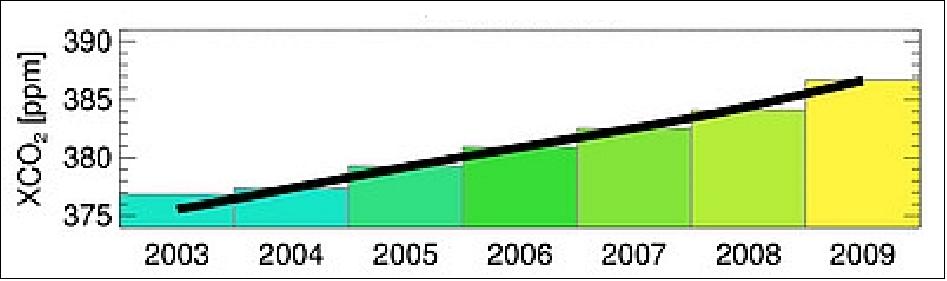
• SCIAMACHY's current performance (2009) fully supports the extension of the EnviSat mission until 2010. All instrument subsystems perform well and countermeasures for the few nonconformances have been successfully implemented or are in preparation. So far, the instrument has fully met its requirements and goals. Since the summer of 2002, a continuous stream of high-quality data has been acquired at the ground stations and disseminated for further processing. The results obtained provide new insights into the Earth-atmosphere system. Many groups at various institutes in Europe and abroad are involved in the scientific analysis of the data. 119)
Ground Segment
The EnviSat ground segment provides the means and resources to manage and control the mission, to receive and process the data produced by the instruments, and to disseminate and archive the generated products. Furthermore, it provides a single interface to the users to allow optimum utilisation of the system resources in line with the user's needs.
The ground segment can be split into two major elements: 120) 121)
1) FOS (Flight Operation Segment) which is responsible for the command and control of the satellite. The FOS is located at ESOC in Darmstadt, Germany, and the associated command and control stations. It provides control of the EnviSat satellite through all mission phases. 122)
2) The PDS (Payload Data Segment) which is responsible for the exploitation of the instrument data.
The satellite-to-ground communication links rely on various ground stations (Kiruna, Fucino, Svalbard, and Villafranca - the latter as TT&C back-up) and the ESA data relay satellite system ARTEMIS which provide direct communication between EnviSat and the ground even when the satellite is out of visibility of the ground stations.
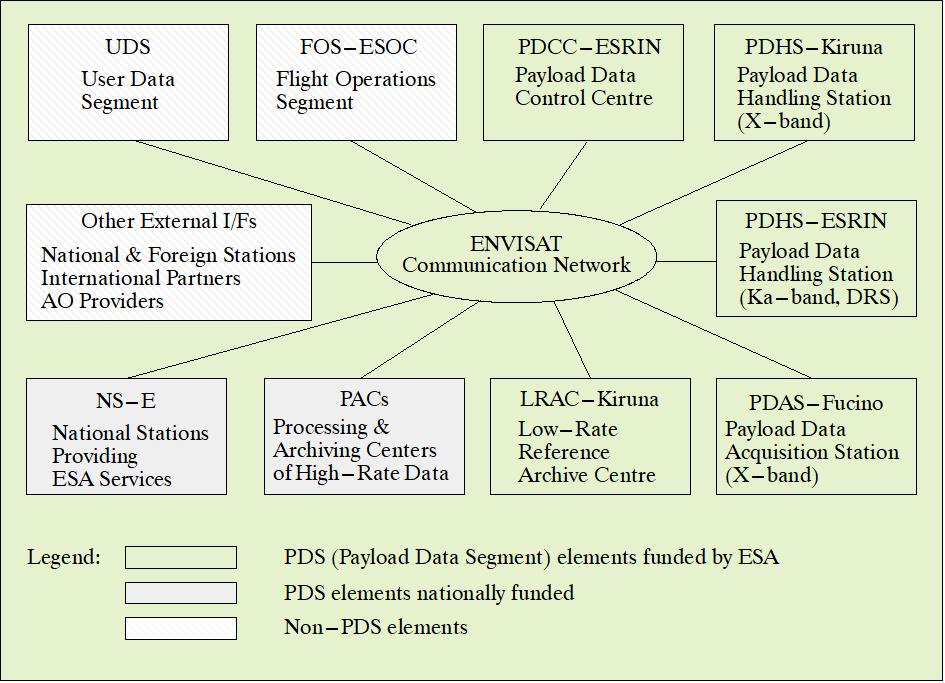
The PDS provides the services needed for the exploitation of all of the instrument data.
The main functions of the PDS are 123) 124) 125)
• Acquisition of the low- and high-bit-rate instrument data via the X-band channel when in direct visibility of the EnviSat satellite, or via the ARTEMIS data-relay satellite's Ka-band channel.
• Processing (systematic or on-request) of the received data in near-real-time (within 3 hours after sensing) or off-line, up to Levels 0, 1 and 2
• Short- or long-term archiving of the products generated
• Dissemination of the products to scientific and commercial users
• Provision of user services.
The PDS operations are coordinated from the PDCC (Payload Data Control Center) located at ESA/ESRIN, in Frascati, Italy. The PDCC is responsible for the instrument and ground-segment planning and for the overall PDS monitoring and control. It also coordinates user services and provides quality and engineering support for the products.
- The PDHS (Payload Data-Handling Stations) in Frascati (Ka-band) and in Kiruna, Sweden (X-band) acquire measurement data downloaded from the spacecraft, process it, and disseminate the products, according to PDCC directives. A short-term rolling archive is provided. Local services are also offered to users. A reduced PDHS has been installed at Svalbard, to provide backup support for Level-0 data acquisition and processing, complementing the five daily Kiruna-blind orbits.
- The PDAS (Payload Data-Acquisition Station) in Fucino (Italy) acquires only measurement data (in X-band) and forwards it to the PDHS station at ESRIN for processing.
- The LRAC (Low-rate Reference Archive Center) in Kiruna archives and processes the global low-rate data off-line, to provide a complete consolidated low-rate Level-1b data set for the ESA Developed Instruments (EDIs) and ASAR-LR Instruments, and a preconsolidated Level-1b product for other Announcement of Opportunity Instruments (AOIs). Local services are also offered to internal users.
- The PACs (Processing and Archiving Centers), located in various ESA Member States, archive and process off-line high-rate data and generate off-line Level-2 products for regional high-rate or full-resolution instruments and global low-rate instruments. There are six PACs: UK-PAC, D-PAC, I-PAC, F-PAC, S-PAC, and E-PAC. The Finnish Meteorological Institute (FMI) is associated with the D-PAC.
- The NS-Es (National Stations), located in ESA Member States, acquire data and provide ESA services.
UDS (User Data Segment): The User Services play a major role within the Envisat PDS. Based on Internet technologies and a distributed architecture, they provide efficient access to Envisat products and information and offer a wide variety of online services to the user community. 126)
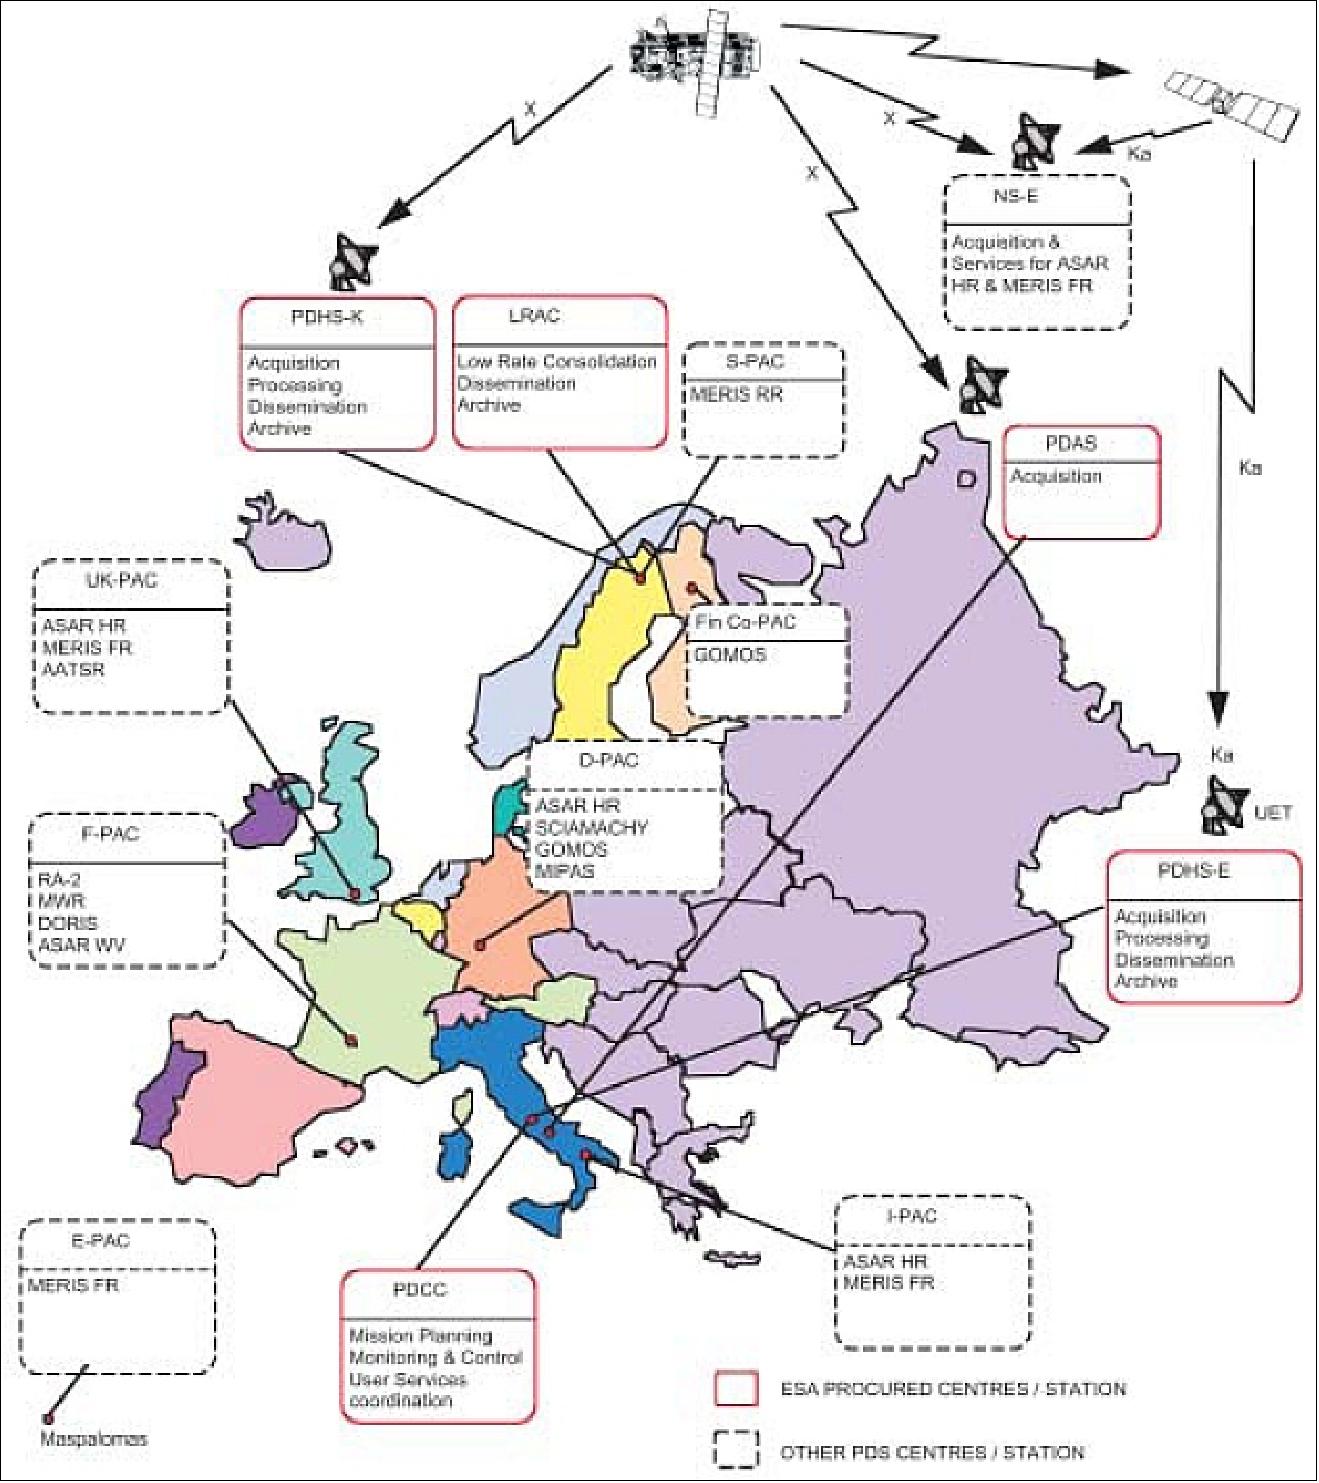
References
1) EnviSat Special Issue, J. Louet, "The Envisat Mission and System," ESA Bulletin No 106 (EnviSat Special Issue), June 2001, pp. 10-25
2) "EnviSat - Europe's Earth Observation Mission for the new Millennium," ESA Earth Observation Quarterly, No. 60, 1998
4) "The ESA Earth Observation Programme and its Role in Global Remote Sensing," P. Goldsmith, Proceedings of the Twenty-Third International Symposium of Remote Sensing of the Environment," Vol. I, ERIM, Ann Arbor, MI, pp. 125-137.
5) Programme Proposal for the first Polar Orbit Earth-Observation Mission using the Polar Platform, Part 1 , ESA paper, 31-08-89
6) Objectives and Strategy for the Earth-Observation Programme of the European Space Agency,ESA, Oct. 1988
7) Polar Platform Concept Evaluation, ESA paper, Sept. 25, 1989
8) Programme Proposal for the first ESA Polar Platform, ESA/PB-EO (89) 32, Sept. 1, 1989
9) Programme Proposal for the Development and Exploitation of the First Polar Orbit Earth-Observation Mission (POEM-1) using the Polar Platform, ESA/POEM 1, Issue 1, Oct. 28, 1991, Part 1, Issue 1, Oct. 30, 1991, Part 2
10) J. Louet, "The Envisat Mission and System," ESA Bulletin No 106, June 2001, pp. 11-25, URL: http://www.esa.int/esapub/bulletin/bullet106/bul106_1.pdf
11) P. A. Dubock, F. Spoto, J. Simpson, D. Spencer, E. Schutte, H. Sontag, "The Envisat Satellite and Its Integration," ESA Bulletin No 106, June 2001, pp. 26-45, URL: http://www.esa.int/esapub/bulletin/bullet106/bul106_2.pdf
12) "ENVISAT-1: Mission and System Summary," ESA brochure, March 1998, URL: http://www.oulu.fi/astronomy/planetology/Kaukok/Envisat_niskala/mis_sys.pdf
13) J. Louet, "Envisat on Watch," ESA Bulletin No 109, Feb. 2002, URL: http://www.esa.int/esapub/bulletin/bullet109/chapter1_bul109.pdf
14) "Envisat 20-year anniversary," ESA Applications, 1 March 2022, URL: https://www.esa.int/ESA_Multimedia/Videos/2022/02/Envisat_20-year_anniversary
15) "Sharing Earth observation satellite data to help understand our planet," ESA, Dec. 1, 2016, URL: http://m.esa.int/Our_Activities/Observing_the_Earth/
Sharing_Earth_observation_satellite_data_to_help_understand_our_planet
16) Melanie Rankl, Johannes Jakob Fürst, Angelika Humbert, Matthias Holger Braun, "Dynamic changes on Wilkins Ice Shelf during the 2006–2009 retreat derived from satellite observations," The Cryosphere, EGU (European Geoscience Union), Published: 18 Oct 2016, doi:10.5194/tc-2016-218, URL: http://www.the-cryosphere-discuss.net/tc-2016-218/tc-2016-218.pdf
17) "Wilkins Ice Shelf ice speeds," ESA, Dec. 1, 2016, URL: http://m.esa.int/spaceinimages/Images/2016/12/Wilkins_Ice_Shelf_ice_speeds
18) Xinan Liu, Quanan Zheng, Ren Liu, Dan Wang, James H. Duncan, Shih-Jen Huang, "A study of radar backscattering from water surface in response to rainfall," Journal of Geophysical Research, Oceans, Feb. 2, 2016, DOI: 10.1002/2015JC010975, URL: http://onlinelibrary.wiley.com/doi/10.1002/2015JC010975/full
19) Mark Zastrow, "The Unique Radar Signature of Rain Falling on Water," Journal of Geophysical Research, Oceans, Feb. 17, 2016, URL: http://agupubs.onlinelibrary.wiley.com/agu/article/10.1002/2015JC010975/editor-highlight/
20) "The Unique Radar Signature of Rain Falling on Water," EOS Earth & Space Science News, EOS Vol. 97, Feb. 19, 2016, URL: https://eos.org/research-spotlights/the-unique-radar-signature-of-rain-falling-on-water
21) "Taking down Envisat model," ESA, Jan. 6, 2016, URL: http://www.esa.int/spaceinimages/Images/2016/01/Taking_down_Envisat_model
22) "Ecuador's Highlands," ESA, Feb. 28, 2014, URL: http://www.esa.int/spaceinimages/Images/2014/02/Ecuador_s_highlands
23) "Dasht-e Lut salt desert, Iran," released by the ESA Earth from Space video program on Nov. 15, 2013, URL: http://spaceinimages.esa.int/Images/2013/11/Dasht-e_Lut_salt_desert_Iran
24) "Week in Images," ESA, released Sept. 13, 2013, URL: http://www.esa.int/Highlights/Week_In_Images_09_13_September_2013
25) "Our Living Planet: Earth's 'Carbon Dioxide Breathing' seen from space," ESA, Sept. 4, 2013, URL: http://www.esa.int/Our_Activities/Observing_the_Earth/Space_for_our_
climate/Our_living_planet_Earth_s_carbon_dioxide_breathing_seen_from_space
26) "Africa's ups and downs," ESA, Aug. 7, 2013, URL: http://www.esa.int/Our_Activities/Observing_the_Earth/Highlights/Africa_s_ups_and_downs
27) http://www.esa.int/Highlights/Week_In_Images_15-19_July_2013
28) Henri Laur, "ESA EO missions," 3rd GSCB (Ground Segment Coordination Body) Workshop, 2012, ESA/ESRIN, Frascati, Italy, June 6-7, 2012, URL: http://earth.esa.int/gscb/papers/2012/12-ESA_missions.pdf
29) "ESA declares end of mission for Envisat," ESA, May 9,2012, URL: http://www.esa.int/esaCP/SEM1SXSWT1H_index_0.html
30) "Envisat services interrupted," ESA, April 12, 2012, URL: http://www.esa.int/esaCP/SEMQ2EHWP0H_index_0.html
31) "Happy birthday, Envisat," ESA, March 1, 2012, URL: http://www.esa.int/esaEO/SEMB3P4Y1ZG_index_0.html
32) "Earth from Space: A southern summer bloom," ESA, January 13, 2012, URL: http://www.esa.int/esaEO/SEMB88KX3XG_index_0.html
33) "Envisat status," ESA Bulletin, No 148, Nov. 2011, p. 79
34) ESA teams and ESA supporting companies, "SAR Interferometry opportunities with the European Space Agency, ERS-1, ERS-2, Envisat, Sentinel-1A /-1B ESA 3rd Party Missions (ALOS)," Fringe 2011, 8th International Workshop on 'Advances in the Science and Applications of SAR Interferometry,' Frascati, Italy Sept. 19-23, 2011, URL: http://earth.eo.esa.int/workshops/fringe2011/files/Laur%20-%20ESA%20and%20inSAR%20-%20Fringe11.pdf
35) "Around the world – 50 000 times," ESA, Sept. 23, 2011, URL: http://www.esa.int/esaEO/SEMBZV3UNSG_index_0.html
36) "Revealed: an ice sheet on the move," ESA, Aug. 18, 2011, URL: http://www.esa.int/esaCP/SEMNVJOT9RG_index_0.html
37) E. Rig not, J. Mouginot, B. Scheuchl, "Ice Flow of the Antarctic Ice Sheet," Science, Sept. 9, 2011, Vol. 333, No 6048, pp. 1427-1430, DOI: 10.1126/science.1208336
38) Bernd Scheuchl; Jeremie Mouginot; Eric Rignot, "Antarctic Ice Velocity Mapped from Space: A Game Changing New Product," September 2011, URL: http://www.waisworkshop.org/presentations/2011/Session4/Scheuchl.pdf
39) "Envisat," ESA Bulletin, No 147, August 2011, p. 76
40) "Sendai Earthquake of March 2011," Neva Ridge Technologies, URL: https://web.archive.org/web/20111103140116/http://www.nevaridge.com/Sendai_earthquake.php
41) Nuno Miranda, Berthyl Duesmann, Monserrat Pinol, Davide Giudici, Davide D'Aria, "Impact of the Envisat Mission Extension on SAR data," ESA Technical Note, Oct. 12, 2010, URL: http://earth.esa.int/pub/ESA_DOC/ENVISAT/Impact_of_Envisat_Mission_Extension_on_SAR_data_-_1_01.pdf
42) N. Miranda, P. J. Meadows, D. D'Aria, D. Giudici, "Status of Envisat ASAR Instruments and Products," Proceedings of the CEOS SAR Cal/Val Workshop, Zürich, Switzerland, Aug. 25-27, 2010
43) "Envisat in its new home," Oct. 28, 2010, URL: http://www.esa.int/esaEO/SEMEZX1PLFG_index_0.html
44) Frank J. Diekmann, Daniel Mesples, Pier G. Bargellini, Magnus Nilsson, Miguel Canela, Sergio Vazzana, Thorsten Fehr, "Extending the Envisat Mission – Impacts on Ground and Space Segment Operations," Proceedings of the SpaceOps 2010 Conference, Huntsville, ALA, USA, April 25-30, 2010, paper: AIAA 2010-2257
45) "Last 'tango' in space," ESA, Nov. 2, 2010, URL: http://www.esa.int/esaEO/SEMSSJ4PVFG_index_0.html
46) http://envisat.esa.int/news/index.html
47) "Envisat Quarterly Status Report, (QSR 2006/4)," ESA/PB-EO(2007)9, Jan. 15, 2007
48) "Envisat Quarterly Status Report, (QSR 2005/1)," ESA/PB-EO(2005)40, April 12, 2005
49) "ESA extends Envisat satellite mission," June 5, 2009, URL: http://www.esa.int/esaCP/SEM08O1OWUF_index_0.html
50) Henri Laur, "SAR Interferometry opportunities with the European Space Agency: ERS-1, ERS-2, Envisat, Sentinel-1A, Sentinel-1B, ESA 3rdParty Missions (ALOS)," Fringe 2009 Workshop - Advances in the Science and Applications of SAR Interferometry, Frascati, Italy, Nov. 30-Dec. 4, 2009, URL: http://earth.eo.esa.int/workshops/fringe09/participants/758/pres_758_HLaur.pdf
51) "ESA satellites flying in formation," Dec. 3, 2008, URL: http://www.esa.int/esaEO/SEMWI74Z2OF_index_0.html
52) "ESA's old EO missions perform sophisticated new tricks," April 29, 2009, URL: http://news.eoportal.org/eomissions/090505_eom2.html
53) D. Mesples, Pier G. Bargellini, M. Nilsson, M. Horblin, "ENVISAT Memory Faults – Lessons Learnt," Proceedings of the SpaceOps 2010 Conference, Huntsville, ALA, USA, April 25-30, 2010, paper: AIAA 2010-1964
54) H. Fischer, "The MIPAS/EnviSat experiment: Status and results," 12th ASSFTS (Atmospheric Science from Space using Fourier Transform Spectrometry) Workshop, May 18-20, 2005, Quebec City, Canada, URL: https://web.archive.org/web/20120824020656/http://bernath.uwaterloo.ca:80/ASSFTS/Media/ASSFTS%20Presentations/pdfPres/Fischer.pdf
55) T. Fehr , E. Attema, A. Dehn, J. Frerick, R. M. Koopman, H. Laur, M. De Laurentis, P. Lecomte, F. Niro, L. S. de Miguel, P. Snoeij, "The Envisat Atmospheric Chemistry Mission: status and performance," Atmospheric Science Conference 2006, ESA/ESRIN, Frascati, Italy, May 8-12, 2006
56) S. Ceccherini, C. Belotti, B. Carli, P. Raspollini, M. Ridolfi, "MIPAS New Measurement Scenario: Enhanced Vertical Resolution and Regularization," Atmospheric Science Conference 2006, ESA/ESRIN, Frascati, Italy, May 8-12, 2006
57) http://www.esa.int/esaEO/SEM7BLMVGJE_index_0.html
58) "Envisat completes its ten thousandth orbit around Earth," January 30, 2004, URL: http://www.esa.int/esaEO/SEM5RN474OD_index_0.html
59) P. Soerensen, A. Rudolph, L. O'Rourke, T. Beck, X. Marx, et al., The Flight Operations Segment, ESA Bulletin, No 106, June 2001, pp. 88-95
60) J.-L. Bézy, S. Delwart, M. Rast, "MERIS - A New Generation of Ocean-Color Sensor onboard ENVISAT," ESA Bulletin, No 103, August 2000, pp. 48-56, URL: http://www.esa.int/esapub/bulletin/bullet103/besy103.pdf
61) "MERIS Medium Resolution Imaging Spectrometer," ESA brochure
62) J.-L. Bézy, G. Gourmelon, R. Bessudo, G. Baudin, H. Sonntag, S. Weiss, "The EnviSat Medium Resolution Imaging Spectrometer (MERIS), Proceedings of IGARSS'99, Vol. 2, pp. 1432-1434, Hamburg, June 28 - July 2, 1999
63) http://envisat.esa.int/instruments/meris/
64) M. Morel , J. L. Bézy, F. Montagner, A, Morel, J. Fischer, "Envisat's Medium-Resolution Imaging Spectrometer," ESA Bulletin, No. 76, November 1993, pp. 40-46,
65) G. Levrini, E. Attema, "The Commissioning Phase and the Calibration/Validation Activities," ESA Bulletin, No 106, June 2001, pp. 109-117, URL: http://www.esa.int/esapub/bulletin/bullet106/bul106_10.pdf
66) G. Levrini, E. Attema, "The Envisat Calibration and Validation Approach," ESA Earth Observation Quarterly, No 67, Oct. 2000, pp. 9-16
67) http://envisat.esa.int/instruments/meris/
68) M. Endemann, "MIPAS Instrument Concept and Performance," European Symposium on Atmospheric Measurements from Space, Noordwijk, The Netherlands, Jan 1999, URL: http://envisat.esa.int/services/sample_products/mipas/
documentation/MIPAS/MIPAS_performance_ESAMS_99.pdf
69) M. Endemann, P. Garé, D. J. Smith, R. Geßner, "The EnviSat Michelson Interferometer for Passive Atmospheric Sounding (MIPAS)," Proceedings of IGARSS'99, Vol. 2, pp. 1435-1437, Hamburg, Germany, June 28 - July 2, 1999
70) M. Endemann, H. Fischer, "Envisat's High-Resolution Limb Sounder: MIPAS," ESA Bulletin 76, November 1993, pp. 47-52
71) W. Posselt, "Michelson Interferometer for Passive Atmospheric Sounding," Proceedings of the Twenty-fourth International Symposium on Remote Sensing of the Environment, May 27-31, 1991, Rio de Janeiro, Volume II, pp. 737-748, ERIM, Ann Arbor MI.
72) M. Endermann, Ph. Gare, D. J. Smith, K. Hoerning, B. Fladt, R. Geissler, "MIPAS: Design Overview and Current Development Status," Proceedings of SPIE, Vol. 2956, pp. 124-135, Sept. 24-26, 1996,
73) http://www.leos.le.ac.uk/mipas/
74) http://envisat.esa.int/instruments/mipas/
75) H. Fischer, "The MIPAS/EnviSat experiment: Status and results," 12th ASSFTS (Atmospheric Science from Space using Fourier Transform Spectrometry) Workshop, May 18-20, 2005, Quebec City, Canada, URL: http://bernath.uwaterloo.ca/ASSFTS/Media/ASSFTS%20Presentations/pdfPres/Fischer.pdf
76) Johannes Orphal, "MIPAS - 10 Years of Spectroscopic Mesurements for Investigating Atmospheric Composition," Proceedings of ATMOS 2012, Advances in Atmospheric Science and Applications, Bruges, Belgium, June 18-22, 2012, URL: http://congrexprojects.com/docs/12m06_docs2/3_esa-atmscience2012-orphal-mipas.pdf
77) M. Zink, C. Buck, J. L. Suchail, R. Torres, A. Bellini, J. Closa, Y-L. Desnos, B. Rosich, "The Radar Imaging Instrument and Its Applications: ASAR," ESA Bulletin No 106, June 2001, pp. 46-55, URL: http://www.esa.int/esapub/bulletin/bullet106/bul106_3.pdf
78) Y. L. Desnos, C. Buck, J. Guijarro, J-L. Suchail, R. Torres, E. Attema, "ASAR - Envisat's Advanced Synthetic Aperture Radar," ESA Bulletin, No. 102, May 2000, pp. 91-100, URL: http://www.esa.int/esapub/bulletin/bullet102/Desnos102.pdf
79) J. L. Suchail, C. Buck, J. Guijarro, R. Torres, "The EnviSat Advanced Synthetic Aperture Radar Instrument," Proceedings of IGARSS'99, Vol. 2, pp. 1441-1443, Hamburg, Germany, June 28 - July 2, 1999
80) "ASAR Advanced Synthetic Aperture Radar," ESA brochure
81) http://envisat.esa.int/instruments/asar/
82) http://envisat.esa.int/handbooks/asar/CNTR3.htm#eph.asar.instr
83) S. Karnevi, E. Dean, D. J. Q. Carter, S. S. Hartley, "Envisat's Advanced Synthetic Aperture Radar: ASAR," ESA Bulletin, No. 76, November 1993, pp. 30-35
84) E. Attema, Y-L. Desnos, G. Duchossois, "Synthetic Aperture Radar in Europe: ERS, Envisat, and Beyond," JHU/APL Technical Digest, Vol. 21, No. 1, 2000, pp. 155- 161
85) "Image of the day: Volcanic uplift," ESA, July 2, 2010, URL: http://www.esa.int/SPECIALS/Living_Planet_Symposium_2010/SEMPE9PZVAG_0.html
86) http://envisat.esa.int/instruments/ra2/
87) http://envisat.esa.int/handbooks/ra2-mwr/CNTR3-2.htm
88) J. Benveniste, M. Roca, G. Levrini, P. Vincent, S. Baker, O. Zanife, C. Zelli, O. Bombaci, "The Radar Altimetry Mission: RA-2, MWR, DORIS, and LRR," ESA Bulletin, No 106, June 2001, pp. 67-76, URL: http://www.esa.int/esapub/bulletin/bullet106/bul106_5.pdf
89) C. Zelli, et al., "RA-2 Radar Altimeter: Instrument EM Model Performance Results," IGARSS'97, Vol. 1, pp. 18-20
90) G. Angino, et al., "High Spatial Resolution Radar Altimetry for Global Earth Topography Mapping," IGARSS'97, Vol. 1, pp. 15-17
91) A. Resti, "Envisat's Radar Altimeter: RA-2," ESA Bulletin, No. 76, November 1993, pp. 58-60,
92) A. Resti, et al., "The Envisat Radar Altimeter System (RA-2)," ESA Bulletin No. 98, June 1999, pp. 94-101, URL: http://www.esa.int/esapub/bulletin/bullet98/RESTI.PDF
93) H. Nett, J. Frerick, T. Paulsen, G. Levrini, "The Atmospheric Instruments and their Applications: GOMOS, MIPAS and SCIAMACHY," ESA Bulletin, No 106, June 2001, pp. 77-87, URL: http://www.esa.int/esapub/bulletin/bullet106/bul106_6.pdf
94) T. Paulsen, A. F. Popescu, G. Ratier, G. Uguen, Ch. Lemercier, "The Global Ozone Monitoring by Occultation of Stars (GOMOS), Proceedings of IGARSS'99, Vol. 2, pp. 1438-1440, Hamburg, Germany, June 28 - July 2, 1999
95) G. Ratier, G. Levrini, A. Popescu, T. Paulsen, C. Readings, J. Langen, "GOMOS: Envisat's Contribution to Measuring Long-Term Trends in Ozone and Other Trace Gases, ESA Bulletin, Nr. 97, March 1999, pp. 20-27, URL:http://www.esa.int/esapub/bulletin/bullet97/ratier.pdf
96) A. Popescu, P. Ingmann, "Envisat's Global Ozone Monitoring by Occultations of Stars Instrument: GOMOS," ESA Bulletin, No. 76, November 1993, pp. 36-39
97) GOMOS handout from `Atmospheres Panel Meeting' in Washington DC, Feb. 26-27, 1991
98) "GOMOS - Global Ozone Monitoring by Occultation of Stars," ESA brochure
99) J. L. Bertaux, E. Kyrölä, T. Wehr, "Stellar Occultation Technique for Atmospheric Ozone Monitoring: GOMOS on Envisat," ESA Earth Observation Quarterly, No 67, Oct. 2000, pp. 17-20
100) J. Tamminen, E. Kyrölä, V. Sofieva, J. Hakkarainen, P. T. Verronen, S. Tukiainen, J.-L. Bertaux, A. Hauchecorne, F. Dalaudier, K. Pérot, D. Fussen, F. Vanhellemont, C. Tétard, L. Blanot, G. Barrot, O. Fanton d'Andon, L. Saavedra,T. Fehr, A. Dehn, "Ten years of Envisat/GOMOS measurements," URL: http://congrexprojects.com/docs/12m06_docs2/
2_tamminen_gomos10y_2012_jt_final-pptx.pdf
101) J. Langen, "Envisat's Contribution to Atmospheric Chemistry Studies," Proceedings of IGARSS'99, Hamburg, Vol. III, June 28-July 2, 1999, pp. 1497-1499
102) J. Bertaux, "Vertical Profiles of Ozone from Envisat Space Platform with GOMOS Instrument," Proceedings of IGARSS'99, Hamburg, Vol. III, June 28-July 2, 1999, pp. 1616-1618
103) J. Guijarro, A. Auriol, M. Costes, C. Jayles, P. Vincent, "MWR and DORIS - Supporting Envisat's Radar Altimetry Mission," ESA Bulletin, No 104, Nov. 2000, pp. 41-46, URL: http://www.esa.int/esapub/bulletin/bullet104/guijarro104.pdf
104) M. L'Abbate, O. Bombaci,G. Alberti, P. Femenias, "Envisat-1 MWR, In Flight Functional and Performance Verification," Proceedings from the Envisat Validation Workshop, December 2002,
105) http://envisat.esa.int/object/index.cfm?fobjectid=3775&contentid=3852
106) http://envisat.esa.int/instruments/doris/
107) J.-P. Huot, H. Tait, M. Rast, S. Delwart, J.-L. Bézy, G. Levrini, "The Optical Imaging Instruments and their Applications: AATSR and MERIS," ESA Bulletin, No 106, June 2001, pp. 56-66, URL: http://www.esa.int/esapub/bulletin/bullet106/bul106_4.pdf
108) http://www.leos.le.ac.uk/aatsr/
109) D. Lllewellyn-Jones, M. C. Edwards, C. T. Mutlow, A. R. Birks, I. J. Barton, H. Tait, "AATSR: Global-Change and Surface Temperature Measurements from Envisat," ESA Bulletin, 105, Feb. 2001, pp. 11-21, URL: http://www.esa.int/esapub/bulletin/bullet105/bul105_1.pdf
110) M. Gottwald, H. Bovensmann, G. Lichtenberg, S. Noel, A. von Bargen, S. Slijkhuis, A. Piters, R. Hoogeveen, C. von Savigny, M. Buchwitz, A. Kokhanovsky, A. Richter, A. Rozanov, T. Holzer-Popp, K. Bramstedt, J.-C. Lambert, J. Skupin, F. Wittrock, H. Schrijver, J. P. Burrows: "SCIAMACHY, Monitoring the Changing Earth's Atmosphere," Published by DLR, 2006, http://atmos.caf.dlr.de/projects/scops/sciamachy_book/sciamachy_book.html
111) http://www.iup.uni-bremen.de/sciamachy/instrument/index.html
112) A. P. H. Goede, H, Schrijver, "SCIAMACHY: An Atmospheric Chemistry Instrument on ENVISAT," Proceedings of IGARSS'99, Hamburg, Vol. III, June28-July 2, 1999, pp. 1609-1611
113) S. Noël, H. Bovensmann, J. P. Burrows, J. W. Kaiser, "SCIAMACHY - A Hyperspectral Sensor for Global Atmospheric Studies," Proceedings of IGARSS/IEEE 2001, Sydney, Australia, July 9-13, 2001
114) H. Bovensmann, J. P. Burrows, M. Buchwitz, J. Frerick, S. Noël, et al., "SCIAMACHY - Mission objectives and measurement modes," Journal of Atmospheric Sciences., Vol. 56, No. 2, pp. 127-150, 1999
115) John P. Burrows, H. Bovensmann, S. Noel, M. Weber, M. Vountas, A. Richter, F. Wittrock, A. Rozonav, V. Rozanov, M. Vrekousis, A. Schoenhardt, C. von Savigny, K.-U. Eichmann, F. Ebije, M. Buchwitz, O. Schneising, M. Reuter, J. Heymann, C. Gerilowski, A. Bracher, M. Langowski, and all SCIAMACHY team members, "The first decade of SCIAMACHY, coupled with GOME and GOME-2 : Trace gas Measurements," Proceedings of ATMOS 2012, Advances in Atmospheric Science and Applications, Bruges, Belgium, June 18-22, 2012, URL: http://congrexprojects.com/docs/12m06_docs2/1_burrows-esa-18th-june-2012-03.pdf
116) http://envisat.esa.int/instruments/sciamachy/
117) http://envisat's/instruments/sciamachy/de scr/operational
118) http://www.esa.int/SPECIALS/Living_Planet_Symposium_2010/SEMRJ1MZLAG_0.html
119) M. Gottwald, E. Krieg, S. Noël, H. Bovensmann, J. P. Burrows, M. Wuttke, "SCIAMACHY on EnviSat - 4 Years in Space: A Status Report," Proceedings of IGARSS 2006 and 27th Canadian Symposium on Remote Sensing, Denver CO, USA, July 31-Aug. 4, 2006
120) http://envisat.esa.int/object/index.cfm?fobjectid=3777
121) G. Kohlhammer, "The EnviSat Exploitation Policy," ESA Bulletin, No 106, June 2001, pp. 128-133, URL: http://www.esa.int/esapub/bulletin/bullet106/bul106_12.pdf
122) P. Soerensen, A. Rudolph, L. O'Rourke, T. Beck, X. Marc, M. Pignède, K. Nergaard, R. Zanbergen, D. Suen, "The Flight Operations Segment," ESA Bulletin, No 106, June 2001, pp. 88-95, URL: http://www.esa.int/esapub/bulletin/bullet106/bul106_7.pdf
123) F. Martin Crespo, J.-P. Guignard, C. Garrido, M. Irle, "The Payload Data Segment," ESA Bulletin, No 106, June 2001, pp. 96-102, URL: http://www.esa.int/esapub/bulletin/bullet106/bul106_8.pdf
124) http://www.esa.int/esaMI/Operations/SEMOZY8L6VE_1.html#subhead5
125) S. Badessi, H. L. Moeller, P. Viau, D. Castrovillari, B. Collini-Nocker, "The Envisat Data Dissemination System," ESA Bulletin No 109, Feb. 2002, pp. 12-19, URL: http://www.esa.int/esapub/bulletin/bullet109/chapter2_bul109.pdf
126) I. Petiteville, P. Potin, O. Barois, S. Vazzana, J. Linford, M. Fonti, K. Hirst, "Envisat User Services," ESA Bulletin, No 106, June 2001, pp. 103-108, URL: http://www.esa.int/esapub/bulletin/bullet106/bul106_9.pdf
Overview Spacecraft Launch Mission Status Sensor Complement Ground Segment References Back to Top