GeoCARB (Geostationary Carbon Cycle Observatory)
EO
Atmosphere
NASA
Atmospheric chemistry
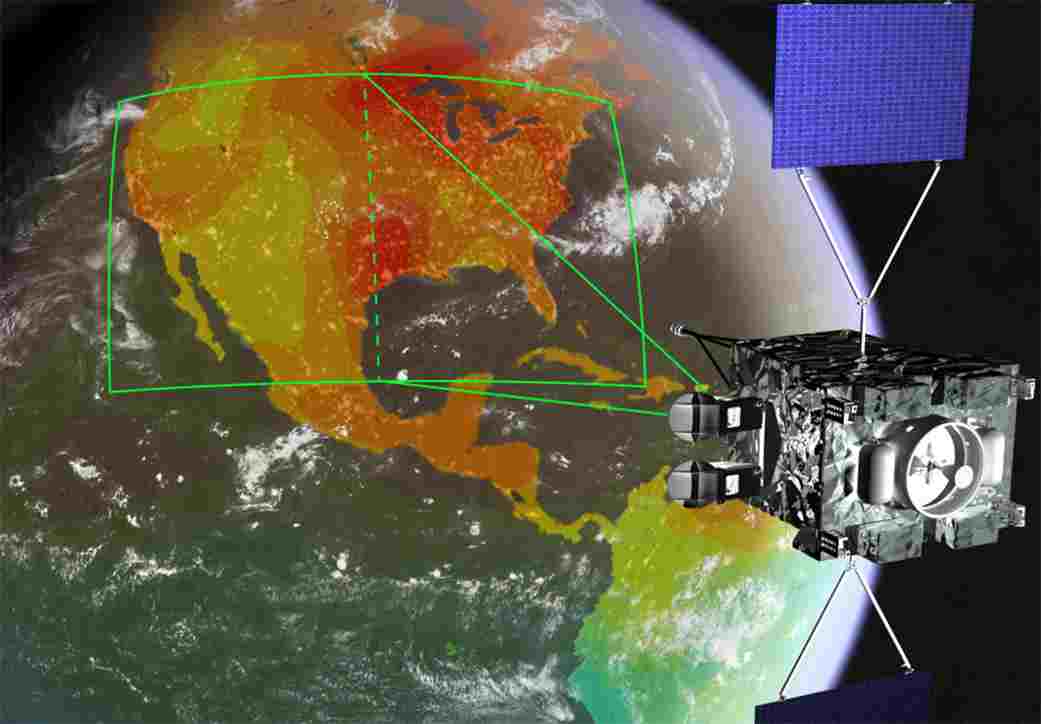
GeoCARB (Geostationary Carbon Observatory) was an atmospheric investigations mission, scheduled to operate from the end of June 2025, however the mission was cancelled in November 2022. As the second airborne investigation in NASA’s Earth Venture-Mission series, the mission aimed to measure the concentrations of carbon dioxide, carbon monoxide and methane in the air above South and North America, and to assess vegetation health levels, ultimately advancing the current understanding of Earth's natural exchanges of carbon between land, atmosphere and ocean.
Quick facts
Overview
| Mission type | EO |
| Agency | NASA |
| Mission status | - |
| Measurement domain | Atmosphere |
| Measurement category | Trace gases (excluding ozone) |
| Measurement detailed | CH4 Mole Fraction, CO2 Mole Fraction, CO Mole Fraction |
| Instruments | Scanning Spectrometer (GeoCarb) |
| Instrument type | Atmospheric chemistry |
| CEOS EO Handbook | See GeoCARB (Geostationary Carbon Cycle Observatory) summary |
Summary
Mission Capabilities
GeoCARB was itself an instrument and not a spacecraft, designed as a payload for a host geostationary satellite.
GeoCARB was a 4-channel, single-slit imaging spectrometer, able to measure carbon dioxide (CO2) at wavelengths of 1.61 and 2.06 µm, carbon monoxide (CO) and methane (CH4) at a wavelength of 2.32 µm, as well as oxygen dioxide (O2) and Solar-Induced Fluorescence (SIF) at a wavelength of 0.76 µm. The SIF gauge provided valuable information on aerosol and cloud contamination. Thus, GeoCARB would have performed daily measurements of the total concentration of CO2, CO, CH4 and SIF in the American atmosphere.
The instrument consisted of the aperture assembly, a telescope, two grating spectrometers, four focal plane assemblies which operated at 125 K, a Cold Optical Bench operating at 190 K, and electronics boxes. The mission received light reflected from the Earth’s surface through a narrow slit, allowing for a large North-South (N-S) extent with high spatial resolution along the scan. The data was processed via an optimal estimation technique based on algorithms from former NASA missions, resulting in the retrieval of the dry-air mixing ratios of the aforementioned gases of interest.
Performance Specifications
GeoCARB would have scanned the Americas from a geostationary orbit, so that the same geographical region could have been investigated through various weather conditions. The on-board N-S extent of the scan was fixed at a 4.4° viewing angle, which corresponded to 25° in latitude, or 2,800 km at nadir on the Earth's surface. Each scan was composed of 1016 N-S samples, spaced 2.7 km apart and collected with a 3 km East-West (E-W) double sampling. Scans involved a 4.08 second integration time, followed by a 0.3825 second E-W step. This allowed GeoCARB to scan the conterminous United States (CONUS) in less than 2.5 hours, and the area from Brazil to South America’s West Coast in less than three hours. The swath overseen by the instrument had a 14040 km2 area, and the horizontal ground resolution is 5-10 km. The instrument’s rate of data collection was 10 Mbit per second, while the estimated number of soundings per day was 10 million.
The scan patterns were flexible, allowing for updates that focus on observing areas of greater interest or uncertainty, on calibration and validation, or on transient events in a campaign mode.
Space and Hardware Components
The GeoCARB instrument weighed 138 kg and had a volume of almost 2 m3.
Initially, it was envisioned that GeoCARB would be hosted by a SES Government Solutions commercial communications platform. However, the sharp drop in commercial geostationary satellite orders in recent years had reduced NASA’S options, and they were seeking other prospective hosts for this second airborne Earth Venture-Mission.
GeoCARB (Geostationary Carbon Cycle Observatory)
Host Spacecraft Mission Status Launch GeoCarb Instrument References
GeoCARB was a NASA Earth science mission with the goal to measure key greenhouse gases and vegetation health from space to advance our understanding of Earth's natural exchanges of carbon between the land, atmosphere and ocean. The PI mission was led by Berrien Moore of the University of Oklahoma in Norman, Oklahoma. The primary objectives were to monitor plant health and vegetation stress throughout the Americas, and to probe, in unprecedented detail, the natural sources, sinks and exchange processes that control carbon dioxide, carbon monoxide and methane in the atmosphere. 1)
The investigator-led mission was going to be launched on a commercial communications satellite to make observations over the Americas from an orbit of approximately 35,786 km above the equator. In December 2016, NASA's selection of the GeoCarb mission was competitively selected from 15 proposals submitted to the agency's second Earth Venture - Mission announcement of opportunity for small orbital investigations of the Earth system.
GeoCARB would have measured daily the total concentration of carbon dioxide, methane and carbon monoxide in the atmosphere with a horizontal ground resolution of 5 to 10 km. GeoCARB would also have measured solar-induced fluorescence, a signal related directly to changes in vegetation photosynthesis and plant stress.
GeoCARB was the second spaceborne investigation in the EVM-2 (Earth Venture - Mission) series of rapidly developed, cost-constrained projects for NASA's Earth Science Division. The CYGNSS (Cyclone Global Navigation Satellite System), selected in 2012, was the first mission in the series and launched from Florida on Dec. 15, 2016.
The University of Oklahoma-led GeoCARB team was going to build an advanced payload that would have launched on a commercial communications satellite, employing otherwise unused launch and spacecraft capacity to advance science and provide societal benefit. By demonstrating GeoCARB can be flown as a hosted payload on a commercial satellite, the mission would have strengthen NASA's partnerships with the commercial satellite industry and provided a model that could have been adopted by NASA's international partners to expand these observations to other parts of the world.
Mission partners included the Lockheed Martin Advanced Technology Center in Palo Alto, California; SES Government Solutions Company in Reston, Virginia; the Colorado State University in Fort Collins; and NASA/ARC (Ames Research Center) in Moffett Field, California, GSFC (Goddard Space Flight Center) in Greenbelt, Maryland, and JPL (Jet Propulsion Laboratory) in Pasadena, California.
The Earth Venture missions are part of NASA's ESSP (Earth System Science Pathfinder) program. The Venture Class small, targeted science investigations complement NASA's larger research missions. A National Academies 2007 report, 'Earth Science and Applications from Space Decadal Survey', recommended NASA undertake these regularly solicited, quick-turnaround projects.
In early December 2016, NASA HQ announced that the GeoCARB (Geostationary Carbon Cycle Observatory) was selected among 15 submitted proposals as the EVM-2 mission. The mission would have monitored plant health and vegetation stress throughout the Americas, and probed the natural sources, sinks, and exchange processes that control carbon dioxide, carbon monoxide, and methane in the atmosphere.
GeoCARB would have launched as a hosted payload on a commercial geosynchronous communications satellite. The intent was for GeoCARB to employ otherwise unused launch and spacecraft capacity to advance science and provide societal benefits. By demonstrating that it could have been flown as a hosted payload on a commercial satellite, GeoCARB would have strengthen NASA's partnerships with the commercial satellite industry and provided a model that could have been adopted by NASA's international partners to expand these observations to other parts of the world.
Background
Carbon is a building block of life on our planet. It is stored in reservoirs on Earth—in rocks, plants and soil—in the oceans, and in the atmosphere. And it cycles constantly between these reservoirs. Understanding the carbon cycle is crucially important for many reasons. It provides us with energy, stored as fossil fuel. Carbon gases in the atmosphere help regulate Earth's temperature and are essential to the growth of plants. Carbon passing from the atmosphere to the ocean supports photosynthesis of marine phytoplankton and the development of reefs. These processes and myriad others are all interwoven with Earth's climate, but the manner in which the processes respond to variability and change in climate is not well-quantified. 2)
The famous "Keeling curve," which tracks CO2 concentrations in Earth's atmosphere, is based on daily measurements at the Mauna Loa Observatory on Hawaii. It shows that global CO2 levels are rising over time, but also change seasonally due to biological processes. CO2 decreases during the Northern Hemisphere's spring and summer months, as plants grow and take CO2 out of the air. It rises again in fall and winter when plants go relatively dormant and ecosystems "exhale" CO2.
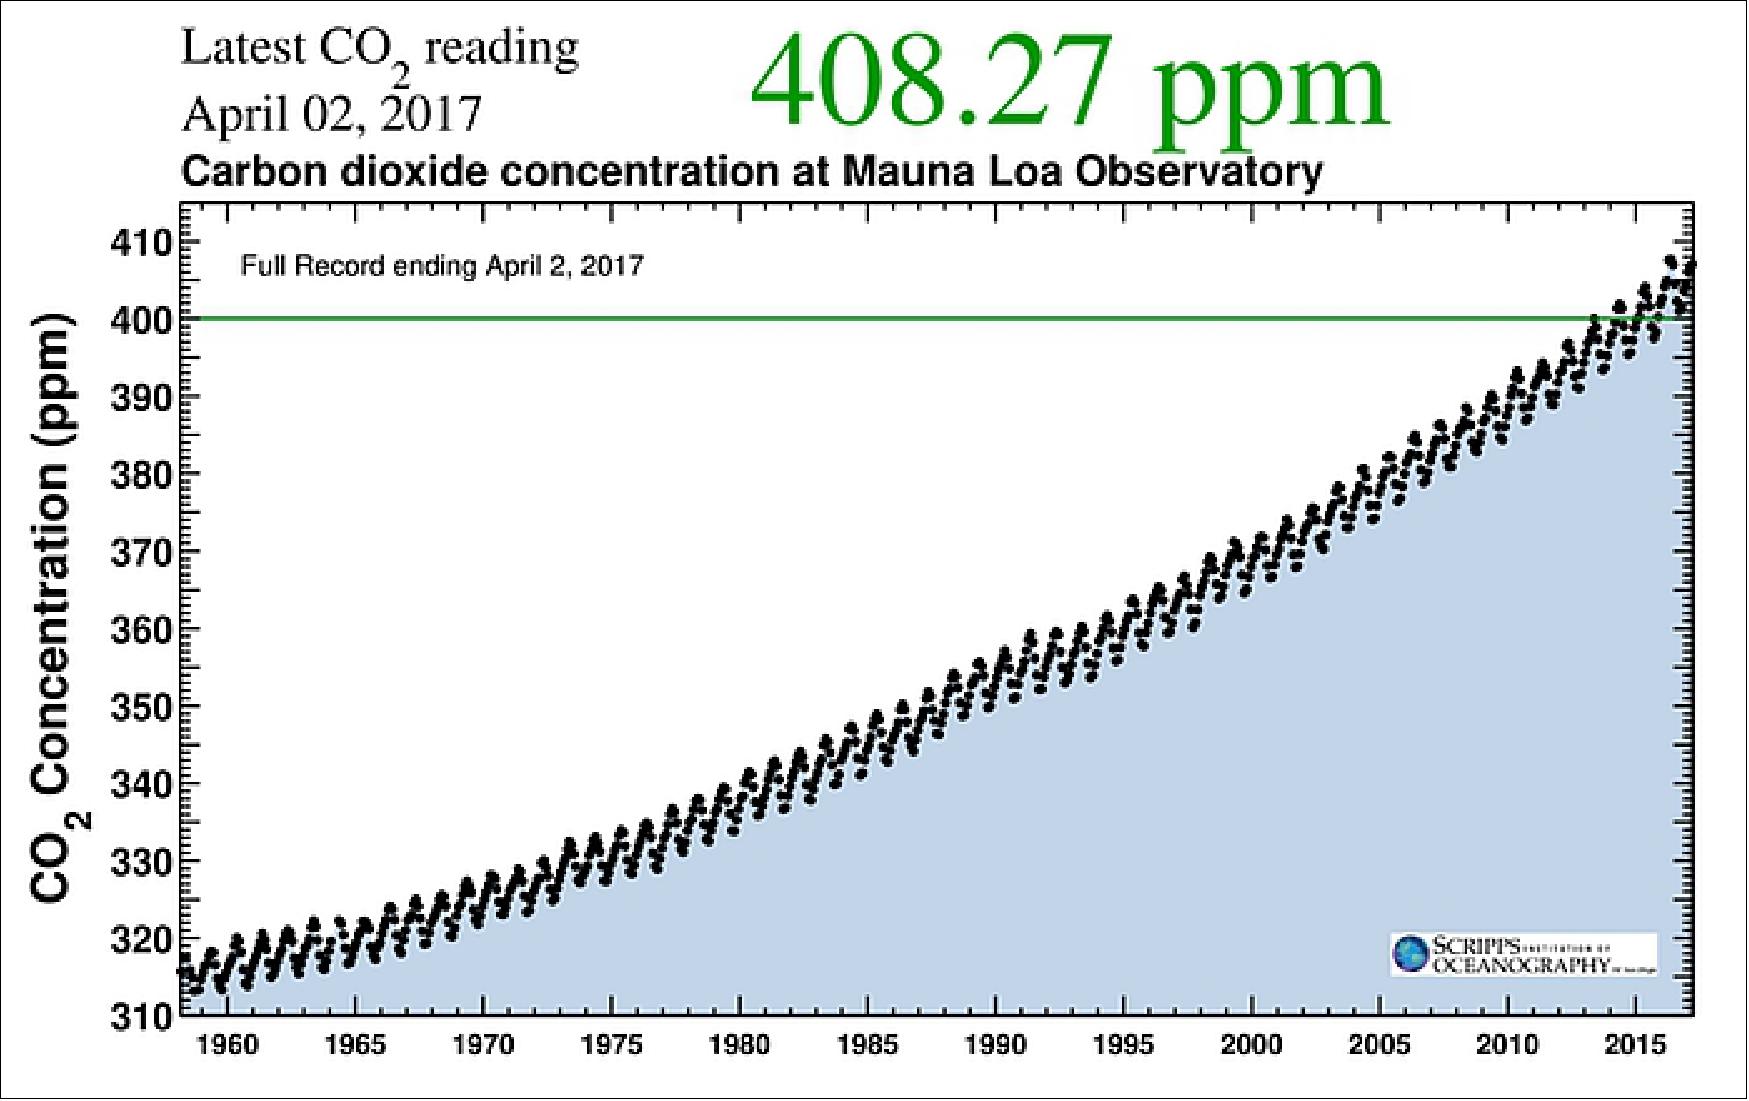
A closer look shows that every year's cycle is slightly different. In some years the biosphere takes more CO2 out of the atmosphere; in others it releases more to the atmosphere. We want to know more about what causes the year-to-year differences because that contains clues on how the carbon cycle works.
For example, during the El Niño of 1997-1998, a sharp rise in CO2 was largely driven by fires in Indonesia. The most recent El Niño in 2015-2016 also led to a rise in CO2, but the cause was probably a complex mixture of effects across the tropics – including reduced photosynthesis in Amazonia, temperature-driven soil release of CO2 in Africa and fires in tropical Asia.
These two examples of year-to-year variability in the carbon cycle, both globally and regionally, reflect what we now believe – namely, that variability is largely driven by terrestrial ecosystems. The ability to probe the climate-carbon interaction will require a much more quantitative understanding of the causes of this variability at the process level of various ecosystems.
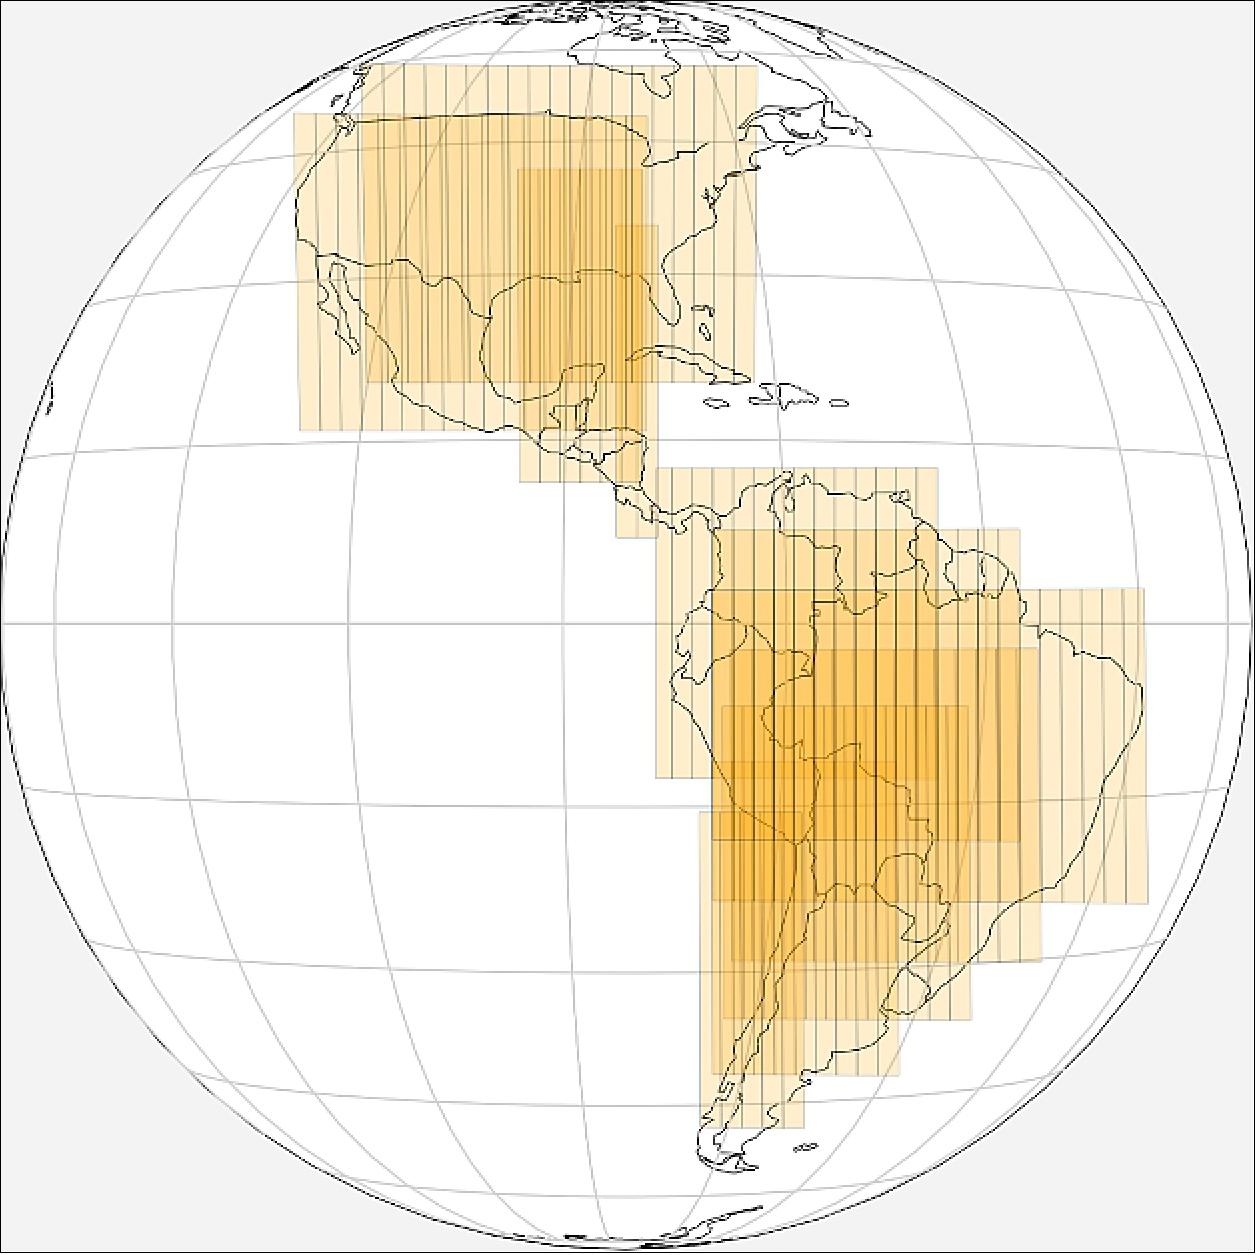
GeoCarb was goin to be launched into geostationary orbit at roughly 85 degrees west longitude, where it would have rotated in tandem with the Earth. From this vantage point, the major urban and industrial regions in the Americas from Saskatoon (the largest city in the Canadian province of Saskatchewan) to Punta Arenas (in the very south of Chile) would have been in view, as would have the large agricultural areas and the expansive South American tropical forests and wetlands. Measurements of carbon dioxide, methane and carbon monoxide once or twice daily over much of the terrestrial Americas would have helped to resolve flux variability for CO2 and CH4.
GeoCarb was also going to measure SIF (Solar Induced Fluorescence) – plants emitting light that they cannot use back out into space. This "flashing" by the biosphere is strongly tied to the rate of photosynthesis, and so provides a measure of how much CO2 plants take in.
NASA pioneered the technology that GeoCarb would have carried on an earlier mission, the OCO-2 (Orbiting Carbon Observatory-2). OCO-2 launched into a low Earth orbit in 2014 and has been measuring CO2 from space ever since, passing from pole to pole several times per day as the Earth turns beneath it.
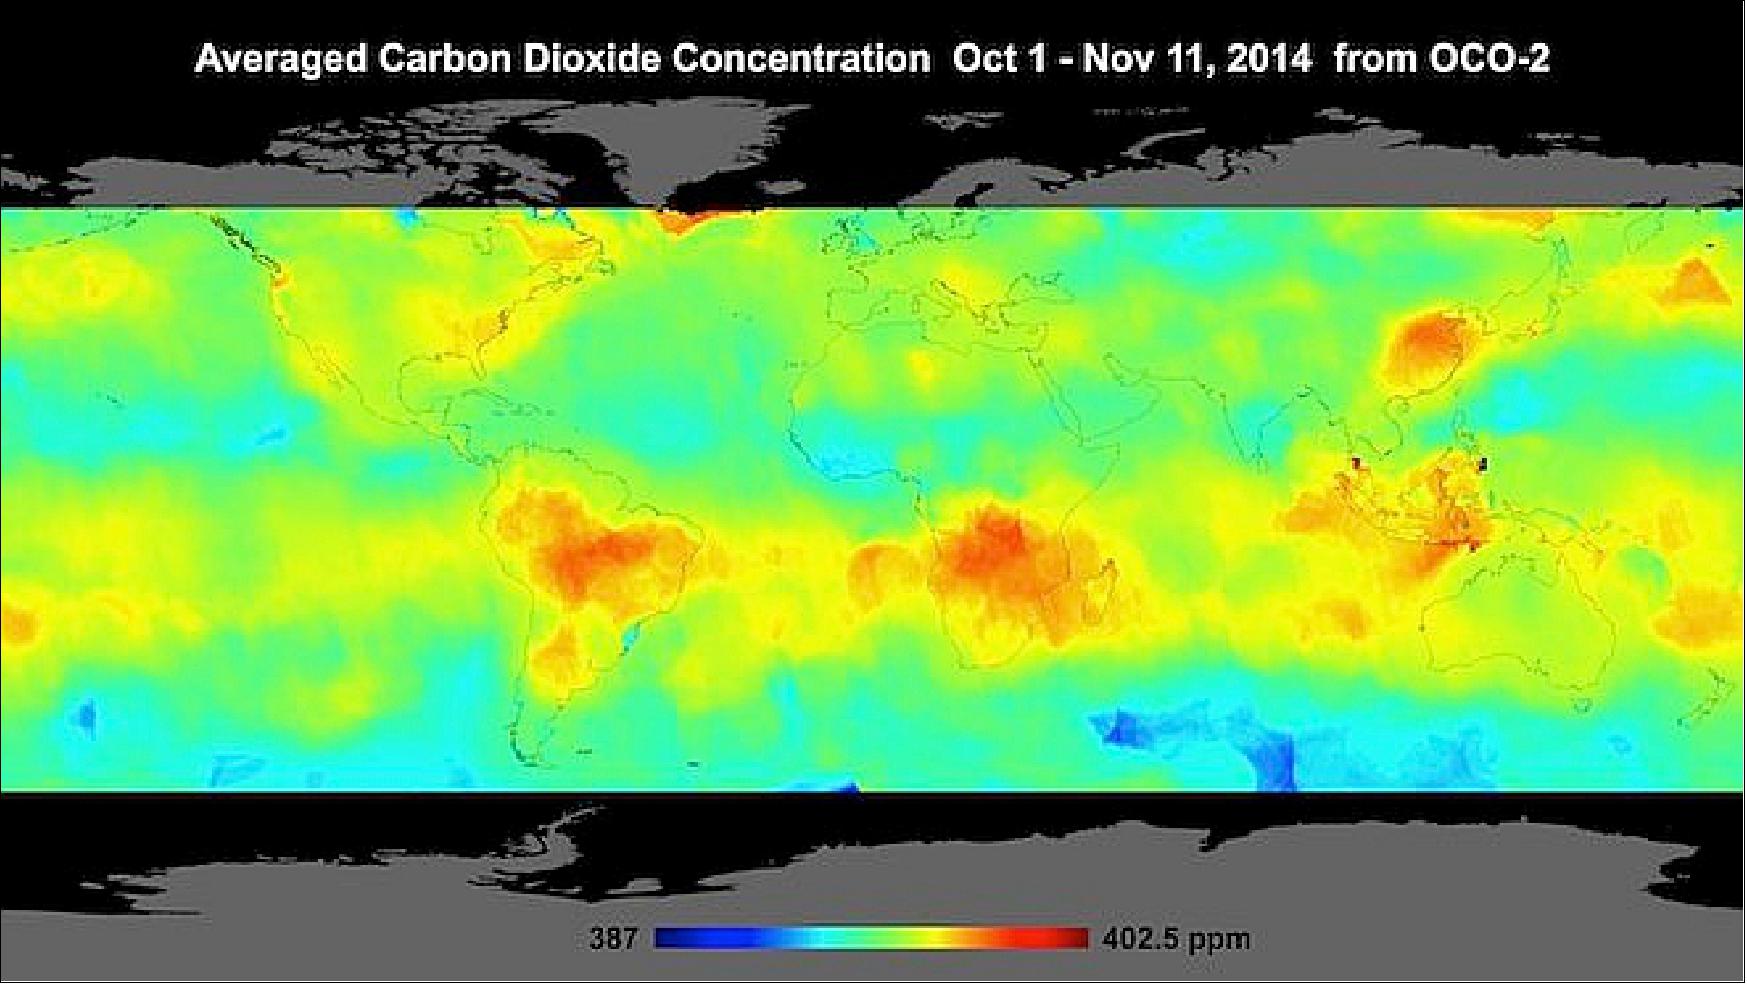
Though the instruments are similar, the difference in orbit was crucial. OCO-2 samples a narrow 10 km track over much of the globe on a 16 day repeat cycle, while GeoCarb would have looked at the terrestrial Western Hemisphere continuously from a fixed position, and scanned most of this land mass at least once per day.
Where OCO-2 may miss observing the Amazon for a season due to regular cloud cover, GeoCarb was going to target the cloud-free regions every day with flexible scanning patterns. Daily revisits would have shown the biosphere changing in near-realtime alongside weather satellites such as GOES 16, which is located at 105 degrees west, helping to connect the dots between the components of Earth's system.
Nuances of the carbon cycle: Many processes affect levels of CO2 in the atmosphere, including plant growth and decay, fossil fuel combustion and land use changes, such as clearing forests for farming or development. Attributing atmospheric CO2 changes to different processes is difficult using CO2 measurements alone, because the atmosphere mixes CO2 from all of the different sources together.
In addition to CO2 and CH4, GeoCarb was going to measure CO. Burning fossil fuel releases both CO and CO2. This means that when we were goint to see high concentrations of both gases together, we would have had evidence that they had being released by human activities. - Making this distinction is key so we do not assume that human-induced CO2 emissions come from a decrease in plant activity or a natural release of CO2 from soil. If we can distinguish between man-made and natural emissions, we can draw more robust conclusions about the carbon cycle. Knowing what fraction of these changes is caused by human activities is important for understanding our impact on the planet, and observing and measuring it is essential to any conversation about strategies for reducing CO2 emissions.
GeoCarb's measurement of methane would have been a crucial element in understanding the global carbon-climate system. Methane is produced by natural systems, such as wetlands, and by human activities such as natural gas production. We do not understand the methane portion of the carbon cycle as well as CO2. But just as with CO2, methane observations tell us a lot about the functioning of natural systems. Marshes release methane as part of the natural decay in the system. The rate of release is tied to how wet/dry and warm/cool the system is.
It is uncertain how much natural gas production contributes to methane emissions. One reason to quantify these emissions more accurately is that they represent lost revenue for energy producers. The EPA (Environmental Protection Agency) estimates a U.S. leakage rate of around 2 percent, which could add up to billions of dollars annually.
It was expected, based on simulations, that GeoCarb was going to produce maps that would have highlighted the largest leaks with only a few days of observations. Finding leaks would have reduced costs for energy producers and reduced the carbon footprint of natural gas. Currently, energy companies find leaks by sending personnel with detection equipment to suspected leak sites. Newer airborne sensors could have made the process cheaper, but they were still deployed on a limited basis and in an ad hoc manner. GeoCarb's regular observations was going to provide leakage information to producers in a timely manner and help them limit their losses.
Watching the planet breathe: With daily scans of landmasses in the Western Hemisphere, GeoCarb would have provided an unprecedented number of high-quality measurements of CO2, CH4 and CO in the atmosphere. These observations, along with direct measurements of photosynthetic activity from SIF observations, were going to raise our understanding of the carbon cycle to a new level.
For the first time we would have been able to watch as the Western Hemisphere breathes in and out every day, and to see the seasons change through the eyes of the biosphere. Equipped with these observations, we would have begun to disentangle natural and human contributions to the carbon balance. These insights were going to help scientists make robust predictions about Earth's future.
Spacecraft
SES-Government Solutions was selected as the GeoCarb host spacecraft provider as it delivered the best overall combination of flight experience, ability to provide an effective and suitable S/C host, experience and willingness to work with the PI and NASA, available launch windows and longitudes, and cost. 3)
The GeoCarb instrument was goint to be hosted and launched on a commercial geostationary communications platform. This approach leveraged the large size of these vehicles, their frequent launch to orbits over large population areas, their wide communications downlink bandwidth, and the availability of competitive pricing rates for hosting.
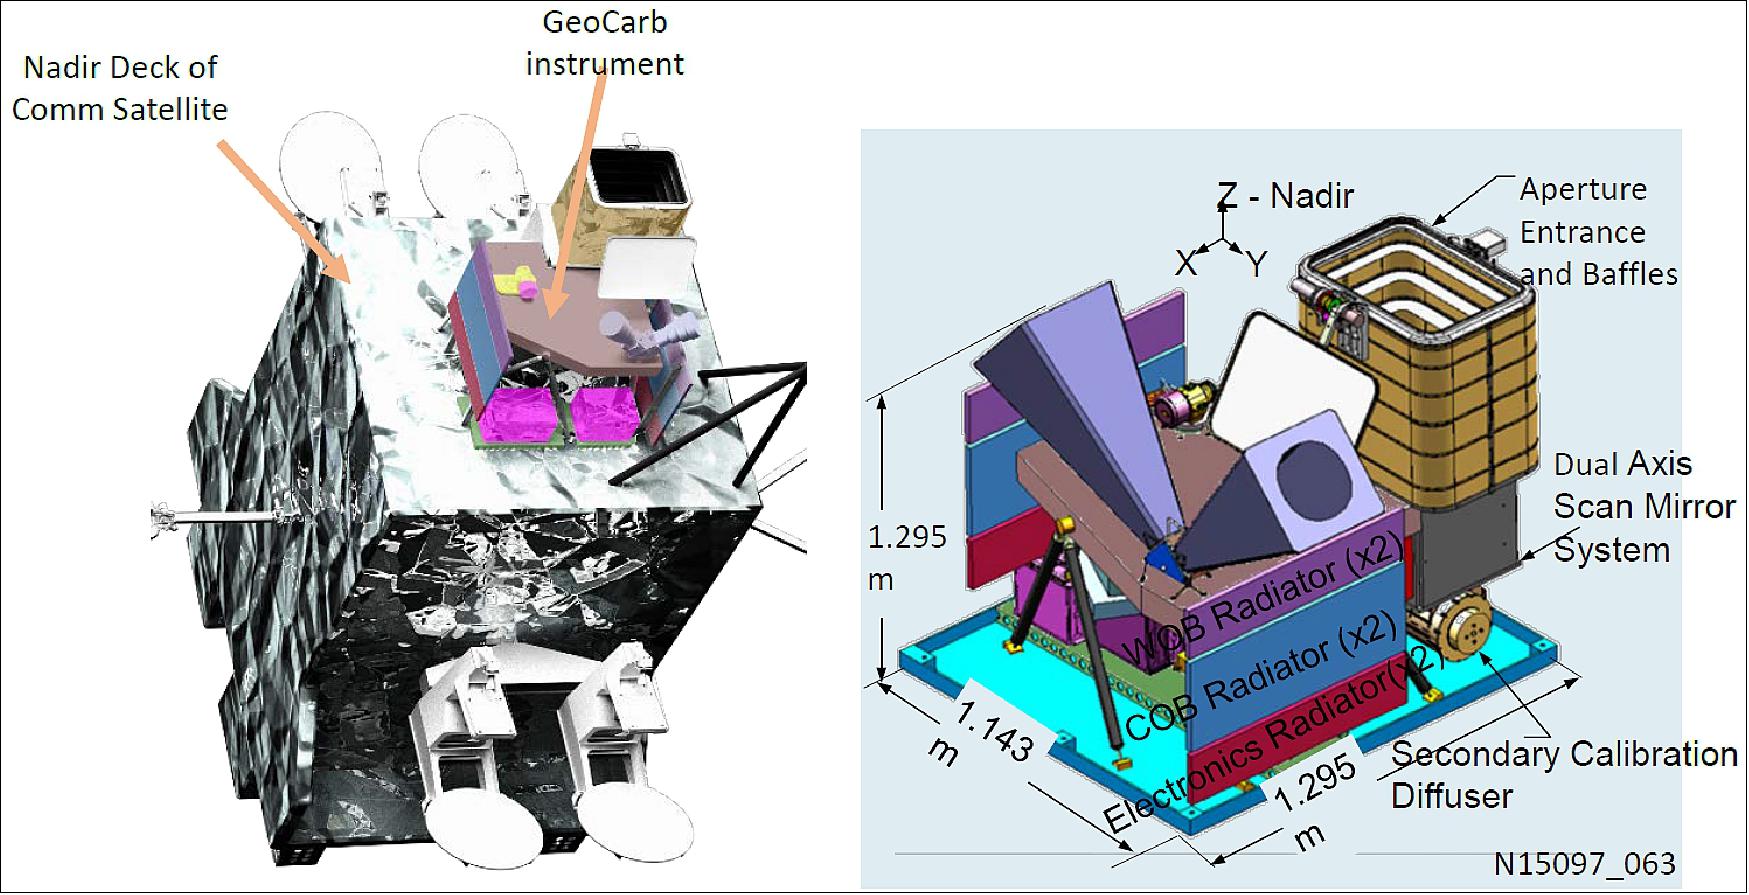
GeoCarb accommodation: The instrument was goin to be accommodated on the nadir deck of the SES-GS selected communications S/C. The GeoCarb team worked with SES-GS to validate the GeoCarb assumptions for accommodation by performing a study where GeoCarb was accommodated on a representative communications spacecraft.
The instrument was designed to be flexible and needed minor changes to interfaces for easy accommodation on the spacecraft. The instrument configuration ensured the visible and thermal Field of View meet the requirements of the instrument.
Due to the 10-to-15-year life requirement for a communications S/C and the end-of-life power requirements for the solar arrays and power subsystem, there was an excess of power available during the three years required for the GeoCarb project that far exceed worst-case estimates for the payload. No special pointing of the S/C was required due to the flexible pointing capabilities of the instrument.
An SES Government Solutions commercial satellite has provided economical access to geostationary orbit above 85° West longitude. GeoCarb benefitted from existing infrastructure for command and control, and mission data delivery. The communications satellite could easily accommodate the mass, data downlink rate and power requirements of the GeoCarb instrument payload.
Mission Status
• November 28, 2022: NASA cancelled the GeoCARB mission. This was due to technical concerns, cost performance, and availability of new alternative data sources, as well as to keep the Earth Science portfolio aligned with overall science priorities. NASA collaborated with the principal investigator team at the University of Oklahoma and planned an orderly close out of the project. 15)
• February 16, 2022: An Earth science instrument selected by NASA several years ago to fly as a hosted payload on a commercial communications satellite may instead fly on a standalone spacecraft because of a lack of hosting opportunities. 4)
- NASA issued a solicitation Feb. 9 seeking information for what it called the GeoCarb Access to Space project. NASA is looking for information on prospective providers of spacecraft that could host the GeoCarb instrument for a launch that NASA would provide by the end of 2024.
- NASA selected GeoCarb in 2016 as part of its Earth Venture line of missions and instruments. GeoCarb will monitor greenhouse gases as well as plant health and vegetation stress in North and South America from approximately 85 degrees west in geostationary orbit.
- The agency's original plan was to fly GeoCarb as a hosted payload on a commercial communications satellite in GEO. For a time, NASA had an agreement with SES Government Solutions to host GeoCarb on an SES satellite.
- The draft statement of work included in the solicitation suggested that NASA was no longer planning to fly GeoCarb as a hosted payload. The document refers to a spacecraft that the contractor would provide that can accommodate the instrument and operate it for at least three years in GEO. NASA would provide launch services through its new Venture-Class Acquisition of Dedicated and Rideshare (VADR) launch services contract. For a traditional hosted payload, NASA would not provide launch services, as that would be the responsibility of commercial satellite operator.
- NASA spokesperson Tylar Greene confirmed Feb. 16 that the agency was no longer planning to fly GeoCarb as a hosted payload. "With the goal of launching this important Earth-observing instrument by the end of 2024, market research indicated that there are no apparent options for commercial hosting in this time frame," Greene told SpaceNews. "As a result, NASA is pursuing paths that include procuring a spacecraft and launch for GeoCarb."
- The decision to seek alternative rides to space for GeoCarb reflects the declining fortunes of hosted payloads. NASA and other U.S. government agencies started seriously pursuing hosted payloads more than a decade ago, seeing what at the time was a steady stream of commercial GEO communications satellites that could serve as low-cost platforms for payloads.
- However, there has been a sharp drop in commercial GEO satellite orders in recent years, reducing the available options for hosting a payload like GeoCarb. In addition, GeoCarb needs to be hosted on a satellite in a relatively narrow band in GEO in order to see the Americas, further limiting hosting options.
- At the annual meeting of the American Meteorological Society Jan. 24, Charles Webb, associate director for flight programs in NASA's Earth science division, acknowledged that the agency was having problems finding a host for GeoCarb because of changes in the commercial GEO communications satellite market.
- "As a result, some of the opportunities that we had seen in the time frame that we needed to put GeoCarb in orbit disappeared," Webb said. "The challenge that we're facing is a limited number of opportunities to get to ride along with a commercial payload."
- He added, though, that another NASA Earth science hosted payload, a pollution monitoring sensor called TEMPO, was able to find a commercial satellite, the Intelsat 40e spacecraft being built by Maxar Technologies for launch in January 2023.
• January 25, 2022: NASA continues to face difficulties in sending some of its payloads to orbit as hosted payloads on commercial satellites. 5)
- The space agency is looking for a geostationary commercial satellite to house the GeoCARB (Geostationary Carbon Cycle Observatory), an instrument to measure carbon dioxide, carbon monoxide and methane over North and South America.
- NASA also faces a delay in sending the MAIA (Multi-Angle Imager for Aerosols) to low Earth orbit.
- "Both have had challenges with their hosting partners," Charles Webb, NASA Earth Science Division associate director for flight programs, said Jan. 24 at the American Meteorological Society annual meeting.
- The GeoCARB mission was planned at a time when the market for commercial geostationary satellites was strong. The space agency "anticipated upswing in terms of opportunities to put our payloads on commercial communication satellites," Webb said.
- In recent years, though, the geostationary communications satellite market has been hurt by the emergence of large satellite constellations in low Earth orbit. In addition, the FCC's campaign to clear C-band spectrum for 5G applications prompted some geostationary communications constellation operators to revise satellite purchasing plans.
- "As a result, some of the opportunities that we had seen in the timeframe that we needed to put GeoCARB in orbit disappeared," Webb said. "The challenge that we're facing is a limited number of opportunities to get to ride along with a commercial payload."
- For MAIA, NASA awarded a contract to General Atomics in 2018 for hosting services, including satellite integration and testing. General Atomics Electromagnetic Systems selected Firefly Aerospace to launch MAIA on its Alpha rocket in 2022.
- Late last year, however, Firefly paused 2 Alpha launch preparations while Noosphere Venture Partners, a fund run by Ukrainian-born investor Max Polyakov, prepared to sell its stake in Firefly at the request of the Committee on Foreign Investment in the United States.
- In contrast to GeoCARB and MAIA, the hosted payload process is proceeding well for TEMPO (Tropospheric Emissions: Monitoring Pollution sensor) mission, a sensor built by Ball Aerospace to monitor pollution over North America.
- NASA chose Maxar Technologies to find a host for TEMPO, which is scheduled to travel to orbit in January 2023 on the Intelsat 40e communications satellite.
- "TEMPO is indeed progressing nicely to launch, with excellent support from Maxar," Webb told SpaceNews.
Launch
A launch of the hosted GeoCARBGeoCarb instrument was expected for the end of June 2025 however, on 28 November, 2022, NASA announced that the mission will be cancelled.
The GeoCarb instrument was developed to produce maps of the column averaged dry air mixing ratios of CO2 (XCO2), CH4, (XCH4), CO (XCO) and SIF (Solar Induced chlorophyll Fluorescence) at a spatial resolution of 5-10 km multiple times each day. 6) 7)
NASA now intends to pursue new options to monitor greenhouse gases, following the recent release of new methods and technologies.
Sensor Complement
Lockheed Martin was going to build a space instrument that would have worked to collect data on the planet's vegetation health and carbon cycle as part of the Geostationary Carbon Cycle Observatory mission. 8) 9)
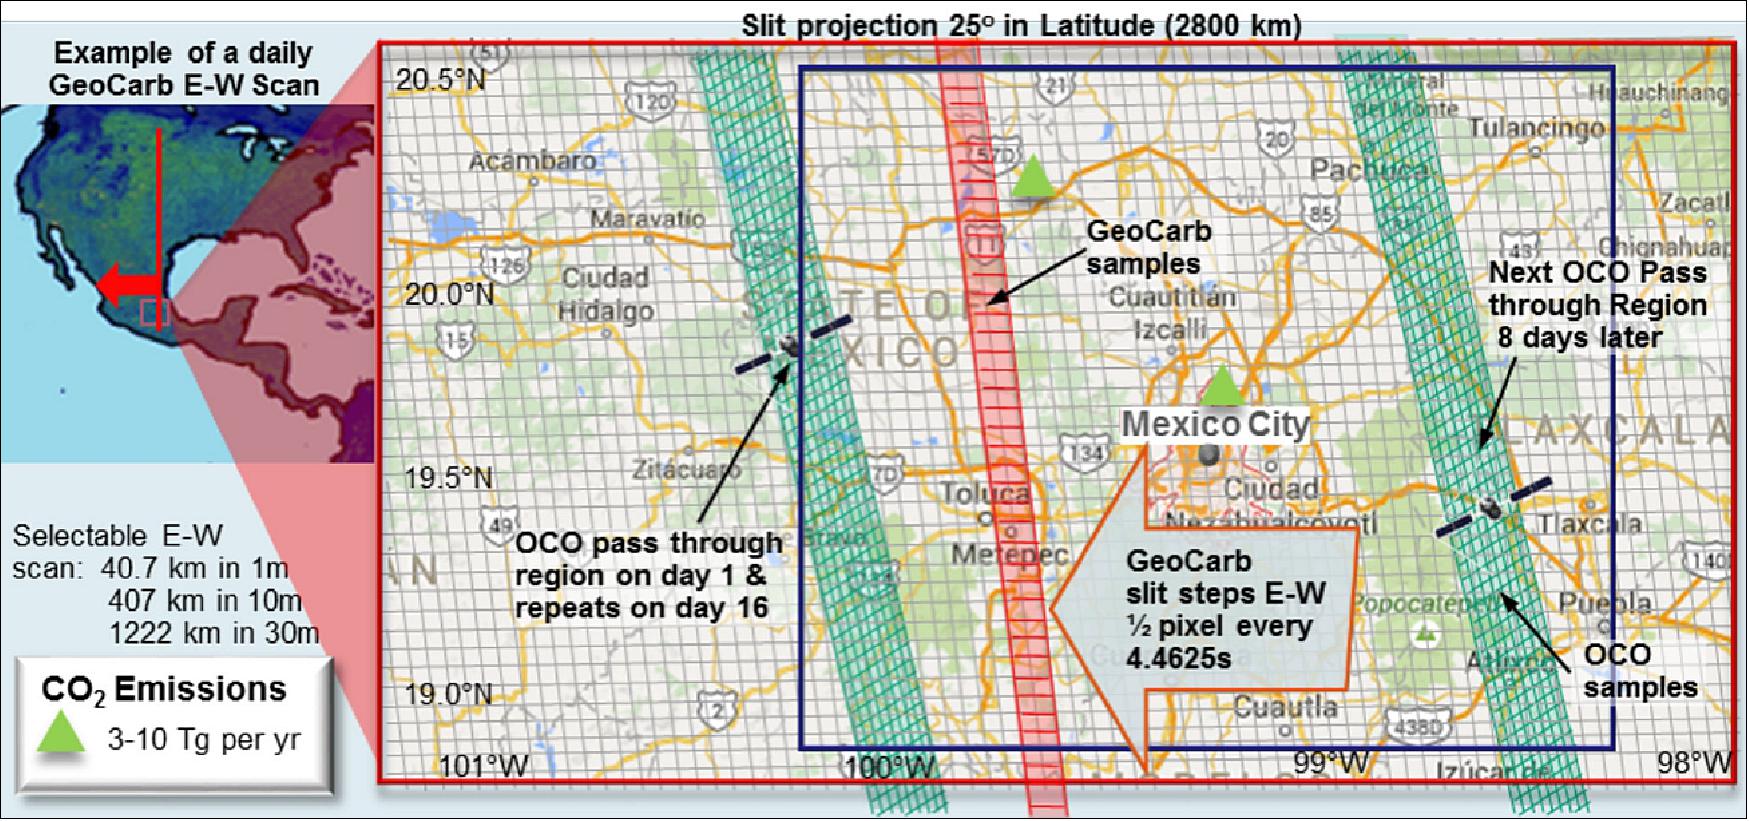
The GeoCarb instrument views reflected light from Earth through a narrow slit. When the slit was projected onto Earth's surface, it was able to see an area measuring about 2,700 km from north to south and about 5.2 km from east to west. In comparison, OCO-2's swath was about 10 km wide. GeoCarb stared at that area for about 4-1/2 seconds, then the slit was moved half a slit width — 3 km — to the west, allowing for double sampling. With this technique, GeoCarb was able to scan the entire continental United States in about 2-1/4 hours, and from Brazil to South America's West Coast in about 2-3/4 hours. It was not designed to observe the oceans, as reflectivity over the oceans was too low to provide useful data. 10) 11) 12)
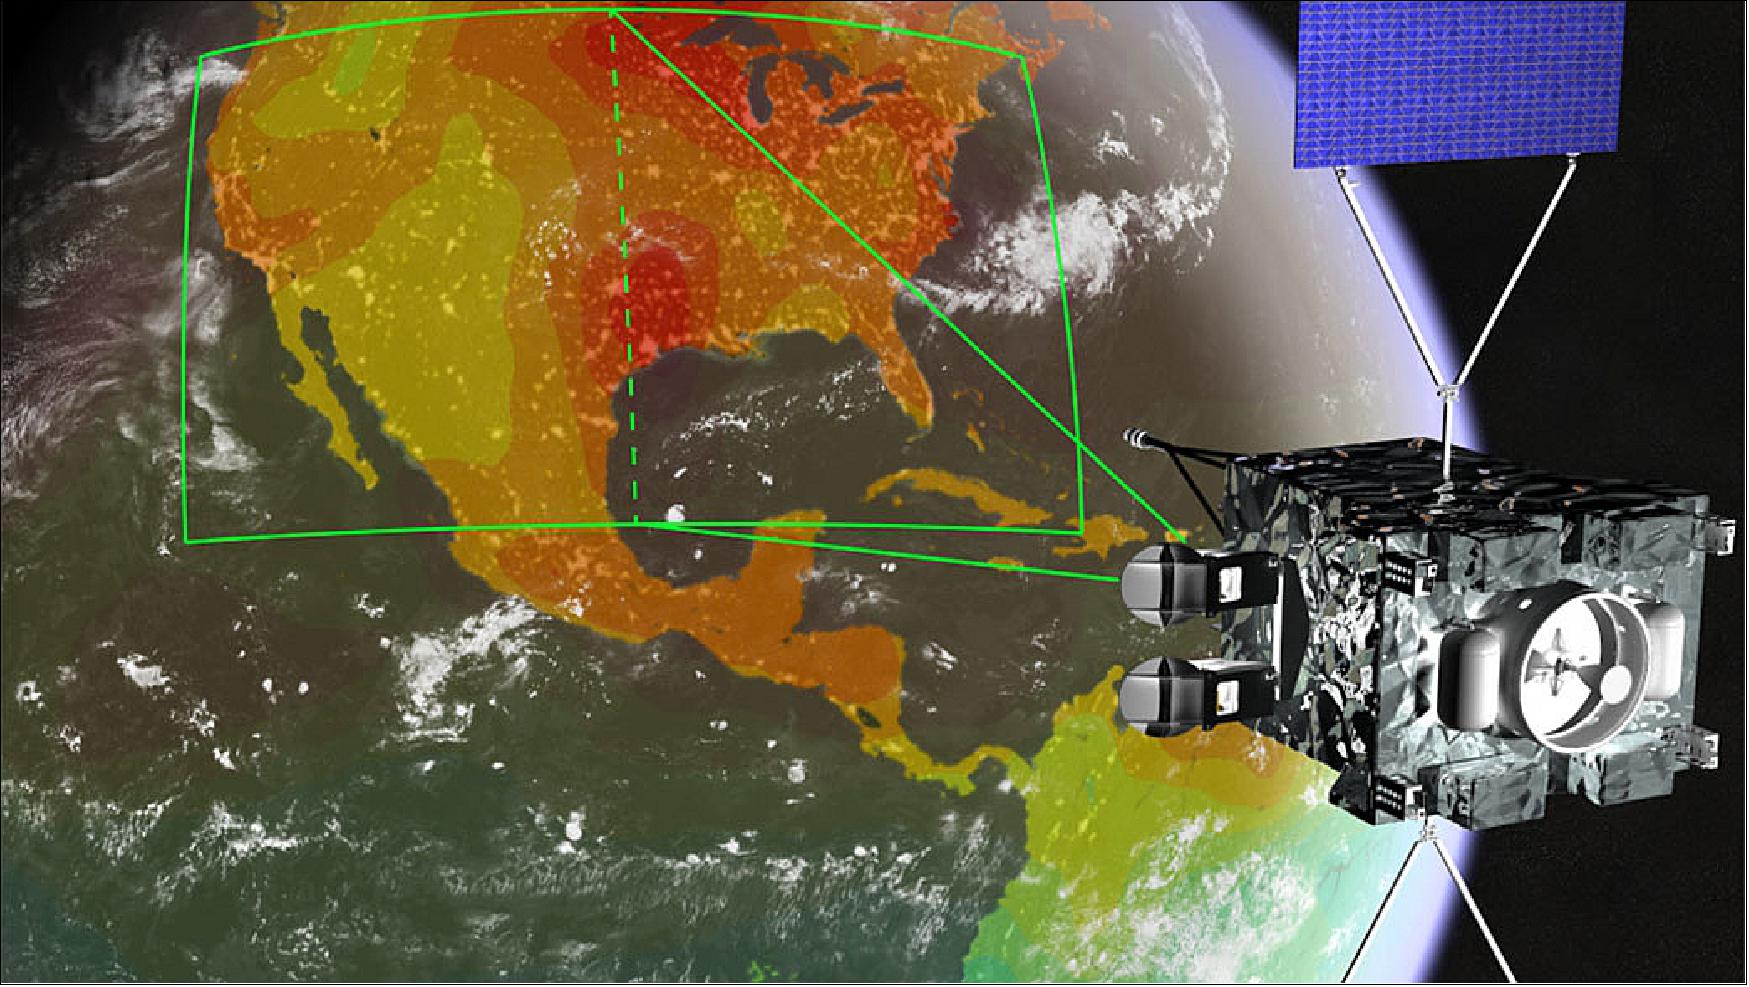
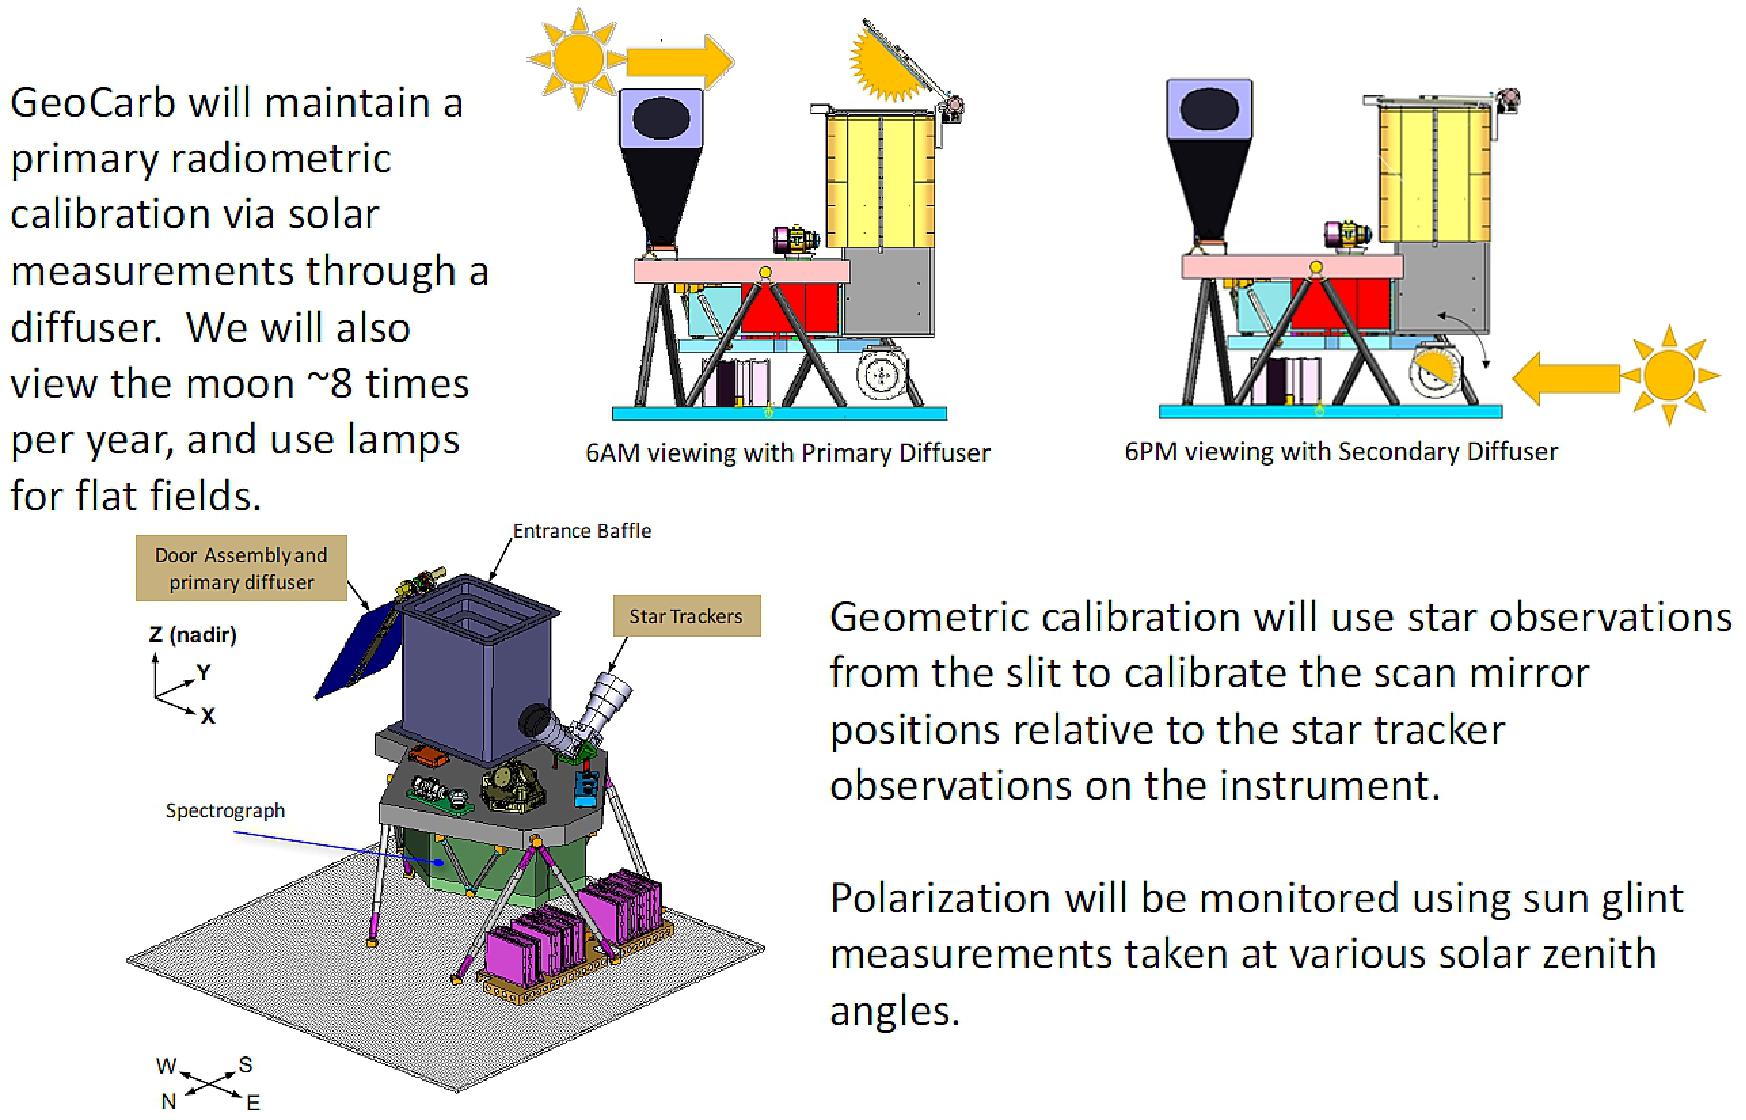
The GeoCarb instrument consisted of the aperture assembly, telescope, spectrometer, and electronics boxes. It was a 4-Infrared channel, single-slit imaging spectrograph optimized to measure carbon dioxide, carbon monoxide and methane, and Solar-Induced Fluorescence (SIF) from geostationary orbit. The fourth channel, measured oxygen dioxide column concentration and, SIF, providing valuable information on aerosol and cloud contamination.
There were two grating spectrometers, four focal plane assemblies cooled to 125 K (degrees Kelvin) and Cold Optical Bench cooled to ~190 K . Cooling by Northrup Grumman thermal-mechanical unit. 13)
Instrument | Single slit, 4-Channel IR Scanning Littrow Spectrometer |
Bands | 0.76 µm, 1.61 µm, 2.06 µm and 2.32 µm |
Instrument mass | 138 kg, CBE (Current Best Estimate) |
Instrument size | 1.3 m x 1.14 m x 1.3 m |
Power | 128 W (CBE) |
Data rate | 10 Mbit/s |
Daily soundings | ~10,000,000 soundings per day, CONUS > once per day |
Instrument Design and Trace Gas Retrievals
The GeoCarb instrument was goin to be hosted on a SES Government Solutions satellite in GEO orbit at 85º (±15º) West longitude, and it would have launched in 2022. The ~85º W slot allowed observations of major urban and industrial regions, large agricultural areas, and the expansive South American tropical forests and wetlands, which would have helped to resolve climate-critical flux variability for CO2 and CH4. GeoCarb deployed, as noted, a 4-channel slit imaging spectrometer that measured reflected near-IR sunlight at wavelengths 1.61 and 2.06 µm for column integrated CO2 dry air mixing ratio (XCO2), and 2.32 µm for XCH4 and XCO. The fourth channel, 0.76µm, measured total column O2, which allowed determination of mixing ratios. The 0.76 µm channel also allowed measurement of SIF and provided valuable information on aerosol and cloud contamination. It is worth noting that the O2 and CO2 channels were similar to those used for the OCO-2 mission and that the O2 spectral band was identical to that of OCO-2. 14)
The retrieval of SIF (Solar-Induced Fluorescence), XCO2, XCH4, and XCO was accomplished through the use of an optimal estimation technique that draws upon the heritage of the Atmospheric Carbon Observing System (ACOS) algorithm developed initially for OCO and GOSAT, and with numerous refinements updates for OCO-2. In brief, a first guess of each gas profile as well as other atmospheric parameters were propagated through a radiative transfer model to produce a simulated spectra, which was compared against the measured spectra in each band. The difference between the simulated and measured spectra was propagated back into updated gas concentrations and atmospheric parameters, and the process was repeated until the algorithm converged. SIF was produced separately by a different algorithm, called the Iterative Maximum a Posteriori Differential Optical Absorption Spectroscopy algorithm, which was also used to screen clouds. GeoCarb would have employed the OCO-2 algorithm, modified to include the longest wavelength band, in which OCO-2 did not take spectra.
The instrument scan slit design allowed for a large North-South (N-S) extent with high spatial resolution along the scan. The on-board N-S extent of the scan was fixed at a 4.4º view angle, which corresponded to 25º in latitude or 2,800 km at nadir on the Earth's surface. Each scan was composed of 1016 N-S samples spaced 2.7 km apart on center and collected with 3 km East-West (E-W) double sampling. Scans involved a 4.08 s integration time, followed by a 0.3825 s E-W step. This instrument configuration allowed GeoCarb to scan the conterminous United States (CONUS) in <2.5 h. The scan patterns were flexible; scan blocks could have been changed, and the scan strategy could have been updated to observe areas of greater interest or uncertainty, for calibration and validation, or for transient events in a campaign mode. Figure 7 shows a sample coverage map for the Mexico City area for both OCO-2 and GeoCarb. By sweeping the slit from East to West, GeoCarb provided continental-scale "mapping-like" coverage, producing daily maps of XCO2, XCH4, XCO, and SIF over regions of interest, which enabled CO2 and CH4 flux estimation and attribution at unprecedented temporal and spatial scales.
Science Hypotheses
The ~85º W slot enabled, as mentioned, observations of most major urban and industrial regions in the Americas, large agricultural areas, and the expansive South American tropical forests and wetlands. Each of these regions plays a key role in the global carbon cycle, and thus GeoCarb observations would have helped to provide a climate-critical insight into the Carbon-Climate connection as well as monitoring large "point" sources (e.g., cities) of all three gases, and helped to disaggregate anthropogenic and biogenic emissions using all three gases in tandem.
Several Observing Systems Simulation Experiments (OSSEs) were performed in order (a) to determine useful measurement requirements that are technically feasible and (b) to examine the potential for significant scientific advances that would have been made possible with observations from GeoCarb. These OSSEs were designed with a set of hypotheses in mind, though there are numerous other important questions that could have been addressed.
References
1) "NASA Announces First Geostationary Vegetation, Atmospheric Carbon Mission," NASA Release 16-115, Dec. 6, 2016, URL: https://www.nasa.gov/press-release/
nasa-announces-first-geostationary-vegetation-atmospheric-carbon-mission
2) Berrien Moore III, Sean Crowell, "NASA Satellite Will Watch Earth Breathe from Space," The Conversation, " 12 April 2017, URL: https://theconversation.com/
watching-the-planet-breathe-studying-earths-carbon-cycle-from-space-72344
3) "Geostationary Carbon Cycle Observatory," The University of Oklahoma, 2019, URL: http://www.ou.edu/geocarb/payload/spacecraft
4) Jeff Foust, "NASA drops plans to fly Earth science instrument as commercial hosted payload," SpaceNews, 16 February 2022, URL: https://spacenews.com/nasa-drops-plans-to-fly-earth-science-instrument-as-commercial-hosted-payload/
5) Debra Werner, "NASA hosted payloads waiting for rides to orbit," SpaceNews, 25 January 2022, URL: https://spacenews.com/nasa-needs-payload-hosts/
6) David Crisp for Berrien Moore and Sean Crowell, "GeoCarb Status and Plans," CEOS, June 28, 2017, URL: http://ceos.org/document_management/Virtual_Constellations/ACC/
Meetings/AC-VC-13/ACVC13_presentations_pdf/Day%201%20GHG
/7_CEOS-AC-VC-13_GHG_GeoCarb_Dave_Crisp.pdf
7) Berrien Moore III and Sean Crowell with Stephan R. Kawa, John B. Kumer, Denis M. O'Brien, Chris O'Dell, Igor N. Polonsky, Peter J. Rayner, "The GeoCARB Mission," 9 June 2016, URL: http://www.nies.go.jp/soc/events/iwggms12/pdf/Session_11/52_Berrien_Moore.pdf
8) "Lockheed Martin Will Build New Space Instrument Focused on Vegetation Health and Carbon Monitoring," Lockheed Martin, Aug. 8, 2017, URL: http://news.lockheedmartin.com/
20170808Lockheed-Martin-Will-Build-New-Space-Instrument-Focused-on-Vegetation-Health-and-Carbon-
Monitoring
9) Berrien Moore, Sean Crowell, Eric Burgh, Chris O'Dell, Greg McGarragh, Susan Kulawik, Cathy Chou, Brett Allard, Steve Merrihew, Dean Read, Shelly Finley, David Crisp, Annmarie Eldering, James Lemen, David Schimel, and many others, "The GeoCarb Mission, Measuring Carbon Trace Gases abd Vegetation Health from Space," 14th International Workshop on Greenhouse Gas Measurements from Space (IWGGMS-14), 8-10 May 2018, URL: https://iwggms14.physics.utoronto.ca/documents/124/6.8_Berrien_Moore_mac.pdf
10) "GeoCarb: A New View of Carbon Over the Americas," NASA/JPL, 11 Jan. 2018, URL: https://www.jpl.nasa.gov/news/news.php?release=2018-008
11) Debra Werner, Sandra Erwin, "NASA's new carbon-monitoring instruments promise first-class science at steerage-class prices," Space News, 22 Feb. 2018, URL: http://spacenews.com/
nasas-new-carbon-monitoring-instruments-promise-first-class-science-at-steerage-class-prices/
12) Jeffrey Nivitanont, Sean M. R. Crowell, and Berrien Moore III, "A scanning strategy optimized for signal-to-noise ratio for the Geostationary Carbon Cycle Observatory (GeoCarb) instrument," Atmospheric Measurement Techniques, Volume 12, pp: 3317–3334, Published: 21 June 2019, https://doi.org/10.5194/amt-12-3317-2019 , URL: https://www.atmos-meas-tech.net
/12/3317/2019/amt-12-3317-2019.pdf
13) D. Durand, T. Nguyen, E. Tward, "High Efficiency Cryocooler Performance, "Northrop Grumman, " URL: https://www.northropgrumman.com/Capabilities/HighEfficiencyCryocoolers
/Documents/pageDocs/HighEfficiencyCryocoolerPerformanceICC18.pdf
14) Berrien Moore III, Sean M. R. Crowell, Peter J. Rayner, Jack Kumer, Christopher W. O'Dell, Denis O'Brien, Steven Utembe, Igor Polonsky, David Schimel and James Lemen, "The Potential of the Geostationary Carbon Cycle Observatory (GeoCarb) to Provide Multi-scale Constraints on the Carbon Cycle in the Americas," Frontiers in Environmental Science, Volume 6, Article 109, 17 October 2018, URL: https://tinyurl.com/y53uhl67
15) "NASA to Cancel GeoCARB Mission, Expands Greenhouse Gas Portfolio" NASA Release 22-119, Nov. 29, 2022, URL: https://www.nasa.gov/press-release/nasa-to-cancel-geocarb-mission-expands-greenhouse-gas-portfolio
The information compiled and edited in this article was provided by Herbert J. Kramer from his documentation of: "Observation of the Earth and Its Environment: Survey of Missions and Sensors" (Springer Verlag) as well as many other sources after the publication of the 4th edition in 2002. - Comments and corrections to this article are always welcome for further updates (eoportal@symbios.space).
Host Spacecraft Mission Status Launch GeoCarb Instrument References Back to top